
 Open Access Article
 This Open Access Article is licensed under a Creative Commons Attribution-Non Commercial 3.0 Unported Licence
Lipid bilayer thickness determines cholesterol's location in model membranes†
Drew
Marquardt
ab,
Frederick A.
Heberle
cde,
Denise V.
Greathouse
f,
Roger E.
Koeppe
II
f,
Robert F.
Standaert
gh,
Brad J.
Van Oosten
a,
Thad A.
Harroun
a,
Jacob J.
Kinnun
i,
Justin A.
Williams
i,
Stephen R.
Wassall
*i and
John
Katsaras
*acejk
aDepartment of Physics, Brock University, St. Catharines, Ontario L2S 3A1, Canada
bInstitute of Molecular Biosciences, University of Graz, Graz, Austria
cThe Bredesen Center for Interdisciplinary Research and Graduate Education, University of Tennessee, Knoxville, Tennessee 37996, USA
dJoint Institute for Biological Sciences, Oak Ridge National Laboratory, Oak Ridge, Tennessee 37831, USA
eBiology and Soft Matter Division, Oak Ridge National Laboratory, Oak Ridge, Tennessee 37831, USA. E-mail: katsarasj@ornl.gov
fDepartment of Chemistry and Biochemistry, University of Arkansas, Fayetteville, Arkansas 72701, USA
gBiosciences Division, Oak Ridge National Laboratory, Oak Ridge, Tennessee 37831, USA
hDepartment of Biochemistry and Cellular & Molecular Biology, University of Tennessee, Knoxville, TN 37996, USA
iDepartment of Physics, Indiana University – Purdue University Indianapolis, Indianapolis, Indiana 46202, USA. E-mail: swassall@iupui.edu
jShull Wollan Center—a Joint Institute for Neutron Sciences, Oak Ridge National Laboratory, Oak Ridge, Tennessee 37831, USA
kDepartment of Physics and Astronomy, University of Tennessee, Knoxville, Tennessee 37996, USA
First published on 11th October 2016
Abstract
Cholesterol is an essential biomolecule of animal cell membranes, and an important precursor for the biosynthesis of certain hormones and vitamins. It is also thought to play a key role in cell signaling processes associated with functional plasma membrane microdomains (domains enriched in cholesterol), commonly referred to as rafts. In all of these diverse biological phenomena, the transverse location of cholesterol in the membrane is almost certainly an important structural feature. Using a combination of neutron scattering and solid-state 2H NMR, we have determined the location and orientation of cholesterol in phosphatidylcholine (PC) model membranes having fatty acids of different lengths and degrees of unsaturation. The data establish that cholesterol reorients rapidly about the bilayer normal in all the membranes studied, but is tilted and forced to span the bilayer midplane in the very thin bilayers. The possibility that cholesterol lies flat in the middle of bilayers, including those made from PC lipids containing polyunsaturated fatty acids (PUFAs), is ruled out. These results support the notion that hydrophobic thickness is the primary determinant of cholesterol's location in membranes.
Introduction
The structural properties of a lipid bilayer have a profound effect on the membrane's physical properties and biological functions, including membrane permeability and interactions with guest biomolecules. For example, the coupling between a protein's transmembrane hydrophobic domains and the bilayer's hydrocarbon region can alter the energetics of the protein's different conformations, as well as where a protein locates in a membrane.1 Bilayer thickness and acyl chain order (fluidity) are critical parameters in this regard. More precisely, for a given lipid head group the thickness of a liquid-disordered bilayer is determined by the number of carbons and double bonds in its acyl chains.2,3 For example, fully hydrated fluid bilayers of 1,2-dilauroylphosphatidylcholine (DLPC; di12:0 PC), 1,2-dimyristoylphosphatidycholine (DMPC; di14:0 PC) and 1,2-dipalmitoylphosphatidylcholine (DPPC, di16:0 PC)—with 12, 14 and 16 carbons in their acyl chains, respectively—exhibit an increasing hydrophobic thickness (DHH = 29.6 Å, 32.2 Å, and 38.6 Å at 50 °C, respectively).3 In contrast to these saturated phospholipids, the hydrophobic thickness of 1,2-dioleoylphosphatidylcholine (DOPC; di18:1 PC), whose acyl chains each contain 18 carbons and a single double bond (36.7 Å at 30 °C), is less than that of 16-carbon DPPC.2The presence of multiple double bonds within each acyl chain results in even more dramatic thinning of the bilayer. For example, 1,2-diarachidonoylphosphatidylcholine (DAPC; di20:4 PC), comprised of two polyunsaturated arachidonic acid chains with 20 carbons and 4 double bonds each, has a bilayer thickness (31.9 Å at 30 °C, unpublished) that is comparable to DLPC (29.8 Å at 30 °C), even though it has eight more carbons in each acyl chain.3 Indeed, with increasing levels of unsaturation there is a clear trend towards greater acyl chain conformational disorder—and concomitantly greater cross-sectional lipid area—that becomes most pronounced in lipids with polyunsaturated fatty acids (PUFAs).4 The increased disorder stems from the low energy barrier for rotation about the C–C single bonds located next to C![[double bond, length as m-dash]](https://www.rsc.org/images/entities/char_e001.gif) C double bonds, such that PUFA chains explore their entire conformational space on a sub-microsecond timescale.5
C double bonds, such that PUFA chains explore their entire conformational space on a sub-microsecond timescale.5
The lateral segregation of PUFA-containing lipids into cholesterol-depleted membrane domains has been hypothesized to play an important role in neurological function and other health related issues.6 Central to this hypothesis is the strong aversion that disordered PUFA chains have for the rigid steroid moiety of cholesterol—exemplified by a solubility of just 15 mol% for cholesterol in DAPC,7 compared to 66 mol% in saturated and monounsaturated phosphatidylcholine (PC) lipids.8 Neutron diffraction studies of deuterated cholesterol incorporated into DAPC bilayers revealed that cholesterol was sequestered at the bilayer mid-plane.9,10 This result was in contrast to the canonical upright orientation of the molecule, where its C3-hydroxyl group is located near the lipid/water interface, and its C20–26 chain—at the opposite end of the tetracyclic steroid nucleus—extends towards the bilayer center.11 It was subsequently reported that doping DAPC bilayers with DMPC or 1-palmitoyl-2-oleoyl-phosphatidylcholine (POPC), caused the sterol to return to its nominal upright orientation. Interestingly, only 5 mol% of DMPC was needed to induce cholesterol's reorganization.12,13
The effect of membrane thickness on the orientation and conformation of proteins (especially of transmembrane peptides) is well recognized.1,14,15 However, the role of hydrophobic mismatch in determining the disposition of other membrane-resident molecules has received little attention. While the molecular organization of cholesterol in DPPC and DOPC bilayers has been interrogated, studies of cholesterol in thinner membranes, such as DLPC are not as common.16 Moreover, studies of cholesterol in membranes composed of polyunsaturated lipids have focused on mixed chain (saturated–polyunsaturated) phospholipids17 that are thicker than their di-polyunsaturated counterparts.16 While mixed chain phospholipids with a saturated chain at the sn-1 position predominate in most cell membranes (for instance in erythrocytes18), di-polyunsaturated lipids are prevalent in neural membranes such as the retina.19
Here we address the influence of hydrocarbon thickness on cholesterol's location in different bilayers using a combination of neutron scattering and solid state 2H NMR—supplemented by MD simulations. We determined cholesterol's depth and orientation in liquid-disordered bilayers composed of lipids with vastly different degrees of unsaturation: i.e., saturated DMPC and DLPC, and polyunsaturated DAPC and 1,2-didocosahexaenoyl PC (DDPC; di22:6 PC) (Fig. 1). In DLPC, DAPC and DDPC bilayers, cholesterol spans the bilayer mid-plane with its long molecular axis acutely tilted relative to the bilayer normal. This arrangement is in contrast to DMPC bilayers, where cholesterol sits in its canonical upright position with its hydroxyl group near the lipid–water interface. Importantly, however, is that cholesterol's location is primarily dictated by bilayer thickness, and not hydrocarbon chain disorder. This is borne-out by the fact that although DLPC bilayers have a comparable thickness to DAPC and DDPC bilayers, their acyl chains are more ordered.
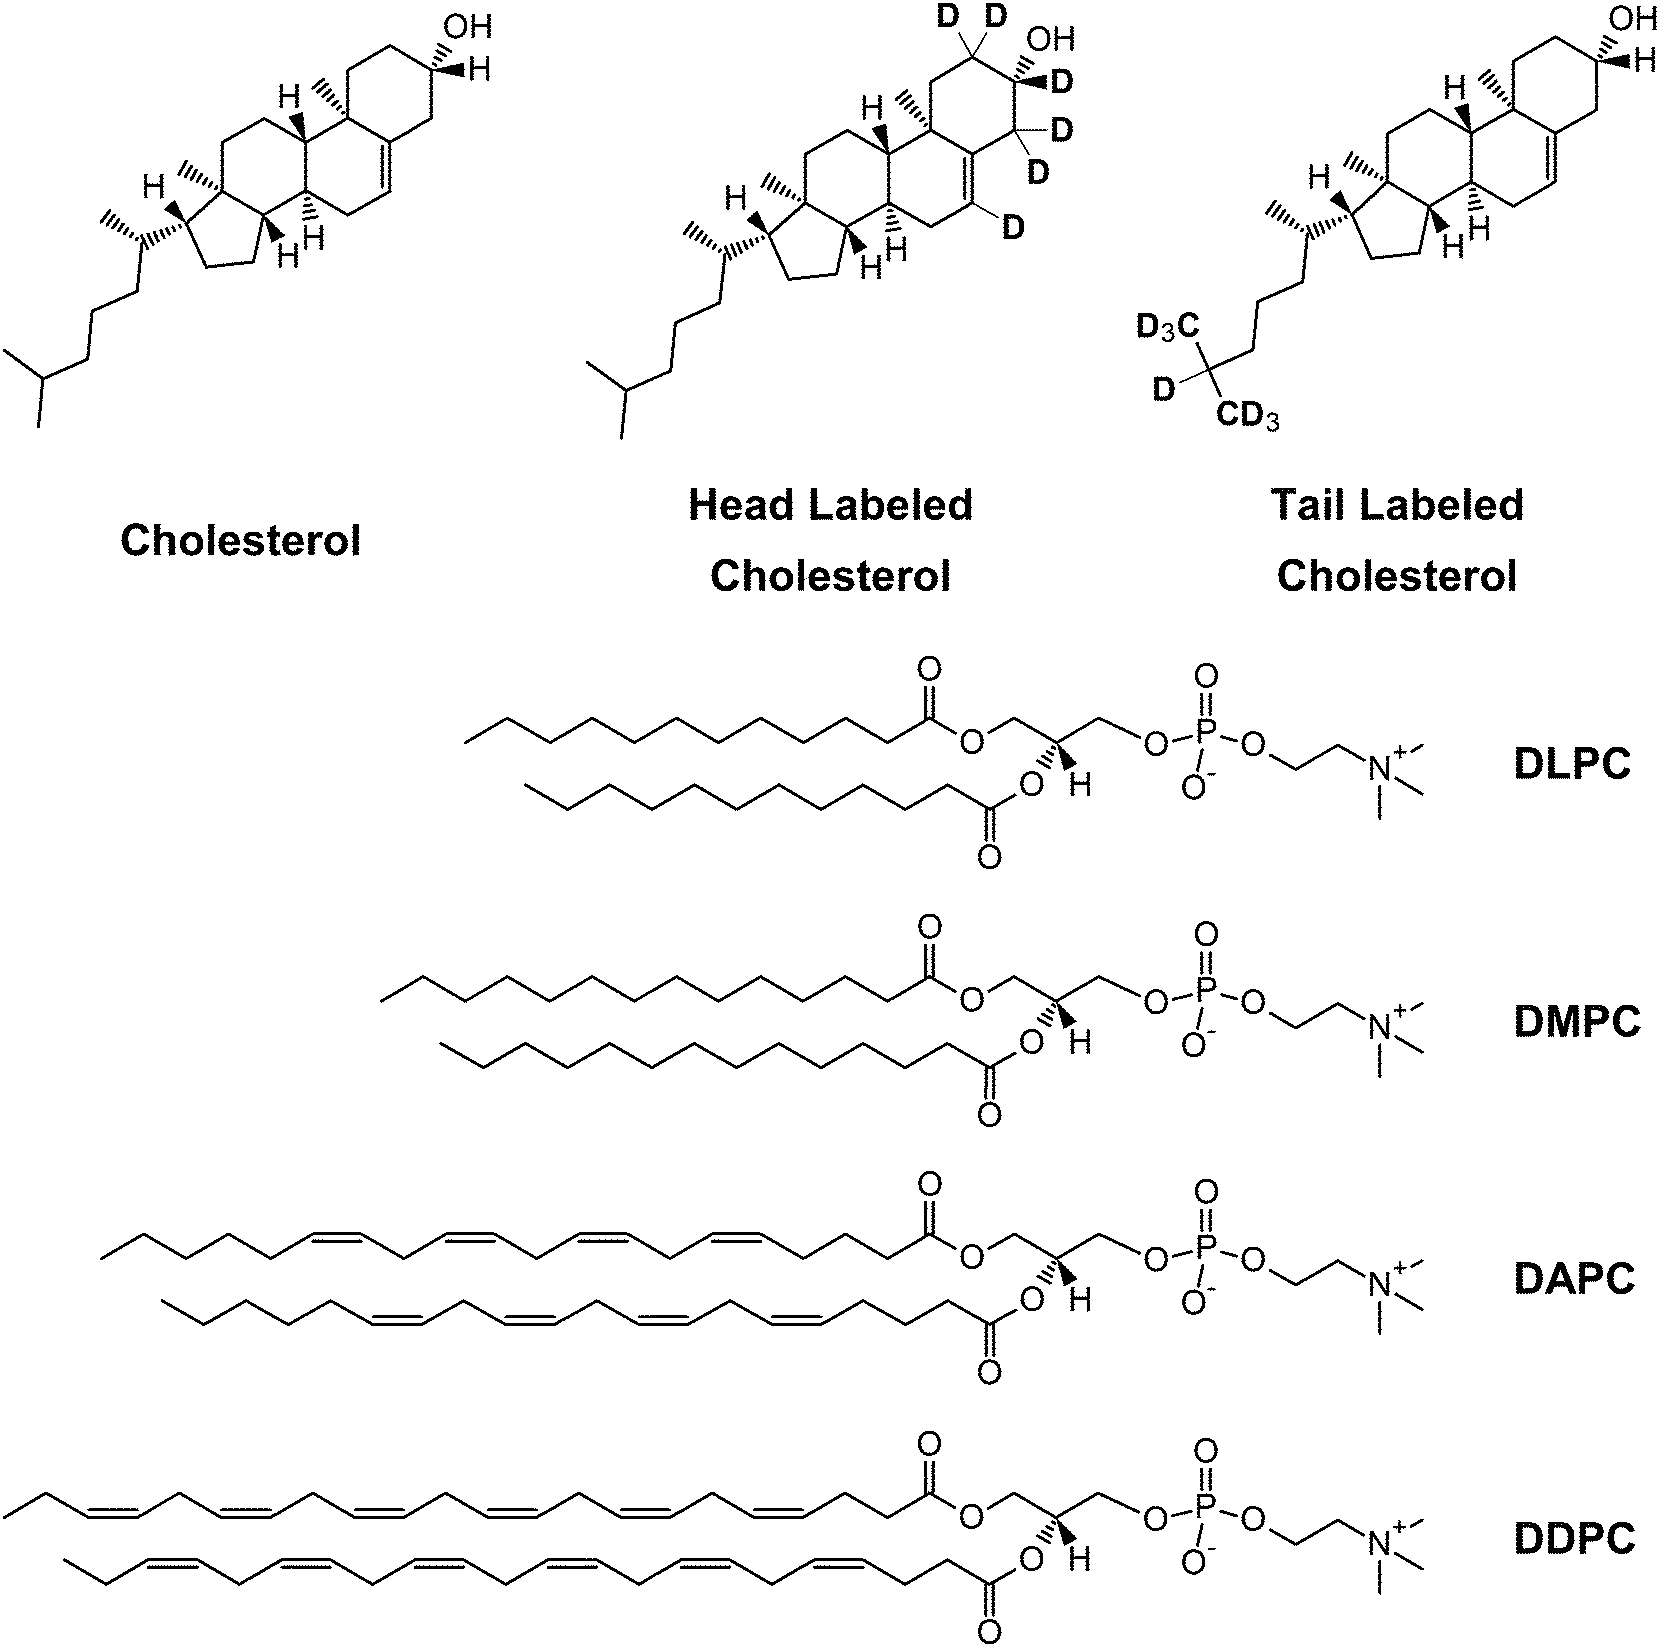 | ||
| Fig. 1 Chemical structures of cholesterol and the different phospholipids studied. | ||
Results and discussion
Cholesterol resides at the center of DLPC, DAPC and DDPC bilayers
The one-dimensional NSLD profiles of PC bilayers with cholesterol were determined using data from oriented multi-bilayer stacks adsorbed to the surfaces of single-crystal Si substrates. The NSLD profile is a real space representation of bilayer structure, corresponding to the atomic distribution of lipid and associated water projected onto the bilayer normal. Fig. 2 shows NSLD profiles (black curves) of DLPC, DMPC, DAPC and DDPC bilayers with 10 mol% perdeuterated cholesterol, hydrated from water vapor using an 8% D2O water solution. The maxima are primarily due to the fatty acyl carbonyl groups, such that the distance between these peaks provides a measure of the bilayer hydrophobic thickness DHH.3 The dip in the NSLD profile at the bilayer center is the result of the disordered terminal methyl groups. Compared to DMPC bilayers, this dip is less pronounced in DAPC, DDPC and DLPC bilayers.
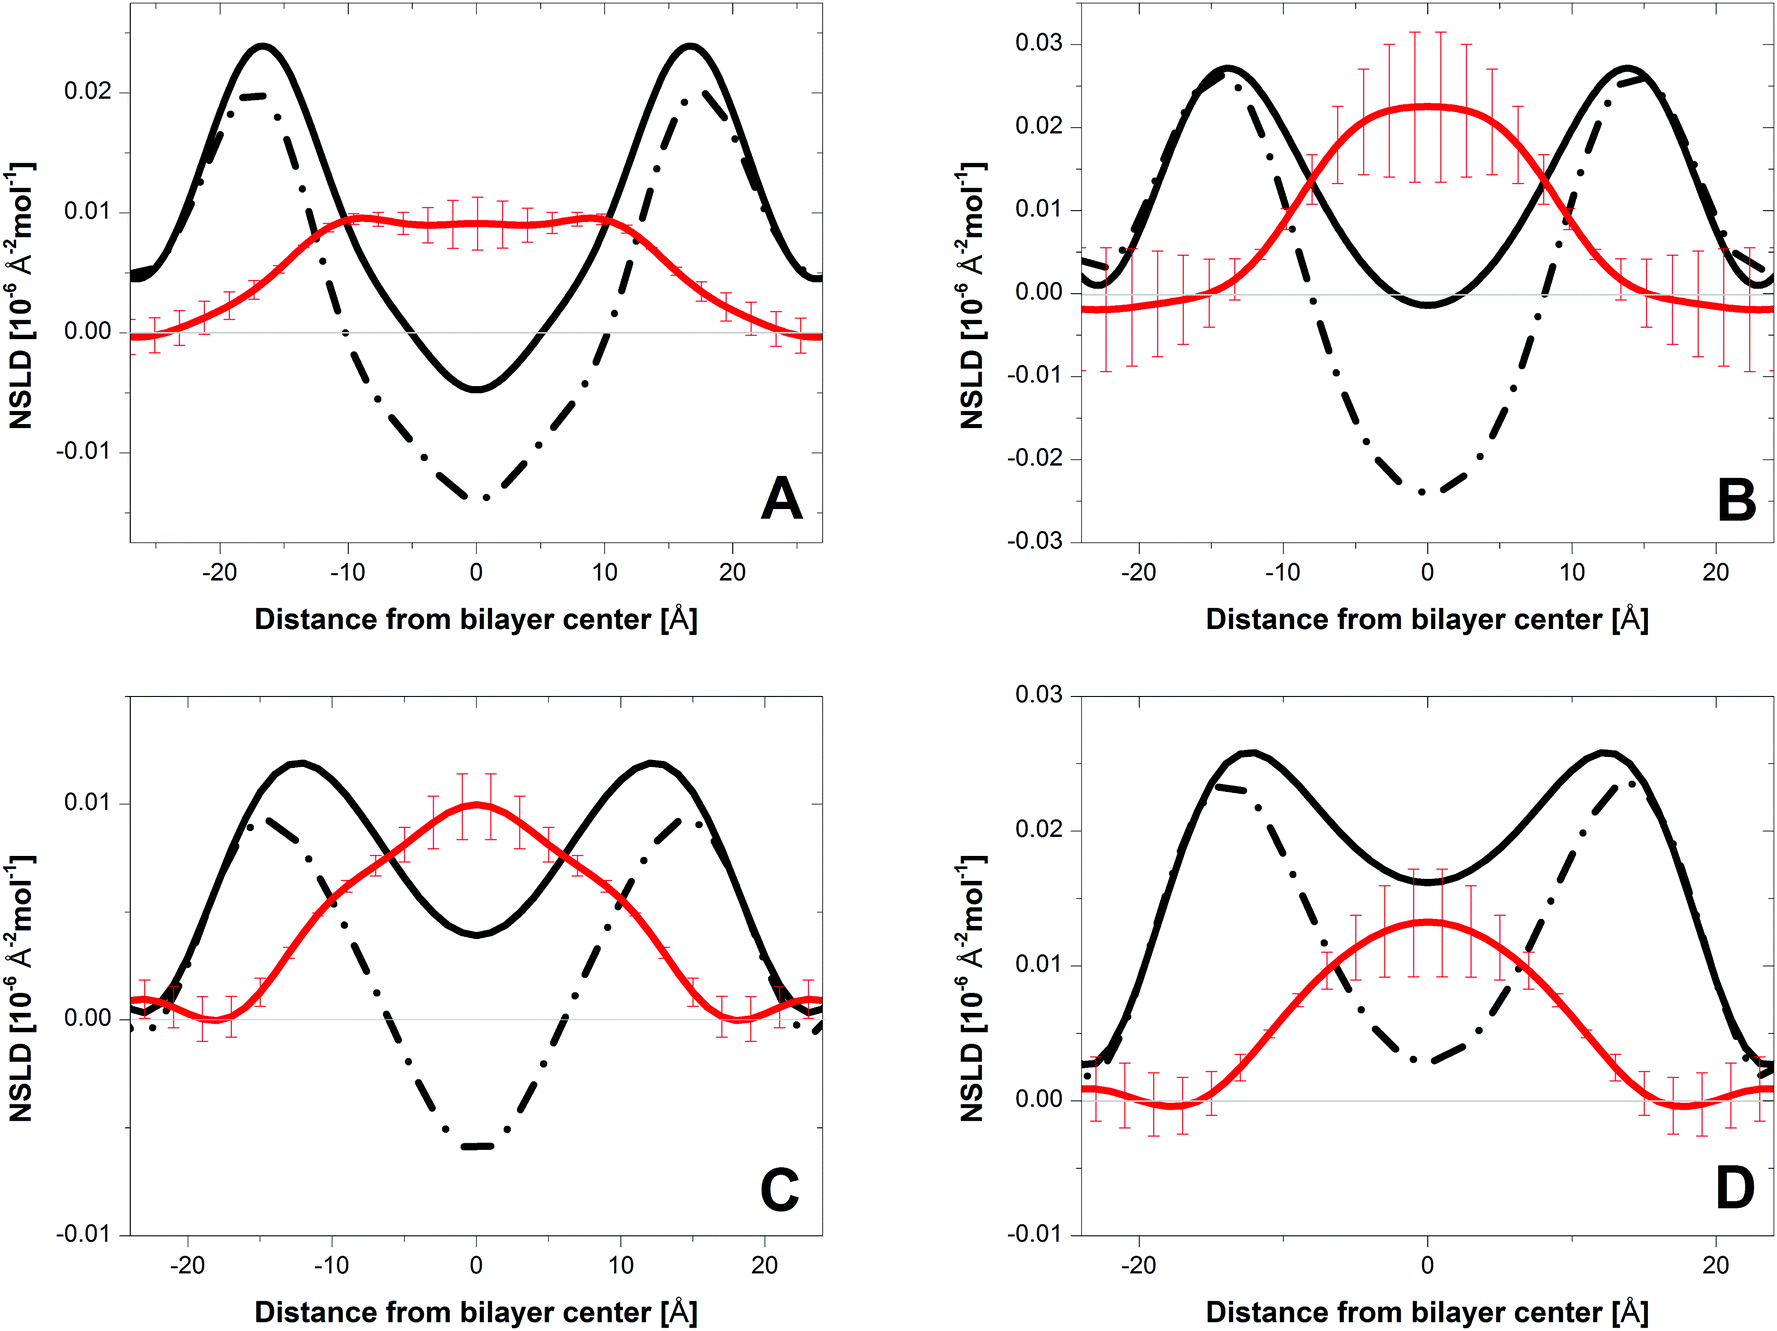 | ||
| Fig. 2 NSLD profiles for bilayers of DMPC (A), DLPC (B), DAPC (C) and DDPC (D) containing 10 mol% cholesterol and hydrated to 93% RH from water vapor with 8% 2H2O. The solid and dashed lines represent the NSLD profiles of bilayers with perdeuterated and protiated cholesterol, respectively. The red lines are the difference profiles corresponding to the mass distribution of the perdeuterated cholesterol. | ||
Fig. 2 shows difference profiles (red curves) obtained by subtracting NSLD profiles of bilayers containing protiated cholesterol (dashed line) from those with perdeuterated cholesterol (black line). The difference profile shows the distribution of cholesterol deuterons across the bilayer. Bilayer structural parameters and cholesterol distributions for the different membranes are summarized in Table 1. For DMPC bilayers (Fig. 2A, red curve), there is a flat region of essentially constant NSLD that drops to zero at the lipid–water interface, a result consistent with cholesterol's upright orientation. In this orientation, cholesterol's hydroxyl group sits near the lipid–water interface, while its side chain at the opposite end of the steroid moiety extends towards the middle of the bilayer11 and possibly, as indicated by neutron scattering work on DPPC, crosses the midplane during high frequency fluctuations.20 The difference profile of DAPC bilayers, by contrast, is peaked at the bilayer center (Fig. 2C, red curve). We attribute this NSLD distribution to cholesterol residing deep in the bilayer's central region, a result which agrees with the location for the headgroup- and tail-labeled cholesterol reported in our earlier work.9,10 A similar distribution for perdeuterated cholesterol is seen in DDPC (Fig. 2B) and DLPC (Fig. 2D) bilayers. It is therefore apparent that, as in DAPC bilayers, cholesterol is buried in the interior of DDPC and DLPC bilayers. These three bilayers, in which cholesterol is sequestered at the bilayer center, share a common feature: their hydrophobic thickness DHH is nearly identical (27.4–28.8 Å), and ∼6 Å thinner than that of DMPC bilayers (Table 1).
| Parameter | DMPC | DLPC | DAPC | DDPC |
|---|---|---|---|---|
| a Parameters for perdeuterated cholesterol are obtained from a 2-Gaussian fit (G1/G2) to the label distribution in DMPC bilayers. A single Gaussian was applied in the case of DLPC, DAPC and DDPC bilayers. b Parameters for head- and tail-labeled cholesterol in DAPC are based upon a 2-Gaussian fit to the data – taken from Harroun et al. (2006, 2008).9,10 Included for comparison are the parameters for headgroup labeled-cholesterol in DMPC (30 mol% at 50 °C) obtained by Leonard et al. (2001).11 | ||||
| Bilayer parameters | ||||
| d-Spacing | 53.18 ± 0.04 | 45.94 ± 0.08 | 46.7 ± 0.2 | 46.95 ± 0.02 |
| D B | 39.4 ± 0.1 | 34.5 ± 0.4 | 34.2 ± 0.4 | 34.89 ± 0.88 |
| D HH | 34.12 ± 1 | 28.2 ± 0.7 | 28.8 ± 1.4 | 27.4 ± 1.4 |
| Perdeuterated cholesterol parametersa | ||||
| 2H locationG1/G2 | 9.8/0 ± 1.2/2 | 0 ± 2 | 0 ± 0.5 | 0 ± 2 |
| 2H widthG1/G2 | 7.8/5.8 ± 1/0.8 | 9 ± 3.3 | 12.6 ± 1 | 10.4 ± 2.1 |
| Head-labeled cholesterol parametersb | ||||
| 2H location | 15.1 ± 0.5 | 4.3 ± 1 | 2.2 ± 0.2 | |
| 2H width | 4 ± 0.8 | 7.0 ± 0.2 | ||
| Tail-labeled cholesterol parametersb | ||||
| 2H location | 3.3 ± 0.2 | |||
| 2H width | 6.4 ± 0.2 | |||
The bilayer normal is the axis of motional averaging for cholesterol
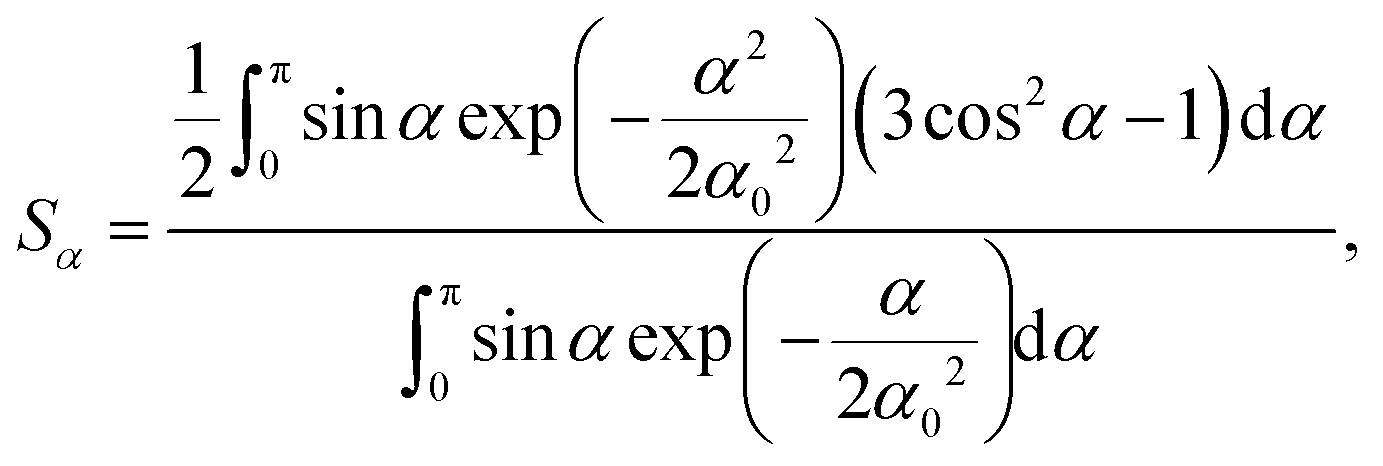
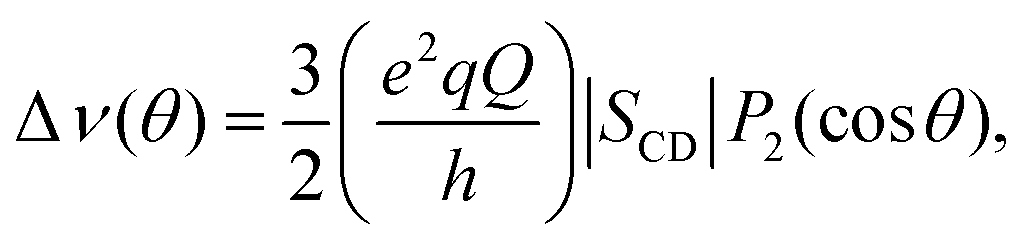 | (1) |
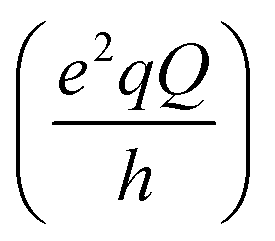 and SCD are the static quadrupolar coupling constant and order parameter for the C–2H bond, respectively, while
 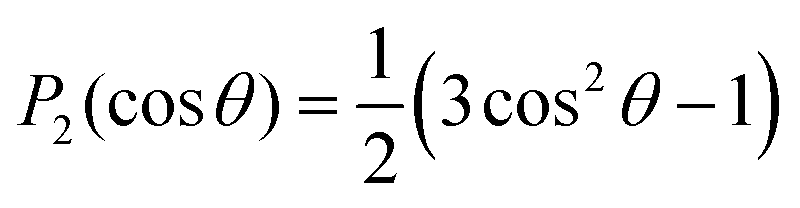 is the second order Legendre polynomial.
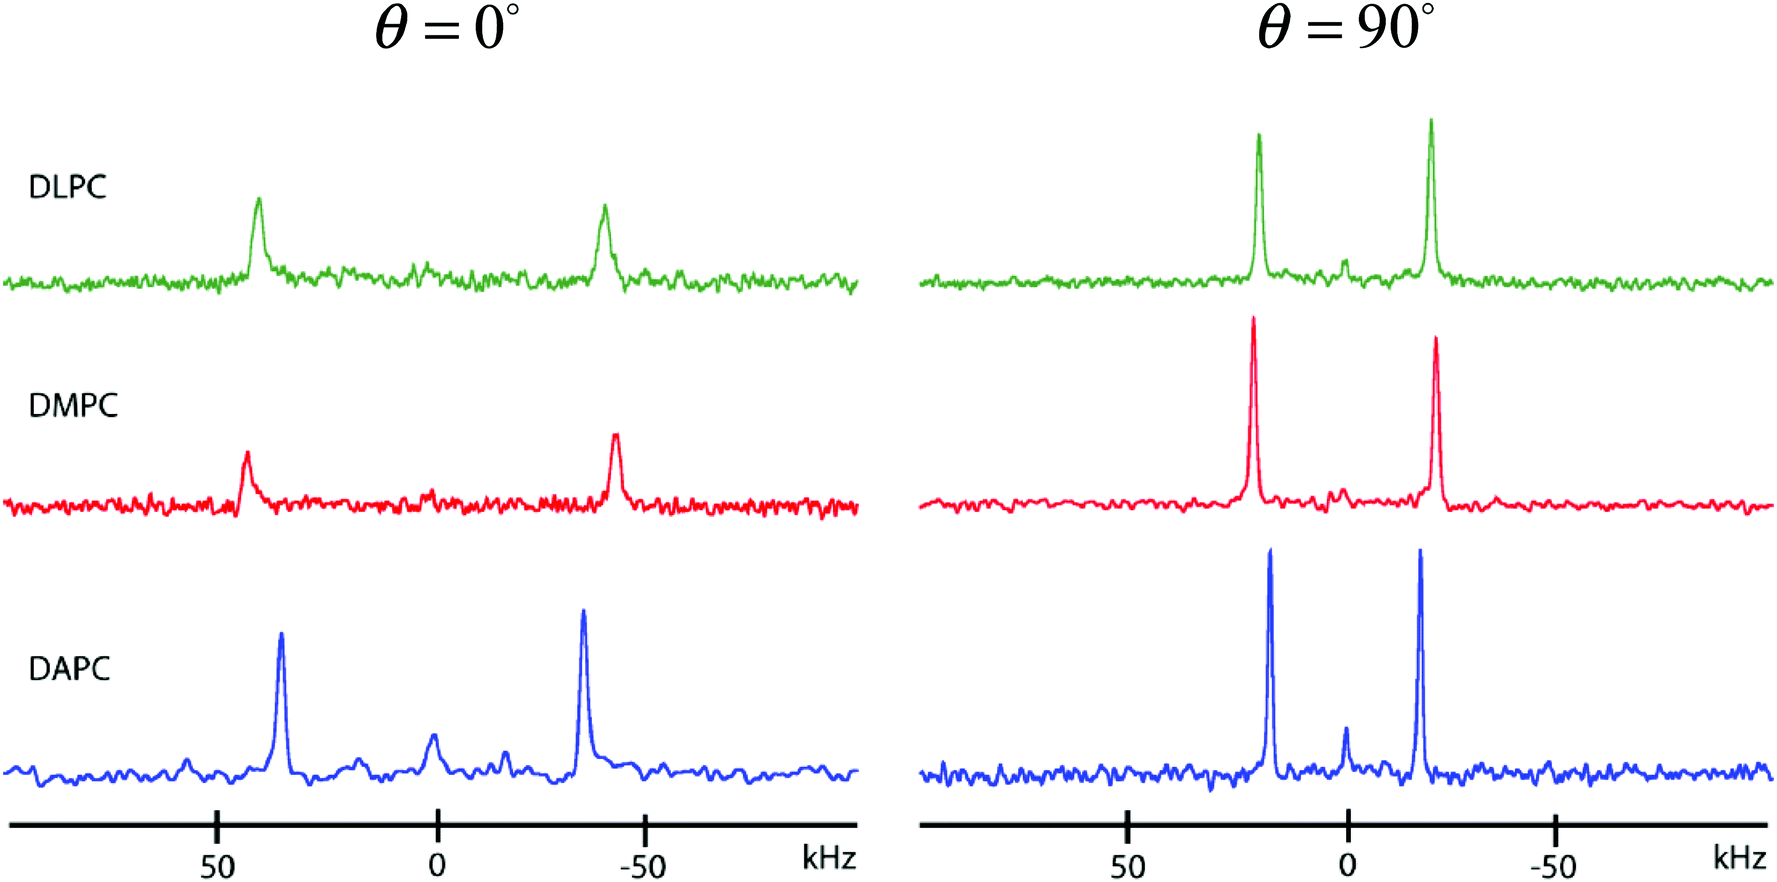 | ||
| Fig. 3 2H NMR spectra for 10 mol% [3α-2H1]cholesterol in aligned multibilayers of DLPC, DMPC and DAPC (46 wt% in 10 mM HEPES, pH 7.6) at 50 °C. Samples were placed with the bilayer normal parallel (θ = 0°) or perpendicular (θ = 90°) to the magnetic field. | ||
| Δν(θ) (kHz) | ||
|---|---|---|
| θ = 0° | θ = 90° | |
| DAPC | 70.9 | 35.3 |
| DLPC | 81.2 | 40.3 |
| DMPC | 86.5 | 42.8 |
Rapid rotation about the bilayer normal for the long molecular axis, that includes a wobbling motion, is an accepted model of motion for cholesterol in DMPC.22,23 This model is confirmed by our neutron diffraction results (Fig. 2A), which find the sterol's hydroxyl group anchored at the aqueous interface and its side chain pointing toward the bilayer center. However, we find that the bilayer normal is also the axis of motional averaging for cholesterol in DLPC and DAPC bilayers, for which neutron scattering measurements reveal that cholesterol is buried near the bilayer center (Fig. 2B and C). In order to reconcile these results, we therefore propose that cholesterol straddles the bilayer's two leaflets in DLPC and DAPC membranes.
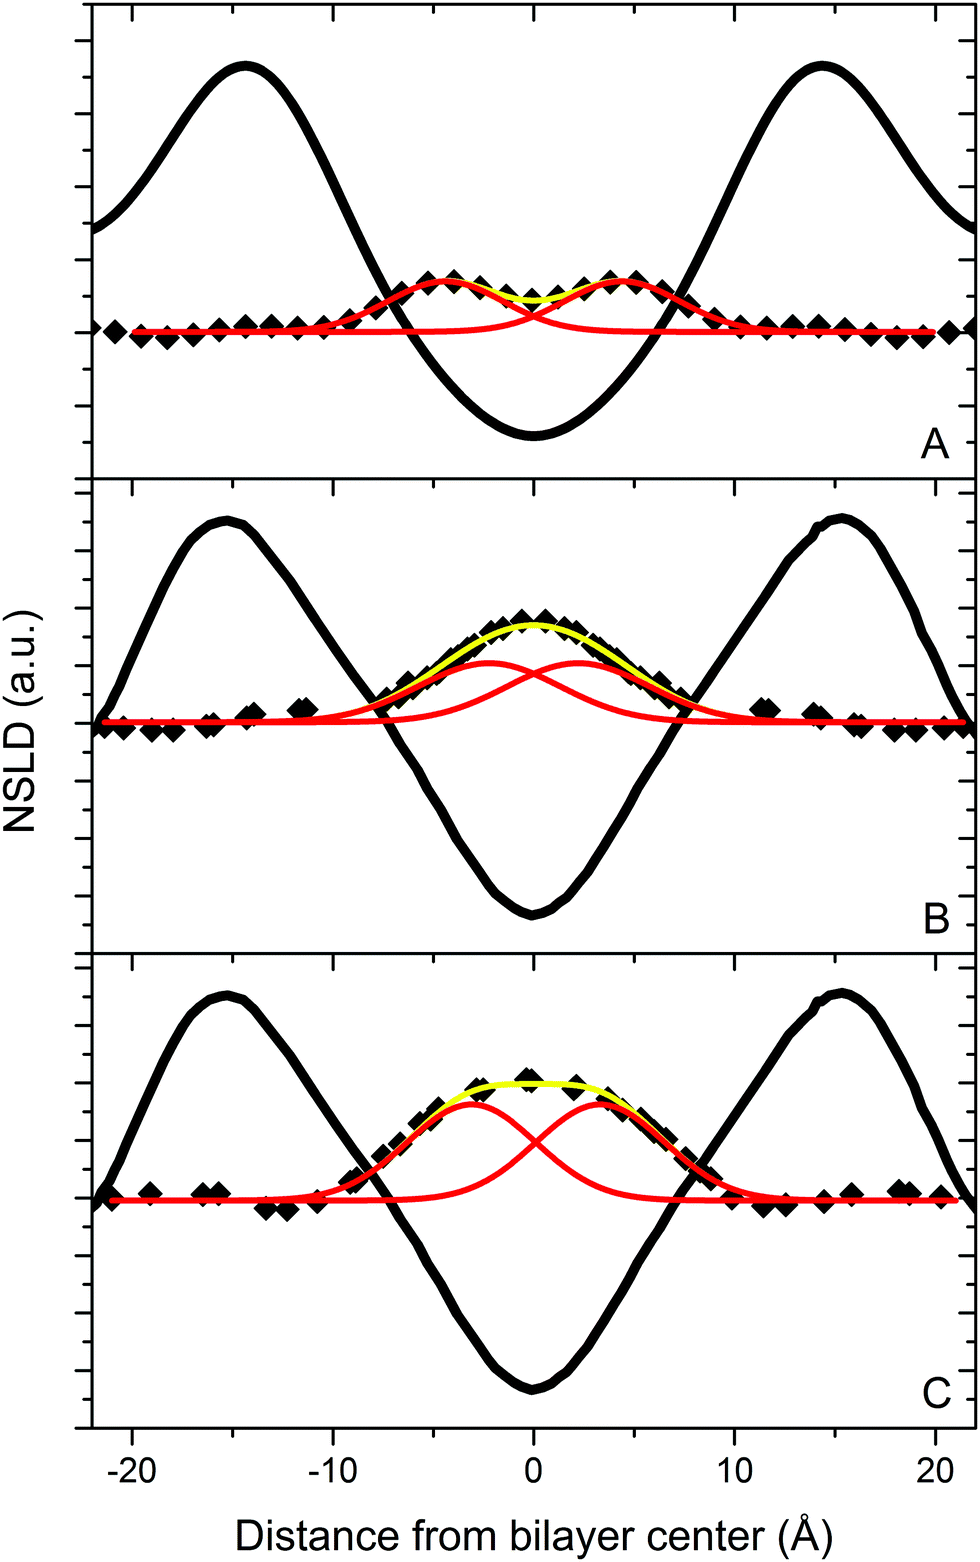 | ||
| Fig. 4 NSLD profiles for bilayers of DLPC containing 10 mol% [2,2,3,4,4,6-2H6]cholesterol (A), and of DAPC containing 10 mol% [2,2,3,4,4,6-2H6]cholesterol (B) and [25,26,26,26,27,27,27-2H7]cholesterol (C) hydrated to 93% RH from water vapor with 8% 2H2O. The solid black lines represent the NSLD profile for the phospholipids. The yellow curves are a two-Gaussian fit to the 2H mass distribution for the labeled analogs of cholesterol (◆). The red curves represent the two Gaussians. The parameters associated with the fits are listed in Table 1. Data for DAPC are taken from Harroun et al. (2006, 2008).9,10 | ||
| Δνr (kHz) | S CD | S α | α 0 (°) | |
|---|---|---|---|---|
| DMPC | 45.1 | 0.358 | 0.804 | 16 |
| DLPC | 40.7 | 0.323 | 0.726 | 19 |
| DAPC | 36.2 | 0.287 | 0.646 | 22 |
The observed trend in tilt angle supports our interpretation of cholesterol's location in these bilayers, and can be understood in terms of constraints imposed upon the wobbling motion of cholesterol by neighboring phospholipid chains. The relatively small tilt angle for cholesterol in DMPC reflects a more restricted motion when the steroid moiety is closer to the head groups, where fatty acyl chain order is higher. Published order parameter profiles for DMPC show a plateau region of approximately constant order near the top of the chain (SCD ≈ 0.23, C2–9),24 and only in the bottom third of the acyl chain do order parameters become appreciably smaller. In contrast, order parameters in the lower portion of DLPC chains progressively decrease (SCD ≈ 0.18, C8) on approaching the very disordered terminal methyl group (SCD ≈ 0.01, C12), while order parameters for DAPC are expected to be low (SCD ≤ 0.04, C10–20) throughout.5,25 The motion of cholesterol spanning the midplane of DLPC and (more markedly) DAPC bilayers should therefore be less constrained than in DMPC, a notion consistent with the observed tilt angles.
Our simulations reproduce the upright orientation for cholesterol reported in earlier work.11,26,27,30 For DMPC bilayers, NSLD profiles derived from atomic number densities place the [2,3,4]-carbons of cholesterol's headgroup just below (∼4 Å) the bilayer surface, and the [25,26,27]-carbons of its tail in the middle of the bilayer (see ESI†). This arrangement is consistent with the conventional view that cholesterol tends to align parallel to the bilayer normal, with its hydroxyl group anchored near the aqueous interface and its side chain at the opposite end of the molecule extending down towards the bilayer center. The simulation result is therefore in agreement with the measurements in the current study, as well as with other reported results from experimental and computational studies on DMPC.11,26,30
A similar upright orientation for cholesterol is observed in DLPC bilayers, with the [2,3,4]-carbons of cholesterol's headgroup located a short distance below the aqueous interface, and the [25,26,27]-carbons in the tail residing near the bilayer center (see ESI†). As in previous work,27 our DLPC simulations did not reproduce the central location seen for cholesterol in our neutron scattering experiments, an unexplained discrepancy between computer modeling and experiment that awaits resolution with future refinement of the current force fields. However, the simulations did provide important indications of the differences between DLPC and DMPC bilayers. For example, flip-flop rates are four times faster for cholesterol in DLPC compared to DMPC bilayers (Table 4), consistent with a greater propensity for cholesterol to reside at the center of the DLPC bilayer. Moreover, substantially greater interdigitation of cholesterol between the two leaflets is observed with DLPC. Defining a cholesterol molecule to be interdigitated when >25% of its atoms are present in both leaflets at the same time, nearly all cholesterols satisfied this criterion during the DLPC simulation, as opposed to essentially none in the DMPC simulation. Indeed, 40% of cholesterol molecules (i.e., 8 out of 20) were interdigitated for the entire duration of the DLPC simulation (see ESI†).
Bilayer thickness dictates where cholesterol resides
We previously proposed that the high degree of disorder possessed by dipolyunsaturated PC bilayers drives cholesterol to the bilayer center.9,10 However, the finding that cholesterol also resides in the center of DLPC bilayers—which are expected to be more ordered – forced us to consider alternative scenarios. The missing element in resolving the uncertainty was a direct experimental comparison of membrane order. Determination of chain order parameters in DAPC by 2H NMR is not possible at present due to the unavailability of perdeuterated DAPC. We therefore performed a proxy study using perdeuterated lauric acid ([2H23] lauric acid, LA-d23) as a probe of the order sensed by membrane-resident molecules. The carboxyl group of LA-d23 is anchored at the aqueous interface, and the rest of the chain extends into the fluid interior, where it can freely reorient within the constraints of the bilayer. LA-d23 was chosen as the probe, as opposed to the previously studied [2H31] palmitic acid,31 to better match the dimensions of the thinner bilayers studied here.![[S with combining macron]](https://www.rsc.org/images/entities/i_char_0053_0304.gif) CD = 0.186) is more ordered than DLPC (CD = 0.159), which in turn is more ordered than DAPC (CD = 0.145) – the values in parentheses are average order parameters given to provide a quantitative comparison. Although differences in details exist (most noticeably an unexpectedly high order parameter at the C2 position in DMPC), the general features usually observed for the host bilayer are reproduced by the proxy fatty acid, in the known cases of DMPC and DLPC.24 Specifically, there is a plateau region of slowly varying order in the upper portion (C3–C8) of the chain, and then order decreases toward the terminal methyl group. In the case of DAPC, the plateau region is not observed, and instead order decreases monotonically over the entire length of the LA-d23 chain. We attribute the shape of this profile to the extreme disorder of the DAPC bilayer expected on the basis of MD simulations.24 The shallow barrier to rotation about the allylic bonds in the repeating CC–C–CC units of DAPC's polyunsaturated chains leads to much lower order parameters33 for the host membrane, than for the saturated fatty acid probe (i.e. LA-d23).
CD = 0.186) is more ordered than DLPC (CD = 0.159), which in turn is more ordered than DAPC (CD = 0.145) – the values in parentheses are average order parameters given to provide a quantitative comparison. Although differences in details exist (most noticeably an unexpectedly high order parameter at the C2 position in DMPC), the general features usually observed for the host bilayer are reproduced by the proxy fatty acid, in the known cases of DMPC and DLPC.24 Specifically, there is a plateau region of slowly varying order in the upper portion (C3–C8) of the chain, and then order decreases toward the terminal methyl group. In the case of DAPC, the plateau region is not observed, and instead order decreases monotonically over the entire length of the LA-d23 chain. We attribute the shape of this profile to the extreme disorder of the DAPC bilayer expected on the basis of MD simulations.24 The shallow barrier to rotation about the allylic bonds in the repeating CC–C–CC units of DAPC's polyunsaturated chains leads to much lower order parameters33 for the host membrane, than for the saturated fatty acid probe (i.e. LA-d23).
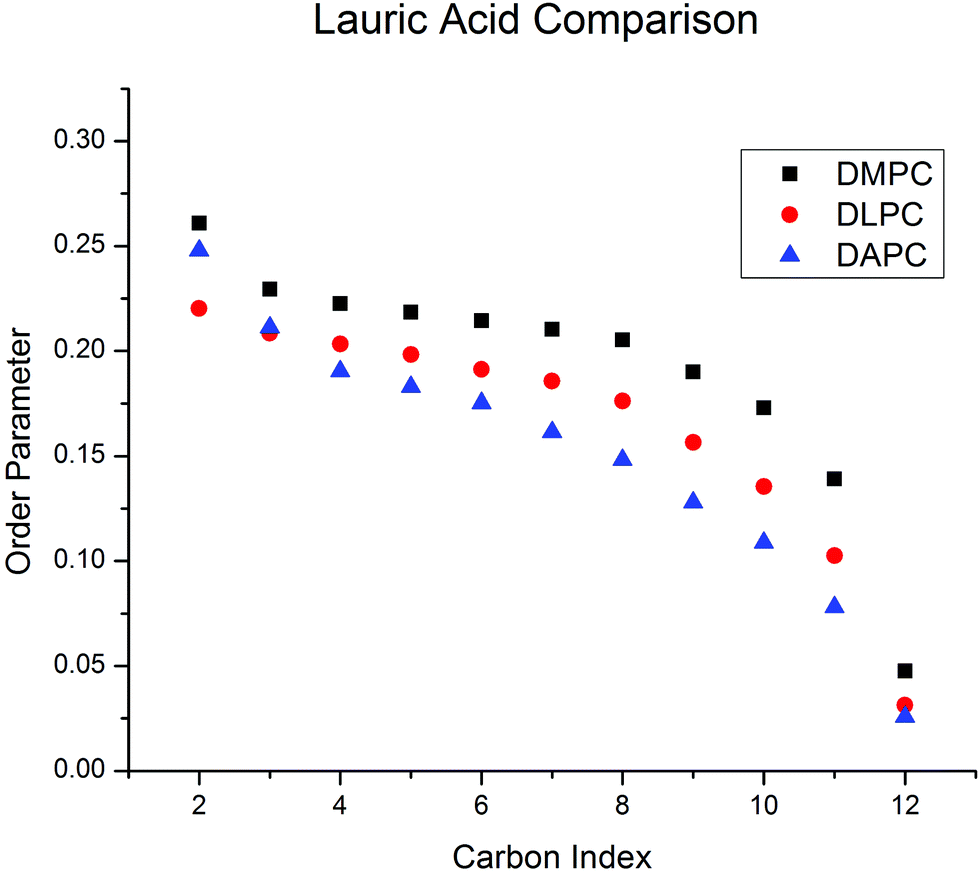 | ||
| Fig. 5 Smoothed order parameter profiles for LA-d23 intercalated at 5 mol% into DMPC, DLPC and DAPC bilayers derived from FFT depaked 2H NMR spectra obtained at 30 °C. | ||
Our data thus show that saturated DLPC bilayers are significantly more ordered than polyunsaturated DAPC and DDPC bilayers, even when having cholesterol residing at their centers. While these bilayers differ in order, they share a common hydrophobic thickness (∼28 Å) that is much smaller than DMPC bilayers (∼34 Å) (Table 1). Based on these data, we propose that bilayer thinning causes the sterol both to adopt a greater tilt angle and a deeper location in the bilayer.
Conclusion
Using neutron scattering, solid state 2H NMR and atomistic MD simulations, we have established that hydrocarbon thickness is the primary determinant of cholesterol's location in lipid bilayers. This result further expands our understanding of the role of hydrophobic mismatch in organizing membrane biomolecules. In bilayers where the extended length of a cholesterol molecule (15 Å) exceeds half the width of the hydrocarbon region, the steroid moiety tilts and descends into the bilayer center. In this location, as shown by our experiments on DLPC and DAPC bilayers, the sterol reorients about the bilayer normal and spans the bilayer midplane. This arrangement differs from the sterol's canonical upright orientation commonly seen in thicker bilayers in which, as confirmed by our experiments with DMPC, the hydroxyl group sits at the lipid–water interface, while the remainder of the molecule extends into the bilayers interior. Whether structurally related sterols (i.e., lanesterol and ergosterol) behave similarly would be a worthwhile avenue for future research on the general applicability of the concept of hydrophobic mismatch to membrane-incorporated biomolecules.Although DLPC and DAPC bilayers share a similar thickness and a common location for cholesterol, the difference in acyl chain order between these two membranes is not without consequence. Of potential biological significance is the much lower solubility for cholesterol in DAPC (15 mol%), compared to DLPC (66 mol%).7,8 The implication is that, despite a comparable bilayer thickness, highly disordered polyunsaturated phospholipids interact differently with cholesterol than do more saturated phospholipids, with important consequences for membrane properties such as permeability, the interaction of cholesterol with other molecules in the membrane, and the transport of cholesterol between and within membranes. Thus, PUFAs possess a distinct niche in biological membranes, imparted by their unique physical properties.
Materials and methods
Materials
DLPC, DMPC, DAPC, and DDPC were purchased as either lyophilized powders or in chloroform solution from Avanti Polar Lipids (Alabaster, AL). Cholesterol and its selectively deuterated analogs, namely [2,2,3,4,4,6-2H6]cholesterol (chol-d6) and [3α-2H1] cholesterol (chol-d1), were bought from Sigma (St. Louis, MO) and CDN Isotopes (Pointe-Claire, Québec, Canada), respectively. Deuterium-depleted water and [2H23]lauric acid (LA-d23) were obtained from Cambridge Isotope Laboratories (Andover, MA). Butylated hydroxytoluene (BHT) was obtained from Sigma and Chem Service, Inc. (West Chester, PA). All commercially obtained reagents were used without further purification. Perdeuterated cholesterol (average of 40 2H per molecule) was prepared as previously described,35 by growing the cholesterol-producing yeast strain Saccharomyces cerevisiae RH6829 in a deuterated medium.36Neutron diffraction
![[thin space (1/6-em)]](https://www.rsc.org/images/entities/char_2009.gif) :1 solution of chloroform:trifluoroethanol. Each sample was deposited onto a silicon wafer (25 × 60 mm2) placed in a glove box purged with argon to below 0.5% O2. The wafer was gently rocked during solvent evaporation, resulting in homogeneous, well-oriented multilayers.37 Samples were then placed under vacuum for a minimum of 6 hours to remove trace solvent. Care was taken to minimize exposure of PUFA samples to both oxygen and light.
:1 solution of chloroform:trifluoroethanol. Each sample was deposited onto a silicon wafer (25 × 60 mm2) placed in a glove box purged with argon to below 0.5% O2. The wafer was gently rocked during solvent evaporation, resulting in homogeneous, well-oriented multilayers.37 Samples were then placed under vacuum for a minimum of 6 hours to remove trace solvent. Care was taken to minimize exposure of PUFA samples to both oxygen and light.
Solid state 2H NMR
:250 mol BHT relative to lipid) using the stacked glass plate procedure outlined by van der Wel et al.39 Briefly, 30 μmol DLPC, DMPC or DAPC, 3.3 μmol chol-d1 and 0.133 μmol BHT from chloroform stock solutions were combined, and the solvent was removed under a stream of N2 gas. The mixture was re-suspended in a solution of methanol (400 μL), chloroform (400 μL), and water (50 μL), which was then spread onto 40 glass slides (4.8 × 23 × 0.07 mm; Marienfeld, Lauda-Konigshofen, Germany) in increments of 20 μL using a glass syringe. Glass slides were then placed in two glass Petri dishes. The slides were dried in a desiccator under vacuum for 48 hours to remove all traces of solvent, and the lipid films were hydrated (46%, w/w) by applying 3 to 4 small drops of HEPES buffer (10 mM, pH 7.0) in deuterium-depleted water to each of the 40 slides. The slides were stacked in increments of 5–6 slides, and slight pressure was applied before each stack was inserted into a glass cuvette. After filling any remaining space with blank glass slides, the cuvette was capped with glass, sealed with epoxy, and equilibrated at 40 °C on a heating block for at least 48 hours to allow bilayers to self assemble. The experimental temperature and hydration levels were maintained to ensure that the DLPC, DMPC and DAPC bilayers were above their respective gel-to-liquid crystalline transition temperatures of about −2, 23, and −70 °C, respectively.40
Multilamellar dispersions containing DLPC, DMPC or DAPC mixed with 10 mol% chol-d1 or 5 mol% LA-d23 (total lipid ∼25–60 mg) were prepared following protocols described in our earlier work.34,41 Lipid mixtures were co-dissolved in chloroform, dried to a film under a stream of argon gas, and placed under vacuum overnight to remove trace solvent. Tris buffer (50 mM, pH 7.5, 50 wt%) was vortex-mixed with the samples, and the pH was adjusted to 7.5 in the presence of additional deuterium-depleted water. Three lyophilizations with deuterium-depleted water were performed to reduce trace amounts of natural abundance 2HHO. The samples were then hydrated at 50 wt% with deuterium-depleted water, packed and sealed in 5 mm glass NMR tubes, and stored at −80 °C. Samples were equilibrated at room temperature prior to measurement. For DAPC, precautions were taken throughout the procedure to minimize oxidation, including limiting exposure to light and using a glove box purged with argon during manipulations.34
000 transients were collected for each sample.
Tilt angle. The tilt angle α0 for cholesterol in DMPC, DLPC and DAPC bilayers was estimated from 2H NMR spectra that were acquired from multilamellar dispersions at 30 °C containing 10 mol% chol-d1. An assumption that the motion of the sterol is axially symmetric about the bilayer normal is implicit in the analysis.22 The spectra (see ESI†) are a superposition of doublets due to bilayers being randomly distributed at all angles with respect to the magnetic field. As a result, a powder pattern spectrum emerges in which two intense peaks are separated in frequency by the residual quadrupolar splitting
 | (2) |
The order parameter SCD, calculated from the splitting, was separated into
| SCD = SαSγ, | (3) |
 | (4) |
Order parameter profile. Profiles of order parameter for 5 mol% LA-d23 in DMPC, DLPC and DAPC bilayers at 30 °C were constructed from 2H NMR spectra following application of the FFT depaking algorithm.41 Depaked spectra are equivalent to the spectrum for a planar bilayer aligned with the normal parallel to the magnetic field (θ = 0°), consisting of a series of doublets (see ESI†). The splitting of the doublets relates to an order parameter viaeqn (1), and smoothed profiles were generated on the basis of integrated intensity, assuming a monotonic decrease in order along the intercalated fatty acid chain toward the terminal methyl group.45
Molecular dynamics simulations
The GROMACS 4.6.1 molecular dynamics (MD) package was used for all simulations with the Slipids force field, due to its superior reproduction of experimentally determined lipid areas and volumes.46–48 Topologies for the lipids and cholesterol were obtained from the Stockholm lipids website.49 Initial coordinates for the simulated membranes were obtained using the CHARMM-GUI online membrane builder.50 Two types of simulations were performed, namely umbrella sampling to obtain potential of mean force (PMF) curves, and MD simulation in order to observe membrane properties in an equilibrium state.PMFs were calculated using the weighted histogram analysis method (WHAM) included in the GROMACS software package.51 The start of each trajectory was not included in the calculation but was used instead, to let each window equilibrate (i.e., 5 ns for DMPC and 10 ns for DLPC) in cases where the PMFs had yet to converge. PMFs were therefore calculated using a total of 240 ns and 480 ns of simulation time for DMPC and DLPC bilayers, respectively.
The free energy of crossing the membrane center, ΔGc, was determined from the PMF and used to calculate the flip-flop rate using kf = kd × exp(−ΔGc/RT), where kf is the rate at which cholesterol moves from its equilibrium position to the bilayer center, kd is the rate of reverse motion, and kflip = 0.5(kf−1 + kd−1)−1. Values of kd were computed by starting with the PMF window in which cholesterol was at the bilayer center, removing the position constraint, and measuring the time required to reach the equilibrium position. This procedure was repeated 10 times to obtain an average value.
Table 4 shows flip-flop rates from Jo et al., Bennett et al.,28 and this work. Flip-flop rates reported by Jo et al.29 were recomputed from information found in that paper, as the values found in Table 1 – it seems that they were not calculated at our simulation temperatures. Comparisons of absolute values between references are not advised due to the different force fields utilized.
| Reference | Force field | Lipid | Temperature (K) | Flip-flop rate (s−1) |
|---|---|---|---|---|
| Jo et al. (2010)29 | CHARMM27r | DPPC | 323.15 | 2.7 × 10³–3.4 × 10⁴ |
| POPC | 303.15 | 5.4 × 10²–4.5 × 10³ | ||
| DAPC | 303.15 | 7.7 × 10³–8.9 × 10⁴ | ||
| Bennett et al. (2009)28 | Berger | DPPC | 323 | 1.2 × 10⁴–6.6 × 10⁵ |
| DAPC | 323 | 5.2 × 10⁵–3.7 × 10⁶ | ||
| This work | Slipids | DMPC | 303 | 6.8 × 10⁶ |
| DLPC | 303 | 2.5 × 10⁷ | ||
MD simulations consisted of membranes with 180 lipids, 20 cholesterol molecules (90 + 10 per bilayer leaflet) and 6000 TIP3P water molecules. Cholesterol positions in the membrane were determined by replacing lipids from a 200 lipid system obtained using the CHARMM-GUI online membrane builder.51 The system was then equilibrated for a 1 ns NVT simulation, followed by a 1 ns NPT simulation. Each MD simulation was run for 100 ns at 303 K, with a time step of 2 fs in a periodic orthorhombic box. The remaining simulation details (e.g., pressure, temperature, potentials, etc.) were similar to the ones described for the Umbrella simulations.
Acknowledgements
We thank Professor Howard Riezman (University of Geneva) for the generous gift of the cholesterol-producing yeast strain and protocol. We thank Norbert Kučerka for discussions. Neutron scattering experiments were performed at the Canadian Neutron Beam Centre (Chalk River, ON). Simulations were performed using facilities of the Shared Hierarchical Academic Research Computing Network (SHARCNET: http://www.sharcnet.ca) and Compute/Calcul Canada. We acknowledge support from the Vanier Canadian Graduate Scholarship from the Natural Science and Engineering Research Council (NSERC, to D. M.); National Science Foundation (MCB 1327611 to D. V. G. and R. E. K.); the University of Tennessee-Oak Ridge National Laboratory (ORNL); Joint Institute of Biological Sciences (to F. A. H.); the NSERC Discovery Grant (to T. A. H.); the Shull Wollan Center—a Joint Institute for Neutron Sciences (to J. K. and F. A. H.); and the Department of Energy (DOE) Scientific User Facilities Division, Office of Basic Energy Sciences, contract no. DEAC05-00OR2275 (to J. K. and F. A. H.).References
- O. S. Andersen and R. E. Koeppe, Bilayer Thickness and Membrane Protein Function: An Energetic Perspective, Annu. Rev. Biophys. Biomol. Struct., 2007, 36, 107–130 CrossRef CAS PubMed
.
- N. Kučerka, J. D. Perlmutter, J. Pan, S. Tristram-Nagle, J. Katsaras and J. N. Sachs, The Effect of Cholesterol on Short- and Long-Chain Monounsaturated Lipid Bilayers as Determined by Molecular Dynamics Simulations and X-Ray Scattering, Biophys. J., 2008, 95, 2792–2805 CrossRef PubMed
- N. Kučerka, M.-P. Nieh and J. Katsaras, Fluid phase lipid areas and bilayer thicknesses of commonly used phosphatidylcholines as a function of temperature, Biochim. Biophys. Acta, 2011, 1808, 2761–2771 CrossRef PubMed
- S. Stillwell and S. R. Wassall, Docosahexaenoic acid: membrane properties of unique fatty acid, Chem. Phys. Lipids, 2003, 126, 1–27 CrossRef PubMed
- N. V. Eldho, S. E. Feller, S. Tristram-Nagle, I. V. Plozov and K. Gawrisch, Polyunsaturated docosahexaenoic vs. docosapentaenoic acid – differences in lipid matrix properties from the loss of one double bond, J. Am. Chem. Soc., 2003, 125, 6409–6421 CrossRef CAS PubMed
- S. R. Wassall and W. Stillwell, Polyunsaturated fatty acid–cholesterol interactions: domain formation in membranes, Biochim. Biophys. Acta, Biomembr., 2009, 1788, 24–32 CrossRef CAS PubMed
- M. R. Brzustowicz, V. Cherezov, M. Caffrey, W. Stillwell and S. R. Wassall, Molecular organization of cholesterol in polyunsaturated membranes: microdomain formation, Biophys. J., 2002, 82, 285–298 CrossRef CAS PubMed
- J. Huang, J. T. Buboltz and G. W. Feigenson, Maximum solubility of cholesterol in phosphatidylcholine and phosphatidylethanolamine bilayers, Biochim. Biophys. Acta, Biomembr., 1999, 1417, 89–100 CrossRef CAS
- T. A. Harroun, J. Katsaras and S. R. Wassall, Cholesterol Hydrozyl Group Is Found To Reside in the Center of a Polyunsaturated Lipid Membrane, Biochemistry, 2006, 45, 1227–1233 CrossRef CAS PubMed
- T. A. Harroun, J. Katsaras and S. R. Wassall, Cholesterol Is Found To Reside in the Center of a Polyunsaturated Lipid Membrane, Biochemistry, 2008, 47, 7090–7096 CrossRef CAS PubMed
- A. Leonard, C. Escrive, M. Laguerre, E. Pebay-Peyroula, W. Neri, T. Pott, J. Katsaras and E. J. Dufourc, Location of cholesterol in DMPC membranes. A comparative study by neutron diffraction and molecular mechanics simulation, Langmuir, 2001, 17, 2019–2030 CrossRef CAS
- N. Kučerka, D. Marquardt, T. A. Harroun, M. P. Nieh, S. R. Wassall and J. Katsaras, The Functional Significance of Lipid Diversity: Orientation of Cholesterol in Bilayers Is Determined by Lipid Species, J. Am. Chem. Soc., 2009, 131, 16358–16359 CrossRef PubMed
- N. Kučerka, D. Marquardt, T. A. Harroun, M. P. Nieh, S. R. Wassall, D. H. de Jong, L. V. Schäfer, S. J. Marrink and J. Katsaras, Cholesterol in Bilayers with PUFA Chains: Doping with di-14:0 PC or POPC Results in Sterol Reorientation and Membrane-Domain Formation, Biochemistry, 2010, 49, 7485–7493 CrossRef PubMed
- M. Venturoli, B. Smit and M. M. Sperotto, Simulation studies of protein-induced bilayer deformations, and lipid-induced protein tilting, on a mesoscopic model for lipid bilayers with embedded proteins, Biophys. J., 2005, 88, 1778–1798 CrossRef CAS PubMed
- E. Strandberg, S. Esteban-Martin, A. S. Ulrich and J. Salgado, Hydrophobic mismatch of mobile transmembrane helices: Merging theory and experiments, Biochim. Biophys. Acta, Biomembr., 2012, 1818, 1242–1249 CrossRef CAS PubMed
- J. Gallova, D. Uhrikova, A. Islamov, A. Kuklin and P. Balgavy, Effect of cholesterol on the bilayer thickness in unilamellar extruded DLPC and DOPC liposomes: SANS contrast variation study, Gen. Physiol. Biophys., 2004, 23, 113–122 CAS
- M. Mihailescu, O. Soubias, D. Worcester, S. H. White and K. Gawrisch, Structure and Dynamics of Cholesterol-Containing Polyunsaturated Lipid Membranes Studied by Neutron Diffraction and NMR, J. Membr. Biol., 2011, 239, 63–71 CrossRef CAS PubMed
- C. Beermann, M. Mobius, N. Winterling, J. Schmitt and G. Boehm, sn-position determination of phospholipid-linked fatty acids derived from erythrocytes by liquid chromatography electrospray ionization ion-trap mass spectrometry, Lipids, 2005, 40, 211–218 CrossRef CAS PubMed
- O. Berdeaux, P. Juaneda, L. Martine, S. Cabaret, L. Bretillon and N. Acar, Identification and quantification of phosphatidylcholines containing very-long-chain polyunsaturated fatty acid in bovine and human retina using liquid chromatography/tandem mass spectrometry, J. Chromatogr. A, 2010, 1217, 7738–7748 CrossRef CAS PubMed
- E. Endress, H. Heller, H. Casalta, M. F. Brown and T. M. Bayerl, Anisotropic motion and molecular dynamics of cholesterol, lanosterol, and ergosterol in lecithin bilayers studied by quasi-elastic neutron scattering, Biochemistry, 2002, 41, 13078–13086 CrossRef CAS PubMed
- J. Seelig, Deuterium Magentic Resonance-Theory and Applications to Lipid-Membranes, Q. Rev. Biophys., 1977, 10, 353–418 CrossRef CAS PubMed
- E. Oldfield, M. Meadows, D. Rice and R. Jacobs, Spectroscopic studies of specifically deuterium labeled membrane systems. Nuclear magnetic resonance investigation of the effects of cholesterol in model systems, Biochemistry, 1978, 17, 2727–2740 CrossRef CAS PubMed
- M. P. Marsan, I. Muller, C. Ramos, F. Rodriguez, E. J. Dufourc, J. Czaplicki and A. Milon, Cholesterol orientation and dynamics in dimyristoylphosphatidylcholine bilayers: A solid state deuterium NMR analysis, Biophys. J., 1999, 76, 351–359 CrossRef CAS PubMed
- H. I. Petrache, S. W. Dodd and M. F. Brown, Area per lipid and acyl length distributions in fluid phosphatidylcholines determined by H-2 NMR spectroscopy, Biophys. J., 2000, 79, 3172–3192 CrossRef CAS PubMed
- J. B. Klauda, V. Monje, T. Kim and W. Im, Improving the CHARMM Force Field for Polyunsaturated Fatty Acid Chains, J. Phys. Chem. B, 2012, 116, 9424–9431 CrossRef CAS PubMed
- M. Pasenkiewicz-Gierula, T. Rog, K. Kitamura and A. Kusumi, Cholesterol effects on the phosphatidylcholine bilayer polar region: A molecular simulation study, Biophys. J., 2000, 78, 1376–1389 CrossRef CAS PubMed
- S. A. Pandit, D. Bostick and M. L. Berkowitz, Complexation of Phosphatidylcholine Lipids with Cholesterol, Biophys. J., 2004, 86, 1345–1356 CrossRef CAS PubMed
- W. F. D. Bennett, J. L. MacCallum, M. J. Hinner, S. J. Marrink and D. P. Tieleman, Molecular View of Cholesterol Flip-Flop and Chemical Potential in Different Membrane Environments, J. Am. Chem. Soc., 2009, 131, 12714–12720 CrossRef CAS PubMed
- S. Jo, H. Rui, J. B. Lim, J. B. Klauda and W. Im, Cholesterol Flip-Flop: Insights from Free Energy Simulation Studies, J. Phys. Chem. B, 2010, 114, 13342–13348 CrossRef CAS PubMed
- G. Khelashvili, G. Pabst and D. Harries, Cholesterol Orientation and Tilt Modulus in DMPC Bilayers, J. Phys. Chem. B, 2010, 114, 7524–7534 CrossRef CAS PubMed
- K. P. Pauls, A. L. Mackay and M. Bloom, Deuterium Nuclear Magnetic-Resonance Study of the Effects of Palmitic Acid on Dipalmitoylphosphatidylcholine Bilayers, Biochemistry, 1983, 22, 6101–6109 CrossRef CAS
- M. A. McCabe and S. R. Wassall, Rapid Deconvolution of NMR Powder Spectra by Weighted Fast Fourier Transformation, Solid State Nucl. Magn. Reson., 1997, 10, 53–61 CrossRef CAS PubMed
- S. E. Feller, Acyl chain conformations in phospholipid bilayers: a comparative study of docosahexaenoic acid and saturated fatty acids, Chem. Phys. Lipids, 2008, 153, 76–80 CrossRef CAS PubMed
- M. R. Brzustowicz, V. Cherezov, M. Zerouga, M. Caffrey, W. Stillwell and S. R. Wassall, Controlling Membrane Cholesterol Content. A Role for Polyunsaturated (Docosahexaenoate) Phospholipids, Biochemistry, 2002, 41, 12509–12519 CrossRef CAS PubMed
- J. D. Nickels, X. Cheng, B. Mostofian, C. Stanley, B. Lindner, F. A. Heberle, S. Perticaroli, F. Feygenson, T. Egami, R. F. Standaert, J. C. Smith, D. A. A. Myles, M. Ohl and J. Katsaras, Mechanical Properties of Nanoscopic Lipid Domains, J. Am. Chem. Soc., 2015, 137, 15772–15780 CrossRef CAS PubMed
- C. M. Souza, T. M. Schwabe, H. Pichler, B. Ploier, E. Leitner, X. L. Guan, M. R. Wenk, I. Riezman and H. Riezman, A stable yeast strain efficiently producing cholesterol instead of ergosterol is functional for tryptophan uptake, but not weak organic acid resistance, Metab. Eng., 2011, 13, 555–569 CrossRef CAS PubMed
-
S. A. Tristram-Nagle, Preparation of Oriented, Fully Hydrated Lipid Samples for Structure Determination Using X-Ray Scattering, in Methods in Membrane Lipids, ed. A. M. Dopico, Humana Press, Totowa, NJ, 2007, pp. 63–75 Search PubMed
- D. Marquardt, N. Kučerka, J. Katsaras and T. A. Harroun, α-tocopherol's location in membranes is not affected by their composition, Langmuir, 2015, 31, 4464–4472 CrossRef CAS PubMed
- P. C. A. van der Wel, E. Strandberg, J. A. Killian and R. E. Koeppe, Geometry and intrinsic tilt of a tryptophan-anchored transmembrane alpha-helix determined by H-2 NMR, Biophys. J., 2002, 83, 1479–1488 CrossRef CAS PubMed
-
J. R. Silvius, Lipid-Protein Interactions, John Wiley, New York, 1982 Search PubMed
- D. Marquardt, J. A. Williams, N. Kučerka, J. Atkinson, S. R. Wassall, J. Katsaras and T. A. Harroun, Tocopherol Activity Correlates with Its Location in a Membrane: A New Perspective on the Antioxidant Vitamin E, J. Am. Chem. Soc., 2013, 135, 7523–7533 CrossRef CAS PubMed
- J. H. Davis, K. R. Jeffrey, M. Bloom, M. I. Valic and T. P. Higgs, Quadrupolar echo deuteron magnetic resonance spectroscopy in ordered hydrocarbon chains, Chem. Phys. Lett., 1976, 42, 390–394 CrossRef CAS
- J. A. Williams, S. E. Batten, M. Harris, B. D. Rockett, S. R. Shaikh, W. Stillwell and S. R. Wassall, Docosahexaenoic and Eicosapentaenoic Acids Segregate Differently between Raft and Nonraft Domains, Biophys. J., 2012, 103, 228–237 CrossRef CAS PubMed
- M. G. Taylor, T. Akiyama and I. C. P. Smith, The molecular dynamics of cholesterol in bilayer membranes: a deuterium NMR study, Chem. Phys. Lipids, 1981, 29, 327–339 CrossRef CAS
- M. Lafleur, B. Fine, E. Sternin, P. R. Cullis and M. Bloom, Smoothed orientational order profile of lipid bilayers by 2H-nuclear magnetic resonance, Biophys. J., 1989, 56, 1037–1041 CrossRef CAS PubMed
- J. P. M. Jämbeck and A. P. Lyubartsev, Derivation and Systematic Validation of a Refined All-Atom Force Field for Phosphatidylcholine Lipids, J. Phys. Chem. B, 2012, 116, 3164–3179 CrossRef PubMed
- J. P. M. Jämbeck and A. P. Lyubartsev, Another Piece of the Membrane Puzzle: Extending Slipids Further, J. Chem. Theory Comput., 2013, 9, 774–784 CrossRef PubMed
- N. Kučerka, B. van Oosten, J. Pan, F. A. Heberle, T. A. Harroun and J. Katsaras, Molecular Structures of Fluid Phosphatidylethanolamine Bilayers Obtained from Simulation-to-Experiment Comparisons and Experimental Scattering Density Profiles, J. Phys. Chem. B, 2015, 119, 1947–1956 CrossRef PubMed
- J. Domański, P. J. Stansfeld, M. S. P. Sansom and O. Beckstein, Lipidbook: A Public Repository for Force-Field Parameters Used in Membrane Simulations, J. Membr. Biol., 2010, 236, 255–258 CrossRef PubMed
- S. Jo, T. Kim, V. G. Iyer and W. Im, CHARMM-GUI: a web-based graphical user interface for CHARMM, J. Comput. Chem., 2008, 29, 1859–1865 CrossRef CAS PubMed
- J. Hub, B. de Groot and D. van der Spoel, g wham-A Free Weighted Histogram Analysis Implementation Including Robust Error and Autocorrelation Estimates, J. Chem. Theory Comput., 2010, 6, 3713–3720 CrossRef CAS
Footnote |
| † Electronic supplementary information (ESI) available. See DOI: 10.1039/c6sm01777k |
| This journal is © The Royal Society of Chemistry 2016 |