
 Open Access Article
 This Open Access Article is licensed under a Creative Commons Attribution-Non Commercial 3.0 Unported Licence
State behaviour and dynamics of self-propelled Brownian squares: a simulation study†
Vasileios
Prymidis
 *a,
Sela
Samin
b and
Laura
Filion
a
*a,
Sela
Samin
b and
Laura
Filion
a
aSoft Condensed Matter, Debye Institute for Nanomaterials Science, Utrecht University, Princetonplein 5, 3584 CC Utrecht, The Netherlands. E-mail: v.prymidis@uu.nl
bInstitute for Theoretical Physics, Center for Extreme Matter and Emergent Phenomena, Utrecht University, Leuvenlaan 4, 3584 CE Utrecht, The Netherlands
First published on 15th April 2016
Abstract
We study the state behaviour of self-propelled and Brownian squares as a function of the magnitude of self-propulsion and density using Brownian dynamics simulations. We find that the system undergoes a transition from a fluid state to phase coexistence with increased self-propulsion and density. Close to the transition we find oscillations of the system between a fluid state and phase coexistence that are caused by the accumulation of forces in the dense phase. Finally, we study the coarsening regime of the system and find super-diffusive behaviour.
I. Introduction
Active matter is one of the most fascinating and rapidly growing fields of soft matter.1–3 Advances in the synthesis of artificial swimmers, on both micro- and nanoscales, have opened the door to the unprecedented study of the individual dynamics as well as the collective behaviour of self-propelled particles.4–13 This in turn has led to intensive research both theoretically, where the fundamental properties of active matter are pursued,14–18 and experimentally, towards the creation of novel active materials.19–21An important challenge in understanding the behaviour of active matter is determining how shape can affect collective behaviour, as self-propelled anisotropic particles are expected to play an important role in the study of active matter.22 To date, only a few shapes have been explored in combination with active motion. Some notable examples include self-propelled L-shaped particles that have been created and studied by Kummel and collaborators,23 self-propelled dumbbells24 and self-propelled rods.25 In all of these studies remarkable results have been reported; the L-shaped swimmer shows gravitactic motion and can swim against the direction of gravity,26 active dumbbells assemble in rotating clusters,27 and rods can form swarms and lanes due to the emergent aligning interaction between the particles.25,28 The plethora of dynamic phenomena shows that the shape of an active particle can dramatically change the single particle and many particle dynamics.
Herein we explore the behaviour of a very simple particle, namely a repulsive square that self-propels in the direction perpendicular to one of its edges. It is already known that repulsive, active spheres and disks can phase separate due to their activity, a phenomenon known as motility induced phase separation (MIPS).29–31 However, how such behaviour might manifest in the case of anisotropic particles with four-fold symmetry is not a priori evident. Here, we explore the state diagram of self-propelled squares for a wide range of densities and magnitudes of self-propulsion, in order to fully map the behaviour of such a geometry. We explicitly compare our results with existing literature on self-propelled disks and rods with respect to the state behaviour, the phase coexistence and the coarsening properties of the different systems.
This paper is organized as follows. We start by introducing the model and the parameters of our simulations in Section II, and in Section III A we present the state diagram and give a general overview of the different states of the system. In Section III B we quantify certain properties of the phase coexistence regime, while in Section III C we focus on what we identify as state oscillations of the system. Finally, we look into the coarsening process in Section III D. Conclusions are given in Section IV.
II. Methods
A. Model
We consider a two-dimensional system, consisting of squares of length σ in a periodic square box of length L. The position of the center of mass of the i-th particle at time t is given by the vector ri(t) while its orientation is given by the unit vector ηi(t) = (cos![[thin space (1/6-em)]](https://www.rsc.org/images/entities/char_2009.gif) θi(t), sinθi(t)), where θi(t) ∈ [0,2π] is the angle between a fixed axis in the lab frame and a fixed axis on the particle. The axis on the particle is chosen such that the vector ηi is perpendicular to one of the edges of the square. A schematic overview of the model can be found in Fig. 1.
θi(t), sinθi(t)), where θi(t) ∈ [0,2π] is the angle between a fixed axis in the lab frame and a fixed axis on the particle. The axis on the particle is chosen such that the vector ηi is perpendicular to one of the edges of the square. A schematic overview of the model can be found in Fig. 1.
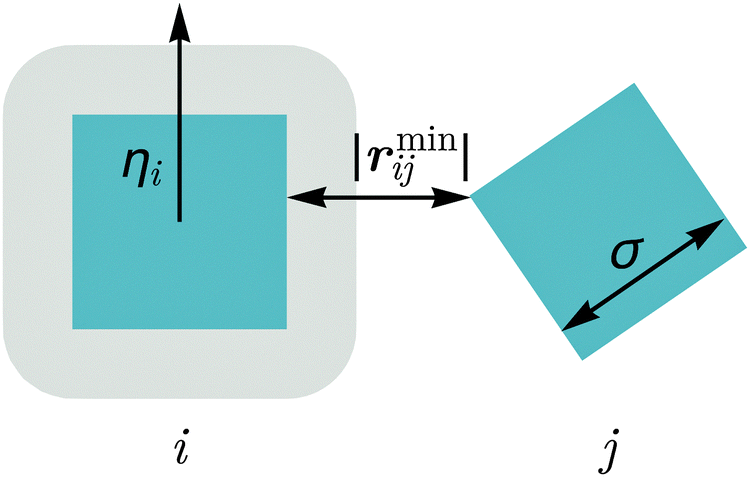 | ||
| Fig. 1 A schematic overview of the model. Particles i and j are coloured blue, and the grey area around particle i stands for the area in which particle j must enter in order for the two particles to interact. The distance |rminij| is the minimum distance between the surfaces of the two particles. | ||
The interaction between two particles is modeled as a soft repulsion between their points of closest approach. To this end, we first find the minimum distance vector between the surfaces of the two squares i and j, which we denote here as rminij. The force that acts between the two particles is then given by
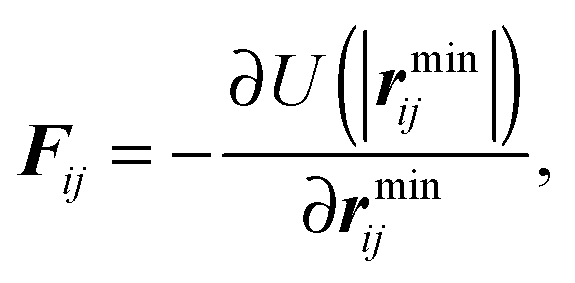 | (1) |
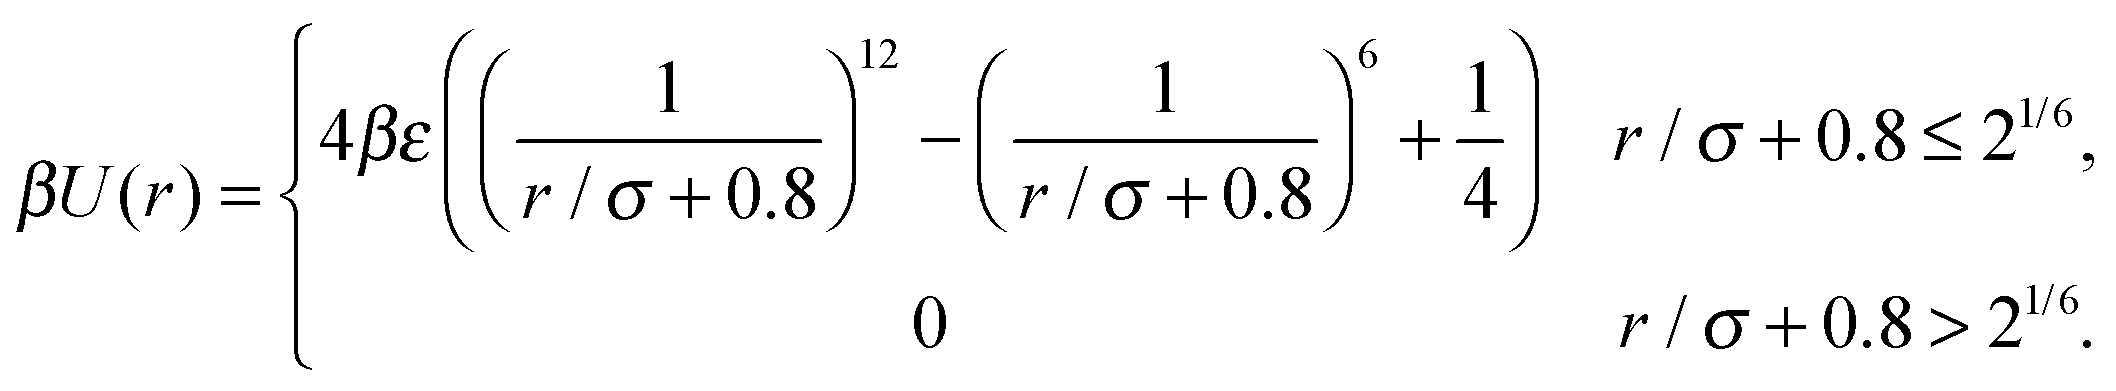 | (2) |
We then apply the force Fij on the surface point of particle i that is closest to the surface of particle j, which we denote here as rji. This creates a torque
| Tij = (rji − ri) × Fij, | (3) |
B. Dynamics
To make the particles active, we include a self-propelling force of constant magnitude Fsp that acts along η. Thus, the particles are self-propelled along one of their edges. Additionally, we consider our particles immersed in a solvent whose viscosity is parametrized by γ. Since we are interested in the regime that applies to the colloidal world, we use overdamped Langevin dynamics for the equations of motion, which include solvent–particle interactions implicitly and neglect the inertia of the particles. Thus, the translational and rotational equations of motion are | (4) |
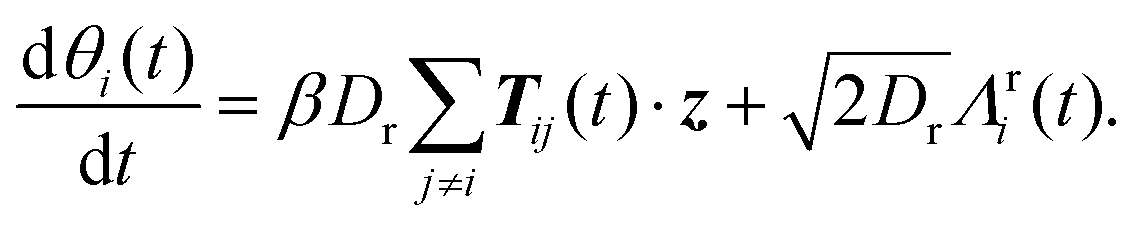 | (5) |
Eqn (4) and (5) are integrated using an Euler–Maruyama integration scheme,35 with a time step of dt = 10−5τ. In the initial configuration of our simulations, particles are placed on a square lattice spanning the entire simulation box, with their orientations randomly distributed.
III. Results
A. State behavior
To investigate the state behavior of our system we performed Brownian Dynamics simulations of N = 4900 particles for a range of reduced densities![[small rho, Greek, tilde]](https://www.rsc.org/images/entities/i_char_e0e4.gif) = ρσ2 = Nσ2/L2 and propulsion speeds
= ρσ2 = Nσ2/L2 and propulsion speeds ![[F with combining tilde]](https://www.rsc.org/images/entities/i_char_0046_0303.gif) sp = βσFsp. The results of our simulations are summarized in the state diagram in Fig. 2.
sp = βσFsp. The results of our simulations are summarized in the state diagram in Fig. 2.
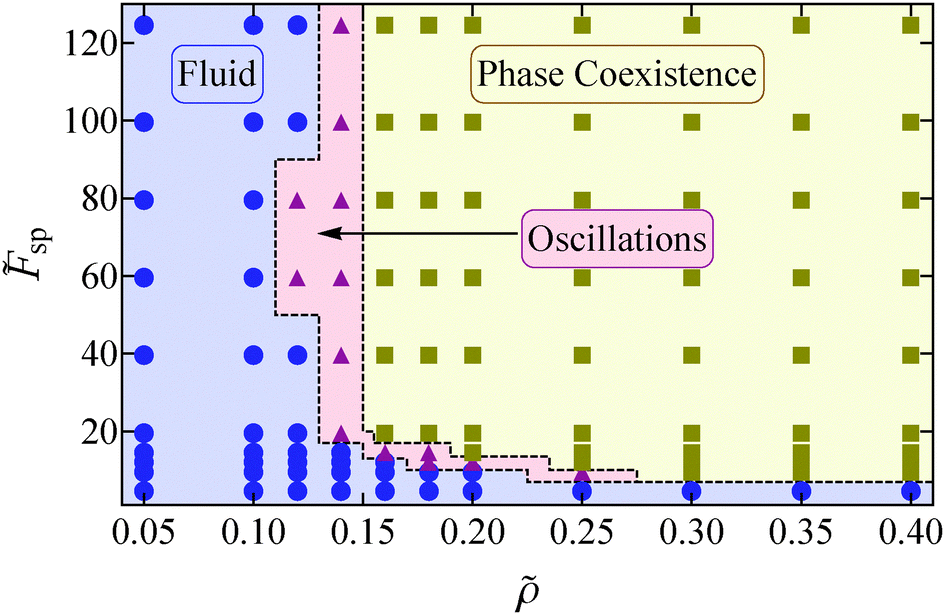 | ||
Fig. 2 State diagram of soft active squares, as a function of system density and propulsion speed sp. Blue circles ( ) denote points where the system is found in a homogeneous fluid state, brown squares ( ) denote points where the system is found in a homogeneous fluid state, brown squares ( ) denote phase coexistence, and red triangles ( ) denote phase coexistence, and red triangles ( ) denote points where the system oscillates between the two aforementioned states. The dotted lines are approximate boundaries between the different regimes. ) denote points where the system oscillates between the two aforementioned states. The dotted lines are approximate boundaries between the different regimes. | ||
We identify three distinct regions: a homogeneous fluid regime, a regime where there is coexistence between a dense and a dilute phase, and a region where the system oscillates between a homogeneous fluid state and a phase coexistence. In the regime where the density and the speed of self-propulsion are relatively small, the system is found to be in a homogeneous fluid state. Note that in this fluid, small and short-lived clusters can form due to collisions between the particles. In contrast, at sufficiently high densities and speeds of self-propulsion a kinetic trapping mechanism takes place, similar to that seen in self-propelled disks.29,30 Particles slow down significantly in dense regions due to frequent collisions with one another, which leads to a further increase in the local density. Ultimately, this leads to phase coexistence between a high-density crystalline region and a low density fluid, a phenomenon known as motility induced phase separation (see Fig. 3(a)). We also found that at low densities, the high density cluster sometimes breaks up into smaller clusters (see Fig. 3(b)) and then reforms. Note that this breakup is not typically observed in equilibrium coexistences once equilibrated.
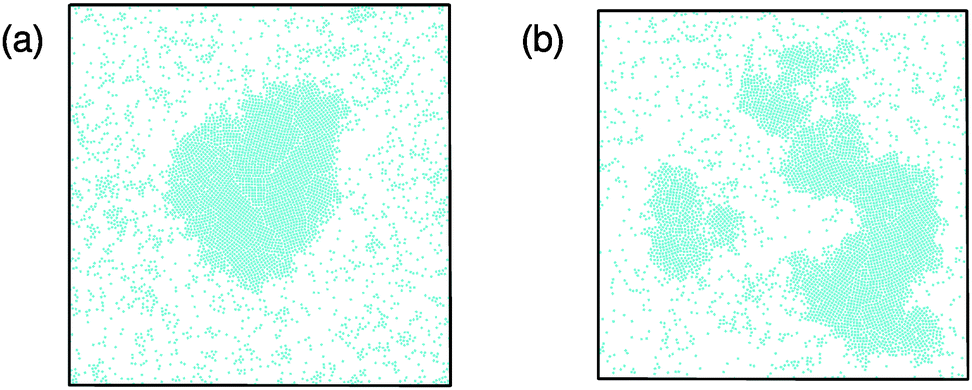 | ||
| Fig. 3 (a and b) Snapshots of the system for = 0.18 and sp = 60 at different times. | ||
Interestingly, between the homogeneous and the coexistence regime, we find an additional region where we observe oscillation between a homogeneous fluid state and a phase coexistence. Specifically, in this region if we start with a homogeneous fluid state, the system appears to undergo nucleation and growth, resulting in a single large cluster. However, as we explore in more detail in Section III C, at some point the cluster disintegrates completely and the system returns to a homogeneous fluid state. This process repeats itself continuously. In the following text, we refer to this region as the oscillatory regime of our state diagram.
In order to further clarify the differences between the three regimes in our state diagram, we plot in Fig. 4 the time evolution of two quantities: (i) the fraction of particles associated with the largest cluster in the system flc = Nlc/N, with Nlc the number of particles in the largest cluster and N the total number of particles, and (ii) the degree of clustering Θ = 1 − Nc/N,36 where Nc is the average number of clusters. Θ goes to zero for a system composed of single-particle clusters while it approaches unity when the mean cluster size becomes comparable to the total number of particles. We assign two particles to the same cluster if they exert non-zero forces on one another. We assign a parameter space point to the phase coexistence regime if, for the whole course of the performed simulation, the largest cluster fraction remains higher than 10%.
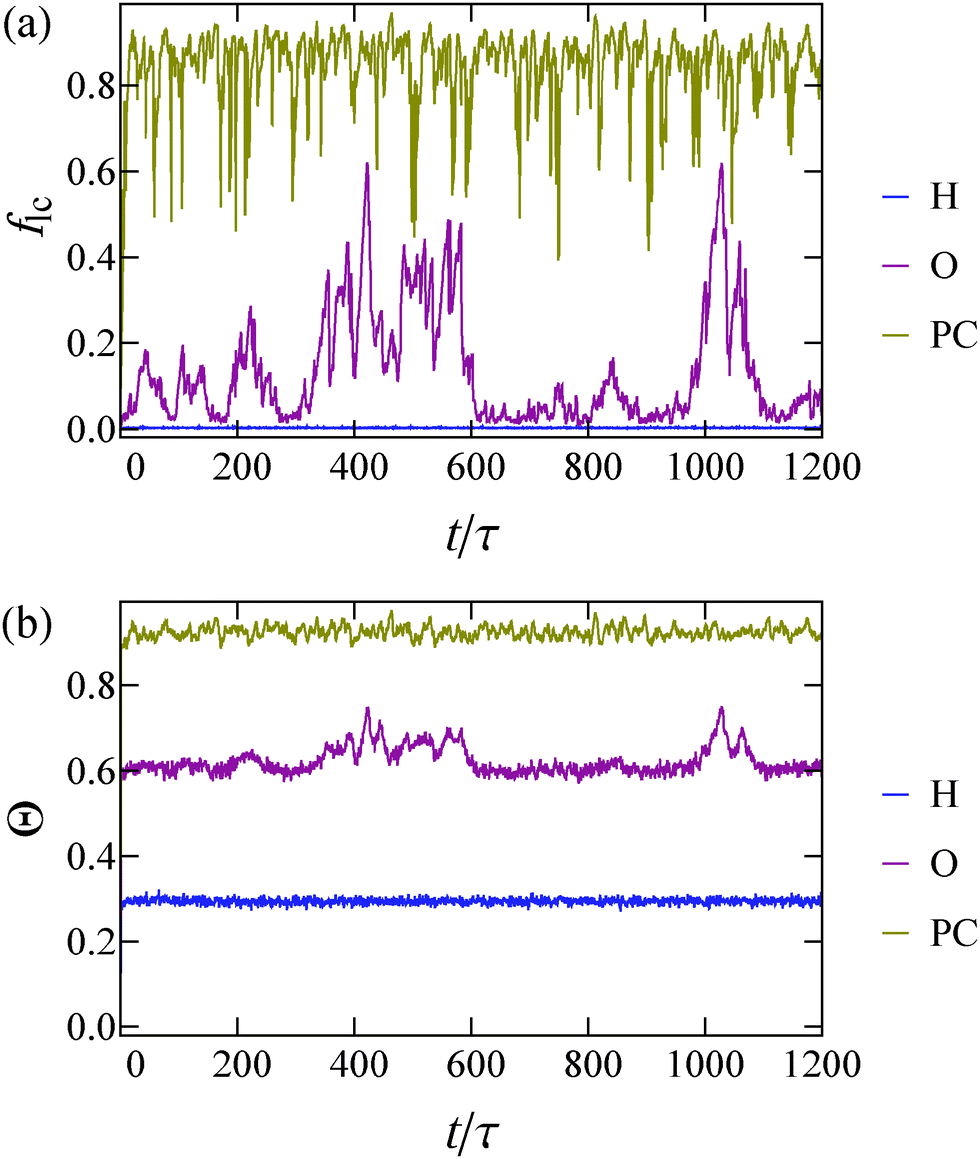 | ||
| Fig. 4 Time evolution of (a) the largest cluster fraction flc and (b) the degree of clustering Θ, for three systems with constant self-propulsive force sp = 100 and densities = 0.05, 0.14 and 0.3, corresponding to systems in the homogeneous (H), oscillatory (O) and phase-coexistence (PC) regimes respectively. | ||
As expected, the homogeneous state shows minimal clustering (Θ ≃ 0.3, flc ≃ 0), while in the case of phase coexistence the system is highly clustered (Θ ≃ 0.9, flc ≃ 0.9). Following the time evolution of the curve that corresponds to the phase coexistence regime (coloured brown), we find that the sudden drops in flc (Fig. 4(a)) are not simultaneously accompanied by a significant drop in Θ (Fig. 4(b)), and correspond to temporary breaking of the largest cluster into smaller pieces (for example see Fig. 3(b)). In contrast, from the curves that represent the oscillatory regime (coloured red), a correlation between the two quantities is clearly visible. This correlation suggests that the clustering of the whole system is dictated by the behaviour of the largest cluster in the system. The peaks observed in both quantities indicate nucleation, growth and breaking of a single cluster.
Moreover, in the phase coexistence regime all functions tend to their steady-state value immediately after the simulation begins, thus no nucleation time is required. This feature is shared for all points that we identify as phase coexistence states. This hints that these points may lie inside the spinodal lines of the system, if such a correspondence with equilibrium physics can be made. However, in the red curve of Fig. 4(a), which corresponds to the oscillatory regime, one can see distinct plateaus where the largest cluster in the system is very small (flc ∼ 0), accompanied by the growth and destruction of the cluster. These features are shared by all the simulations that we identify to be in the oscillatory regime. Thus, we infer that what we identify as an oscillatory regime may coincide with the region between the binodal and the spinodal lines of the system. What remains unclear is whether the system would ever fully nucleate. Specifically, whether for a sufficiently large system and sufficiently long time, the oscillations would stop. We note that we have seen no sign of such stopping in our systems for any of the state points we have examined.
Comparison between our state diagram (Fig. 2) and the diagram of self-propelled disks (see for example Fig. 2(a) in ref. 30) shows that phase coexistence in our system requires much smaller propulsion speeds. We attribute this to the augmented average duration of a collision event between squares compared to disks, which arises due to the different shapes of the particles: squares cannot slip past each other when they collide as their flat surfaces tend to align the particles. This hinders their movement, especially when particles with anti-parallel self-propulsion axes collide. Moreover, the oscillatory regime is absent in the case of the isotropic disks. We will discuss how the anisotropic shape of the squares gives rise to this regime in Section III C.
We also note that we have observed no formation of lanes or swarms in our simulations. These dynamic states are seen in models where interparticle interactions tend to align the axes of self-propulsion of the colliding particles.37,38 For example, when two self-propelled rods collide, their axes of self-propulsion will tend to become parallel or anti-parallel. In the case of collision of two squares, even though the particles do become parallel after the collision, their axes of self-propulsion can also be perpendicular to one another. We conclude that the four-fold symmetry of squares, instead of the two-fold symmetry of rods, is enough to lead to the absence of lanes or swarms. A more detailed comparison between active squares and rods will be given in Section III C.
B. Phase separation regime
By inspection of the dense cluster that forms when phase separation takes place, we find that the cluster is composed of regions that resemble a square crystal. These regions are separated from one another by linear defects. See Fig. 5(a) for a closeup of such a cluster. Here, individual particles are coloured according to the absolute value of the bond orientational parameter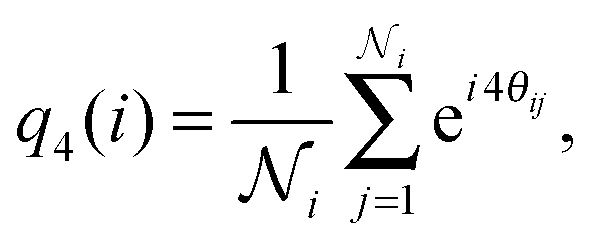 | (6) |
 is the total number of neighbors of particle i, and θij is the angle between the vector ri − rj and an arbitrary lab axis. Neighboring particles are defined such that their center-to-center distance is smaller than 1.5σ. This bond order parameter detects local four-fold symmetry in the neighborhood of each particle.
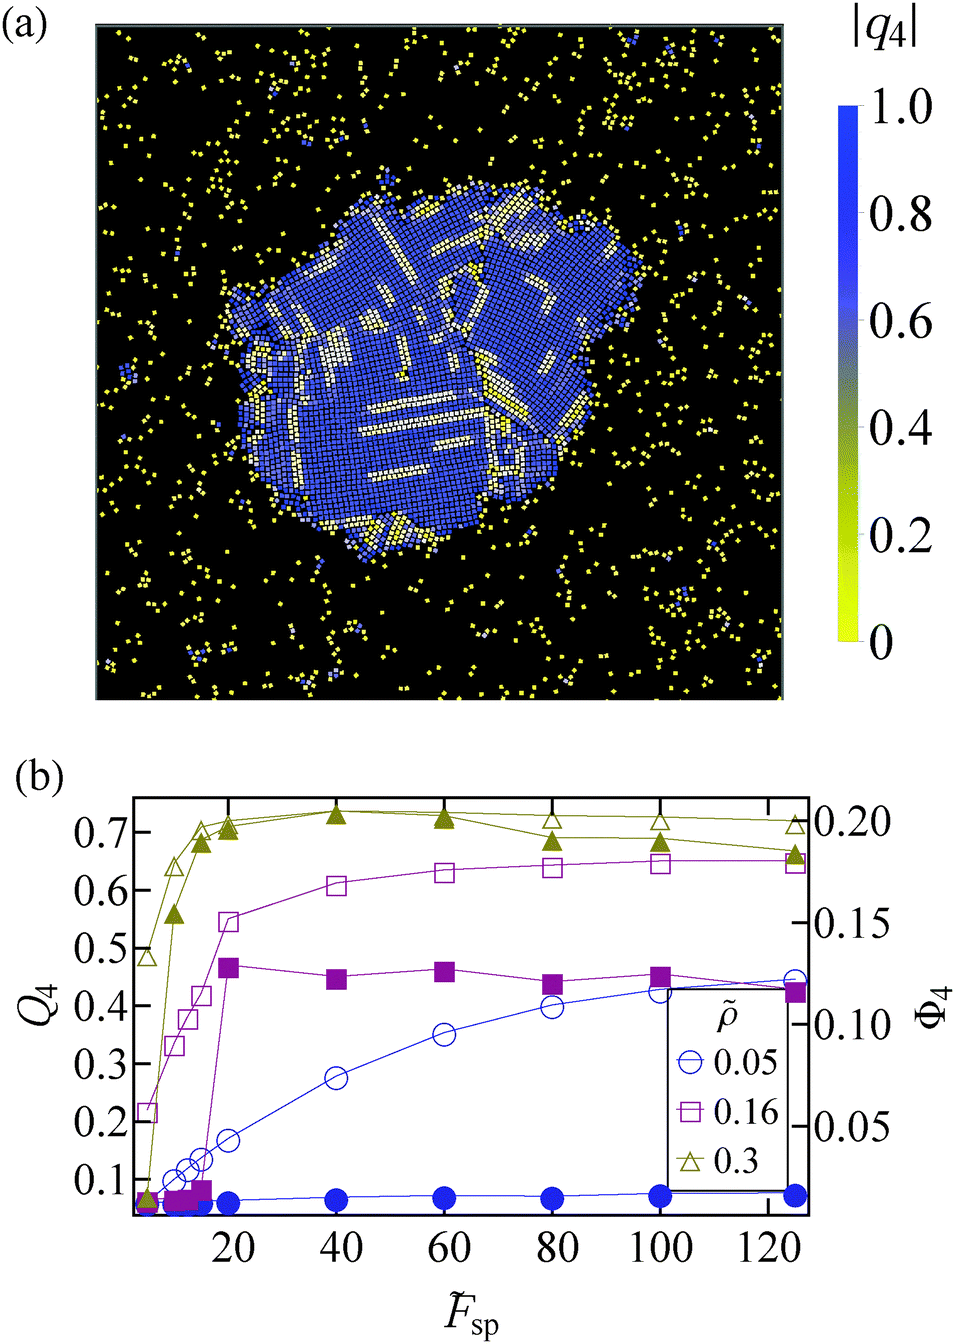 | ||
| Fig. 5 (a) Snapshot of the system for = 0.18 and sp = 60. Particles are coloured according to their |q4| value. (b) Average local order parameter Q4 (open symbols) and global orientational parameter Φ4 (full symbols) as a function of sp for various system densities. Lines are simply guides to the eye. | ||
In Fig. 5(b) we plot the bond orientational order averaged over all particles and many independent configurations
 | (7) |
 | (8) |
We now study the local densities of the coexisting phases in the phase coexistence regime. We determine the densities of the two phases by identifying the peaks of the local density histogram of the system (not shown here), similar to previous studies of active matter systems.30,39 The local densities for the fluid (ρg) and the crystalline region (ρx) are plotted in Fig. 6. This figure suggests that the magnitude of self-propulsion alone determines the time averaged local densities of the dense and dilute phases, irrespective of the total system density. This property also holds for the motility induced phase separation of active disks and the liquid–gas coexistence of attractive particles.30,39 However, self-propelled squares pack better than self-propelled disks as the squares assemble in a square crystal rather than a hexagonal crystal. We would like to note that the seemingly lower values of the densities of the crystalline phase compared to the values reported for passive squares (ref. 32) do not necessarily imply a less efficient packing of self-propelled squares. The lower values are in fact caused by the range of our soft repulsive potential.
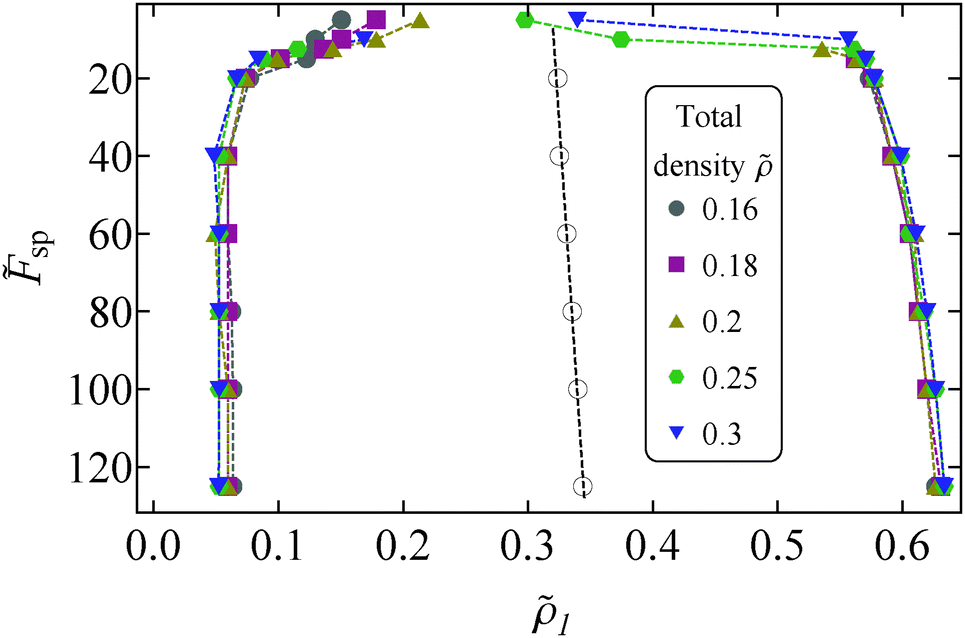 | ||
| Fig. 6 Local densities l = ρlσ2 of the coexisting phases in the phase separation regime for different magnitudes of self-propulsion sp. Data points correspond to the maxima of the local density histograms and different symbols refer to different total densities. Black open circles denote the mean of the two coexisting densities (ρx + ρg)/2 and the black dotted line is a linear fit. Coloured dotted lines are guides to the eye. Note that the vertical of this plot is inversed with respect to Fig. 2. | ||
Moreover, in Fig. 6 we plot (ρx + ρg)/2 averaged over the different system densities. We find that, away from the critical point, this quantity follows linear scaling as a function of self-propulsion magnitude sp. This linear scaling is also found in equilibrium systems, where it is known as the law of rectilinear diameters.40 Close to the critical point, we cannot safely determine the local densities of the coexisting phases, as the peaks of the local density histograms flatten due to fluctuations in the density.
We have checked that the qualitative properties of the system remain the same for various system sizes. In particular, we have simulated a small number of the parameter space points for systems of 2500 and 8000 particles and found that the resulting state diagrams and coexisting densities remain essentially unchanged.
Moreover, we have also performed simulations for dense systems ( = 0.55 and 0.6) for a limited number of self-propulsion magnitudes sp. We have validated that the local density of the dense phase for these simulations remains in close proximity with the values found in the simulations of more dilute systems. Hence, the high density part of the envelope shown in Fig. 6, which would correspond to a binodal envelope in an equilibrium system, is indeed collapsing onto one curve.
C. Oscillatory regime
In Fig. 7 we show a time series of snapshots of a system in the oscillatory regime. In each snapshot we superimpose the displacement field, unnormalized by density. To calculate this field, we divided the simulation box into a square lattice of cell length 7σ, and summed the displacement of the particles in each cell, see eqn (4). Note that we have ignored the contribution from translational diffusion.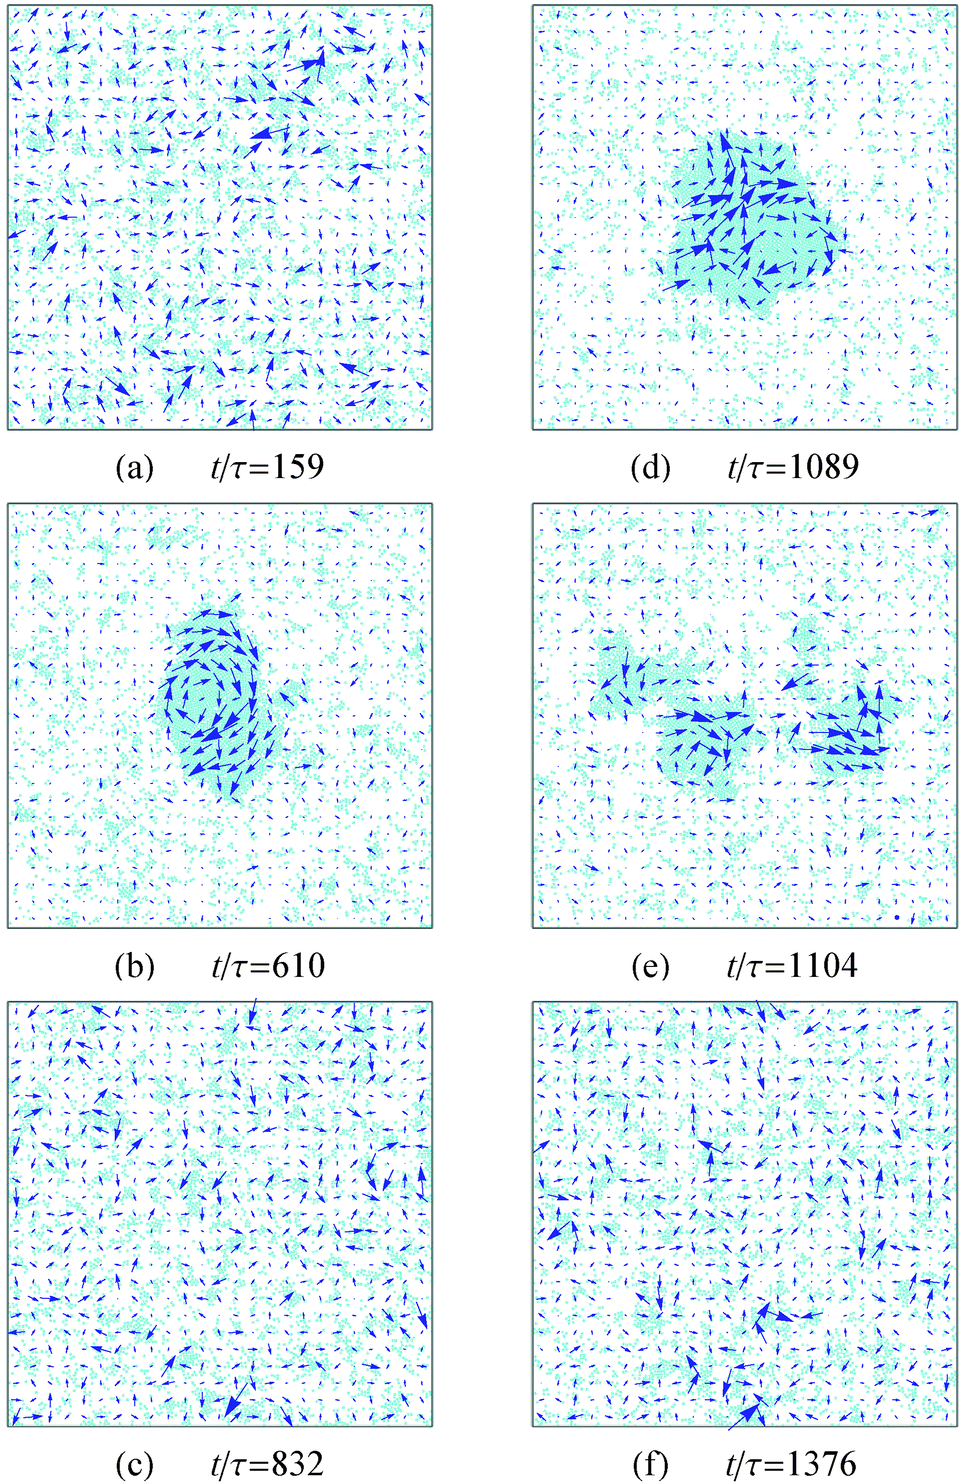 | ||
| Fig. 7 Snapshots of the system at different times. The arrows indicate the direction and relative magnitude of the displacement field. The parameters for this system are = 0.14 and sp = 100. | ||
This figure shows two instances where the system transitions from a homogeneous fluid to a phase coexistence and back to the fluid. The two snapshots that show phase coexistence (t/τ = 610, 1089) are taken slightly before the largest cluster breaks apart. In these two subfigures the displacement field clearly shows collective rotation of the cluster and formation of vortices. Inspection of the majority of breaking events in the simulations, using the displacement field as a guide for the collective dynamics, reveals that rotation of the cluster is a general feature that precedes cluster destruction. Note that the packing of squares in the crystalline clusters of the oscillatory regime is similar to the phase separated regime as described in Section III B. That is, all clusters are composed of square crystalline domains. Also, the local densities of the clusters in the oscillatory regime have similar values to the local densities in Fig. 6, which correspond to the phase separated regime.
In an effort to quantify and understand the destruction of a large cluster, we plot three different quantities in Fig. 8: the fraction of particles belonging to the largest cluster flc, the angular momentum Llc of the largest cluster and the total potential energy of the system Utot. The angular momentum Llc(t) is given by
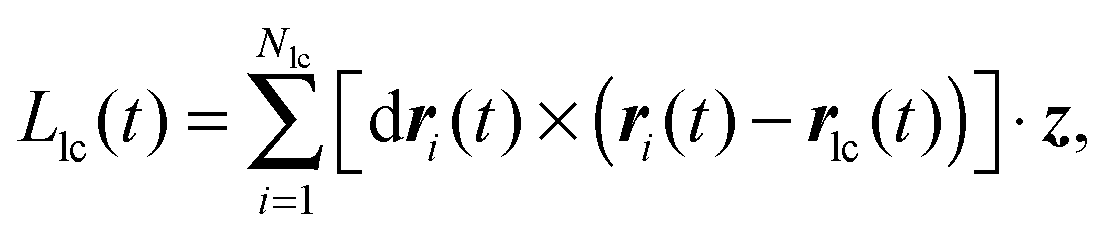 | (9) |
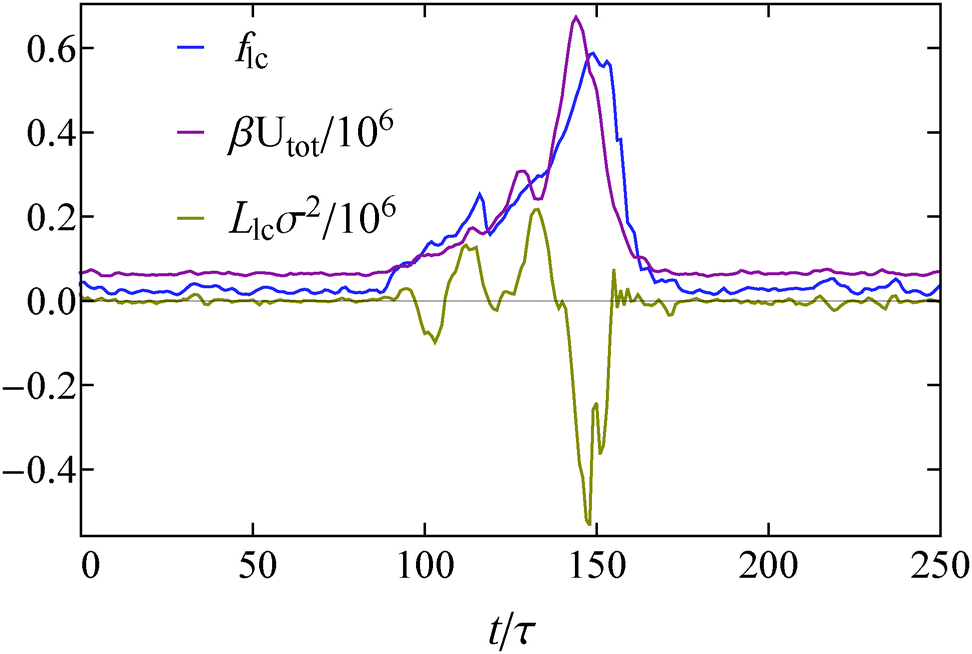 | ||
| Fig. 8 Time evolution of the degree of clustering flc, the total potential energy of the system Utot and the angular momentum of the system's largest cluster Llc during nucleation, growth and destruction of a cluster (for this system = 0.14 and sp = 100). | ||
In Fig. 8 we see that the growth of a cluster (growth of flc) is accompanied by an oscillation of its angular momentum. When the cluster obtains its maximum size, the angular momentum also has a maximum in its absolute value. The growth of the cluster also causes a sharp increase in the potential energy of the system. This increase indicates that strong forces are present in the interior of the formed cluster. Afterwards, the cluster swiftly disintegrates (flc ≃ 0) and the potential energy of the system returns to low values. We stress that the features shown in the plot and described above hold in general for all the nucleation and breaking events we studied.
The above results lead us to the following picture for the clustering of active squares in the oscillatory and phase coexistence regime: once a small cluster appears, it keeps growing by absorbing the incoming particles from the gas. Naturally, the particles that attach to the cluster will have on average their axes of self-propulsion pointing at the center of the cluster. However, since the square particles that belong to the cluster cannot change their orientation, the anisotropy of forces will eventually create one (Fig. 7(b)) or more (Fig. 7(d)) vortices that rotate the cluster as a whole.
Once a vortex appears, particles relocate and are free to collectively escape the cluster in large groups. In the oscillatory regime, the remaining pieces of the cluster may disintegrate completely so that the system returns to a homogeneous state, while in the phase coexistence regime at least one cluster survives due to the fast absorption of gas particles.
The behaviour of the squares can be contrasted with the behaviour of active disks, where no oscillations have been reported. In the case of disks, the particles that accumulate at the surface of a cluster also point towards the center of the cluster, but can leave the cluster once their axis of self-propulsion points outwards due to rotational diffusion. The cluster is then stabilized by an influx and outflux of particles at its surface.30 Moreover, particles in the inner layers can relax their orientation and hence no large torques accumulate. On the other hand, squares in the cluster are unable to rotate freely due to interactions with neighboring particles. This leads to accumulating internal forces and torques that rotate and eventually destabilize the cluster.
Oscillations between states have also been found in other active systems. Self-propelled dumbbells show very similar behaviour, and close to the binodal lines this system continuously moves from a clustered state to a uniform state.27 Furthermore, a system of self-propelled rods can also oscillate between an orientationally ordered state (phase coexistence between a band-like structure with nematic order and a uniform, low density fluid) and an aggregated state (phase coexistence between a dense cluster with no global orientational order and a fluid).38 Also, when the aggregated state is stable, large polar clusters continuously escape the cluster. What is common in the aforementioned systems and the system of self-propelled squares is that once an orientationally disordered aggregate forms, large stresses develop due to the inability of the clustered particles to relax their orientation. These large stresses will induce either the destruction of the aggregate, or the constant ejection of large groups of particles. As mentioned in ref. 38, the presence of large stresses and oscillations is not consistent with the phase separation of self-propelled disks, which is well captured by a classical description.
An open question, with regard to the state oscillations in all the aforementioned systems, is whether there is a characteristic frequency related to these oscillations. To fully answer such a question, one would have to study the time evolution of a system in the oscillatory regime (see for example Fig. 4) for a long period, which is currently outside of our computational capabilities. However, it should be noted that our system did not oscillate between two clearly distinctive states, but rather the crystalline cluster disintegrates at disparate stages of the growth process. This is evident in Fig. 4(a), as the height of the different peaks, which corresponds to different cluster sizes, differs significantly for different disintegration points. Our results suggest that there is a broad distribution of phase separated states, which leads to cluster disintegration and that, in all likelihood, the oscillations are not associated with a characteristic frequency.
D. Coarsening
As we have already seen in Section III B, in the phase coexistence region we find static statistical properties similar to the properties of self-propelled disks and equilibrium systems. On the other hand, in Section III C, the study of the cluster dynamics demonstrated striking differences between self-propelled squares and disks. The differences in cluster dynamics motivate us to study the coarsening dynamics. Our main tools for this study are the structure factor S(k) and the averaged cluster size 〈Ncs〉. S(k) is the orientation average of the full structure factor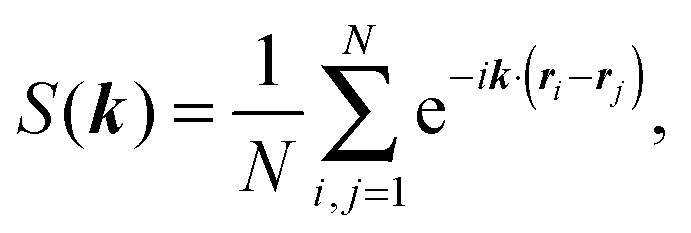 | (10) |
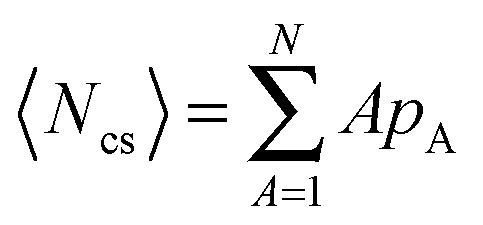 , where pA is the normalized probability of finding a cluster of size A in the system.
To achieve better statistics and longer coarsening times, we used a system of 250000 particles. Then, we compute the characteristic domain length Ld(t)31 using
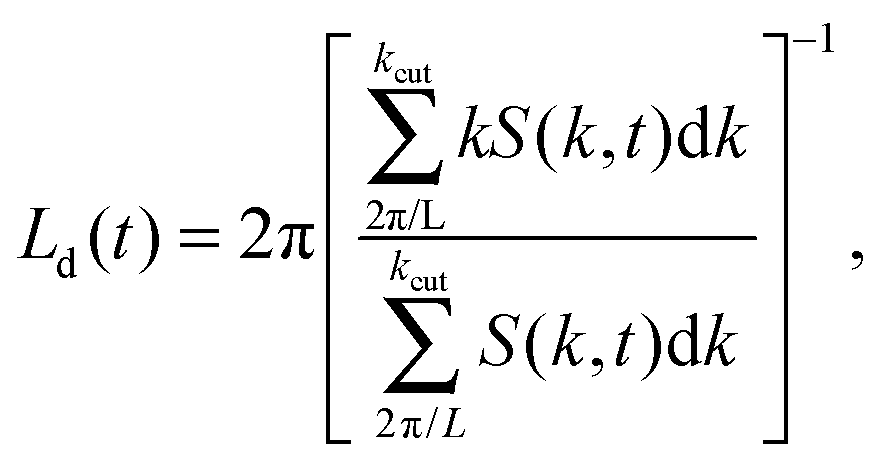 | (11) |
Using the structure factor and the characteristic domain length we test the dynamic scaling hypothesis for our system.41,42 According to this hypothesis, in two dimensions, the time behavior of the structure factor in the coarsening regime follows from the relation
| S(k,t) = [Ld(t)]2f(kLd), | (12) |
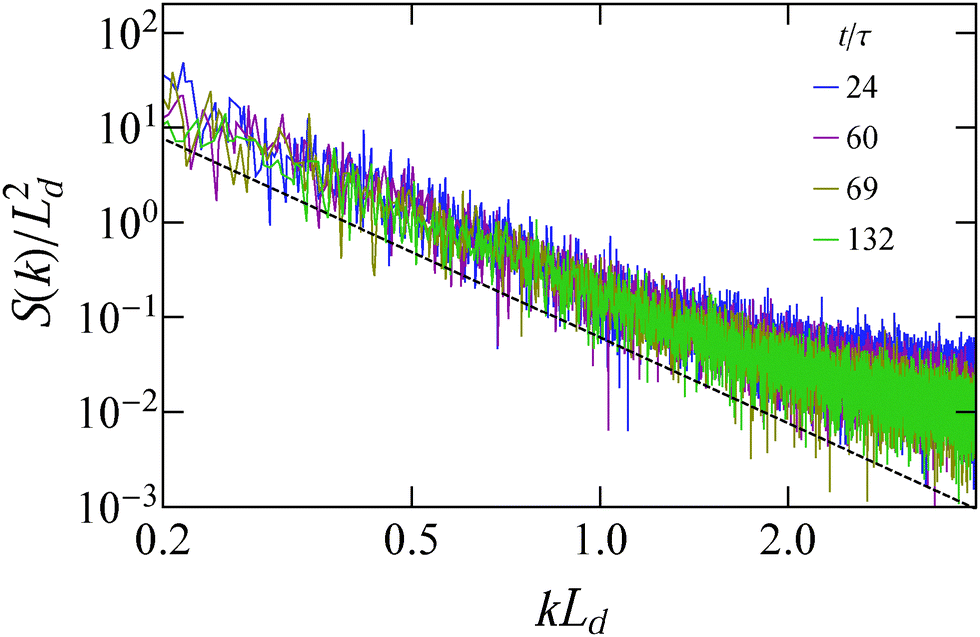 | ||
| Fig. 9 Scaled structure factor S(k)/Ld2 as a function of kLd for different time instances. The black dashed line follows the scaling k−3. For this system = 0.2 and sp = 80. | ||
We also study the coarsening dynamics by following the average cluster size 〈Ncs〉 with time, shown in Fig. 10. This figure shows that cluster coarsening scales slightly faster than t, up to the latest times we could simulate, and surpasses the t1/2 scaling that active disks30 and polar systems43 show. We have verified that the same super-diffusive coarsening scaling holds for other parameter space points. We speculate that the rapid coarsening might be caused by the peculiar dynamics of the individual clusters, as the clusters, apart from continuously breaking apart and reassembling, also move in space (see the ESI†). This movement boosts the frequency of cluster collisions. The two aforementioned effects may cause a ballistic growth of the average cluster size for all time scales we examined.
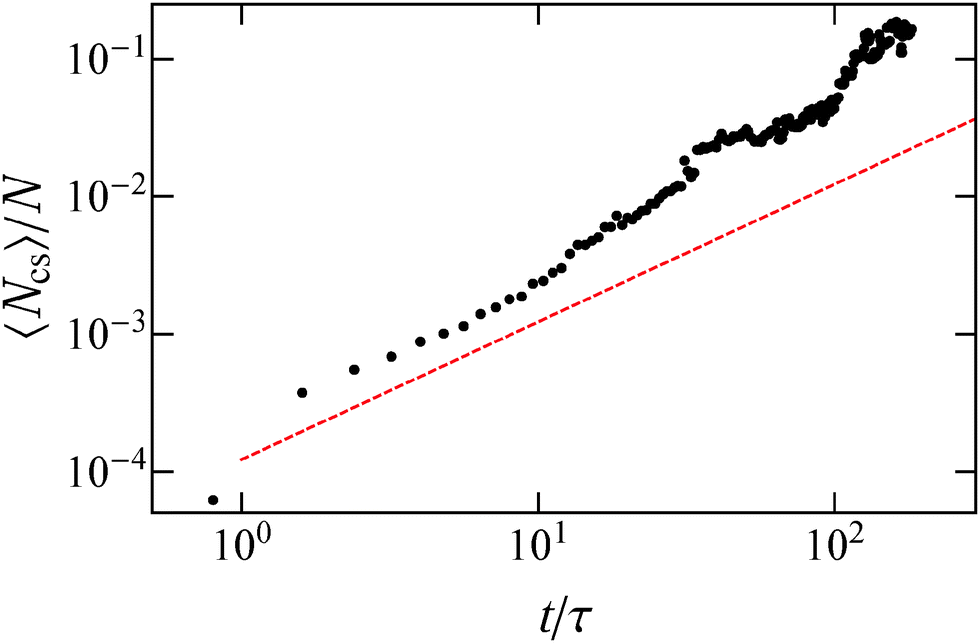 | ||
| Fig. 10 Evolution of the average cluster size 〈Ncs〉 with time. The red dashed line scales as t. For this system = 0.2 and sp = 80. | ||
However, we would like to note that our results may be limited due to the finite size of our system, and in the infinite system size limit one may recover the scaling t1/2 for late times that should hold for diffusive systems with no hydrodynamic interactions, for example, a system of passive Brownian particles or self-propelled particles with no aligning interactions.44 Thus, further study needs to be done in this aspect.
IV. Conclusions and outlook
We have studied the state behaviour of self-propelled Brownian squares using computer simulations. We find that for low densities and slow swimming speeds the system is in a uniform fluid phase, while for high densities and fast swimmers the system phase separates into a high density and a low density phase. In between these two regimes, there is a third regime where the system oscillates continuously between the two aforementioned states.By studying the phase coexistence regime, we found that the dense phase is made of square crystalline domains and that the time averaged local densities of the coexisting crystal and fluid are independent of the overall system density. Next, we demonstrated that the rupture of a crystalline cluster in the oscillatory regime is accompanied by a rotational motion of the cluster. This rotation originates from the large stresses that are developed in the interior of the cluster. Furthermore, we find that the system coarsens at a much faster rate than a purely diffusive system, which may be caused by the intriguing dynamics of individual clusters.
Comparing our results with existing literature for self-propelled disks, we discover that the two systems share many similarities, as they both undergo phase separation due to a kinetic trapping mechanism and the coexisting local densities are a function of the swimming speed alone. However, there are also striking differences, including the oscillatory regime and the fast, super-diffusive coarsening rates, which are possibly caused by the large stresses developed in a crystalline cluster of self-propelled squares.
The peculiar dynamics of clusters formed by self-propelled squares are also similar to the dynamics found in systems of self-propelled dumbbells and rods, as system spanning clusters can continuously form and disintegrate, and large groups of particles can frequently escape the main cluster. Future work should look into the stability of this oscillatory behaviour in the infinite system size limit, as well as measuring a possible periodicity of such clustering and disintegration events. Lastly, a more detailed comparison between the dynamic behaviour of different self-propelled and anisotropic particles may shed light on the universal features of the coarsening dynamics and the state behaviour near the phase separation regime.
Acknowledgements
V. P. and L. F. acknowledge funding from the Dutch Sector Plan Physics and Chemistry, and L. F. acknowledges financial support from the Netherlands Organization for Scientific Research (NWO-VENI grant No. 680.47.432). S. S. acknowledges funding from the European Union's Horizon 2020 research and innovation programme under the Marie Skłodowska-Curie grant agreement No. 656327. The authors would like to thank Bram Bet for providing the value of the rotational diffusion coefficient for a square particle, and Siddharth Paliwal, Berend van der Meer and Frank Smallenburg for careful reading of the manuscript.References
- S. Ramaswamy, Annu. Rev. Condens. Matter Phys., 2010, 1, 323 CrossRef.
- P. Romanczuk, M. Bär, W. Ebeling, B. Lindner and L. Schimansky-Geier, Eur. Phys. J.: Spec. Top., 2012, 202, 1 CrossRef CAS.
- M. Marchetti, J. Joanny, S. Ramaswamy, T. Liverpool, J. Prost, M. Rao and R. A. Simha, Rev. Mod. Phys., 2013, 85, 1143 CrossRef CAS.
- W. F. Paxton, K. C. Kistler, C. C. Olmeda, A. Sen, S. K. St. Angelo, Y. Cao, T. E. Mallouk, P. E. Lammert and V. H. Crespi, J. Am. Chem. Soc., 2004, 126, 13424 CrossRef CAS PubMed.
- R. Dreyfus, J. Baudry, M. L. Roper, M. Fermigier, H. A. Stone and J. Bibette, Nature, 2005, 437, 862 CrossRef CAS PubMed.
- J. R. Howse, R. A. Jones, A. J. Ryan, T. Gough, R. Vafabakhsh and R. Golestanian, Phys. Rev. Lett., 2007, 99, 048102 CrossRef PubMed.
- Y. Hong, N. M. Blackman, N. D. Kopp, A. Sen and D. Velegol, Phys. Rev. Lett., 2007, 99, 178103 CrossRef PubMed.
- J. Deseigne, O. Dauchot and H. Chaté, Phys. Rev. Lett., 2010, 105, 098001 CrossRef PubMed.
- A. Kudrolli, G. Lumay, D. Volfson and L. S. Tsimring, Phys. Rev. Lett., 2008, 100, 058001 CrossRef PubMed.
- V. Schaller, C. Weber, C. Semmrich, E. Frey and A. R. Bausch, Nature, 2010, 467, 73 CrossRef CAS PubMed.
- G. Volpe, I. Buttinoni, D. Vogt, H.-J. Kümmerer and C. Bechinger, Soft Matter, 2011, 7, 8810 RSC.
- J. Palacci, S. Sacanna, A. P. Steinberg, D. J. Pine and P. M. Chaikin, Science, 2013, 339, 936 CrossRef CAS PubMed.
- A. Bricard, J.-B. Caussin, N. Desreumaux, O. Dauchot and D. Bartolo, Nature, 2013, 503, 95 CrossRef CAS PubMed.
- T. Vicsek, A. Czirók, E. Ben-Jacob, I. Cohen and O. Shochet, Phys. Rev. Lett., 1995, 75, 1226 CrossRef CAS PubMed.
- R. Wittkowski, A. Tiribocchi, J. Stenhammar, R. J. Allen, D. Marenduzzo and M. E. Cates, Nat. Commun., 2014, 5, 4531 Search PubMed.
- C. Reichhardt and C. O. Reichhardt, Phys. Rev. E: Stat., Nonlinear, Soft Matter Phys., 2015, 91, 032313 CrossRef CAS PubMed.
- C. Maggi, U. M. B. Marconi, N. Gnan and R. Di Leonardo, Sci. Rep., 2015, 5, 10742 CrossRef PubMed.
- A. Solon, Y. Fily, A. Baskaran, M. Cates, Y. Kafri, M. Kardar and J. Tailleur, Nat. Phys., 2015, 5, 673 CrossRef.
- L. Baraban, M. Tasinkevych, M. Popescu, S. Sanchez, S. Dietrich and O. Schmidt, Soft Matter, 2011, 8, 48 RSC.
- N. Koumakis, A. Lepore, C. Maggi and R. Di Leonardo, Nat. Commun., 2013, 4, 2588 CAS.
- F. C. Keber, E. Loiseau, T. Sanchez, S. J. DeCamp, L. Giomi, M. J. Bowick, M. C. Marchetti, Z. Dogic and A. R. Bausch, Science, 2014, 345, 1135 CrossRef CAS PubMed.
- C. Bechinger, R. Di Leonardo, H. Löwen, C. Reichhardt, G. Volpe and G. Volpe, 2016, arXiv:1602.00081.
- F. Kümmel, B. ten Hagen, R. Wittkowski, I. Buttinoni, R. Eichhorn, G. Volpe, H. Löwen and C. Bechinger, Phys. Rev. Lett., 2013, 110, 198302 CrossRef PubMed.
- J. Schwarz-Linek, C. Valeriani, A. Cacciuto, M. Cates, D. Marenduzzo, A. Morozov and W. Poon, Proc. Natl. Acad. Sci. U. S. A., 2012, 109, 4052 CrossRef CAS PubMed.
- F. Peruani, A. Deutsch and M. Bär, Phys. Rev. E: Stat., Nonlinear, Soft Matter Phys., 2006, 74, 030904 CrossRef PubMed.
- B. Ten Hagen, F. Kümmel, R. Wittkowski, D. Takagi, H. Löwen and C. Bechinger, Nat. Commun., 2014, 5, 4829 CrossRef CAS PubMed.
- A. Suma, G. Gonnella, D. Marenduzzo and E. Orlandini, EPL, 2014, 108, 56004 CrossRef.
- Y. Yang, V. Marceau and G. Gompper, Phys. Rev. E: Stat., Nonlinear, Soft Matter Phys., 2010, 82, 031904 CrossRef PubMed.
- Y. Fily and M. C. Marchetti, Phys. Rev. Lett., 2012, 108, 235702 CrossRef PubMed.
- G. S. Redner, M. F. Hagan and A. Baskaran, Phys. Rev. Lett., 2013, 110, 055701 CrossRef PubMed.
- J. Stenhammar, D. Marenduzzo, R. J. Allen and M. E. Cates, Soft Matter, 2014, 10, 1489 RSC.
- C. Avendaño and F. A. Escobedo, Soft Matter, 2012, 8, 4675 RSC.
- J. B. Hubbard and J. F. Douglas, Phys. Rev. E: Stat. Phys., Plasmas, Fluids, Relat. Interdiscip. Top., 1993, 47, R2983 CrossRef CAS.
- B. Bet, G. Boosten, M. Dijkstra and R. van Roij, 2016, arXiv:1603.02629.
- D. Higham, SIAM Rev., 2001, 43, 525 CrossRef.
- B. M. Mognetti, A. S Šarić, S. Angioletti-Uberti, A. Cacciuto, C. Valeriani and D. Frenkel, Phys. Rev. Lett., 2013, 111, 245702 CrossRef CAS PubMed.
- H. H. Wensink, J. Dunkel, S. Heidenreich, K. Drescher, R. E. Goldstein, H. Löwen and J. M. Yeomans, Proc. Natl. Acad. Sci. U. S. A., 2012, 109, 14308 CrossRef CAS PubMed.
- S. Weitz, A. Deutsch and F. Peruani, Phys. Rev. E: Stat., Nonlinear, Soft Matter Phys., 2015, 92, 012322 CrossRef PubMed.
- V. Prymidis, H. Sielcken and L. Filion, Soft Matter, 2015, 11, 4158 RSC.
- S. Reif-Acherman, Quim. Nova, 2010, 33, 2003 CrossRef CAS.
- P. M. Chaikin and T. C. Lubensky, Principles of condensed matter physics, Cambridge Univ Press, 2000, vol. 1 Search PubMed.
- A. J. Bray, Adv. Phys., 2002, 51, 481 CrossRef.
- S. Dey, D. Das and R. Rajesh, Phys. Rev. Lett., 2012, 108, 238001 CrossRef PubMed.
- F. Peruani and M. Baer, New J. Phys., 2013, 15, 065009 CrossRef.
Footnote |
| † Electronic supplementary information (ESI) available. See DOI: 10.1039/c6sm00347h |
| This journal is © The Royal Society of Chemistry 2016 |