 Open Access Article
Multiscale modeling of aspirin dissolution: from molecular resolution to experimental scales of time and size
Maximilian
Greiner
,
Carsten
Choscz
,
Cornelia
Eder
,
Ekaterina
Elts
and
Heiko
Briesen
*
Chair for Process Systems Engineering, Technische Universität München, Freising 85354, Germany. E-mail: Heiko.Briesen@mytum.de
First published on 14th June 2016
Abstract
This paper presents a multiscale modeling approach for the dissolution of aspirin. Recent advances in multiscale simulation techniques are reviewed, and the need to derive absolute rate constants in order to predict dynamic properties during crystal growth or dissolution is highlighted. Absolute face-specific rate constants obtained in our recent study on molecular dynamics and kinetic Monte Carlo simulations are incorporated in a simulation based on the equations of classical mass transfer. As experimental reference, a Jamin-type interferometer is used to monitor the face displacement velocity and concentration gradient within the bulk liquid. An experimental setup that is consistent with the simulation settings to monitor crystal dissolution, based on a non-saturated resultant solution, is chosen. The face displacement velocity of the investigated (001) face as well as the final average concentration of aspirin in water are found to be in good agreement with the experimental data. The dissolution mechanism of aspirin is found to be diffusion-controlled in both the simulation and experiment. Furthermore, a method to predict all experimental and literature values used in the study, such as diffusion coefficients and solubilities, is presented.
1 Introduction
The scales of interest when modeling crystal growth and dissolution are microscopic (which concerns crystal packing, (dis)integration of molecules, and diffusion of molecules), mesoscopic (which concerns crystal surface structures, and dissolution mechanisms), and macroscopic (which concerns face displacement, concentration effects, and crystal morphology). The simulation methods corresponding to these scales are ab initio and classical molecular dynamics, kinetic Monte Carlo (kMC), and continuum simulation approaches, respectively. A review of the basics of modeling crystallization processes over various scales and a short introduction into the relevant simulation methods and experimental techniques can be found in Lovette et al.1 In the current report, we present a short overview of recent studies on each scale, followed by a presentation of our work that concerns the merging of the different-scale simulation techniques into a single multiscale simulation framework.Much progress has been made in molecular simulations in recent years, especially in the field of crystal dissolution. The novel concept of dissolution of a three-dimensional nanocrystal (in contrast to established periodic crystal surface simulations) was first published by Gao and Olsen2 in 2013. In their study on acetaminophen, the crystal was dissolved predominately from the corners and edges. The total size of the crystal, however, was too small to maintain bulk stability until the end of the simulation. Holmberg et al.3 followed the same nanocrystal approach and modeled the dissolution of a NaCl crystal using ab initio molecular dynamics simulations.
We have previously studied the dissolution of an aspirin nanocrystal,4 whereby the crystal morphology was in agreement with experimental findings5,6 and theoretical predictions.7 Force field parameters were evaluated to accurately predict the properties of aspirin.8 Sticky dummy atoms were introduced into the system to remove dissolved aspirin molecules from the solution. This setup enabled us to monitor continuous dissolution of the aspirin crystal, and thus, allowed for proper study of the dissolution events.
kMC simulations are the method of choice for the mesoscale modeling of dissolution and growth. Chen et al.9 determined the energy barriers for the dissolution of Na+ and Cl− ions using ab initio molecular dynamics simulations and incorporated these rates into a kMC simulation scheme. The size of the dissolving NaCl crystal in the kMC simulations clearly exceeded that of the crystal simulated using ab initio methods by Holmberg et al.3 kMC simulations were also used by Nayhouse et al.10 to investigate the growth and size distribution of ibuprofen crystals. In contrast to the previous studies, the rate constants were fitted to experimental results. Further, the extended scales of kMC simulations allowed the study of the influence of growth rate dispersion. Kurganskaya and Luttge11 successfully modeled the etching of single quartz crystal faces with a special focus on the required system size, model complexity, and parametrization.
On the macroscopic scale, Agrawal12 modeled crystallization of lactose monohydrate in an industrial-scale evaporative crystallizer. A population balance model was used to determine the growth of the crystals, and the growth kinetics were taken from experimental literature data. Boetker et al.13 used UV-vis measurement techniques to study the bulk concentration and dissolution rate of acetaminophen in a flow-through cell. Modeling the experimental setup using a continuum approach accounting for convection, diffusion, and dissolution allowed the authors to investigate conditions that are difficult to access experimentally.
Both these macroscopic simulations relied on experimental data; thus, the derivation of a predictions for novel compounds still presents a major obstacle. Multiscale modeling approaches are promising methods to determine material properties from the molecular level up to the macroscopic level, e.g., to predict macroscopic dissolution properties.
Significant steps toward the multiscale modeling of crystallization have been presented in studies conducted by Piana and co-workers.14–16 Urea was used as a model system to investigate the growth of a crystal from solution at the atomistic scale. Mesoscopic simulations were performed using kMC techniques to study the influences of screw dislocations and the effect of surface roughening. Finally, the kMC rates were successfully used to model the morphology of a real urea crystal.
Predicting crystal morphology is significant for various industrial applications. With the rate constants being determined as relative rate constants, however, the model is still restricted in its applicability. Process time is an important factor in predicting crystallization processes, which demands that kinetic information is correctly accounted for. Furthermore, dissolution properties are predicted primarily based on solubility considerations, with time-scale considerations being largely ignored.
In order to derive absolute rate constants and investigate the kinetic properties of dissolution, Elts et al.17 used a predictor–corrector filtering scheme to count only the relevant state transitions. Natural fluctuations due to the thermal motion of the molecules were excluded by following this approach. Further refinement of the state identification and determination of rate constants were applied in later work.18 The scheme was extended from periodic surfaces to three-dimensional nanocrystals. The same publication presented kMC simulations for crystal dissolution, which revealed the same dissolution mechanism as that observed experimentally,6,19i.e., terrace sinking on the (100) face and receding step edges on the (001) face. Comparison with absolute rate constants, however, is difficult as there is no experimental reference that allows for the comparison of their predicted dissolution velocities.
Eder et al.20 presented a study in which a Jamin-type interferometer was employed as a valuable tool for monitoring crystal growth. Their report not only presented face-specific growth kinetics for sucrose and lactose, but also an automated image analysis procedure. The experimental setup was also found to be suitable for monitoring the dissolution of compounds if the initial concentration in the solvent is below saturation. Due to the known crystal morphology, the simple geometry, and the stagnant solvent, the process of dissolution can be modeled without overlaying the effects of convection. With a model describing concentration-dependent dissolution of aspirin based on molecular simulation results, the gap between microscopic and mesoscopic simulations and macroscopic properties can be closed.
This paper presents the transfer of mesoscopic information obtained through kMC simulations to the macroscopic level. Interferometer measurements on the macroscopic scale can serve as a tool to validate the predictions on the molecular scale and the mesoscale (Fig. 1). With this last step, a multiscale method to derive and validate absolute face-specific dissolution rates for active pharmaceutical ingredients is presented. The scales covered are from the molecular scale, i.e., angstroms, to the millimeter size of experimentally observed crystals. Time scales from picoseconds to hours are covered, and are thus sufficient for modeling realistic applications. In contrast to the current practice of evaluating only the solubility of novel drug candidates, this method extends the in silico screening possibilities for pharmaceutical compounds to kinetic effects.
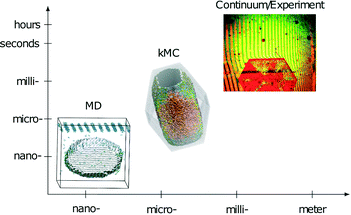 | ||
| Fig. 1 Schematic representation of time- and length-scales of the simulation techniques and experiments combined in the presented multiscale approach. | ||
The rest of the paper is outlined as follows: in section 2, the model for simulating the dissolution of aspirin in the interferometer device is derived. In section 3, the simulation and experimental details are presented. In section 4, the simulation results are presented, a suitable size of the measurement chamber is derived from the rate constants based on the molecular simulations, experimental results are given and compared with simulation data, and the sensitivity of the model parameters is evaluated. Section 5 summarizes the findings and provides an outlook for future work.
2 Model description
A mathematical model to describe the diffusion of aspirin in the solvent can be expressed as | (1) |
Finding a unique solution requires an initial condition for the aspirin concentration in the bulk c, which is zero for pure water:
| c(x,t = 0) = 0. | (2) |
The model also requires boundary conditions for the measurement chamber walls and on the crystal surface. On the walls of the dissolution chamber, the flux in and out of the domain is zero. This is represented by the Neumann boundary condition:
 | (3) |
 | (4) |
 for a specific temperature including the exponential factor) and the order of the growth process gj, as well as the ideal gas constant R, the temperature T, and the activation energy ΔEA,j.
The order of the growth process accounts for a diffusion- or dissolution-controlled process, as only the bulk concentration is considered. When directly considering the concentration on the crystal surface, disintegration and diffusion can be split into two processes. The process of diffusion is already covered by the PDE in eqn (1). For the process of aspirin disintegration from the crystal a boundary condition can be set that evaluates the surface concentration csurf,j(t) instead of the bulk concentration. Thus, there is no need to explicitly distinguish between disintegration and diffusion in eqn (4) and g can be set to 1. Thus, the face displacement velocity becomes
 | (5) |
 can be obtained from combined molecular dynamics4 and kMC18 simulations. In the molecular model, dissolved molecules were removed from the system to ensure for constant undersaturation in the system. The concentration of solution-like aspirin molecules,17,18i.e. dissolved aspirin molecules on the crystal surface (csurf,j), was thus considered to be zero. With a surface concentration of zero at t = 0, the initial value for the face displacement velocity of a face j can be taken directly as calculated in the kMC simulations denoted as vkMC,j.18 Consequently, from eqn (5) one obtain:
 | (6) |
 | (7) |
Explicitly calculating the face displacement of complex geometries such as crystals considerably lowers the stability of the numerical simulations. Therefore, the average face displacement velocity was obtained from the total flux of aspirin over the respective crystal surface  . The equivalent parallel displacement of the crystal face j can then be obtained from
 | (8) |
3 Material and methods
3.1 Simulation
A simulation of the dissolution of an aspirin crystal in an interferometric device measurement chamber was performed using COMSOL Multiphysics version 5.0.22 The model was implemented as a reaction–diffusion model according to the model equation (see eqn (1)) with the corresponding boundary conditions as given in eqn (3) and (7). The face displacement velocities were calculated according to the flux over the system boundaries, without explicitly applying moving boundary conditions (see eqn (8)).Table 1 lists the geometric parameters for constructing the aspirin crystal and the measurement chamber, the applied meshing properties, and the model parameters. The crystal was placed at the center of a cuboid representation of the experimental measurement chamber. The computational mesh was created using free tetrahedrals. The size of the tetrahedrals was chosen such that the obtained results were independent of the meshing parameters. The final set of applied meshing parameters in the domain is given in Table 1. On the boundaries of the aspirin crystal, the maximum element size was five times smaller than that in the domain. All further meshing parameters were identical between the crystal surface and the diffusion domain. The model parameters for the face displacement velocities were taken from our previous publication.18 The diffusion coefficient and solubility were taken from literature and were additionally predicted using molecular dynamics simulations and COSMO-RS, respectively.
| Meshing parameters | |||
|---|---|---|---|
| Description | Value | Units | |
| Maximum element size | 0.72 | mm | |
| Minimum element size | 0.031 | mm | |
| Maximum growth rate | 1.35 | ||
| Curvature factor | 0.3 | ||
| Resolution narrow regions | 0.85 | ||
| Model parameters | |||
|---|---|---|---|
| Description | Symbol | Value | Units |
| Face displacement velocity (100)b | v kMC,(100) | 3.10 × 10⁻⁸ | m s−1 |
| Face displacement velocity (110)b | v kMC,(110) | 3.89 × 10⁻⁷ | m s−1 |
| Face displacement velocity (011)b | v kMC,(011) | 3.32 × 10⁻⁷ | m s−1 |
| Face displacement velocity (001)b | v kMC,(001) | 2.58 × 10⁻⁶ | m s−1 |
| Experimental diffusion coefficient 35 °Cc | D 35°C | 11.5150 × 10⁻⁶ | cm2 s−1 |
| Predicted diffusion coefficient 37 °C | D 37°C,MD | 13.7268 × 10⁻⁶ | cm2 s−1 |
| Experimental solubilitya | c sat,37°C | 0.0389 | mol l−1 |
| Predicted solubility | c sat,37°C,COSMO | 0.0340 | mol l−1 |
| Densityd | ρ | 1400 | g l−1 |
| Molar massd | M | 180.151 | g mol−1 |
A free time-step method was chosen and controlled by the multifrontal massively parallel sparse (MUMPS) direct solver. Data points were saved logarithmically between 0.01 and 86![[thin space (1/6-em)]](https://www.rsc.org/images/entities/char_2009.gif) 400 s, thus representing a simulation time of 24 h.
400 s, thus representing a simulation time of 24 h.
Mesh quality was assessed by the minimum mesh quality parameter provided by COMSOL as the qual operator. The relative saturation has been used to describe the aspirin concentration in the dissolution chamber. It refers to the relation between the aspirin concentration as averaged over the whole domain and the saturation concentration.
The diffusion coefficient of aspirin was calculated from the averaged mean square displacement of 20 individual molecular dynamics simulations, as proposed by Wang and Hou.23 The systems were equilibrated at a constant temperature (37 °C) and pressure (1 bar) for 2 ns. The simulation time of the production simulations was 3 ns. The force field parameters were as reported by Greiner et al.4
The solubility of aspirin in water was calculated with the conductor-like screening model for realistic solvation (COSMO-RS24) using the commercially available software COSMOtherm (Version C30 Release 15.01., COSMOlogic, Germany). COSMOconf (Version 4.0, COSMOlogic, Germany) was used to generate the molecular structures and the Balloon algorithm, implemented in the software, was used for the generation of conformers, which were considered as a Boltzmann-weighted mixture of conformers for the solubility calculations. Full DFT optimization was performed for all conformers in TURBOMOLE25 (Version 6.6, COSMOlogic, Germany) to calculate the COSMO screening charge density with the Becke–Perdew (BP) functional, the triple-zeta valence polarized basis set (TZVP), and the RI (resolution of the identity) approximation. The solubility at 37 °C was calculated in units of mass fraction using the SLE/LLE job type in COSMOtherm. For the conversion from mass fraction to molar concentration, a density of 993.3 g l−1 (water, 37 °C) was used. The dissociation of acetylsalicylic acid was taken into account by including a pKa of 4.77, which was calculated with COSMOtherm at 37 °C, in the solubility calculation.
3.2 Experimental
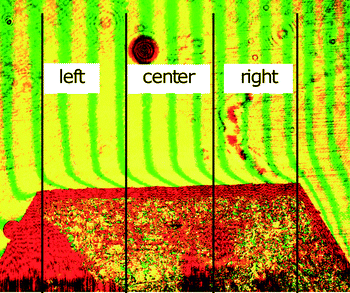
Single crystals were obtained from recrystallization of aspirin from a 38% ethanol–water solution.7,26 Best results were achieved by adding twice the soluble amount of aspirin at room temperature. The samples were heated to 40 °C to dissolve all aspirin, while continuously shaking the sample. From this solution, 75 ml aliquots were put into a crystallization dish with a diameter of 95 mm and covered with Parafilm (analogously to ref. 27). Crystals with a size of 4 to 5 mm were harvested after crystallization for 12–18 h.The interferometer setup was of a Jamin-type, as described in our previous publication.20 In short, a laser beam is expanded and split into two. One of the laser beams passes through a measurement chamber that contains the crystal under investigation, and the second laser beam passes through a reference chamber containing only the solvent (pure water). The signal of the re-combined laser beams is evaluated using a CCD camera. Due to the difference in optical density between the measurement chamber and the reference chamber, a phase shift between the two laser beams can be detected. Fig. 2 shows an example of an image taken at the beginning of the experiment. The aspirin crystal can be seen at the bottom of the image. The dark dots in the surrounding liquid are air bubbles (not in the measurement chamber but in the surrounding tempering medium). The interference fringes are vertical and bend toward the crystal surface, indicating a concentration gradient. Also indicated is the segmentation of the aspirin crystal used in the evaluation of the images.
Image analysis was performed similarly to that in our previous studies on crystal growth.20 Each image was converted to a binary picture, inverted, and small impurities and artifacts (bubbles, scratches, etc.) were removed using a dilation procedure. Starting from a user-selected initial position, the crystal surface was searched downward and fitted within the three segments (see Fig. 2). Dissolution kinetics were then determined from the change in the surface position after every 30 min.
The optimal geometry of the measurement chamber to monitor dissolution while not obtaining a saturated solution by the end of the experiment was determined from the numerical simulations as described in section 4.1. The measurement chamber used in the experiments was a 20 × 10 × 3 mm cuboid. The (001) face of the crystal was fixed at the bottom such that the (100) face was perpendicular to the laser beam. The chamber was sealed with plastic covers, filled with degassed pure water, and put in a water bath at 37 °C. Images of the opposing (001) face were taken every minute, and the experimental time was 24 h.
Microscopic images of the crystals before and after the experimental measurements were obtained using an Olympus BX51 microscope system. Ten-fold magnification was chosen and scale bars are printed on each photo.
The final aspirin concentration in the solvent was determined from the absorption at 276 nm in a UV-vis spectrometer5 (Specord 50 plus, Analytic Jena, Germany). For reference, 0.15 g samples of aspirin were dissolved in 50 ml of water. A dilution series was prepared and measured to obtain a calibration curve. The coefficient of determination of the calibration curve was 0.9977. The aspirin concentrations in the measurement chamber of the interferometer were obtained analogously. The samples were diluted with water at a volumetric ratio of 1![[thin space (1/6-em)]](https://www.rsc.org/images/entities/char_2009.gif) :
:![[thin space (1/6-em)]](https://www.rsc.org/images/entities/char_2009.gif) 10 and measured at room temperature.
10 and measured at room temperature.
The solubility was determined by stirring an amount of aspirin known from literature26,28 to be ten times the maximum soluble amount in 150 ml of water. The sample was sealed with Parafilm, heated in a water bath at 37 °C, and stirred. Every hour a sample was taken, filtered, and measured at the same dilution of 1![[thin space (1/6-em)]](https://www.rsc.org/images/entities/char_2009.gif) :
:![[thin space (1/6-em)]](https://www.rsc.org/images/entities/char_2009.gif) 10.
10.
4 Results and discussion
4.1 Simulation results
The first aim was to derive a size for the dissolution chamber that would allow monitoring of crystal dissolution without producing a saturated solution by the end of the experiment. With such a system setup, the final concentration obtained in a simulation and an experiment can be compared. The smallest geometry of 10 mm leads to a final relative saturation of 99%. As expected, the final relative saturation decreases with increasing size of the measurement chamber. The values for the final relative saturation are 85, 67, and 53% for heights of 15, 20, and 25 mm, respectively. A saturated solution at the end of the experiment makes comparison between simulation and experiment difficult, as only the final concentration of the aspirin was measured. Changes in the concentration of aspirin over time were not assessed due to the low refractive index differences between aspirin and water. Thus, a height of 10 mm is not suited for dissolution experiments. Further, a height of 15 mm yields a final concentration close to the solubility at the end of the simulation. Given that the experimental results may vary from the predicted calculations, the intermediate geometry of 20 mm height was chosen.Fig. 3 shows the relative saturation on the (001) surface and in the bulk within the first few minutes of the simulation. The relative saturation on the surface rapidly increases to values near the solubility. For example, at 2 min and 30 s the relative saturation on the surface is 94%, while the relative saturation in the bulk was calculated as still being around 1%.
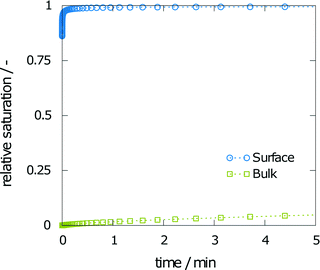 | ||
| Fig. 3 Simulation results of the relative saturation on the surface and in the bulk solvent within the first few minutes of dissolution. | ||
The face displacement velocity is the second important measure of interest to compare simulation results with experimental results. The final relative saturation after dissolution of aspirin in the chosen geometry with a height of 20 mm was calculated as 67%. The calculated face displacement velocity is presented in Fig. 4. A rapid decrease in the dissolution velocity is observed, which is in good agreement with the increase in relative saturation on the surface. As the relative bulk saturation increases, the face displacement velocity decreases without reaching zero by the end of the simulation. Thus, the dissolution mechanism within the measurement chamber of the interferometer can be expected to be diffusion-controlled.
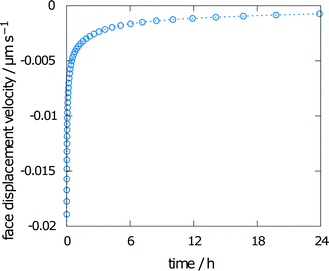 | ||
| Fig. 4 Face displacement velocity as calculated from the flux over the boundary using experimental values for solubility and diffusion coefficient. | ||
4.2 Experimental results
The initial geometry of the aspirin crystals can be seen from the microscopic images, as given in Fig. 5a and c. The samples obtained from crystallization exhibit faces that appear flat on a macroscopic scale, and their edges appear sharp and defined. The two images given are representative, with the same findings being obtained for all crystals. After dissolution, the surface structures of the crystal faces change, as can be seen in Fig. 5b and d. These images are intended to show the same section of the crystal as those visualized before dissolution (Fig. 5a and c). The perfect crystal surfaces have clearly been lost during dissolution. Fig. 5b shows the (100) face, which exhibits large macroscopically flat areas. As reported in the literature,30 steps on this face are relatively large and can even be seen in the microscopic images. Taking microscopic images of all other faces is more difficult. Fig. 5d shows the roughness of the neighboring (011) faces, which could not be photographed from the top as their roughness does not allow for focusing on larger regions of these faces. Nevertheless, these images show that there are no flat surfaces, but instead an obvious macroscopic roughening. | ||
| Fig. 5 Microscopic images of aspirin crystals, as obtained from recrystallization (a, c) and after dissolution (b, d). | ||
Fig. 6 shows a time series representation of the dissolution of the aspirin crystal in the interferometer. The initial crystal with its sharp crystal edges is seen on the top (Fig. 6a), and the resulting geometry is shown half way through the experiment (Fig. 6b) and at the end of the experiment (Fig. 6c). Fig. 6a shows curved interference fringes directly above the crystal, which indicate a strong local gradient in the refractive index of the solution. The interference fringes are aligned vertically in the upper half of the image, indicating a constant concentration over the height of the measurement chamber,20 which in the early stage of the experiment can be regarded as at zero concentration. Later images of the interference fringes (Fig. 6b) indicate a constant concentration gradient within the measurement chamber. Importantly, toward the end of the simulation (see Fig. 6c), this concentration gradient is still present, as the interference fringes are not vertical.
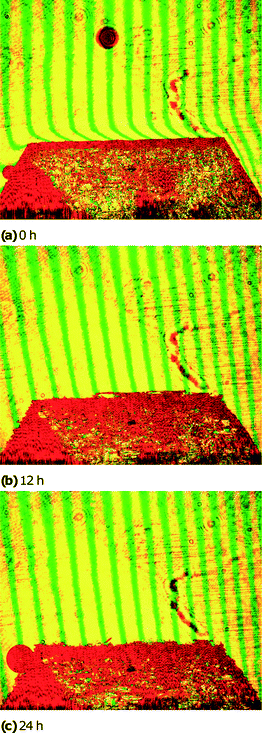 | ||
| Fig. 6 Snapshots of the aspirin crystal morphology before (a), during (b), and after (c) the interferometer experiment. | ||
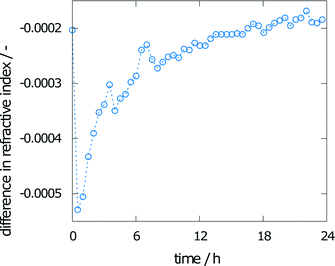
The change in refractive index during the experiment is also shown in Fig. 7. The calculated difference in the refractive index between the crystal interface and the bulk (the top pixels of the images taken) is given over time. A solution without any concentration gradient would result in vertical fringes, indicating a difference of zero. Even toward the end of the experiment, this value of zero has not been reached. The solution is therefore not saturated.
To monitor the mean final concentration at the end of the experiment, the concentration was measured by UV-vis spectroscopy. The results from the three measurements are 0.021, 0.023, and 0.025 mol l−1, corresponding to a concentration of 0.55 to 0.66% of the solubility, which has been determined as 0.038 mol l−1.
Besides the interference fringes and information on the concentration of the sample, the face displacement velocity of the (001) face of the aspirin crystal can be obtained from tracking the surface position over time. Therefore, the crystal was divided into three segments. Fig. 8a shows the height of the aspirin crystal in pixels over time for each of the three segments (Fig. 2). Face displacement is fastest during the beginning of the experiment. This is also expected as the concentration gradient is highest at this point. Dissolution becomes significantly slower after 6 h and only small changes to the crystal height can be seen after 12 h. The corresponding velocities are given in Fig. 8b, which shows the face displacement velocity over time. Values were obtained from the difference in the position of the surface between two subsequent images divided by the time between the two images. Negative values indicate crystal dissolution. Especially for the slow dissolution kinetics toward the end of the simulation, the fluctuations in the raw data also lead to considerable fluctuations in the dissolution velocities. Note the rapid face displacement and commensurate high dissolution rate towards the end of the simulation, which can be seen for the central and right segments of the crystal only. This can be explained by irregularities on the crystal surface (see Fig. 6b) as a horizontal crystal element right above the crystal. Such artifacts can often appear during dissolution, as roughening naturally leads to non-perfect surfaces. These can hardly be represented by a two-dimensional projection.
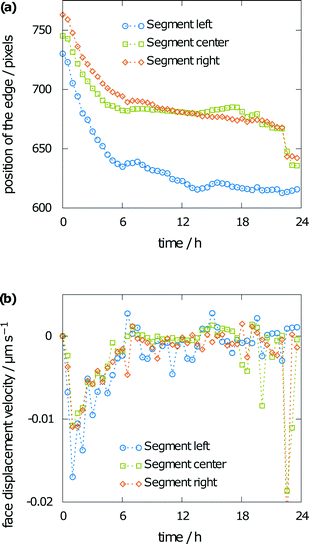 | ||
| Fig. 8 Measured crystal height (a) and corresponding face displacement velocity (b) from 30 minute averages. | ||
4.3 Comparison between simulation and experiment
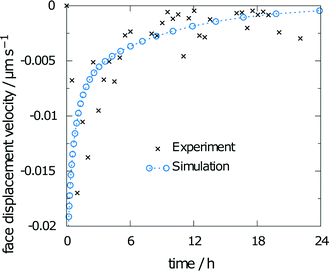
The measured relative saturation within the solvent after 24 h of dissolution was measured for three individual crystals over the range of 55 to 66%. As the simulations were performed with the same experimental crystal dimensions and size of the measurement chamber, a comparison of the respective results yields a good indicator of the simulation accuracy. The simulation results yielded a relative saturation of 67%, which only slightly overestimates the experimental data.The second data from the experiments are the measured face displacement velocity over time. Experimental and computed values are given in Fig. 9. Experimental references are given as averaged data points over the three crystal segments. Results for the simulation and the experiment exhibit comparably fast dissolution velocities at the beginning, whereas face displacement levels out toward the end. The simulation data underestimate the face displacement velocity in the initial hours. Experimental results show a leveling out of the face displacement velocity after 6 h. The same can be observed for the simulated data.
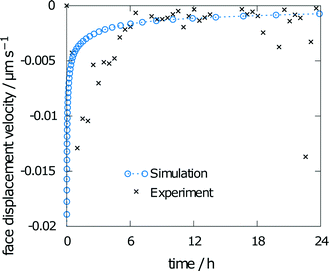 | ||
| Fig. 9 Face displacement velocity as obtained in the experiment and as calculated from the flux over the surface. | ||
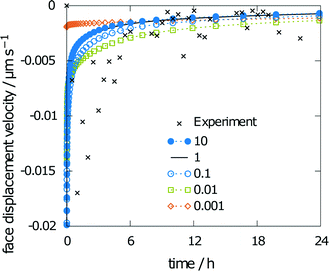
Results for varying rate constants are given in Fig. 10. The scaling factors are 0.001, 0.01, 0.1, 1, and 10. The corresponding values for the obtained relative saturation are 23, 57, 67, 68 and 68%, respectively. A scaling factor of 1 indicates equality with the rate constants from the multiscale simulation approach.18 A decrease in the rates leads to a decrease in relative saturation. For a ten-fold decrease in the rates, the influence on relative saturation is marginal, while a decrease by a factor of 100 leads to a significantly lower relative saturation.
The simulated face displacement velocity underestimates the experimental results irrespective of the scaling factor, especially at the beginning of the experiment, where the difference between the simulation and experiment is most pronounced. Thus, the influence of scaling the rate constants on the face displacement velocity of the (001) face is almost negligible (see Fig. 10). Only for the lowest scaling factor of 0.001 can significant differences be seen. This behavior is typical for a diffusion-controlled process, as the diffusion coefficient is the rate-limiting factor.
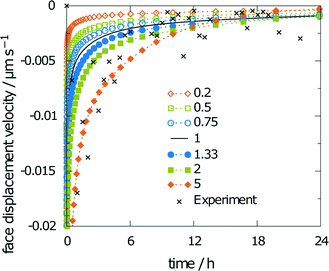
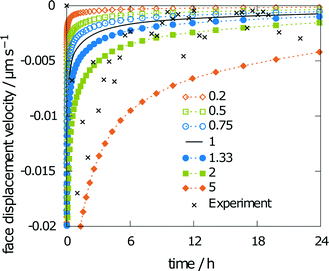
Scaling the diffusion coefficient reveals a stronger influence on the obtained results. Consequently, the scaling factors were chosen in smaller steps, i.e., 0.2, 0.5, 0.75, 1, 1.33, 2, and 5. The corresponding values for the obtained relative saturation are 36, 50, 60, 66, 74, 84, and 98%, respectively. The relative saturation remains in reasonable agreement with the unchanged diffusion coefficient only for scaling factors from 0.5 to 1.33. The diffusion coefficient was predicted from molecular dynamics simulations as 13.7268 × 10⁻⁶ cm2 s−1, and thus, is in the even narrower limit between the scaling factors 0.75 and 1.33. A five-fold increase or decrease leads to either a saturated solution or a final relative saturation, which is only around half of the relative saturation obtained for the unscaled diffusion coefficient. Both results exceed the limits of the experimental findings. Thus, the face displacement velocity in Fig. 11, which indicates better agreement between the simulation and experiment at a scaling factor of 5, does not lead to better overall agreement with the experiment.
The last parameter influencing the simulation results is solubility. A varying solubility will have no influence on the obtained relative saturation of aspirin by the end of the simulation, as the relative saturation is normalized with the solubility. Fig. 12 shows minor changes to the face displacement velocity for scaling factors of 0.75 and 1.33. The predicted solubility of 0.0340 mol l−1 is even closer to the experimental results than that obtained with scaling factors of 0.75 and 1.33.
Conducting the same simulation with predicted parameters alone yields a final relative saturation of 83%. Overestimation of the final average concentration was expected, as the predicted diffusion coefficient is higher than the experimental value. However, the face displacement velocity over time (Fig. 13) almost exactly matches the experimental findings. Thus, the presented multiscale method to predict the disintegration rate constants is suitable to reproduce experimental values.
5 Conclusion
The results of this study showed that the dissolution properties of active pharmaceutical ingredients can be predicted at the molecular level. The results of our previous publications on molecular dynamics4 and kMC18 simulations were extended to macroscopic rate constants. The quality of the macroscopic model for predicting the dissolution of aspirin crystals of experimental size was sufficient to reproduce experimental dissolution properties. Furthermore, the experimental setup, i.e., the size of the measurement chamber, was chosen based on the simulation results. The final concentration of aspirin in the dissolution chamber was only slightly overestimated by the simulations. From the face-displacement velocity of the (001) face and the aspirin concentration on the crystal surface and in the bulk solution, the process was determined to be diffusion-controlled.Note here that prediction of the dissolution properties of aspirin was based on the molecular packing only. Various groups are successfully working on predicting the molecular packing of small molecules. A current review of methods can be found in Desiraju's report.31 Consequently, predicting the dissolution properties of aspirin from the molecular structure alone should become feasible.
Wherever experimental model parameters were used, i.e., the diffusion coefficient and the solubility, methods to predict these values in silico have been presented. Results from sensitivity analysis showed that the predicted solubility and diffusion coefficient of aspirin were close to the experimental results, such that comparable simulation results were obtained when using predicted or experimental data. No experimental knowledge of the dissolution mechanisms of the faces has been used. This makes the presented multiscale approach a powerful method in predicting kinetic dissolution properties of drug candidates, even before expensive synthesis of the compound.
In terms of future work, the model can be expanded by incorporating the determined rate constants into a population balance framework. This would allow for the evaluation of dissolution properties in different conditions, e.g., in a stirred reactor. These processes may be more complicated due to complex flow conditions, thus requiring further refinement using computational fluid dynamics simulations. Another extension should be the investigation of disintegration-controlled dissolution as only this allows a full assessment of the MD/MC coupling. An obvious further step will be to incorporate crystal growth into the multiscale modeling framework. Furthermore, the influence of temperature or impurities could be integrated. Note here that for crystal growth especially the fast growing faces would have to be considered, which probably demands for a broader screening of different faces. Further, the influence of the corners and edges, which has been seen to be of outstanding importance for dissolution,4 has to be evaluated.
Acknowledgements
This work has been supported by the Deutsche Forschungsgemeinschaft (DFG) through grants BR 2035/4-2 and BR 2035/8-1. Franziska Bezold from the biothermodynamics group at TU Munich headed by Prof. Dr. Mirjana Minceva is acknowledged for the solubility calculations. Computational resources provided by the Leibniz Supercomputing Centre under grant pr58la are thankfully acknowledged.References
- M. A. Lovette, A. R. Browning, D. W. Griffin, J. P. Sizemore, R. C. Snyder and M. F. Doherty, Ind. Eng. Chem. Res., 2008, 47, 9812–9833 CrossRef CAS.
- Y. Gao and K. W. Olsen, Mol. Pharmaceutics, 2013, 10, 905–917 CrossRef CAS PubMed.
- N. Holmberg, J.-C. Chen, A. S. Foster and K. Laasonen, Phys. Chem. Chem. Phys., 2014, 16, 17437–17446 RSC.
- M. Greiner, E. Elts and H. Briesen, Mol. Pharmaceutics, 2014, 11, 3009–3016 CrossRef CAS PubMed.
- L. J. Edwards, Trans. Faraday Soc., 1951, 47, 1191–1210 RSC.
- Y. Kim, M. Matsumoto and K. Machida, Chem. Pharm. Bull., 1985, 33, 4125–4131 CrossRef CAS.
- R. B. Hammond, K. Pencheva and K. J. Roberts, Cryst. Growth Des., 2006, 6, 1324–1334 CAS.
- M. Greiner, E. Elts, J. Schneider, K. Reuter and H. Briesen, J. Cryst. Growth, 2014, 405, 122–130 CrossRef CAS.
- J.-C. Chen, B. Reischl, P. Spijker, N. Holmberg, K. Laasonen and A. S. Foster, Phys. Chem. Chem. Phys., 2014, 16, 22545 RSC.
- M. Nayhouse, A. Tran, J. S.-I. Kwon, M. Crose, G. Orkoulas and P. D. Christofides, Chem. Eng. Sci., 2015, 134, 414–422 CrossRef CAS.
- I. Kurganskaya and A. Luttge, J. Phys. Chem. C, 2013, 117, 24895–24906 Search PubMed.
- S. Agrawal, A. T. Paterson, J. McLeod, J. Jones and J. Bronlund, J. Food Eng., 2015, 154, 49–57 CrossRef CAS.
- J. P. Boetker, J. Rantanen, T. Rades, A. Müllertz, J. Østergaard and H. Jensen, Pharm. Res., 2013, 30, 1328–1337 CrossRef CAS PubMed.
- S. Piana and J. D. Gale, J. Am. Chem. Soc., 2005, 127, 1975–1982 CrossRef CAS PubMed.
- S. Piana, M. Reyhani and J. D. Gale, Nature, 2005, 438, 70–73 CrossRef CAS PubMed.
- S. Piana and D. J. Gale, J. Cryst. Growth, 2006, 294, 46–52 CrossRef CAS.
- E. Elts, M. M. Greiner and H. Briesen, J. Chem. Theory Comput., 2014, 10, 1686–1697 CrossRef CAS PubMed.
- E. Elts, M. Greiner and H. Briesen, Cryst. Growth Des., 2016 DOI:10.1021/acs.cgd.6b00721.
- A. Danesh, S. D. Connell, M. C. Davies, C. J. Roberts, S. J. B. Tendler, P. M. Williams and M. J. Wilkins, Pharm. Res., 2001, 18, 299–303 CrossRef CAS.
- C. Eder, C. Choscz, V. Müller and H. Briesen, J. Cryst. Growth, 2015, 426, 255–264 CrossRef CAS.
- J. W. Mullin, Crystallization, Butterworth-Heinemann, 3rd edn, 1997 Search PubMed.
- COMSOL, Multiphysics User's Guide, 2014 Search PubMed.
- J. Wang and T. Hou, J. Comput. Chem., 2011, 32, 3505–3519 CrossRef CAS PubMed.
- A. Klamt, J. Phys. Chem. A, 1995, 99, 2224–2235 CrossRef CAS.
- A. Schäfer, A. Klamt, D. Sattel, J. C. W. Lohrenz and F. Eckert, Phys. Chem. Chem. Phys., 2000, 2, 2187–2193 RSC.
- P. Longuemard, M. Jbilou, A. M. Guyot-Hermann and J. C. Guyot, Int. J. Pharm., 1998, 170, 51–61 CrossRef CAS.
- C. Aubrey-Medendorp, S. Parkin and T. Li, J. Pharm. Sci., 2008, 97, 1361–1367 CrossRef CAS PubMed.
- C. Lindenberg, M. Kraettli, J. Cornel, M. Mazzotti and J. Brozio, Cryst. Growth Des., 2009, 1124–1136 CAS.
- C. C. Wilson, New J. Chem., 2002, 26, 1733–1739 RSC.
- A. Danesh, M. C. Davies, S. J. Hinder, C. J. Roberts, S. J. B. Tendler, P. M. Williams and H. J. Wilkins, Anal. Chem., 2000, 72, 3419–3422 CrossRef CAS PubMed.
- G. R. Desiraju, J. Am. Chem. Soc., 2013, 135, 9952–9967 CrossRef CAS PubMed.
| This journal is © The Royal Society of Chemistry 2016 |

