
 Open Access Article
 This Open Access Article is licensed under a Creative Commons Attribution-Non Commercial 3.0 Unported Licence
NMR detection in biofluid extracts at sub-μM concentrations via para-H2 induced hyperpolarization†
I.
Reile
,
N.
Eshuis
,
N. K. J.
Hermkens
,
B. J. A.
van Weerdenburg
,
M. C.
Feiters
,
F. P. J. T.
Rutjes
and
M.
Tessari
*
Institute for Molecules and Materials, Radboud University, Heyendaalseweg 135, 6525 AJ Nijmegen, The Netherlands. E-mail: m.tessari@science.ru.nl; Tel: +31 24 3652113
First published on 11th May 2016
Abstract
NMR spectroscopy is one of the most powerful techniques to simultaneously obtain qualitative and quantitative information in chemical analysis. Despite its versatility, the applications of NMR in the study of biofluids are often limited by the insensitivity of the technique, further aggravated by the poor signal dispersion in the 1H spectra. Recent advances in para-H2 induced hyperpolarization have proven to address both these limitations for specific classes of compounds. Herein, this approach is for the first time applied for quantitative determination in biofluid extracts. We demonstrate that a combination of solid phase extraction, para-hydrogen induced hyperpolarization and selective NMR detection quickly reveals a doping substance, nikethamide, at sub-μM concentrations in urine. We suggest that this method can be further optimized for the detection of different analytes in various biofluids, anticipating a wider application of hyperpolarized NMR in metabolomics and pharmacokinetics studies in the near future.
Introduction
Analysis of biofluids is a well-established tool in various fields of biomedical and biochemical research, ranging from routine diagnostics to metabolomics,1 biomarker discovery2 and drug metabolism.3 Studies of serum, plasma, sweat, saliva, cerebrospinal fluid and urine have been conducted,4 wherein each offers information on different metabolic processes. Urine is often the biofluid of choice to obtain qualitative and quantitative data on an individual's metabolic state and health condition, since it is rich in diagnostic information and can be collected noninvasively.5At the outset, nuclear magnetic resonance spectroscopy (NMR) is a powerful technique for the analysis of urine, as it offers structural information on analytes and is quantitative, non-specific and non-destructive.4 NMR analysis of any complex mixture or biofluid is, however, limited by the inherent low sensitivity of the technique and by spectral congestion. Urine is known to contain over 3000 metabolites in a wide concentration range (∼106),6 causing signal overlap of dilute components, generally hidden by more abundant components.1 To a certain degree, these limitations can be alleviated by accumulating more scans and performing complex multi-dimensional NMR experiments. Unfortunately both come at the cost of noticeably increased measurement times and hence limit the throughput, often rendering NMR detection of dilute analytes impractical or even impossible.
For specific classes of compounds both the sensitivity and the overlap issues can be addressed at once, following an approach based on chemoselective signal enhancement.7 Such a technique has been demonstrated for nitrogenous heterocyclic compounds by using para-hydrogen (p-H2) induced hyperpolarization in a Signal Amplification By Reversible Exchange (SABRE)8 experiment. Since urine is known to be relatively abundant in nitrogen rich metabolites that are eliminated from the blood stream and excreted renally,5,6 SABRE could potentially selectively reveal these analytes. This approach would also allow the detection of a variety of drugs and metabolites thereof in urine since heteroaromatic scaffolds are ubiquitous in drug development,9 as witnessed by the fact that a quarter of the 200 most sold drugs contain nitrogenous aromatic building blocks.10
SABRE8 relies on the reversible chemoselective binding of analytes to an organometallic iridium complex 1 (Scheme 1) that serves as a polarization transfer catalyst at a low magnetic field. During the lifetime of 1, conversion of the spin order of p-H2 to 1H nuclear hyperpolarization of the bound analyte occurs. Dissociation of the complex results in hyperpolarized analyte molecules in solution, providing NMR signal enhancements up to three orders of magnitude. A recent high-field development allows detection of hydride-analyte correlations in 112 in a 2D continuous hyperpolarization experiment, providing additional spectral dispersion. Either approach allows fast 1H NMR detection in mixtures at sub-μM concentrations.12,13
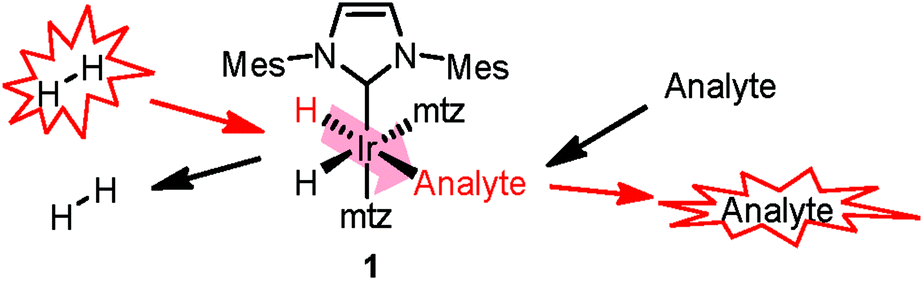 | ||
| Scheme 1 Polarization transfer in SABRE. A co-substrate (mtz, 1-methyl-1,2,3-triazole) is introduced for analyte hyperpolarization in the low-μM regime.11 | ||
Urine, however, is inherently aqueous, an environment in which SABRE catalysts perform poorly.14,15 Water compatible catalysts are being developed, but their hyperpolarization performance falls short of similar systems in organic solvents.14,16 In addition, urine contains a variety of salts, biopolymers, urea, etc.,6 the interactions of which with the Ir-catalysts are expected to negatively interfere with SABRE. As a matter of fact, previous attempts to perform SABRE directly in a biofluid have seen limited success only, reporting sample coagulation and strongly reduced signal enhancements.15 Here, we demonstrate that these issues can be overcome so that SABRE-based hyperpolarization can be applied to urine for the detection and quantification of specific dilute compounds. A protocol of three layers of filtering was developed to render urine amendable to hyperpolarization and to resolve low-μM spectral information from its complex biofluid matrix (Scheme 2).
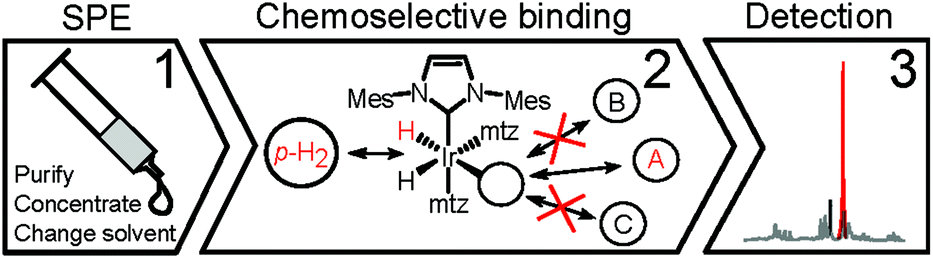 | ||
| Scheme 2 Layers of sample, chemoselective and spectral filtering. | ||
Experimental
Sample preparation
Urine samples were stored at −20 °C in 12 mL aliquots and thawed over a room temperature water bath prior to use. The pH of samples was adjusted to 7.5 with dropwise addition of 1 M NaOH and the samples were centrifuged at room temperature for 15 min (3750 RCF) to remove the sediment. Details of sample collection and storage are available in the ESI.†Solid phase extraction (SPE)
Cartridges (Waters HLB, 6 mL, 200 mg) were activated with methanol (3 mL), conditioned with water (3 mL) and loaded with urine (5 mL). A steady flow rate of 1 mL min−1 was maintained by using an electronically controlled syringe pump. The cartridge was washed with water (3 mL) and dried with a flow of N2 (2 L min−1) over 30 min. Methanol-d4 (1100 μL) was added and allowed to elute by gravity before forcing the residual extract out with a syringe, yielding approx. 650 μL of extract which was used without further treatment. The rest of the solvent is absorbed by the sorbent. All the studied analytes are released into 650 μL of extract (elution curves in Fig. S1†). Each extract was weighed to obtain precise ‘per sample’ concentration factors.NMR experiment
A solution consisting of 4.8 mM of the catalyst precursor [Ir(Cl)(COD)(IMes)] and 72 mM of mtz (1-methyl-1,2,3-triazole) co-substrate in methanol-d4 (130 mg) was weighed into a 5 mm medium wall Wilmad® quick pressure valve NMR tube. The precursor was pressurized under 5 bar of H2, shaken vigorously and allowed to hydrogenate at room temperature for 2 h to generate a solution of the active [Ir(H)2(IMes)(mtz)3]+ catalyst. 390 mg of extract was added to the NMR tube and 51% p-H2 was bubbled through the sample,12 followed by the NMR experiment on 500 or 600 MHz spectrometers equipped with a cryoprobe.Repeatability and calibration
Urine samples from 5 volunteers were gravimetrically spiked to 2 μM of dENA and mENA and subjected to SPE and NMR. Each extract was analyzed 3 times and the integrals were averaged. The reported repeatability is presented as the RSD value across 5 samples. The linear response of the method was demonstrated by a calibration experiment where identical urine samples were gravimetrically spiked to increasing concentrations of dENA and mENA (0.5, 2.0, 5.0, 10.0 and 25.0 μM) and subjected to SPE and NMR. All the extracts were analyzed three times and the integrals were averaged. The calibration curve (Fig. 5B) was calculated by linear regression analysis of experimental data. Further details are available in the ESI.†Results and discussion
The 1st layer of filtering consists of removing salts, urea and macromolecular aggregates from urine and changing the solvent to maximize the catalyst performance, all of which are achieved by Solid Phase Extraction (SPE). Screening of a variety of commercially available SPE cartridges, differing by their selectivity and the retention mechanism,17 and optimization of the extraction protocol was achieved by targeting endogenous nicotinamide (NA). This compound occurs in urine at low-μM concentrations6 and can be detected by NMR using SABRE.8,12,13,16,18 The SPE protocol optimized for NA was expected to extract also other nitrogenous heterocyclic compounds. 7.7-fold sample concentration was achieved by SPE of 5 mL of urine, followed by elution into 650 μL of methanol-d4, a catalyst compatible solvent. The obtained mixture is still remarkably complex, as evidenced by comparison with the original urine NMR 1H spectrum (Fig. 1).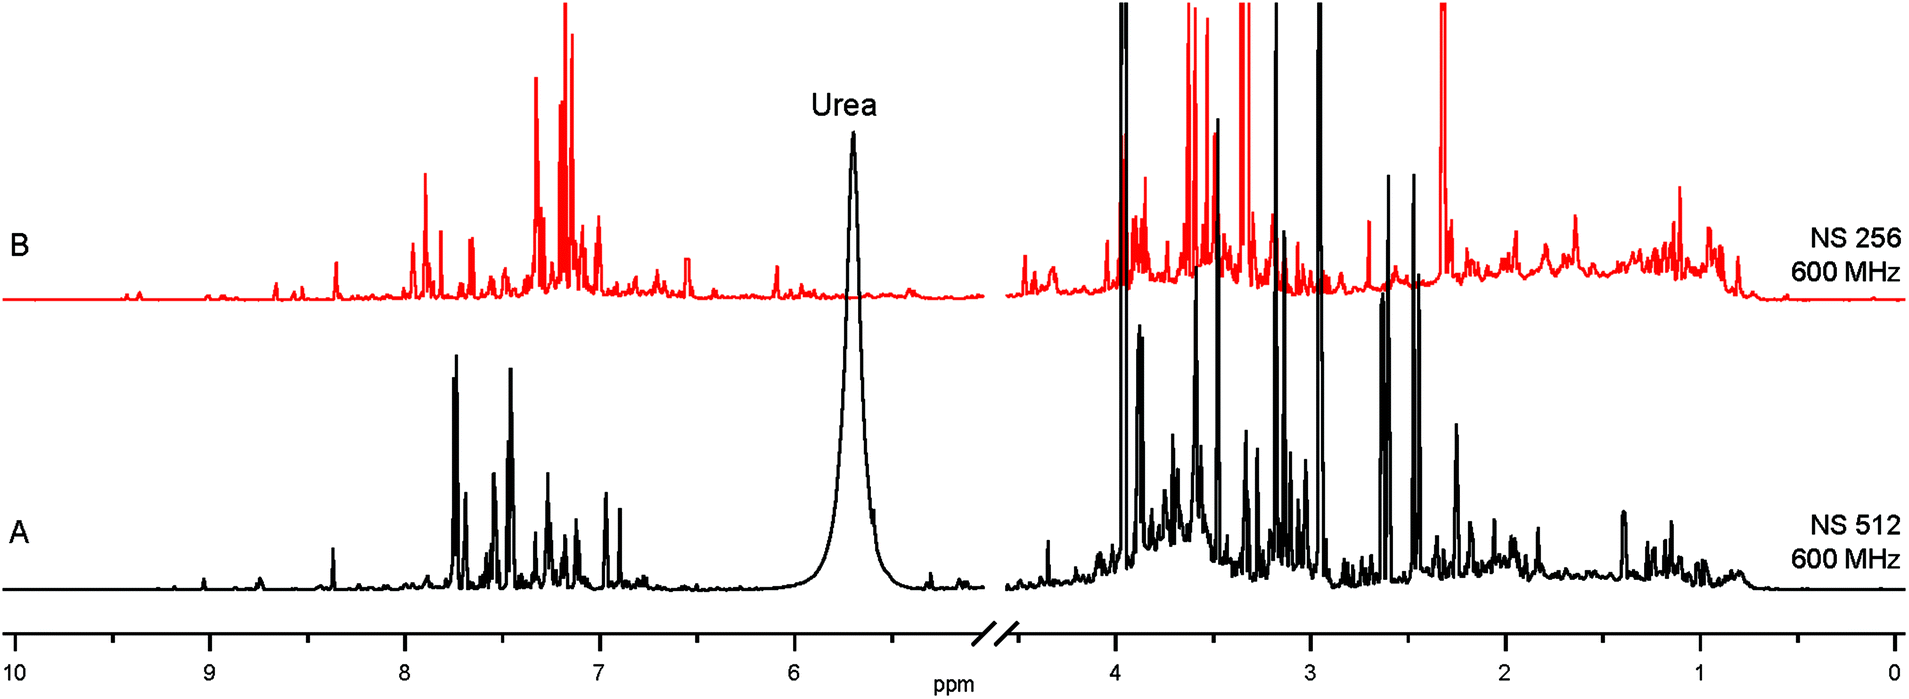 | ||
| Fig. 1 (A) 1H spectrum of human urine; (B) SPE extract from 5 mL of the same urine, concentrated into 650 μL of methanol-d4. | ||
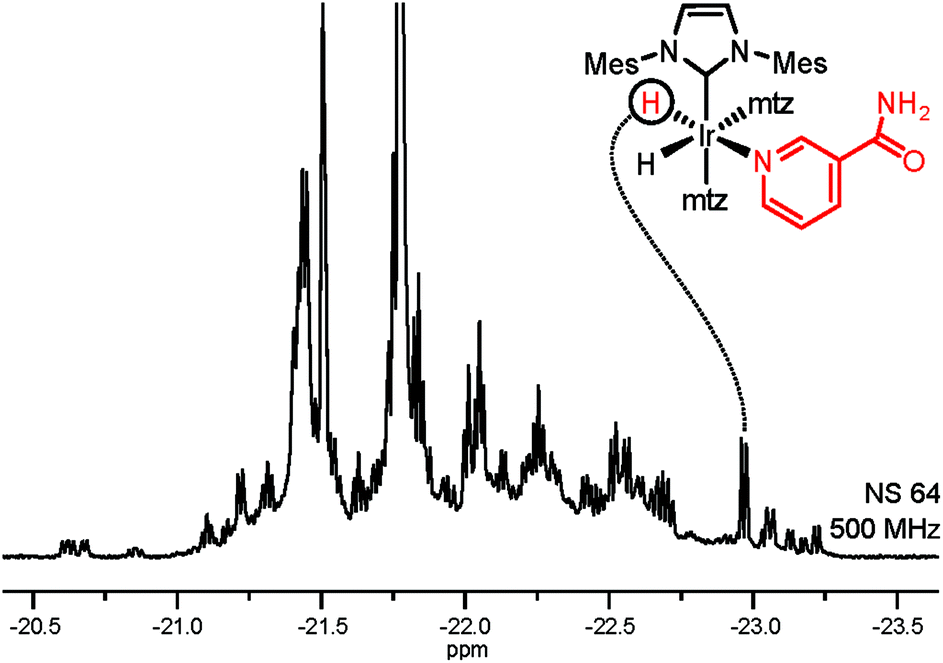
Selective NMR detection of target analytes in SPE extracts is achieved by chemoselective catalyst binding in the 2nd layer of filtering. Following the addition of p-H2 and an iridium catalyst, nitrogenous heterocyclic compounds in the SPE extract will specifically bind to the metal. This association is revealed by a pair of enhanced hydride NMR signals for each bound analyte.19 The obtained 1H spectrum (Fig. 2) contains exclusively enhanced signals from complexes 1 and is free from background contributions, addressing both the NMR sensitivity issues and the spectral overlap caused by the complex urine matrix. This hydride spectrum indicates the presence of dozens of target analytes; signals generated by the association of NA to the Ir-complex could be straightforwardly identified by spiking the NMR sample. In comparison with the NA peak intensity, several signals in Fig. 2 can be safely assumed to correspond to sub-μM analytes. Yet, thorough signal identification is still hampered by spectral overlap.
 | ||
| Fig. 2 Hyperpolarized hydride signals of complexes 1 in SPE extract of urine (51% p-H2, 1.2 mM catalyst, 18 mM mtz). The spectrum was acquired using a SEPP pulse scheme (see the ESI†).20,21 | ||
Improved spectral dispersion is obtained by polarization transfer from the enhanced hydrides to the analyte protons (Fig. 3A) via long-range couplings in complexes 1.12 This helps in resolving hydride signal overlap in a 2D correlation spectrum, providing access to low-μM spectral information for individual analytes (Fig. 3B). Such a 2D spectrum was acquired in 25 min and provides sufficient resolution for quantitative determination of low-μM metabolites that can be identified by spiking. Significant gains can be, however, obtained in throughput if selective detection of specific compounds is desired. In a 3rd layer of filtering the hydride resonance of the NA complex at −22.96 ppm (Fig. 2) is selectively excited with a narrow bandwidth pulse and the magnetization is transferred in a 1D version of the same experiment (Fig. 3A).12 The resulting 1D spectrum displayed in Fig. 3C was acquired in four minutes, providing spectrally filtered information on the analytes of interest.
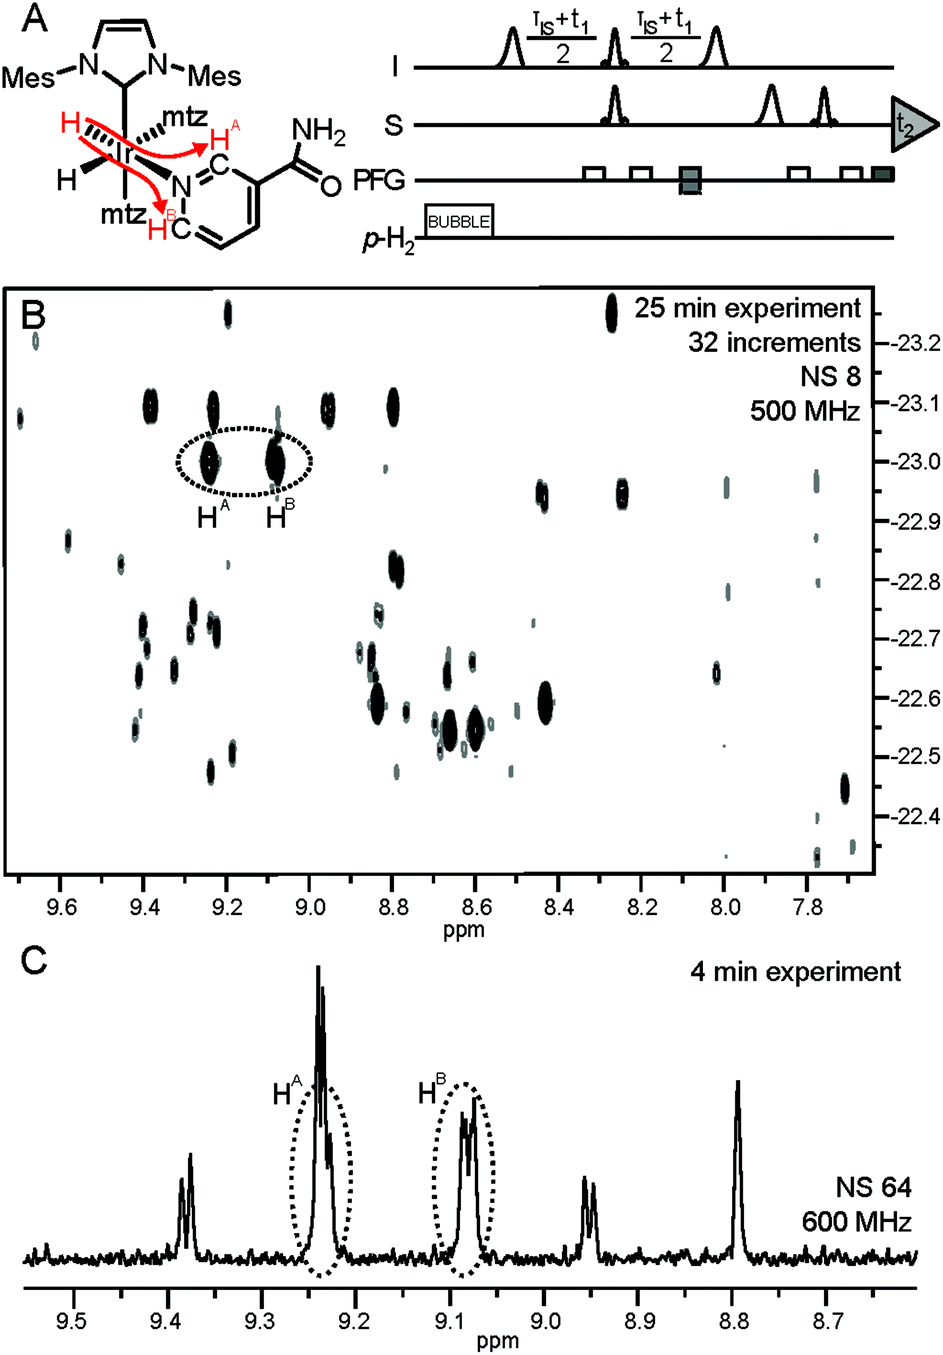 | ||
| Fig. 3 (A) Pulse sequence for acquisition of the hyperpolarized hydride-analyte 2D correlation spectra. Further details are available in ref. 12. Polarization transfer in complex 1 of NA is indicated by red arrows; (B) hydride-analyte 2D correlation spectrum of urine SPE extract; (C) filtered 1D spectrum: a 175 Hz bandwidth selective excitation pulse at −22.96 ppm (see the vertical axis, (B)) also excites hydride resonances at −23.10 ppm, giving rise to four additional hyperpolarized signals. | ||
In order to verify the repeatability as well as the quantitative character of the measurements, we applied the proposed method for the detection of non-endogenous derivatives of NA in urine. For this we selected N,N-diethylnicotinamide (nikethamide, dENA), a respiratory stimulant that affects the central nervous and cardiovascular systems and is banned by the World Anti-Doping Agency (WADA).22 Abuse of dENA may also be detected by its metabolite N-ethylnicotinamide (mENA), as neither occur endogenously.23 Urine samples were spiked with both the compounds and subjected to the method herein. The result after the three layers of filtering described above is illustrated in the 1D spectrum in Fig. 4, in which NA, dENA and mENA each have one baseline resolved peak. The repeatability of the method was investigated by collecting urine samples from five individuals and spiking them to 2 μM of dENA and mENA. Good repeatability was found, as indicated by the RSD of 5.7% and 12.0% for dENA and mENA, respectively.
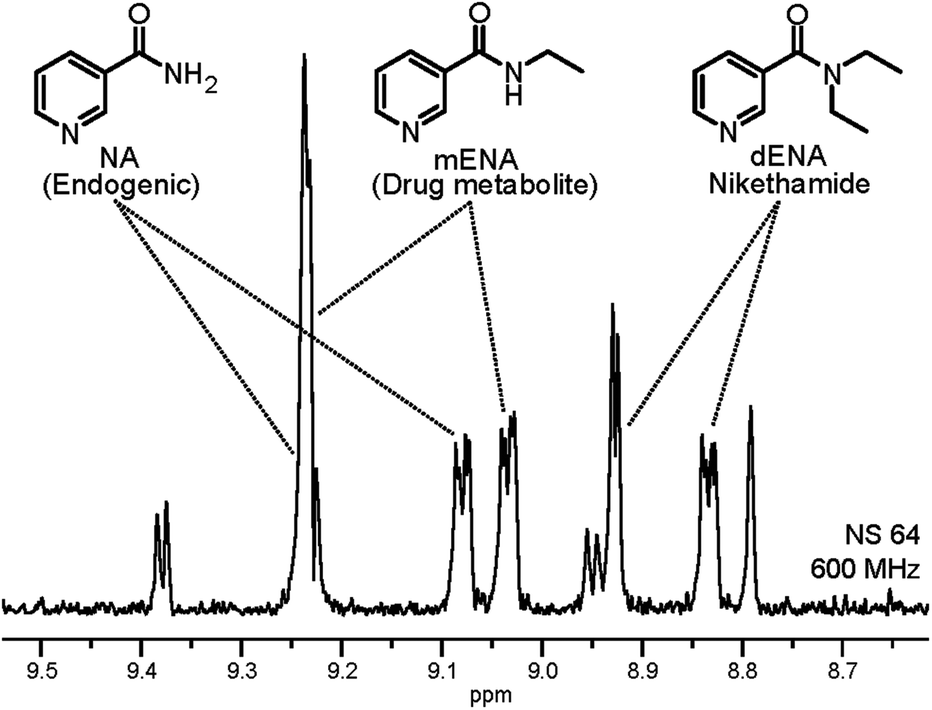 | ||
| Fig. 4 1D selective excitation spectrum of urine SPE extract after spiking urine with 2 μM of dENA and mENA. 8.84 ppm and 9.03 ppm peaks were used for quantification. The spectra were recorded with 175 Hz selective excitation at −22.96 ppm, where the hydride signals of NA, dENA and mENA overlap. | ||
The quantitative character of the proposed approach was further tested by spiking five identical urine samples with increasing concentrations of dENA and mENA. We have previously demonstrated the linear dependence of the NMR signal integrals and concentration in hyperpolarized samples.12,13 Such a linear dependence also holds in the present case, as illustrated by the calibration curves displayed in Fig. 5. The lowest concentration used for calibration (0.5 μM in urine) yields a S![[thin space (1/6-em)]](https://www.rsc.org/images/entities/char_2009.gif) :N ratio of 6 after 64 scans (4 min), meeting the WADA requirements for stimulant detection;24 accumulating more scans or using fully enriched p-H2 would reduce the detection limit further. These calibration curves allow the correlation of peak integrals with analyte concentrations in urine and, therefore, form the basis for the application of this approach in quantitative metabolite and drug analysis.
:N ratio of 6 after 64 scans (4 min), meeting the WADA requirements for stimulant detection;24 accumulating more scans or using fully enriched p-H2 would reduce the detection limit further. These calibration curves allow the correlation of peak integrals with analyte concentrations in urine and, therefore, form the basis for the application of this approach in quantitative metabolite and drug analysis.
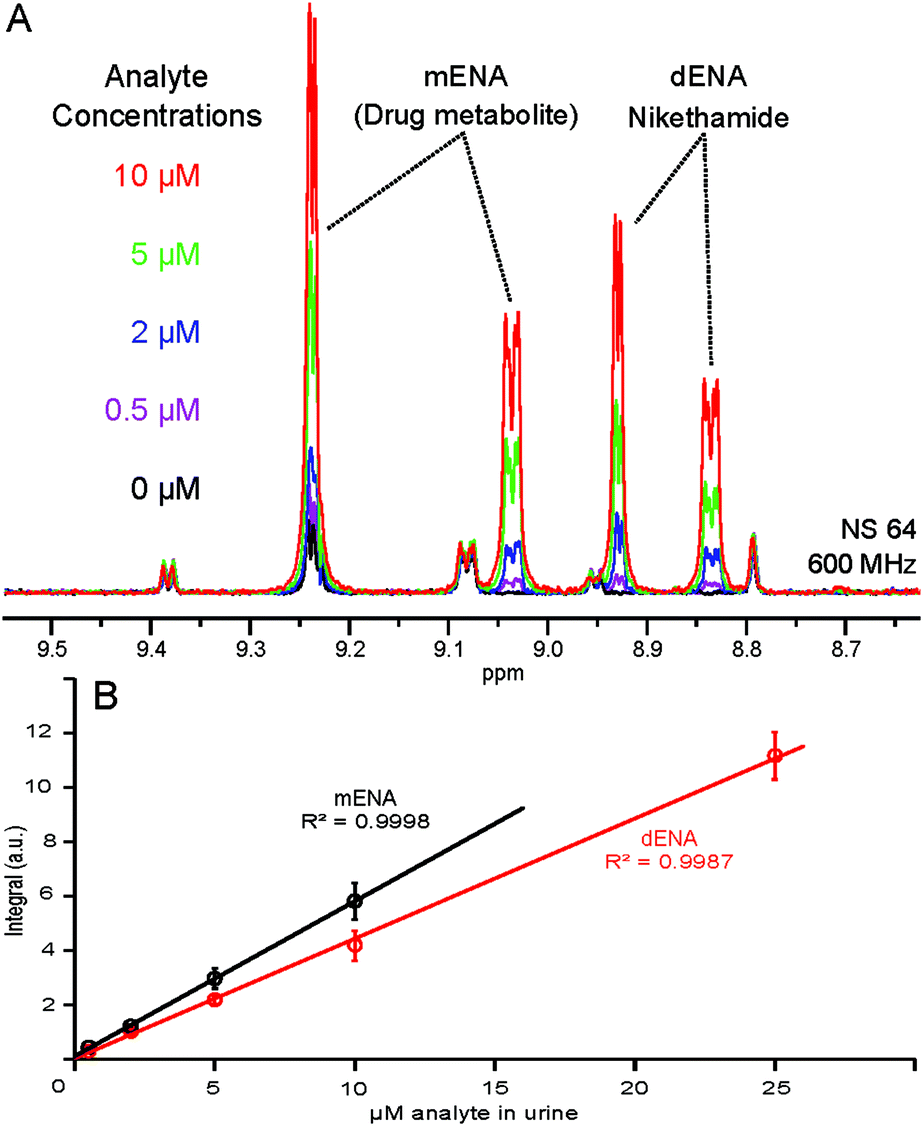 | ||
| Fig. 5 (A) NMR response at different analyte concentrations; (B) calibration curve for dENA and mENA in urine. Due to the overlap with NA at >10 μM, mENA calibration was not attempted at higher concentrations. Error bars represent standard errors of three repeated measurements. | ||
Conclusions
By combining a SPE-based sample preparation procedure with p-H2 induced hyperpolarization we have achieved selective NMR detection of a specific class of metabolites in a complex mixture of biological origin. SPE forms the first of three selection layers, allows enrichment of the sample in the compounds of interest and renders urine compatible with SABRE catalyst systems. The analyte specificity of the signal enhancement in the second layer is utilized for the chemoselective hyperpolarization, allowing the amplification of the desired signals and ignoring the otherwise dominating metabolic background. The method allows to explore low-μM concentrations of target analytes in urine, as quantitatively demonstrated for a doping substance, nikethamide, and its metabolite. Note that the sensitivity achieved herein can be further increased threefold by using fully enriched p-H2. The same method can be applied to different biofluids, provided a proper choice of SPE sorbents and extraction conditions is made for the targeted analytes. The collection of known SABRE substrates includes other drugs (nicotine and harmine,25 pyrazinamide and isoniazid26) as well as adenine and adenosine,15 tagged oligopeptides,27 nitriles28 and various heteroaromatic compounds.12,13,18,29 Since this list is continuously growing, we can foresee a wider application of p-H2 hyperpolarization in NMR applications in biochemistry, including possible future application in metabolomics and pharmacokinetics analysis.Acknowledgements
We thank Ruud L. E. G. Aspers for helping with the experimental setup and p-H2 generation. We acknowledge the European Union and the provinces of Gelderland and Overijssel for support through the EFRO Ultrasense NMR project.Notes and references
- G. A. Nagana Gowda and D. Raftery, J. Magn. Reson., 2015, 260, 144–160 CrossRef PubMed.
- W. J. Griffiths, T. Koal, Y. Wang, M. Kohl, D. P. Enot and H.-P. Deigner, Angew. Chem., Int. Ed., 2010, 49, 5426–5445 CrossRef PubMed.
- T. A. Clayton, D. Baker, J. C. Lindon, J. R. Everett and J. K. Nicholson, Proc. Natl. Acad. Sci. U. S. A., 2009, 106, 14728–14733 CrossRef PubMed.
- L. Brennan, Prog. Nucl. Magn. Reson. Spectrosc., 2014, 83, 42–49 CrossRef PubMed.
- F. Savorani, M. A. Rasmussen, M. S. Mikkelsen and S. B. Engelsen, Food Res. Int., 2013, 54, 1131–1145 CrossRef.
- S. Bouatra, F. Aziat, R. Mandal, A. C. Guo, M. R. Wilson, C. Knox, T. C. Bjorndahl, R. Krishnamurthy, F. Saleem, P. Liu, Z. T. Dame, J. Poelzer, J. Huynh, F. S. Yallou, N. Psychogios, E. Dong, R. Bogumil, C. Roehring and D. S. Wishart, PLoS One, 2013, 8, e73076 Search PubMed.
- N. K. J. Hermkens, N. Eshuis, B. J. A. van Weerdenburg, M. C. Feiters, F. P. J. T. Rutjes, S. S. Wijmenga and M. Tessari, Anal. Chem., 2016, 88, 3406–3412 CrossRef PubMed.
- R. W. Adams, J. A. Aguilar, K. D. Atkinson, M. J. Cowley, P. I. P. Elliott, S. B. Duckett, G. G. R. Green, I. G. Khazal, J. López-Serrano and D. C. Williamson, Science, 2009, 323, 1708–1711 CrossRef PubMed.
- M. Baumann and I. R. Baxendale, Beilstein J. Org. Chem., 2013, 9, 2265–2319 CrossRef PubMed.
- N. A. McGrath, M. Brichacek and J. T. Njardarson, J. Chem. Educ., 2010, 87, 1348–1349 CrossRef.
- N. Eshuis, N. Hermkens, B. J. A. van Weerdenburg, M. C. Feiters, F. P. J. T. Rutjes, S. S. Wijmenga and M. Tessari, J. Am. Chem. Soc., 2014, 136, 2695–2698 CrossRef PubMed.
- N. Eshuis, R. L. E. G. Aspers, B. J. A. van Weerdenburg, M. C. Feiters, F. P. J. T. Rutjes, S. S. Wijmenga and M. Tessari, Angew. Chem., Int. Ed., 2015, 54, 14527–14530 CrossRef PubMed.
- N. Eshuis, B. J. A. van Weerdenburg, M. C. Feiters, F. P. J. T. Rutjes, S. S. Wijmenga and M. Tessari, Angew. Chem., Int. Ed., 2015, 54, 1481–1484 CrossRef PubMed.
- M. Fekete, C. Gibard, G. J. Dear, G. G. R. Green, A. J. J. Hooper, A. D. Roberts, F. Cisnetti and S. B. Duckett, Dalton Trans., 2015, 44, 7870–7880 RSC.
- J.-B. Hövener, N. Schwaderlapp, T. Lickert, S. B. Duckett, R. E. Mewis, L. A. R. Highton, S. M. Kenny, G. G. R. Green, D. Leibfritz, J. G. Korvink, J. Hennig and D. von Elverfeldt, Nat. Commun., 2013, 4, 2946 Search PubMed.
- M. L. Truong, F. Shi, P. He, B. Yuan, K. N. Plunkett, A. M. Coffey, R. V. Shchepin, D. A. Barskiy, K. V. Kovtunov, I. V. Koptyug, K. W. Waddell, B. M. Goodson and E. Y. Chekmenev, J. Phys. Chem. B, 2014, 118, 13882–13889 CrossRef PubMed.
- S. Magiera, J. Hejniak and J. Baranowski, J. Chromatogr., B, 2014, 958, 22–28 CrossRef PubMed.
- V. Daniele, F.-X. Legrand, P. Berthault, J.-N. Dumez and G. Huber, ChemPhysChem, 2015, 16, 3413–3417 CrossRef PubMed.
- N. J. Wood, J. A. Brannigan, S. B. Duckett, S. L. Heath and J. Wagstaff, J. Am. Chem. Soc., 2007, 129, 11012–11013 CrossRef PubMed.
- J. Barkemeyer, J. Bargon, H. Sengstschmid and R. Freeman, J. Magn. Reson., Ser. A, 1996, 120, 129–132 CrossRef.
- H. Sengstschmid, R. Freeman, J. Barkemeyer and J. Bargon, J. Magn. Reson., Ser. A, 1996, 120, 249–257 CrossRef.
- The World Anti-Doping Code, The 2015 Prohibited List, International Standard, 2014, WADA.
- F. T. Delbeke and M. Debackere, Br. J. Sports Med., 1976, 10, 116–112 CrossRef PubMed.
- TD2014MRPL - Minimum Required Performance Levels for Detection and Identification of Non-Threshold Substances, 2014, WADA.
- S. Glöggler, M. Emondts, J. Colell, R. Müller, B. Blümich and S. Appelt, Analyst, 2011, 136, 1566–1568 RSC.
- H. Zeng, J. Xu, J. Gillen, M. T. McMahon, D. Artemov, J.-M. Tyburn, J. A. B. Lohman, R. E. Mewis, K. D. Atkinson, G. G. R. Green, S. B. Duckett and P. C. M. van Zijl, J. Magn. Reson., 2013, 237, 73–78 CrossRef PubMed.
- T. Ratajczyk, T. Gutmann, P. Bernatowicz, G. Buntkowsky, J. Frydel and B. Fedorczyk, Chem. – Eur. J., 2015, 21(36), 12616–12619 CrossRef PubMed.
- R. E. Mewis, R. A. Green, M. C. R. Cockett, M. J. Cowley, S. B. Duckett, G. G. R. Green, R. O. John, P. J. Rayner and D. C. Williamson, J. Phys. Chem. B, 2015, 119, 1416–1424 CrossRef PubMed.
- E. B. Dücker, L. T. Kuhn, K. Münnemann and C. Griesinger, J. Magn. Reson., 2012, 214(1), 159–165 CrossRef PubMed.
Footnote |
| † Electronic supplementary information (ESI) available: Information on chemicals and materials, urine sample handling, NMR sample preparation and experiment, repeatability and calibration. See DOI: 10.1039/c6an00804f |
| This journal is © The Royal Society of Chemistry 2016 |