
Non-invasive spectroscopy of transfusable red blood cells stored inside sealed plastic blood-bags
K.
Buckley
 a,
C. G.
Atkins
ab,
D.
Chen
cd,
H. G.
Schulze
a,
D. V.
Devine
cd,
M. W.
Blades
*b and
R. F. B.
Turner
*abe
a,
C. G.
Atkins
ab,
D.
Chen
cd,
H. G.
Schulze
a,
D. V.
Devine
cd,
M. W.
Blades
*b and
R. F. B.
Turner
*abe
aMichael Smith Laboratories, The University of British Columbia, 2185 East Mall, Vancouver, BC, Canada V6 T 1Z4. E-mail: turner@msl.ubc.ca
bDepartment of Chemistry, The University of British Columbia, 2036 Main Mall, Vancouver, BC, Canada V6 T 1Z1. E-mail: blades@chem.ubc.ca
cDepartment of Pathology and Laboratory Medicine, The University of British Columbia, 2211 Wesbrook Mall, Vancouver, BC, Canada V6 T 2B5
dCentre for Blood Research, The University of British Columbia, 2350 Health Sciences Mall, Vancouver, BC, Canada V6 T 1Z3
eDepartment of Electrical and Computer Engineering, The University of British Columbia, 2332 Main Mall, Vancouver, BC, Canada V6 T 1Z4
First published on 27th January 2016
Abstract
After being separated from (donated) whole blood, red blood cells are suspended in specially formulated additive solutions and stored (at 4 °C) in polyvinyl chloride (PVC) blood-bags until they are needed for transfusion. With time, the prepared red cell concentrate (RCC) is known to undergo biochemical changes that lower effectiveness of the transfusion, and thus regulations are in place that limit the storage period to 42 days. At present, RCC is not subjected to analytical testing prior to transfusion. In this study, we use Spatially Offset Raman Spectroscopy (SORS) to probe, non-invasively, the biochemistry of RCC inside sealed blood-bags. The retrieved spectra compare well with conventional Raman spectra (of sampled aliquots) and are dominated by features associated with hemoglobin. In addition to the analytical demonstration that SORS can be used to retrieve RCC spectra from standard clinical blood-bags without breaking the sterility of the system, the data reveal interesting detail about the oxygenation-state of the stored cells themselves, namely that some blood-bags unexpectedly contain measurable amounts of deoxygenated hemoglobin after weeks of storage. The demonstration that chemical information can be obtained non-invasively using spectroscopy will enable new studies of RCC degeneration, and points the way to a Raman-based instrument for quality-control in a blood-bank or hospital setting.
Introduction
Modern medicine relies on safe, secure, and cost-effective supplies of transfusable red blood cells (RBCs). Blood banking agencies obtain whole blood from volunteer donors, separate the RBCs by differential centrifugation, suspend them in specially formulated additive solutions such as saline-adenine-glucose-mannitol (SAG-M) and store them in polyvinyl chloride (PVC) blood-bags at 4 °C until they are needed for transfusion.Despite extensive efforts to maintain RBC viability and function, RBCs degenerate and disintegrate whilst being stored.1–7 Degraded cells have lower post-transfusion survival rates and thus regulatory authorities limit the amount of time they can be stored; most agencies specify that unused units be disposed of after five to six weeks (e.g., the storage period in SAG-M is limited to 42 days. At this point ∼40% of RBCs show irreversible morphological changes and ∼0.5% of RBCs have lysed).1–7
The causes and effects of stored-RBC degeneration (the so-called storage lesion) are complex, but the biochemistry that occurs inside blood-bags has been subject to much study.1–14 For example, it is well known that RBCs continue to metabolise and convert glucose (from the additive solution) into lactate via the glycolytic pathway, and it is known that as the concentration of lactate increases (from ∼5 mM to ∼35 mM) over a six week storage period, the pH drops from ∼7.0 to ∼6.5.3,8–12 Concomitant with these metabolic effects are various degenerations of cellular membranes and changes in the concentration of various cellular metabolites. For example, the intracellular concentration of 2,3-diphosphoglycerate (2,3-DPG), a metabolic intermediate which affects the oxygen-carrying capacity of hemoglobin, decreases with storage-time.12–14 At present, the absence of a metric to quantify storage lesion, and concerns over violating the integrity of closed sterile systems, mean there are no procedures in place for the analytical testing of individual units of RCC.
Spatially Offset Raman Spectroscopy (SORS) is a variant of Raman spectroscopy that allows the retrieval of chemical information through over-lying surfaces and turbid media.15,16 The technique involves the acquisition of Raman spectra from locations on the sample-surface that are laterally separated from the laser illumination zone. Photon diffusion causes spectra collected with larger spatial-offsets to have greater relative-contributions from larger depths within the sample, i.e., photons that find their way to the surface from greater depths are more likely to have spent time at greater (lateral) distances from the illumination point.15 The development of SORS has unlocked a host of new applications ranging from aviation security and pharmaceutical analysis, to the non-invasive detection of disease (e.g., cancer).17–21
Recently, a form of “micro-SORS” that can interrogate samples through ∼1 μm-thick diffusely-scattering layers has been reported. The technique, which has applications in biology, quality control, and material sciences can involve the introduction of a SORS offset along the plane of the incident beam,22–24 or the introduction of a lateral-offset across the plane of the surface.25,26 In the past the lateral-offset has been achieved by spatially resolving images on the CCD detector25 or by delivering the laser beam via a different path (i.e. bypassing completely the microscope optics).26
The present paper describes the application of a different form of “micro-SORS” to probe RCC through standard (∼400 μm-thick) blood-bags. In this formulation the lateral-offset is introduced across the plane of the sample-surface using the standard beam-steering optics of the Raman microscope. This simple work-around does not require any optical or optomechanical engineering yet it can reveal rich chemical information about the oxygenation-state of the stored cells.
Until now, scientific investigations of the RCC storage lesion have relied on analytical techniques that destroy the sample and/or breach the integrity/sterility of the bag. The present demonstration that RCCs can be interrogated non-invasively and non-destructively through standard storage bags points the way to a tool for investigating RBC degeneration/disintegration in situ, and potentially a Raman-based instrument for quality-control in a blood-bank or hospital setting.
Experimental
Blood collection
15 healthy adults (6 females and 9 males) aged 20–68 years (mean = 50 years, std. dev. = 15 years) each voluntarily donated a whole blood unit (450 mL ± 10%) at the Canadian Blood Service (CBS) NetCAD facility in Vancouver, Canada. The RBCs were isolated from the blood, suspended in 110 mLs of SAG-M additive solution (saline with 1.25 mM adenine, 43.4 mM glucose and 28.8 mM mannitol), subjected to an in-line leukoreduction filtering and put into standard PVC storage bags. The units of prepared RCC (Fig. 1) were then stored under standard blood banking conditions at 4 °C. The protocols used for the donation and preparation the isolation of the RBCs have previously been described.27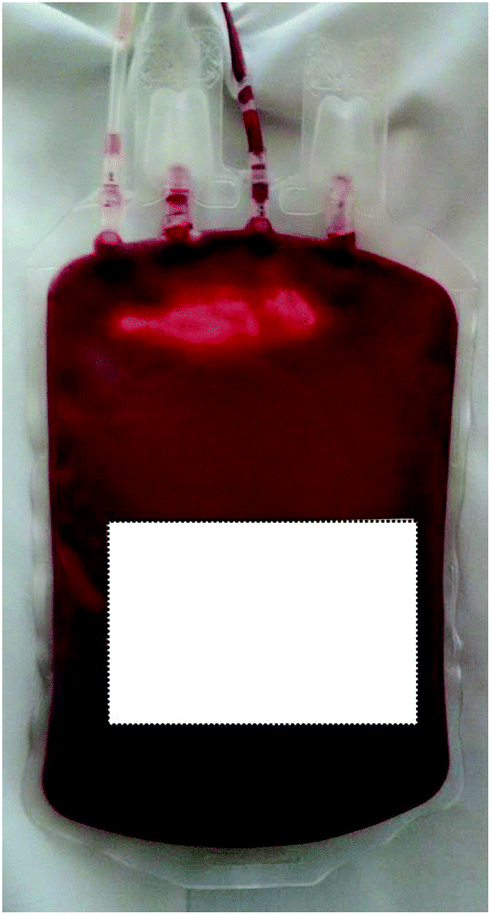 | ||
| Fig. 1 A standard bag of transfusable red blood cells in a polyvinyl chloride blood-bag (the white panel obscures barcodes and identification-labels). | ||
Data collection and processing
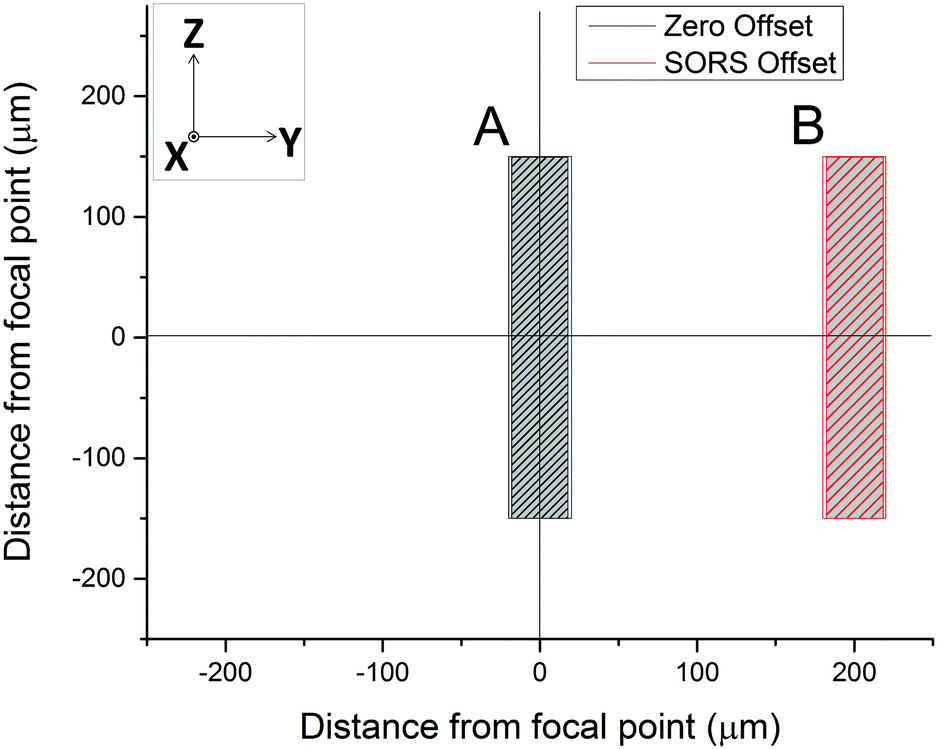 | ||
| Fig. 2 Position A is the set-up for collecting a conventional Raman spectrum with the laser line centred on the microscope's focal point (the cross-hairs). In order to collect a SORS spectrum the laser illumination line was moved 200 μm away from the focal point using the beam-steer alignment mirrors (position B). | ||
Results
A SORS experiment to probe the contents of a standard (400 μm thick) blood-bag is shown in Fig. 3. A zero-offset measurement (labelled ‘A’ in both panels) produces a spectrum dominated by the PVC blood-bag whereas a 200 μm offset measurement (labelled ‘B’ in both panels) produces a very different spectrum. The spectra are plotted as raw unprocessed data. | ||
| Fig. 3 The schematic diagram on the left shows conventional Raman spectroscopy in which the backscattered light is from the laser illumination point (geometry A) and SORS, in which the collection point is laterally offset from the laser illumination point by 200 μm (geometry B). The plots on the right show the corresponding spectral data. | ||
The 200 μm-offset SORS spectrum shown in panel B of Fig. 3 is plotted again in Fig. 4, along with a spectrum of RCC that has been removed from a blood-bag, placed on a gold mirror and probed using conventional (i.e., zero-offset) Raman spectroscopy. It is clear that the two spectra share many of the same Raman bands and that both are dominated by spectral features associated with hemoglobin (e.g. bands at 752 cm−1, 1224 cm−1, 1547 cm−1, 1582 cm−1, 1606 cm−1, 1617 cm−1, 1636 cm−1; see Table 1 for assignments).31,32
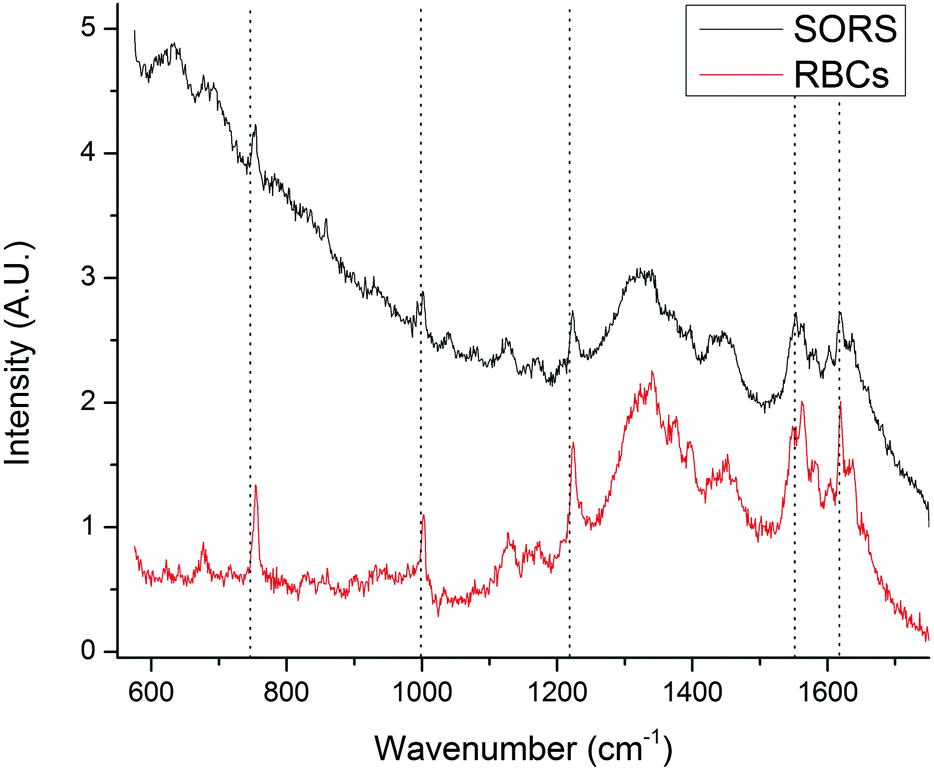 | ||
| Fig. 4 The SORS spectrum of the blood-bag contents (from Fig. 3; top trace) plotted with a conventional Raman spectrum of red blood cell concentrate (i.e. the contents of a blood-bag; bottom trace). Both spectra exhibit many of the same Raman bands, in particular those associated with hemoglobin. | ||
| Raman shift (cm−1) | Mode assignment | Biochemical component |
|---|---|---|
| 622 | C–C twisting of Tyr, Phe | Hb; protien |
| 635 & 695 | C–Cl stretching | PVC bag |
| 677 | δ (Pyrrole deformation) | Hb |
| 753 | ν (Pyrrole breathing) | Hb |
| 853 | C–C aliphatic stretch | Lactate |
| 880 | CH2 rocking | Mannitol |
| 1000 | Phe | Protiens |
| 1031 |
δ (![[double bond, length as m-dash]](https://www.rsc.org/images/entities/char_e001.gif) CbH2)4 CbH2)4 |
Hb |
| 1040 | Ester of pthalic acid, ring | Plasticizer additive (PVC bag) |
| 1040 | C–CH3 vibration | Lactate |
| 1071 |
δ (CbH2)4 |
Hb |
| 1081 | C–O vibration | Lactate |
| 1124 | CH3 rocking/C–O vibration | Lactate |
| 1127 | ν (Cb-methyl) | Hb |
| 1212 | δ (CmH) | Hb |
| 1226 | δ (CmH) | Hb |
| 1448 | δ (CH2/CH3) | Protiens, phospholipids |
| 1427 & 1437 | CH2 scissors vibration | PVC bag |
| 1526 | Pyrrole stretching | Hb |
| 1547 & 1566 | CβCβ stretching | Hb |
| 1580 & 1600 | Ester of pthalic acid, stretching | Plasticizer additive (PVC bag) |
| 1582 & 1639 | Asymmetric CαCm stretching | Hb |
| 1604 | CC strtetching |
Hb |
| 1653 | Amide I modes | Hb; protien |
| 1723 | Cacrbonyl stretching | PVC bag |
Fig. 5A shows SORS spectra that were collected from two units chosen at random and scanned on the same day (in this figure the fluorescence background has been removed for ease of comparison); the main features of the SORS spectra show that similar biochemical information has been retrieved from each unit and there is no substantial increase in the relative intensity of bands at 662, 972, 1248, 1365 and 1396 cm−1, which would indicate that the cells are undergoing photo-damage.33Fig. 5B shows the hemoglobin region of 5A on an expanded scale. In this plot, slight differences between the spectra can be seen; these subtle features have previously been reported in Raman studies of RBC oxygenation and deoxygenation cycles, and are well characterised.33,34 They indicate that the hemoglobin in cells from Donor 15 are fully oxygenated inside the bag and the hemoglobin in cells from Donor 1 are partially deoxygenated inside the bag. The only other plausible explanation for these spectral features is the presence of methemoglobin, but this can be ruled out because there is no increase in intensity of the Raman bands at 1516 cm−1 and 1610 cm−1).33,34
 | ||
| Fig. 5 (A) A comparison between a SORS spectrum of 27-day-old RBCs and a SORS spectrum of 1-day-old-RBCs (from a different donor). (B) Emphasis on spectral features related to oxygenation in the 1200–1650 cm−1 region, the increase in intensity of the bands at ∼1212 cm−1 and ∼1547 cm−1 (dotted lines) reveal that the 1-day-old-RBCs are oxygenated and the 27-day-old RBCs are partially deoxygenated. The Raman features associated with molecular bonds that do not change confirmation or position with oxygenation, are unchanged.34 | ||
The oxygenation state of hemoglobin in stored RBCs is an important topic in the transfusion-research community and the diffusion of oxygen through the (gas-permeable) PVC storage bags has been the subject of much study.8 This work has shown that hemoglobin is affected in complex ways by cold storage (for example the drop in pH increases the oxygen-pressure needed to saturate hemoglobin, but the loss of cellular 2,3-DPG decreases it).35 Despite the complexity of the system there is consensus that ∼99% of the hemoglobin in an RBC unit is oxygen-saturated by the end of a six-week storage period.8
The expected trend towards increased oxygenation with storage time is inconsistent with the results in Fig. 5 where the cells in the 1-day-old bag from Donor 15 are more oxygenated than the cells in the 27-day-old bag from Donor 1. In order to further investigate this apparent anomaly, the relationship between hemoglobin-oxygenation and storage-age was analysed for all 15 bags. No simple correlation between oxygenation and time was found when all the data were analysed together (Fig. 6, r2 = 0.02 for the combined data), but there were some weak trends found in specific bags. For example, the oxygenation of the hemoglobin in RBCs from Donor 1 (Fig. 7, top panel) decreased as storage time progressed (r2 = 0.38) whereas a slight trend towards increased oxygenation with time was more typical of the whole data set and more consistent with expected trends.
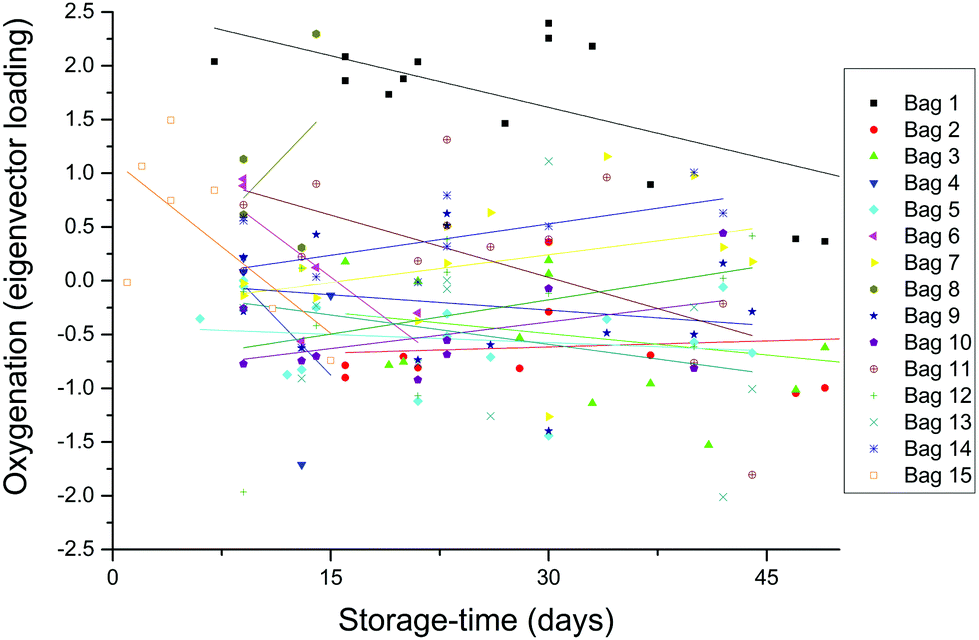 | ||
| Fig. 6 The data from each bag were decomposed with multivariate (principal component) analysis. The primary difference between the spectra (the first eigenvector) was associated with oxygenation/deoxygenation, as shown in the bottom panel in Fig. 7. The degree to which each spectrum is dominated by this eigenvector is plotted here. The large scatter and absence of any simple relationship is discussed below. | ||
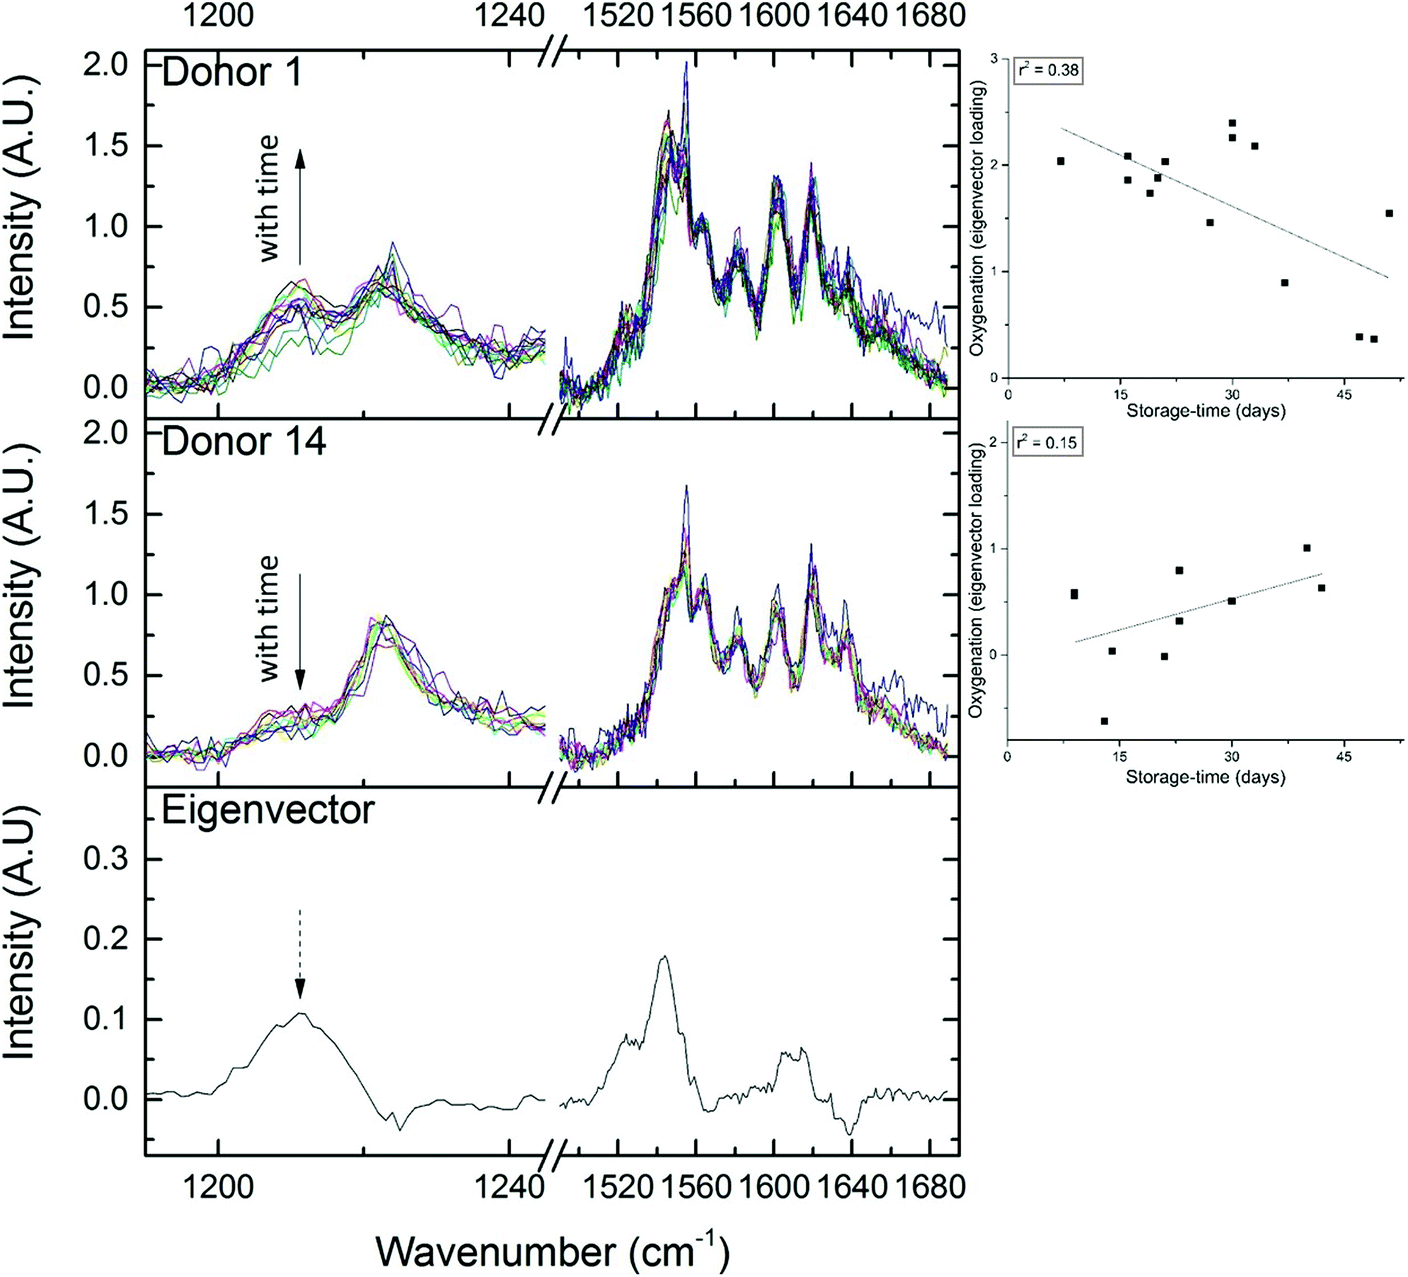 | ||
| Fig. 7 Certain regions of the RBC spectrum are seen to vary with oxygenation (see Fig. 5). The eigenvector which correlates with oxygenation-changes is plotted in the bottom panel. The top panel shows ‘Donor 1’, an example of an RBC unit where oxygenation decreases with storage age (spectra are on the left and the trend from Fig. 6 is on the right). The middle panel shows ‘Donor 14, an example of an RBC unit where oxygenation increases with storage age (again, spectra are on the left and the trend from Fig. 6 is on the right). | ||
The aim of the present study was to assess whether or not SORS could be used to probe RCC non-invasively inside PVC bags. It was not designed to test a specific clinical/biological hypothesis and did not have the statistical power to draw conclusions about the characteristics of particular donors (e.g., spectral features related to age, gender, etc.). Nevertheless, the observation is interesting and will be investigated in further studies (see below).
Discussion
Donated RBCs are not routinely subjected to analytical testing before they are transfused because current techniques for evaluating cell-biochemistry are relatively slow, and they require that the sterility of the unit be breached so aliquots can be taken. The present study shows that Spatially Offset Raman Spectroscopy (SORS) can be used to retrieve pertinent biochemical information from RBCs that are being stored in standard PVC blood-bags. The non-invasive probing of stored RBCs creates new opportunities to investigate the oxygenation-levels of the stored cells and, in the longer term, potentially offers a powerful methodology for elucidating the relationship between storage lesion and patient outcome.Oxygenation state of hemoglobin
Hemoglobin accounts for 97% of the dry weight of red blood cells and >90% of hemoglobin is oxygenated at the time of donation.36 As mentioned above, there is plentiful oxygen available to the RBC hemoglobin during storage as atmospheric oxygen can diffuse through the gas permeable PVC bags and it is thought that by the end of the storage period ∼99% of the hemoglobin are oxygen-saturated.8The SORS technique, as deployed in our experiments, only interrogates RBCs that are close to the inner surface of PVC bag (i.e., within ∼100 μm of the inner surface). We deployed no rigorous protocol to shake the bag before the SORS spectra were collected and thus it is probable that our data are weighted towards cells that had spent more time interacting with atmospheric oxygen (and in regions of the bag that had a lower concentration of RBCs per unit supernatant due to settling).
Nevertheless, the SORS spectra presented confirm that in some blood-bags measurable amounts of deoxygenated hemoglobin are present after six weeks of storage. The design of the study, to test SORS as an analytical technique rather than to test a specific clinical/biological hypothesis, means that it is not possible to draw any deeper findings from the data. The results do suggest two interesting courses for future study: it would be useful to repeat the study in a situation where each bag was agitated gently before scanning, and also to repeat the study in a situation where each bag was disturbed as little as possible so as to intentionally look at oxygenation in cells that spend more time near the PVC membrane. The large scatter in Fig. 6 shows that, in all probability, the present study looked at some combination of the two.
Clinical relevance, the relationship between ‘storage lesion’ and patient outcome
Multicentre, randomised, blinded trials have shown that for critically ill adults in general, there are no significant clinical consequences for receiving transfused RBCs that are reaching the end of their shelf-life.37 More specific randomised controlled trials involving certain vulnerable groups of patients also suggest that outcomes are unaffected by the storage-age of the RBCs. For example RBC storage-age does not have deleterious effects on premature, very low-birth-weight infants38 or on adult patients that are undergoing cardiac surgical procedures.39 However, the evidence that there is no link between storage-age and patient outcome in some cohorts, does not prove that there is no link between those variables in all cohorts and randomised controlled trials of children40 and adults39 are on-going.For ethical and practical reasons, the clinical trials that have been reported so far have compared outcomes of patients who have received blood that is ‘fresh’ (defined as being <737,38 or <1039 days old) with outcomes of patients who have received ‘standard’ blood of variable age (for example 22.0 ± 8.4 days old in one study37 and 14.6 ± 8.338 days old in another), therefore, in addition to the unanswered questions surrounding particularly vulnerable patient-groups, there are still questions to be answered about the biochemical changes that occur at the extremes of the storage-period, i.e., the earliest and latest days of storage.
Recently, we have begun using conventional Raman spectroscopy of supernatant (aliquots) to investigate the related problem of lactate build-up in the RBC additive solution during storage. We showed that blood-bags can exhibit measurable variability in lactate concentration and that some units of RCC carry a significantly larger load of metabolites than others.41 Although most transfusion recipients have the ability to compensate for lactate (and the concomitant pH change) by metabolic and respiratory mechanisms, massive transfusions may overwhelm some patients and lead to transfusion-induced acid–base abnormalities.14,42–44 Our future work will focus on methodological and/or data-analysis techniques that will enable us to use the analytical techniques described in the present paper to interrogate supernatant in situ so that bags containing irregular excesses of lactate can be identified. It is envisaged that we will use SORS to probe the thin layer of additive solution that forms in stored bags when the RBCs settle to the bottom, a natural sorting analogous to centrifugation.
Conclusions
Spatially Offset Raman Spectroscopy has been used to retrieve biochemical information from RBCs that have been packaged for transfusion in PVC bags. Most analytical techniques that have been used to analyse RBCs previously require a breach of sterility and an invasive sampling of aliquots from the bag, actions which renders the contents unusable for transfusion. The ability to probe the cells that are inside standard blood bags (i.e., the plastic containers that are used in blood banks and hospitals) will open new avenues of research in the study the red cell storage lesion and could form the basis of a clinical tool for probing of individual blood-bags before they are transfused into higher-risk patients.Acknowledgements
The authors would like to thank the donors who gave their blood for research purposes at the Canadian Blood Service (CBS) netCAD facility in Vancouver, Canada. This study was approved by the clinical Research Ethics Board (CREB) of The University of British Columbia and the Research Ethics Board of the Canadian Blood Services. The authors report no conflict of interest. Funding was provided by the Canadian Institutes for Health Research (CIHR) and the Natural Sciences and Engineering Research Council of Canada (NSERC); generous in-kind support was also provided by Canadian Blood Services. Instrumentation and infrastructure support was provided by funding from the Canada Foundation for Innovation (CFI) and the British Columbia Knowledge Development Fund (BCKDF).Notes and references
- G. L. Moore, Crit. Rev. Clin. Lab. Sci., 1987, 25, 211–229 CrossRef CAS PubMed.
- J. R. Hess, Vox Sang., 2006, 91, 13–19 CrossRef CAS PubMed.
- D. M. Harmening, Modern Blood Banking and Transfusion Practices, Db F. A. Davis, Philadelphia, USA, 4th edn, 1999 Search PubMed.
- A. R. Orlina, A. M. Josephson, B. McDonald and J. Sobucki, Transfusion, 1969, 9, 62–69 CrossRef CAS PubMed.
- J. R. Hess, Transfusion, 2012, 52, 1827–1835 CrossRef CAS PubMed.
- L. J. Dumont and J. P. AuBuchon, Transfusion, 2008, 48, 1053–1060 CrossRef PubMed.
- G. Moroff, P. R. Sohmer and L. N. Button, Transfusion, 1984, 24, 109–114 CAS.
- E. Bennett-Guerrero, T. H. Veldman, A. Doctor, M. J. Telen, T. L. Ortel, T. S. Reid, M. A. Mulherin, H. Zhu, R. D. Buck, R. M. Califf and T. J. McMahon, Proc. Natl. Acad. Sci. U. S. A., 2007, 104, 17063–17068 CrossRef CAS PubMed.
- J. M. Ratcliffe, M. J. Elliott, R. K. H. Wyse, S. Hunter and K. G. M. M. Alberti, Arch. Dis. Child., 1986, 61, 1208–1214 CrossRef CAS PubMed.
- T. H. Schroeder and M. Hansen, Perfusion, 2005, 20, 17–19 CrossRef PubMed.
- T. A. Pertinhez, E. Casali, L. Lindner, A. Spisni, R. Baricchi and P. Berni, Blood Transfus., 2014, 12, 1–9 Search PubMed.
- B. Blasi, A. D'Alessandro, N. Ramundo and L. Zolla, Transfus. Med., 2012, 22, 90–96 CrossRef CAS PubMed.
- A. D'Alessandro, G. M. D'Amici, S. Vaglio and L. Zolla, Haematologica, 2012, 97, 107–115 CrossRef PubMed.
- J. F. Flatt, W. M. Bawazir and L. J. Bruce, Front. Physiol., 2014, 5, 214 Search PubMed.
- P. Matousek, I. P. Clark, E. R. Draper, M. D. Morris, A. E. Goodship, N. Everall, M. Towrie, W. F. Finney and A. W. Parker, Spectrosc., 2005, 59, 393–400 CrossRef CAS.
- P. Matousek, M. D. Morris, N. Everall, I. P. Clark, M. Towrie, E. R. C. Draper, A. E. Goodship and A. W. Parker, Appl. Spectrosc., 2005, 59, 1485–1492 CrossRef CAS PubMed.
- K. Buckley and P. Matousek, Analyst, 2011, 136, 3039–3050 RSC.
- P. Matousek and N. Stone, J. Biophotonics, 2013, 6, 7–19 CrossRef CAS PubMed.
- K. Buckley, J. G. Kerns, A. W. Parker, A. E. Goodship and P. Matousek, J. Raman Spectrosc., 2014, 45, 188–192 CrossRef CAS.
- K. Buckley and P. Matousek, J. Pharm. Biomed. Anal., 2011, 55, 645–652 CrossRef CAS PubMed.
- R. J. Hopkins, S. H. Pelfrey and N. C. Shand, Analyst, 2012, 137, 4408–4410 RSC.
- C. Conti, C. Colombo, M. Realini, G. Zerbi and P. Matousek, Appl. Spectrosc., 2014, 68, 686–691 CrossRef CAS PubMed.
- C. Conti, C. Colombo, M. Realini and P. Matousek, J. Raman Spectrosc., 2015, 46, 476–482 CrossRef CAS.
- C. Conti, M. Realini, C. Colombo, K. Sowoidnich, N. K. Afseth, M. Bertasa, A. Botteon and P. Matousek, Anal. Chem., 2015, 87, 5810–5815 CrossRef CAS PubMed.
- Z. Di, B. H. Hokr, H. Cai, K. Wang, V. V. Yakovlev, A. V. Sokolov and M. O. Scully, J. Mod. Opt., 2014, 62, 97–101 CrossRef.
- C. Conti, M. Realini, C. Colombo and P. Matousek, Analyst, 2015, 140(24), 8127–8133 RSC.
- D. V. Devine and D. Howe, ISBT Sci. Ser., 2010, 5, 78–82 CrossRef.
- S. Ramirez-Arcos, H. Perkins, Y. Kou, C. Mastronardi, D. Kumaran, M. Taha, Q.-L. Yi, N. McLaughlin, E. Kahwash, Y. Lin and J. Acker, Vox Sang., 2013, 105, 100–107 CrossRef CAS PubMed.
- S. Ramirez-Arcos, C. Mastronardi, H. Perkins, Y. Kou, T. Turner, E. Mastronardi, A. Hansen, Q. L. Yi, N. McLaughlin, E. Kahwash, Y. Lin and J. Acker, Transfusion, 2013, 53, 851–859 CrossRef CAS PubMed.
- C. A. Lieber and A. Mahadevan-Jansen, Appl. Spectrosc., 2003, 57, 1363–1367 CrossRef CAS PubMed.
- B. R. Wood, B. Tait and D. McNaughton, Biochim. Biophys. Acta, Mol. Cell Res., 2001, 1539, 58–70 CrossRef CAS.
- S. Hu, K. M. Smith and T. G. Spiro, J. Am. Chem. Soc., 1996, 118, 12638–12646 CrossRef CAS.
- B. R. Wood, L. Hammer, L. Davis and D. McNaughton, J. Biomed. Opt., 2005, 10, 14005 CrossRef PubMed.
- B. R. Wood, P. Caspers, G. J. Puppels, S. Pandiancherri and D. McNaughton, Anal. Bioanal. Chem., 2007, 387, 1691–1703 CrossRef CAS PubMed.
- X. Jin, M. H. Yazer, J. J. Chalmers and M. Zborowski, Analyst, 2011, 136, 2996–3003 RSC.
- R. I. Weed, C. F. Reed and G. Berg, J. Clin. Invest., 1963, 42, 581–588 CrossRef CAS PubMed.
- J. Lacroix, P. C. Hébert, D. A. Fergusson, A. Tinmouth, D. J. Cook, J. C. Marshall, L. Clayton, L. McIntyre, J. Callum, A. F. Turgeon, M. A. Blajchman, T. S. Walsh, S. J. Stanworth, H. Campbell, G. Capellier, P. Tiberghien, L. Bardiaux, L. van de Watering, N. J. van der Meer, E. Sabri, D. Vo, ABLE Investigators and Canadian Critical Care Trials Group, N. Engl. J. Med., 2015, 372, 1410–1418 CrossRef CAS PubMed.
- D. A. Fergusson, JAMA, J. Am. Med. Assoc., 2012, 308, 1443–1451 CrossRef CAS PubMed.
- M. E. Steiner, D. J. Triulzi, S. F. Assmann, S. R. Sloan, M. Delaney, M. A. Blajchman, S. Granger, P. A. D'Andrea, S. Pulkrabek and C. P. Stowell, Abstract Presentations from the AABB Annual Meeting Philadelphia, Transfusion, 54:15A, 2014.
- P. Spinella and M. Tucci, Age of Blood in Children in Pediatric Intensive Care Units (ABC-PICU), ongoing clinical trial, https://clinicaltrials.gov/ct2/show/NCT01977547 (accessed Nov 28, 2015).
- C. G. Atkins, K. Buckley, D. Chen, H. G. Schulze, D. V. Devine, M. W. Blades and R. F. B. Turner, Clin. Biomed. Spectro. and Imag. IV, ed. J. Brown and V. Deckert, vol. 9537 of SPIE Proceedings (OSA), 2015, p. 95370X Search PubMed.
- A. Doctor and P. Spinella, Semin. Perinatol., 2012, 36, 248–259 CrossRef PubMed.
- A. D'Alessandro, A. G. Kriebardis, S. Rinalducci, M. H. Antonelou, K. C. Hansen, I. S. Papassideri and L. Zolla, Transfusion, 2014, 55(1), 205–219 CrossRef PubMed.
- D. Chen, K. Serrano and D. V. Devine, ISBT Sci. Ser., 2016, 11, 26–33 CrossRef.
| This journal is © The Royal Society of Chemistry 2016 |