
 Open Access Article
 This Open Access Article is licensed under a Creative Commons Attribution-Non Commercial 3.0 Unported Licence
Oxygen diffusion pathways in a cofactor-independent dioxygenase†
Natali V.
Di Russo
,
Heather L.
Condurso
,
Kunhua
Li
,
Steven D.
Bruner
* and
Adrian E.
Roitberg
 *
*
Department of Chemistry, University of Florida, 440 Leigh Hall, 404 Leigh Hall, Gainesville, FL 32611-7200, USA. E-mail: roitberg@ufl.edu; bruner@chem.ufl.edu; Tel: +1 352 392 6972, +1 352 392 0525
First published on 23rd July 2015
Abstract
Molecular oxygen plays an important role in a wide variety of enzymatic reactions. Through recent research efforts combining computational and experimental methods a new view of O2 diffusion is emerging, where specific channels guide O2 to the active site. The focus of this work is DpgC, a cofactor-independent oxygenase. Molecular dynamics simulations, together with mutagenesis experiments and xenon-binding data, reveal that O2 reaches the active site of this enzyme using three main pathways and four different access points. These pathways connect a series of dynamic hydrophobic pockets, concentrating O2 at a specific face of the enzyme substrate. Extensive molecular dynamics simulations provide information about which pathways are more frequently used. This data is consistent with the results of kinetic measurements on mutants and is difficult to obtain using computational cavity-location methods. Taken together, our results reveal that although DpgC is rare in its ability of activating O2 in the absence of cofactors or metals, the way O2 reaches the active site is similar to that reported for other O2-using proteins: multiple access channels are available, and the architecture of the pathway network can provide regio- and stereoselectivity. Our results point to the existence of common themes in O2 access that are conserved among very different types of proteins.
Introduction
The diffusion of molecular oxygen (O2) is an essential process in living organisms, where it plays an important role in a large variety of enzymatic reactions. Although it was initially believed that O2 freely diffused through proteins,1 recent research efforts uncovered the existence of dynamic gas molecule channels that grant temporal and spatial regulation,2–11 and provide insight into the known regio- and stereo-selectivity of some oxygenase-catalyzed reactions.4,12In most cases, permanent channels are not observed in static protein structures as diffusion occurs through a network of transient pathways that are mostly lined with flexible hydrophobic residues.2,4,13,14 In addition, O2 is not usually observed in protein crystal structures and although xenon can sometimes successfully identify O2 binding sites,5,7,15,16 it is far from an ideal probe.17 Nonetheless, the problem of O2 diffusion can be ideally addressed using computational tools. So far, computational studies of O2 diffusion have mainly relied on implicit ligand sampling,4,11 multiple steered molecular dynamics18 or enhanced sampling techniques2,3 to attain adequate sampling. However, in recent years GPU computing produced a large increase in the simulation timescales that can be routinely accessed,19–22 making it possible to obtain the several independent ∼100 ns long simulations that are necessary to achieve a realistic description of ligand motion using straightforward molecular dynamics.2 In this work, we show how this approach can be applied to study O2 diffusion in a cofactor-independent oxygenase.
The majority of enzymes that catalyze reactions where oxygen atoms from O2 are transferred to organic substrates require metals or organic cofactors like flavin to activate O2 and control the reactivity of the intermediates formed.12 However, a small number of oxygenases require neither.23 DpgC, an enzyme that catalyzes a key step in the biosynthesis of a non-proteinogenic amino acid that is incorporated into last-resort antibiotics like vancomycin and teicoplanin, belongs to this rare group.24–26 Because of emerging bacterial resistance,27 these antibiotics have been the focus of numerous biosynthetic and synthetic chemistry efforts.28–32 Interestingly, DpgC is one of the rare cases where a proposed O2 binding site was apparent in the crystal structure, in this case located in a solvent accessible hydrophobic cavity, and positioned to attack only a specific face of the substrate (3,5-dihydroxyphenylacetyl-coenzyme A, DPA-CoA),33 in agreement with labeling experiments.26,33
Here, we investigate O2 diffusion in DpgC using long, unbiased molecular dynamics simulations that reveal the importance of including all subunits of this hexameric protein to obtain a realistic representation of O2 diffusion pathways. Site-directed mutagenesis, kinetic measurements, and Xe-pressurized crystallography provide information validating the computational results and supporting the existence of multiple O2 diffusion pathways that converge at the active site face where O2 was crystallographically observed. These observations point to the existence of common features in O2 access that are conserved among many different types of proteins.
Results
Molecular dynamics simulations reveal three main oxygen diffusion pathways in DpgC
We investigated the diffusion of O2 into and out of the active site of DpgC using molecular dynamics simulations. These started from the X-ray structure of the hexamer, with O2 located in the active site position observed crystallographically (PDB: 2NP9, 2.45 Å resolution). Each of the five independent simulations contained six O2 molecules and extended for over 0.5 μs of combined time. During these simulations, we observe 55 complete spontaneous diffusion events that bring O2 from outside the protein into the active site, and 72 escapes. Complete entries are defined as events where O2 starts completely outside the protein surface and ends in a position less than 6 Å away from the reactive carbon of the substrate, DPA-CoA, with the opposite being true for complete escapes (see Fig. S1† for a scheme of the reaction). On average, each O2 molecule spends 20% of the trajectory traveling along a complete path. We consider that these simulations provide sufficient sampling, as the main results are in reasonable agreement with an additional set of simulations where the concentration of O2 was approximately six times higher and the initial position of all the O2 molecules was outside the protein (see ESI† for more details).The observed spontaneous diffusion of O2 takes place through well-defined pathways (Fig. 1). There are three main types of pathways: the U1 pathway, in which O2 enters the enzyme through the upper part of the active site; the S1 pathway, which connects the active site with a region located at the interface of two of the subunits; and the L-type pathways, in which O2 reaches the active site by diffusing close to the ligand DPA-CoA.
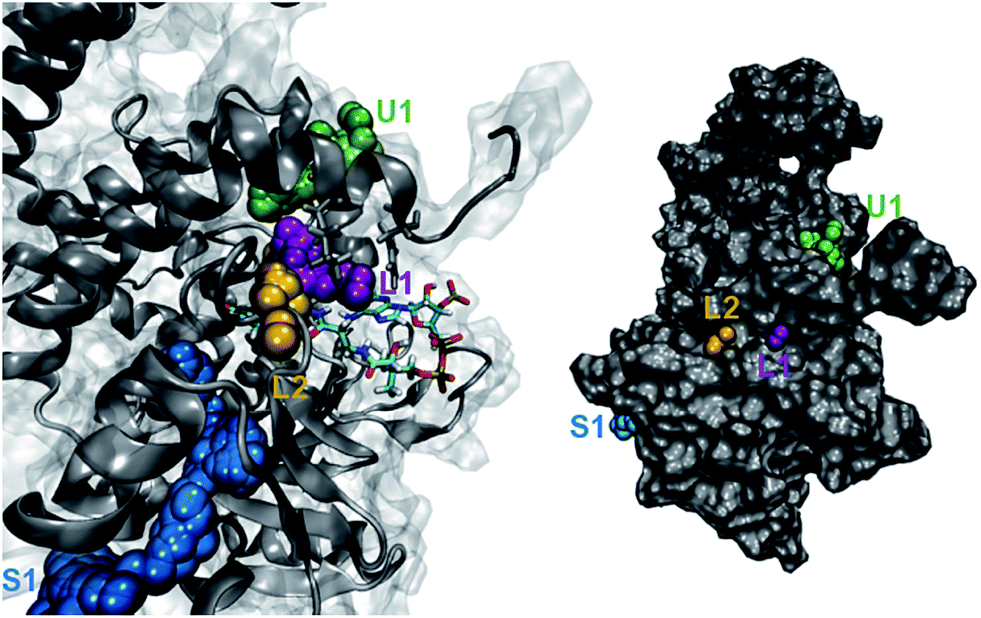 | ||
| Fig. 1 Main pathways for O2 diffusion in DpgC. Green: U1 pathway, purple: L1 pathway, yellow: L2 pathway; blue: S1 pathway. Left: trajectory followed inside the protein. Right: entry and escape points shown on the surface of one of the monomers. A video is included in the ESI.† | ||
Among the three main types of pathways identified, the L1 pathway accounts for the majority of all observed entries and escapes (Fig. 2). In total, O2 escaped through this pathway 46 times and entered 39 times. To enter the L1 pathway, O2 diffuses between Lys 428 and Phe 432 (Fig. 3A). The entrance to the L2 pathway is very close to that of the L1 pathway and is located between Lys 428 and the loop formed by residues 318 to 322. We observed other L-type pathway diffusion events with low frequency. In the U1 pathway, O2 diffuses through a hole lined by hydrophobic residues located at the top of the active site (Fig. 3B). The size of the hole across its smallest dimension (Ala 112 − Val 429) is 6 ± 2 Å. Finally, the S1 pathway connects the active site to a region found at the interface of two of the protein subunits. Although only one complete entry and escape occurred via this pathway, O2 molecules regularly visited several cavities along this pathway without completing an escape or entry during the simulation. It is important to point out that because of the location of the entrance to this pathway, O2 may need to diffuse up to ∼50 Å between DpgC subunits before reaching this point (Fig. 3D). This highlights the importance of simulating the hexamer in order to obtain a realistic representation of O2 diffusion, as already pointed out by Shadrina et al. in simulations of hemoglobin where the enhanced flexibility of isolated subunits increased O2 migration.2 This concept is even more relevant in DpgC where, unlike in hemoglobin, we observe O2 diffusion between protein subunits.
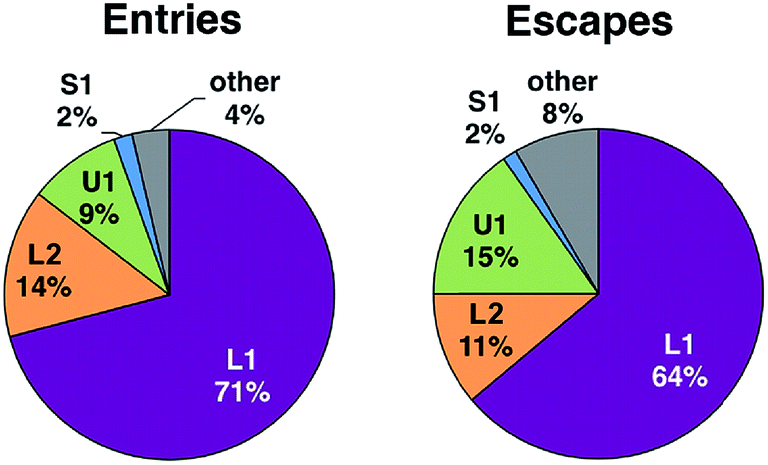 | ||
| Fig. 2 Distribution of O2 pathway use for complete diffusional processes. | ||
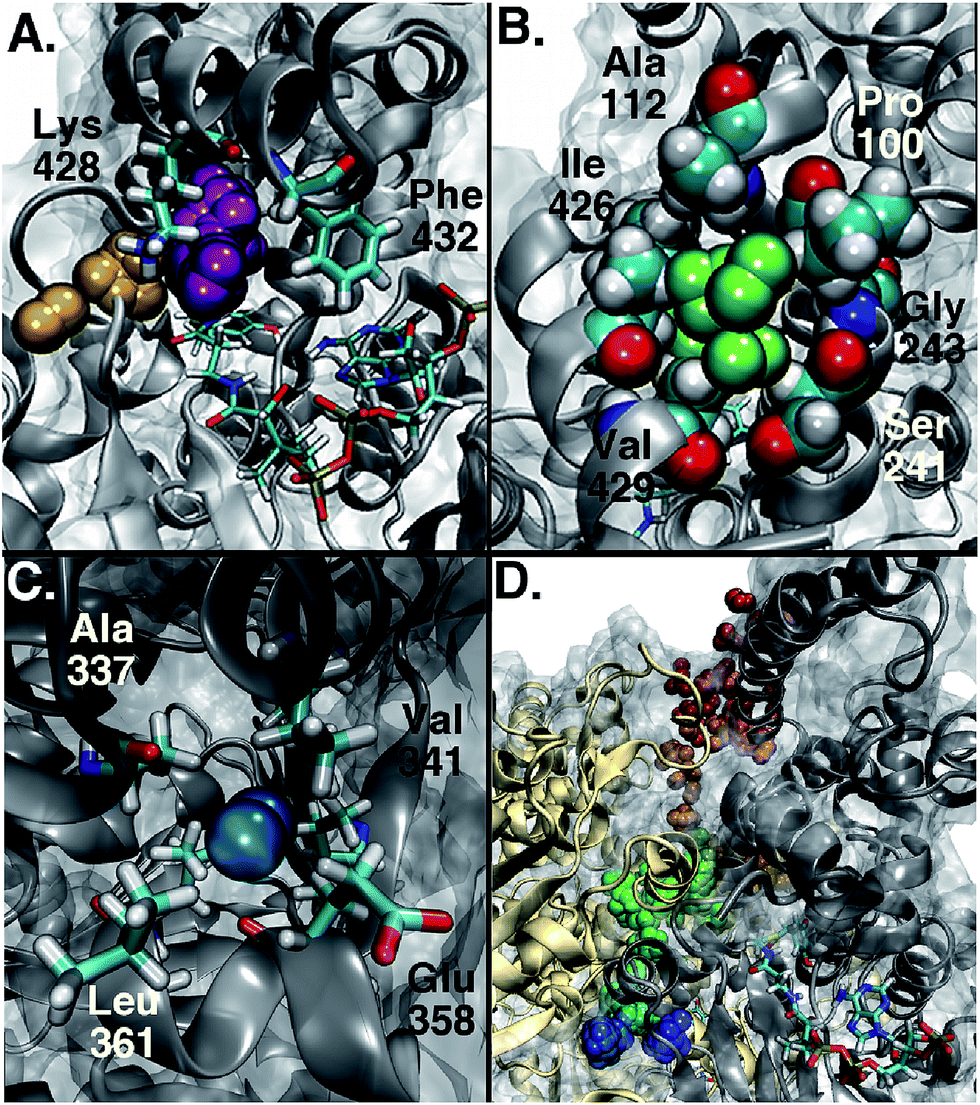 | ||
| Fig. 3 Entry points to the different types of pathways. (A) In the L1 pathway, O2 diffuses between Lys 428 and Phe 432. (B) In the U1 pathway, O2 diffuses through a hole lined by hydrophobic residues shown in space filling representation. (C) Residues forming the entry point to the S1 pathway. (D) The entry point to the S1 pathway is located at the interface between two of the subunits, shown in different colors. In order to reach this point, O2 needs to diffuse between them. An example of such a trajectory is shown, with the position of O2 along it progressing from red to blue. | ||
O2 concentrates in a dynamic cavity at the active site of DpgC
When O2 travels along any of these pathways it is usually found in one of several pockets, which are connected through bottleneck regions (Fig. 4A). The lower pocket is connected to the access points for the L1 and L2 pathways, while the upper pocket is connected to the U1 access point. O2 molecules diffusing along the S1 pathway occupy pockets SI–SIV. When all complete paths are considered, even though the time spent in each pocket can vary in a wide range, the L1 pocket is the one that is populated the most. This pocket is connected to the upper pocket, and SI. Only when O2 is in the lower or SI pockets it can be found at a distance of less than 6 Å from the carbon atom of DPA-CoA where it is expected to react. On average, O2 molecules spent 3% of a trajectory in this position. As a result, the probability of finding O2 in a reactive position is 10 to 60-fold higher than if O2 was uniformly distributed, as would be expected from passive diffusion. This observation is in good agreement with the assigned oxygen binding pocket in the crystal structure. It is also important to point out that O2 only has access to DPA-CoA from one face, in agreement with labeling experiments that suggest stereochemical hydrogen abstraction, and O2 attack from the opposite face.26,33 In addition, water is relatively excluded from the active site except for the crystallographically observed waters hypothesized to act as a base in the reaction mechanism (Fig. S2†).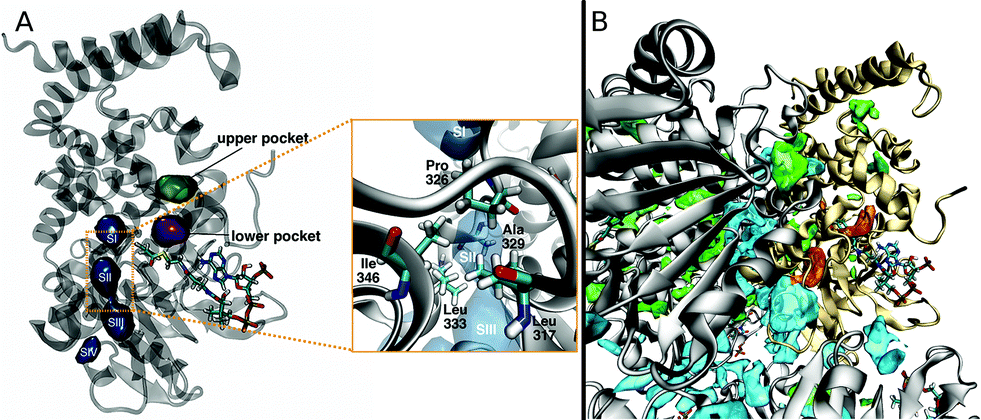 | ||
| Fig. 4 (A) Pockets where O2 is found along complete paths, representation generated based on O2 occupancy. (B) Cavities identified by MDpocket as being available 50% of the time. Orange: pockets where O2 resides along complete entries and escapes. Green: other pockets located inside a single subunit. Blue: pockets located between subunits. One of the subunits in the hexamer is highlighted in yellow for reference. | ||
The pockets where O2 is found during complete entries and escapes are dynamic. Analysis by a geometry-based cavity detection algorithm (MDpocket34) reveals that the lower pocket is available roughly 50% of the time in all protein subunits, while the upper pocket is only available 10–40% of the time. SIII is also available 50% of the time in all subunits, while the rest of the pockets along the S1 pathway display more variability between subunits (see Fig. S3† for more details). In addition to these pockets, MDpocket also identified several other cavities, shown in Fig. 4B, that are frequently populated by O2 in our simulations. Many of these are located between protein subunits and play an important role in allowing O2 access to the entry point of the S1 pathway.
Implicit Ligand Sampling (ILS) post-processing of MD simulations provides further insight into the free energy landscape of the O2 diffusion pathways. This method evaluates the energy associated with placing an O2 molecule at any point of a 3-dimensional grid.35Fig. 5 summarizes the free energy profiles obtained for each pathway, with all values relative to O2 in the solvent. The lower and SII pockets display the lowest free energy, but all pockets stabilize O2 with respect to the solvent. The free energy of the lower pocket (−4.3 kcal mol−1) is comparable to the one observed for the active site of lipoxygenase (−4.7 kcal mol−1).4 It was also possible in all cases to identify hydrophobic surface sinks that concentrate O2 at the pathway gates, in agreement with other computational studies.3,4 For pathways L1, L2, and U1 the barriers for O2 entry were in the 1.2 to 1.6 kcal mol−1 range, also similar in value to those observed in lipoxygenase using the same method.4 In agreement with the molecular dynamics results, the lowest barrier of the three was observed for L1, and the highest for U1. In contrast, the S1 pathway displays larger free energy barriers and in particular the one for the transition between SII and SI is ∼10 kcal mol−1. This very large barrier is consistent with the low frequency for the S1 pathway in the MD simulations, where we observe the transition between these pockets only twice, but we see O2 in the rest of the pockets along the S1 pathway more frequently. It is important to note that due to the high barrier observed for this pathway, ILS alone would probably not have identified it as a viable access channel.
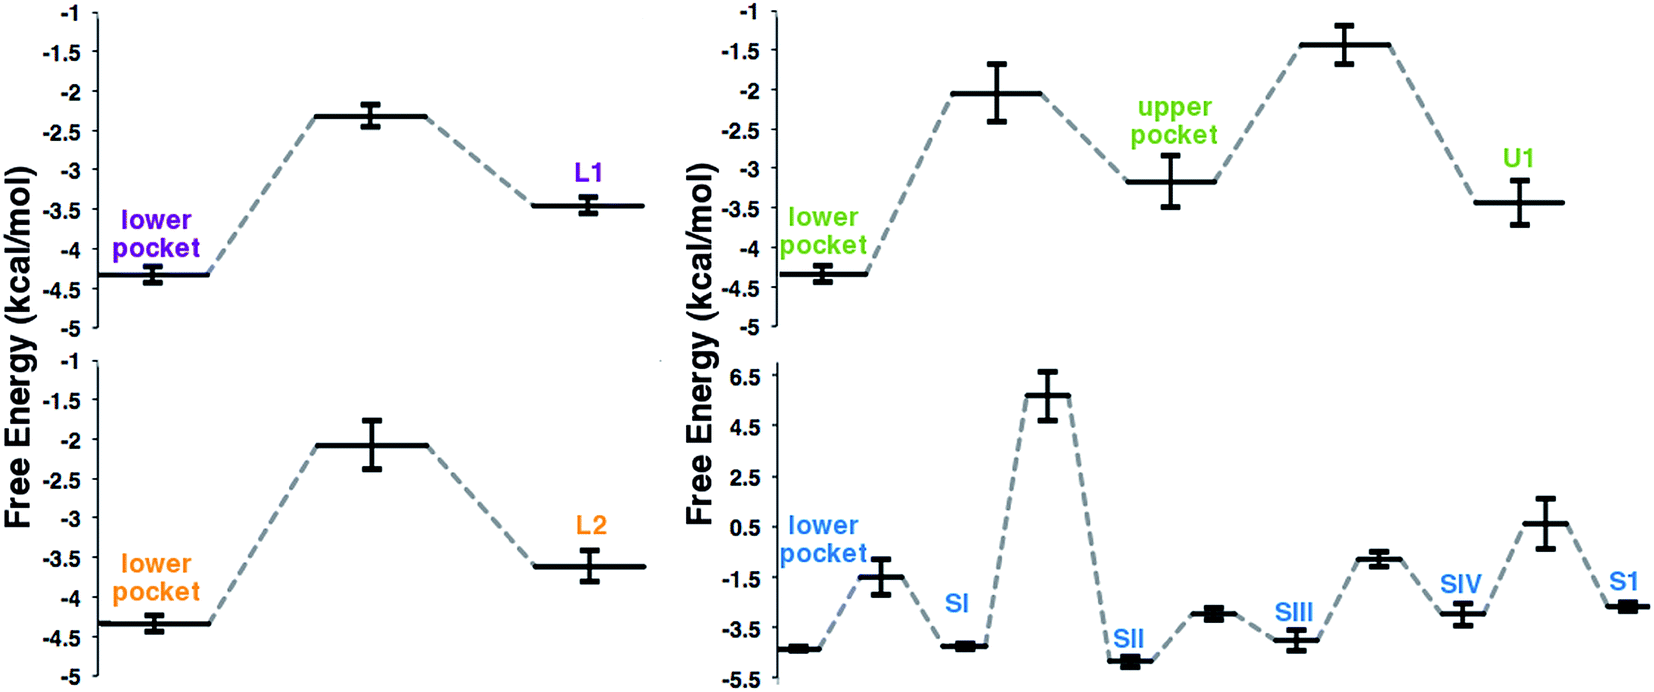 | ||
| Fig. 5 Free energy profile for O2 migration along pathways L1, L2, U1, and S1. Free energies are relative to O2 in the solvent. Error bars correspond to the standard error for the six different subunits. | ||
F432W and F432Y hinder O2 diffusion along the L1 pathway
Since the L1 pathway was observed with a high frequency, we expect mutations that alter access to this pathway to have a significant impact on kinetic parameters affected by O2 diffusion rates. Using site-directed mutagenesis, we targeted F432 and mutated it to a residue with larger steric bulk (F432W), to a smaller amino acid (F432L), and to tyrosine. In the F432Y mutant, the interactions between the phenol and DPA-CoA anchor the mutated residue producing a loss of mobility that hinders access through the L1 pathway. Short molecular dynamics simulations of the mutants reveal that in F432W the percentage of time the L1 pathway gate is open decreases by ∼10%, and by ∼15% in F432Y (Table S8†).All mutants exhibited a drop in kScat and KSM in kinetic measurements with varying DPA-CoA concentrations (Table 1). F432L retained less than 20% of the WT's catalytic activity and displayed a ∼50% decrease in the DPA-CoA binding constant driven by a reduction in the binding enthalpy (Table S10†). Since the mutation affected substrate binding, F432L cannot be used to evaluate the effect of altering O2 access to the L1 pathway and was ruled out from further consideration. For both F432W and F432Y kScat and KSM decrease in the same proportion, as expected for mutations that decrease the rate of O2 diffusion into the active site (see ESI†). Kinetics experiments with varying concentrations of O2 confirm this observation, revealing a significant decrease in  . Assuming that the mutations did not affect the catalytic activity of DpgC this represents a ∼300% increase in
  , consistent with a large decrease in the conductivity of the L1 pathway. In agreement with our mutant simulations, the decrease in
  is larger in F432Y due to the larger impact of this mutation on the percentage of time that this pathway is accessible.
| Mutant | DPA-CoA kinetics | O2 kinetics | ||
|---|---|---|---|---|
| K SM (μM) | k Scat (s−1) | k Scat/KSM (μM−1 s−1) |
|
|
| WT | 2.3 ± 1.8 | 0.15 ± 0.02 | 0.07 ± 0.02 | 2.2 ± 0.1 |
| F432W | 1.1 ± 0.4 | 0.081 ± 0.006 | 0.07 ± 0.01 | 0.81 ± 0.05 |
| F432Y | 1.9 ± 0.6 | 0.125 ± 0.009 | 0.07 ± 0.01 | 0.52 ± 0.05 |
| F432L | 0.5 ± 0.2 | 0.03 ± 0.02 | 0.06 ± 0.02 | N/A |
| A329L | 6.6 ± 1.9 | 0.017 ± 0.001 | 0.0026 ± 0.0004 | 1.1 ± 0.2 |
| L361A | 4.4 ± 1.1 | 0.18 ± 0.02 | 0.042 ± 0.005 | 2.1 ± 0.2 |

Xenon binds along the S1 pathway
According to the results of our molecular dynamics simulations, O2 diffusion along the S1 pathway takes place with low probability and, as a consequence, we expect mutations that alter this pathway to have a relatively small impact on kinetic parameters affected by O2 diffusion rates. Using site-directed mutagenesis, we substituted a residue at the S1 gate for a less sterically hindering one expected to increase conductivity through the pathway (L361A), and an amino acid located near the bottleneck region between the SII and SIII pockets for a bulkier one (A329L, Fig. 4A).The L361A mutant exhibited an increase in both kScat and KSM in kinetic measurements with varying DPA-CoA concentrations (Table 1) but these did not increase by the same factor, as expected from a mutation that increases the rate of O2 diffusion without affecting DPA-CoA binding or catalysis (see ESI†). While KSM is approximately 2 times larger than that for WT DpgC and the kScat is 20% larger, these increases are not statistically significant. In line with these observations, kinetic measurements with varying O2 concentrations produced results that are indistinguishable from those of the WT protein.
The A329L mutant retained only ∼10% of the WT catalytic activity, while its KSM is approximately 3 times larger. Such a drastic reduction in kScat is unexpected from a conservative, non-active site mutation targeting an infrequently used pathway, especially considering the minimal impact of the L361A mutation. Kinetic measurements with varying O2 concentrations exhibit a significant decrease in 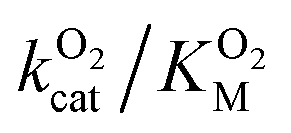 . Assuming that the mutation did not affect the catalytic activity of DpgC, this represents a 100% increase in
  , implying a large decrease in the conductivity of the L1 pathway. However, the large unexpected loss of catalytic activity caused by the mutation suggests that this might not be a justified assumption.
Additional insight into the role of the S1 pathway in O2 diffusion comes from X-ray diffraction experiments applying Xe as an O2 probe. Using Xe to study gas migration is a powerful tool because its anomalous signal allows clear identification and its polarizability and van der Waals radius are comparable to those of diatomic molecules like O2, CO, and NO.5,7 Exposing DpgC crystals to 300–500 psi of Xe revealed two binding sites, none of them corresponding to the crystallographically observed O2 binding site (Fig. 6 PDB: 4YLH). The minor site (Xe2) is located in the hydrophobic SIII pocket, which according to our MDpocket calculations is the only pocket along the S1 pathway that is available at least 50% of the time. This site is regularly visited by O2 during complete trajectories along the S1 pathway. In contrast, O2 does not populate the major Xe binding site, which can only be accessed by displacing F315 from its typical conformation. In our simulations, F315 is part of the boundary of the SIII pocket and prevents O2 from diffusing closer to the protein surface, adopting the alternative conformation only 9% of the time (Fig. S9†). ILS calculations reveal that the Xe1 and Xe2 sites display a binding free energy of −4.6 and −4.4 kcal mol−1 respectively (see ESI† for more details). These, combined with the high hydrophobicity of the sites, explain why Xe binds to these sites only and not to the active site, which is more polar and solvent-accessible. Similar observations were made for cofactorless urate-oxidase, where the relatively polar O2 binding site in the active site does not match the Xe binding sites.17
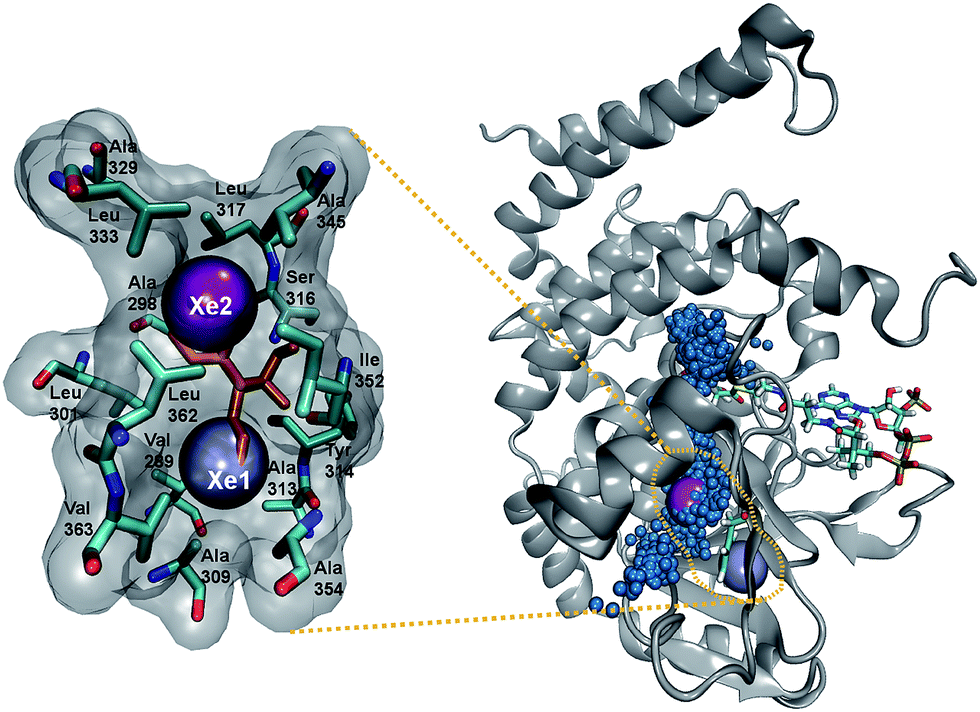 | ||
| Fig. 6 Left: Residues lining the Xe-binding sites, hydrogen atoms not shown. The two observed conformations of F315 are shown in orange. Right: location of the Xe-binding sites within one of the DpgC subunits. The blue dots represent the positions of O2 along a trajectory where it escaped using the S1 pathway. F315 and DPA-CoA shown for reference. | ||
Discussion
Pathways and gates for ligand diffusion – simulation vs. experiment
Based on the results of our molecular dynamics simulations, O2 diffusion in DpgC occurs through three main pathways with four distinct access points. In general, computational studies of small gas molecule diffusion in proteins also find multiple pathways and gates.3,4,6,14,36,37 However, these results must be interpreted carefully. Ligand diffusion in myoglobin has been extensively studied, and most experiments agree on diffusion taking place 70–80% of the time through a single access point known as the histidine gate.14 While there is good agreement between simulations and experiments with respect to identifying ligand-binding cavities and connections between them, simulations usually predict the existence of multiple gates. Ruscio et al. used molecular dynamics simulations to identify two main CO diffusion pathways, which connected all Xe-binding sites, with nine total gates.6 While the simulations correctly identify the histidine gate as the most frequently used access point, it only accounts for ∼30% of all complete entries and escapes. Although the multiple pathways and gates model does not provide a description of small ligand diffusion that fully agrees with experimental results for globins, it seems to be a good representation for other proteins such as copper-containing amine oxidase, where mutations blocking individual pathways have little effect on kcat/KM(O2).38In the case of DpgC, our simulations point to one pathway and gate accounting for a large majority of the complete entries and escapes observed and, in agreement with this observation, mutations that hinder access into L1 reduce 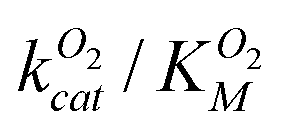 . While mutating the gate to the S1 pathway had negligible effect, the conservative A329L mutation had an unexpectedly large effect. This mutation blocks the SIII pocket and, as a result, the minor Xe-binding sites. The SIII pocket is available at least 50% of the time during our simulations and is connected to the other pathways at the active site. Taken together, this data suggests the possibility of the SIII pocket acting as a temporary O2 storage. A complete assessment of the importance of the different pathways would require mutations along U1 and L2. We evaluated different possible mutations using short molecular dynamics simulations but found that these altered the protein structure affecting more than one pathway at a time (see ESI† for more details).
O2 pathways guide regio- and stereospecificity
According to our simulations, in DpgC O2 only has access to DPA-CoA from one face, in agreement with labeling experiments that suggest stereochemical hydrogen abstraction, and O2 attack from the opposite face.26,33 Other enzymes also exert regio and stereoselectivity by guiding O2 to specific positions within the active site.37 Implicit ligand sampling simulations of 12/15-lipoxygenase show that oxygen concentrates around a specific carbon atom in a position that promotes O2 insertion from the opposite face as hydrogen abstraction.4 Enhanced-statistics molecular dynamics in two different flavoenzymes revealed funnel-like pathways that guide O2 to the re-side of the flavin C4a atom.3 Thus, the positions and connections of the O2 access channels play a key role in determining the identity of the reaction products in metal-dependent, flavin-dependent and cofactor-dependent oxygenases suggesting that this strategy is conserved among many different types of enzymes.Binding vs. consuming O2: avoiding enzyme inactivation
O2 activation takes place in a series of one-electron reactions producing highly reactive radical intermediates that can cause oxidative inactivation. Enzymes evolved a number of strategies to minimize the damage caused by these side-reactions.12 As mentioned above, O2 diffusion channels provide regio- and stereochemical control of the reaction products. In addition, most enzymes use metals or organic cofactors such as flavin to control the reactivity of the oxygen intermediates. In particular, many flavoenzymes display very low O2 binding affinities with kinetics that show no saturation with O2, effectively consuming O2 without binding it tightly.37DpgC is a cofactor-independent dioxygenase displaying negligible oxidative inactivation and reaction side-products and as such can provide interesting insight into how proteins control O2 reactivity in the absence of metals and organic cofactors. Reactive oxygen species have been implicated in the mechanism of DpgC and other cofactor-independent oxygenases.23,26,33,39,40 Sulfur-containing amino acid residues are particularly sensitive to oxidation by reactive oxygen species.41 Interestingly, in DpgC none of these residues are located along the diffusion pathways found to lead O2 into the active site (Fig. S5†). In addition, the number of entries and escapes observed in DpgC are ∼10 times higher than those reported in molecular dynamics simulations of myoglobin6 and flavin-dependent enzymes3 (Table S7†), after accounting for differences in simulation times and O2 concentrations. However, although DpgC concentrates O2 in the active site by 10–60 times compared to having O2 uniformly distributed, this is significantly less than in the case of lipoxygenase (50–100 times)4 and flavin-dependent D-amino acid oxidase (∼400 times).11 Taken together, this data suggests that in the absence of metals or cofactors, enzymes such as DpgC may control O2 reactivity through weak binding that minimizes unproductive O2 residence times in the active site, compensated with a higher frequency of O2 entries.
Conclusions
The results of our computational simulations, supported by the mutagenesis experiments and Xe-binding data provide direct evidence for the existence of functional O2 diffusion pathways in a cofactor-independent oxygenase. Although DpgC is rare in its ability of activating O2 in the absence of cofactors or metals, the way this gas molecule reaches the active site is similar to what other authors report for flavoenzymes,3 metal-dependent oxygenases4 and even globins:6 multiple pathways can be involved, and the architecture of the pathway network can play an important role in controlling regio- and stereoselectivity. These results point to the existence of common themes in O2 access that are conserved among very different types of proteins.O2 diffusion in DpgC takes place through three main pathways with four access points, with the L1 pathway accounting for most of the observed diffusion events in our simulations. These pathways guide O2 to a specific face of DPA-CoA, in agreement with labeling experiments that point to stereochemical hydrogen abstraction.26,33 The pathways connect a series of dynamic hydrophobic pockets. The lower pocket, where O2 was crystallographically observed, concentrates O2 and positions it for reaction with DPA-CoA. Our computational results highlight the importance of simulating the complete biological unit whenever possible, as diffusion between protein subunits is important to obtain an accurate description of the S1 pathway. In addition, molecular dynamics provide unbiased O2 diffusion pathways, as only the protein and solvent guide O2 motion, granting information about the relative importance of each pathway that is hard to obtain from cavity-detection methods.
Methods
Molecular dynamics simulations
All simulations were performed using the AMBER12 suite.42 The ff99SB force field parameters were used for all residues43 except DPA-CoA. Parameters for this molecule were generated combining published parameters for adenosine triphosphate44 and HF/6-31G* Gaussian09![[thin space (1/6-em)]](https://www.rsc.org/images/entities/char_2009.gif) 45 calculations. The five non-modeled C-terminal residues in the crystal structure of DpgC (PDB: 2NP9, 2.45 Å resolution) were added manually and the non-hydrolyzable substrate-analogue was substituted with substrate DPA-CoA. O2 was kept in the crystallographically observed position. All simulations were performed in an octahedral box of TIP3P water using periodic boundary conditions, with a size consistent with an O2 concentration in the order of an O2 saturated solution (5 mM; for comparison, an O2 saturated buffer is ∼1.2 mM). The net negative charge of the system was neutralized adding Na+ atoms. Details on how the system was minimized, heated and equilibrated are available in the ESI.† All production simulations were performed at 300 K, maintained using a Langevin thermostat with a 2 ps−1 constant for temperature coupling. The SHAKE algorithm was used to keep bonds involving hydrogen atoms at their equilibrium length. Newton's equations were integrated using a 2 fs time step. Frames were collected every 5000 steps. 5 independent production simulations were performed, each approximately 100 ns long.
45 calculations. The five non-modeled C-terminal residues in the crystal structure of DpgC (PDB: 2NP9, 2.45 Å resolution) were added manually and the non-hydrolyzable substrate-analogue was substituted with substrate DPA-CoA. O2 was kept in the crystallographically observed position. All simulations were performed in an octahedral box of TIP3P water using periodic boundary conditions, with a size consistent with an O2 concentration in the order of an O2 saturated solution (5 mM; for comparison, an O2 saturated buffer is ∼1.2 mM). The net negative charge of the system was neutralized adding Na+ atoms. Details on how the system was minimized, heated and equilibrated are available in the ESI.† All production simulations were performed at 300 K, maintained using a Langevin thermostat with a 2 ps−1 constant for temperature coupling. The SHAKE algorithm was used to keep bonds involving hydrogen atoms at their equilibrium length. Newton's equations were integrated using a 2 fs time step. Frames were collected every 5000 steps. 5 independent production simulations were performed, each approximately 100 ns long.
The free energy profile for O2 migration in DpgC was computed using implicit ligand sampling (ILS) post-processing.35 This method has previously been used to study migration of CO in heme proteins,46–48 and of O2 in lipoxygenase.4 Post-processing was performed on 3000 frames of one MD simulation of DpgC, and each subunit was processed individually in parallel. ILS calculations were performed on a rectangular grid (0.5 Å resolution) using an O2 molecule as probe.
Kinetic measurements
The kinetic parameters for DPA-CoA were determined using the DTNB [5,5′-dithiobis(2-nitrobenzoic acid)] reporter assay as described elsewhere24,33 with one modification: the concentration of enzyme used was 0.8 μM. Briefly, a freshly prepared solution of DTNB (1 mM), Tris–HCl (250 mM, pH = 7.5), and increasing concentrations of DPA-CoA were mixed with the enzyme (0.8 μM) at 24 °C (1 mL reaction volume). The reactions were monitored in a UV-vis spectrophotometer (Agilent) at 412 nm for 5 min. The observed initial rate of absorbance increase was converted to initial reaction velocity (V0) using ε412 nm = 13600 M−1 cm−1. KSM and kScat were determined by performing a non-linear regression to a plot of V0vs. [DPA-CoA].
The kinetic parameters for O2 were determined as described elsewhere49 using a fluorescence quenching based probe (Ocean Optics) in an airtight cuvette. All experiments were performed at 25 °C with continuous 1000 rpm stirring, using 83 μM DPA-CoA and varying concentrations of O2. The reaction buffers were prepared by injecting different volumes of O2-saturated buffer into the cuvette containing varying volumes of air-equilibrated buffer and DPA-CoA. The assay was initiated by injection of DpgC (1.67 μM) into the reaction vessel. Data was collected every 0.1 s. Initial velocities were determined from the initial change in oxygen concentration observed after accounting for non-enzymatic decrease in oxygen levels. Since the  for DpgC is larger than the concentration of O2 in a saturated solution,33 it is not possible to obtain data above
  and it is more convenient to work under the assumption that
  and fit the data to a linear equation with slope
  .
.
Xe-pressurized crystallography
DpgC-inhibitor co-complex crystals, obtained as described elsewhere,33 were placed in a xenon pressure chamber (Hampton research) for ∼15 minutes with pressures of 300 to 500 psi. The Xenon equilibrated crystals were flash frozen and diffraction data collected on the X12B beamline of NSLS at Brookhaven National Laboratory at a wavelength of 1.500 Å. The data was processed using the XDS program50 in the space group P21 (a = 139.1 Å, b = 171.0 Å, c = 156.0 Å, β = 90.02°). The structures were solved using the trimer from PDB 2NP9 as a starting model to find twelve monomers in the asymmetric unit (Matthews coefficient of 3.23 Å3 Da−1 and 61.94% solvent). Xe sites were added manually based on anomalous difference electron density maps51 and the total structure was refined until Rwork/Rfree converged to 0.17/0.20% using refmac52 (Table S9†). Structural figures were prepared using PyMOL53 or VMD.54Acknowledgements
We are grateful to Paul Widboom for collection of X-ray diffraction data on Xenon-pressurized crystals and Juan Pablo Bustamante for his assistance with ILS calculations. This work was supported by the National Institutes of Health (Grant GM086570, SDB) and the National Science Foundation (ACI-1147910, AER). Computational support was provided by the Keeneland Computing Facility at the Georgia Institute of Technology, supported by the National Science Foundation under Contract OCI-0910735, and the University of Florida High Performance Computing Center. NVDR is an HHMI International Student Research Fellow.References
- D. B. Calhoun, J. M. Vanderkooi, G. V. Woodrow and S. W. Englander, Biochemistry, 1983, 22, 1526–1532 CrossRef CAS
.
- M. S. Shadrina, A. M. English and G. H. Peslherbe, J. Am. Chem. Soc., 2012, 134, 11177–11184 CrossRef CAS PubMed
- R. Baron, C. Riley, P. Chenprakhon, K. Thotsaporn, R. T. Winter, A. Alfieri, F. Forneris, W. J. H. van Berkel, P. Chaiyen, M. W. Fraaije, A. Mattevi and J. A. McCammon, Proc. Natl. Acad. Sci. U. S. A., 2009, 106, 10603–10608 CrossRef CAS PubMed
- J. Saam, I. Ivanov, M. Walther, H.-G. Holzhütter and H. Kuhn, Proc. Natl. Acad. Sci. U. S. A., 2007, 104, 13319–13324 CrossRef CAS PubMed
- V. M. Luna, J. A. Fee, A. A. Deniz and C. D. Stout, Biochemistry, 2012, 51, 4669–4676 CrossRef CAS PubMed
- J. Z. Ruscio, D. Kumar, M. Shukla, M. G. Prisant, T. M. Murali and A. V. Onufriev, Proc. Natl. Acad. Sci. U. S. A., 2008, 105, 9204–9209 CrossRef CAS PubMed
- M. B. Winter, M. A. Herzik, J. Kuriyan and M. A. Marletta, Proc. Natl. Acad. Sci. U. S. A., 2011, 108, E881–E889 CrossRef CAS PubMed
- P. Wang and J. Blumberger, Proc. Natl. Acad. Sci. U. S. A., 2012, 109, 6399–6404 CrossRef CAS PubMed
- P. Wang, M. Bruschi, L. De Gioia and J. Blumberger, J. Am. Chem. Soc., 2013, 135, 9493–9502 CrossRef CAS PubMed
- A. S. F. Oliveira, J. M. Damas, A. M. Baptista and C. M. Soares, PLoS Comput. Biol., 2014, 10, e1004010 Search PubMed
- J. Saam, E. Rosini, G. Molla, K. Schulten, L. Pollegioni and S. Ghisla, J. Biol. Chem., 2010, 285, 24439–24446 CrossRef CAS PubMed
- J. P. Klinman, Acc. Chem. Res., 2007, 40, 325–333 CrossRef CAS PubMed
- J. Cohen and K. Schulten, Biophys. J., 2007, 93, 3591–3600 CrossRef CAS PubMed
- R. Elber, Curr. Opin. Struct. Biol., 2010, 20, 162–167 CrossRef CAS PubMed
- M. Milani, A. Pesce, Y. Ouellet, S. Dewilde, J. Friedman, P. Ascenzi, M. Guertin and M. Bolognesi, J. Biol. Chem., 2004, 279, 21520–21525 CrossRef CAS PubMed
- A. Pesce, M. Nardini, S. Dewilde, L. Capece, M. A. Martí, S. Congia, M. D. Salter, G. C. Blouin, D. A. Estrin, P. Ascenzi, L. Moens, M. Bolognesi and J. S. Olson, J. Biol. Chem., 2011, 286, 5347–5358 CrossRef CAS PubMed
- N. Colloc'h, L. Gabison, G. Monard, M. Altarsha, M. Chiadmi, G. Marassio, J. S. O. Santos, M. E. Hajji, B. Castro, J. H. Abraini and T. Prangé, Biophys. J., 2008, 95, 2415–2422 CrossRef PubMed
- L. Boechi, M. Arrar, M. A. Martí, J. S. Olson, A. E. Roitberg and D. A. Estrin, J. Biol. Chem., 2013, 288, 6754–6762 CrossRef CAS PubMed
- A. W. Götz, M. J. Williamson, D. Xu, D. Poole, S. Le Grand and R. C. Walker, J. Chem. Theory Comput., 2012, 8, 1542–1555 CrossRef PubMed
- M. S. Friedrichs, P. Eastman, V. Vaidyanathan, M. Houston, S. Legrand, A. L. Beberg, D. L. Ensign, C. M. Bruns and V. S. Pande, J. Comput. Chem., 2009, 30, 864–872 CrossRef CAS PubMed
- M. J. Harvey, G. Giupponi and G. D. Fabritiis, J. Chem. Theory Comput., 2009, 5, 1632–1639 CrossRef CAS
- W. M. Brown, P. Wang, S. J. Plimpton and A. N. Tharrington, Comput. Phys. Commun., 2011, 182, 898–911 CrossRef CAS PubMed
- S. Fetzner and R. A. Steiner, Appl. Microbiol. Biotechnol., 2010, 86, 791–804 CrossRef CAS PubMed
- H. Chen, C. C. Tseng, B. K. Hubbard and C. T. Walsh, Proc. Natl. Acad. Sci. U. S. A., 2001, 98, 14901–14906 CrossRef CAS PubMed
- P. F. Widboom and S. D. Bruner, ChemBioChem, 2009, 10, 1757–1764 CrossRef CAS PubMed
- C. C. Tseng, F. H. Vaillancourt, S. D. Bruner and C. T. Walsh, Chem. Biol., 2004, 11, 1195–1203 CrossRef CAS PubMed
- G. Taubes, Science, 2008, 321, 356–361 CrossRef CAS PubMed
- S. Weist, C. Kittel, D. Bischoff, B. Bister, V. Pfeifer, G. J. Nicholson, W. Wohlleben and R. D. Sussmuth, J. Am. Chem. Soc., 2004, 126, 5942–5943 CrossRef CAS PubMed
- D. A. Evans, M. R. Wood, B. W. Trotter, T. I. Richardson, J. C. Barrow and J. L. Katz, Angew. Chem., Int. Ed., 1998, 37, 2700–2704 CrossRef CAS
- S. S. F. Leung, J. Tirado-Rives and W. L. Jorgensen, Bioorg. Med. Chem., 2009, 17, 5874–5886 CrossRef CAS PubMed
- D. Kahne, C. Leimkuhler, W. Lu and C. Walsh, Chem. Rev., 2005, 105, 425–448 CrossRef CAS PubMed
- H.-M. Jung, M. Jeya, S.-Y. Kim, H.-J. Moon, R. Kumar Singh, Y.-W. Zhang and J.-K. Lee, Appl. Microbiol. Biotechnol., 2009, 84, 417–428 CrossRef CAS PubMed
- P. F. Widboom, E. N. Fielding, Y. Liu and S. D. Bruner, Nature, 2007, 447, 342–345 CrossRef CAS PubMed
- P. Schmidtke, A. Bidon-Chanal, F. J. Luque and X. Barril, Bioinformatics, 2011, 27, 3276–3285 CrossRef CAS PubMed
- J. Cohen, K. W. Olsen and K. Schulten, Methods Enzymol., 2008, 437, 439–457 CAS
- A. Bucci and C. F. Abrams, J. Chem. Theory Comput., 2014, 10, 2668–2676 CrossRef CAS PubMed
- R. Baron, J. A. McCammon and A. Mattevi, Curr. Opin. Struct. Biol., 2009, 19, 672–679 CrossRef CAS PubMed
- B. J. Johnson, J. Cohen, R. W. Welford, A. R. Pearson, K. Schulten, J. P. Klinman and C. M. Wilmot, J. Biol. Chem., 2007, 282, 17767–17776 CrossRef CAS PubMed
- U. Frerichs-Deeken, K. Ranguelova, R. Kappl, J. Hüttermann and S. Fetzner, Biochemistry, 2004, 43, 14485–14499 CrossRef CAS PubMed
- A. Hernández-Ortega, M. G. Quesne, S. Bui, D. J. Heyes, R. A. Steiner, N. S. Scrutton and S. P. de Visser, J. Am. Chem. Soc., 2015, 137, 7474–7487 CrossRef PubMed
- B. S. Berlett and E. R. Stadtman, J. Biol. Chem., 1997, 272, 20313–20316 CrossRef CAS PubMed
-
D. A. Case, T. A. Darden, T. E. Cheatham III, C. L. Simmerling, J. Wang, R. E. Duke, R. Luo, R. C. Walker, W. Zhang, K. M. Merz, B. Roberts, S. Hayik, A. Roitberg, G. Seabra, J. Swails, A. W. Götz, I. Kolossváry, K. F. Wong, F. Paesani, J. Vanicek, R. M. Wolf, J. Liu, X. Wu, S. R. Brozell, T. Steinbrecher, H. Gohlke, Q. Cai, X. Ye, J. Wang, M.-J. Hsieh, G. Cui, D. R. Roe, D. H. Mathews, M. G. Seetin, R. Salomon-Ferrer, C. Sagui, V. Babin, T. Luchko, S. Gusarov, A. Kovalenko and P. A. Kollman, AMBER 12, University of California, San Francisco, 2012 Search PubMed
- V. Hornak, R. Abel, A. Okur, B. Strockbine, A. Roitberg and C. Simmerling, Proteins: Struct., Funct., Bioinf., 2006, 65, 712–725 CrossRef CAS PubMed
- K. L. Meagher, L. T. Redman and H. A. Carlson, J. Comput. Chem., 2003, 24, 1016–1025 CrossRef CAS PubMed
-
M. J. Frisch, G. W. Trucks, H. B. Schlegel, G. E. Scuseria, M. A. Robb, J. R. Cheeseman, G. Scalmani, V. Barone, B. Mennucci, G. A. Petersson, H. Nakatsuji, M. Caricato, X. Li, H. P. Hratchian, A. F. Izmaylov, J. Bloino, G. Zheng, J. L. Sonnenberg, M. Hada, M. Ehara, K. Toyota, R. Fukuda, J. Hasegawa, M. Ishida, T. Nakajima, Y. Honda, O. Kitao, H. Nakai, T. Vreven, J. A. Montgomery Jr, J. E. Peralta, F. Ogliaro, M. Bearpark, J. J. Heyd, E. Brothers, K. N. Kudin, V. N. Staroverov, R. Kobayashi, J. Normand, K. Raghavachari, A. Rendell, J. C. Burant, S. S. Iyengar, J. Tomasi, M. Cossi, N. Rega, J. M. Millam, M. Klene, J. E. Knox, J. B. Cross, V. Bakken, C. Adamo, J. Jaramillo, R. Gomperts, R. E. Stratmann, O. Yazyev, A. J. Austin, R. Cammi, C. Pomelli, J. W. Ochterski, R. L. Martin, K. Morokuma, V. G. Zkrzewski, G. A. Voth, P. Salvador, J. J. Dannenberg, S. Dapprich, A. D. Daniels, Ö. Farkas, J. B. Foresman, J. V. Ortiz, J. Cioslowski and D. J. Fox, Gaussian 09 Revision A.1, 2009 Search PubMed
- J. P. Bustamante, S. Abbruzzetti, A. Marcelli, D. Gauto, L. Boechi, A. Bonamore, A. Boffi, S. Bruno, A. Feis, P. Foggi, D. A. Estrin and C. Viappiani, J. Phys. Chem. B, 2014, 118, 1234–1245 CrossRef CAS PubMed
- I. Boron, J. P. Bustamante, K. S. Davidge, S. Singh, L. A. Bowman, M. Tinajero-Trejo, S. Carballal, R. Radi, R. K. Poole, K. Dikshit, D. A. Estrin, M. A. Marti and L. Boechi, F1000Research, 2015, 4, 22 Search PubMed
- F. Forti, L. Boechi, D. A. Estrin and M. A. Marti, J. Comput. Chem., 2011, 32, 2219–2231 CrossRef CAS PubMed
- N. V. Di Russo, S. D. Bruner and A. E. Roitberg, Anal. Biochem., 2015, 475, 53–55 CrossRef CAS PubMed
- W. Kabsch, Acta Crystallogr., Sect. D: Biol. Crystallogr., 2010, 66, 125–132 CrossRef CAS PubMed
- P. Emsley and K. Cowtan, Acta Crystallogr., Sect. D: Biol. Crystallogr., 2004, 60, 2126–2132 CrossRef PubMed
- G. N. Murshudov, P. Skubák, A. A. Lebedev, N. S. Pannu, R. A. Steiner, R. A. Nicholls, M. D. Winn, F. Long and A. A. Vagin, Acta Crystallogr., Sect. D: Biol. Crystallogr., 2011, 67, 355–367 CrossRef CAS PubMed
-
Pymol: The PyMOL Molecular Graphics System, Schrödinger, LLC Search PubMed
- W. Humphrey, A. Dalke and K. Schulten, J. Mol. Graphics, 1996, 14, 33–38 CrossRef CAS
Footnote |
| † Electronic supplementary information (ESI) available. See DOI: 10.1039/c5sc01638j |
| This journal is © The Royal Society of Chemistry 2015 |