 Open Access Article
Creative Commons Attribution 3.0 Unported Licence
An insight into local environment of lanthanide ions in Sr2SiO4:Ln (Ln = Sm, Eu and Dy)†
Santosh K.
Gupta
*a,
Sandeep
Nigam
b,
Ashok K.
Yadav
c,
Manoj
Mohapatra
a,
Shambhu N.
Jha
b,
Chiranjib
Majumder
b and
Dibyendu
Bhattacharyya
c
aRadiochemistry Division, Bhabha Atomic Research Centre, Mumbai 400085, India. E-mail: santufrnd@gmail.com; Fax: +91-22-25505151; Tel: +91-22-25590636
bChemistry Division, Bhabha Atomic Research Centre, Mumbai 400085, India
cAtomic and molecular physics Division, Bhabha Atomic Research Centre, Mumbai 400085, India
First published on 15th June 2015
Abstract
Sr2SiO4 is an important inorganic host for lanthanide-doped white-light-emitting diodes. In order to probe the local structure and symmetry around lanthanide ions in Sr2SiO4, detailed experimental and theoretical investigations have been carried out. Samples prepared via sol–gel methods were thoroughly characterized using X-ray diffraction (XRD), extended X-ray absorption fine structure (EXAFS) and photoluminescence (PL) spectroscopy. The local symmetries of SrO9 and SrO10 polyhedra were determined using emission spectroscopy with europium as the probe ion. Despite having the same oxidation state and comparable ionic radii, Sm3+, Dy3+ and Eu3+ behave differently in terms of their site occupation at the Sr sites of SrO9 and SrO10 polyhedra. While Eu replaces Sr in both polyhedra, Sm and Dy reside specifically at the 9-coordinated Sr sites only. Based on density functional theory (DFT) calculations, it has been established that for Dy and Sm, the strong metal–oxygen bonding leads to significant distortion and hence the destabilization of MO10 polyhedra in the host.
1. Introduction
Strontium silicate is an important luminescence host and has been extensively investigated for white LEDs applications. Park et al. synthesized Eu2+-doped Sr2SiO4 yellow phosphor, which was found to produce white emission in combination with a blue-emitting GaN single crystal,1 and its efficiency was found to be better than that of commercially viable white phosphor. It was also reported that co-doping Ce3+ in Eu2+-doped Sr2SiO4 phosphor also leads to white emission.2A large number of reports have been published recently in the literature relating to the various technological applications of lanthanide ions-doped Sr2SiO4 such as in solid-state lighting,3,4 as a thermochromic material,5 as a dosimeter,6 in long-afterglow phosphors,7 in IR detection8 and in long-lasting phosphorescence.9
Catti et al.10 discussed the crystal structure of Sr2SiO4 and reported that its unit cell consists of two different types of strontium ion; nine-coordinated Sr2+ (Sr2) and 10-coordinated Sr2+ (Sr1). They also discussed the local symmetry of SrO9 and SrO10 and confirmed that SrO9 is relatively less symmetrical than SrO10, which has a hexagonal symmetry. In systems where multiple doping sites are available (Sr2 and Sr1), spectroscopic information related to local sites and their point symmetry is crucial for optimizing their optical performance for technological applications. Information about site occupancy can only be obtained via X-ray diffraction (XRD) at very high dopant ion concentrations (≥5.0%), which may affect the efficiency of the luminescent material by concentration quenching. Therefore, the actual site symmetry of a dopant in a cationic site cannot be revealed from crystallographic data. Especially when these types of inorganic hosts are used to incorporate lanthanide ions for luminescence applications, it becomes extremely important to acquire the knowledge of the site occupancy of a particular Ln3+ ion. Further incorporation of Ln3+ ions at a particular site leads to changes in the local surrounding environment in the doped host. Understanding these changes in the local environment is quite important for visualizing the overall changes in the host lattice. Furthermore, since luminescence properties are strongly dependent on the local structure around the phosphor, it is of utmost importance to know the local symmetry around the lanthanide ions.
In an individual work, we extensively studied the luminescence properties of Sm3+, Eu2+, Eu3+ and Dy3+.11–14 Studying the local site occupancy of lanthanide or any dopant ion in a system wherein multiple coordinations or sites are available is very important for correlation between structural and various properties, viz. optical, magnetic, and catalytic. These properties are strongly influenced by local structure and site symmetry.
In the present study, we have given a complete picture of the behavior of lanthanide ions in terms of their site occupancy in Sr2SiO4. We carried out an exhaustive experimental and theoretical investigation to obtain in-depth knowledge about the local symmetry of SrO9 and SrO10 polyhedra in Sr2SiO4. Furthermore, we aimed to understand the factors responsible for the substitution of Sr ions at different sites by three different rare-earth ions, namely, Sm3+, Dy3+ and Eu3+. The choice of these three ions is guided by the fact that a combination of these three ions has the potential to generate white light. Time-resolved fluorescence spectroscopy (TRFS) by using emission spectroscopy, emission kinetics and extended X-ray absorption fine structure (EXAFS) measurements have been used to determine the local environment around three lanthanide ions in an Sr2SiO4 host. These experimental results were further substantiated using density functional theory (DFT) calculations.
2. Experimental
2.1. Sample preparation
All the chemicals employed for the sample preparation were of analytical reagent (AR) grade and procured from Sigma Aldrich. Sr2SiO4 samples were prepared via a sol–gel route using tetraethyl orthosilicate (TEOS) as a Si precursor and strontium nitrate as a Sr precursor. High-purity oxides of Sm, Eu and Dy (SPEX Industries, INC., USA) were used for lanthanide ion doping. Details of the synthesis procedure are mentioned in our earlier study.11–14 For a Eu2+-doped sample, a Eu3+-doped Sr2SiO4 sample was subjected to heating at 600 °C for 6 h under a reducing atmosphere (92% Ar + 8% H2) for the conversion of Eu3+ to Eu2+.2.2. Instrumentation
The phase purity of the prepared phosphor was confirmed by X-ray diffraction (XRD). Measurements were carried out on a STOE X-ray diffractometer equipped with a scintillation counter and graphite monochromator. Diffraction patterns were obtained using monochromatic Cu Kα radiation (λ = 1.5406 Å) keeping the scan rate at 1 s per step in the scattering angle range (2θ) from 10° to 70°. Kα2 reflections were removed by a stripping procedure to obtain accurate lattice constants.All the luminescence spectra were obtained using an Edinburgh FL920 instrument with a variable frequency of 10–100 Hz equipped with a 150 W xenon lamp and an M300 monochromator. Our systems were equipped with double monochromators in either or both excitation and emission arms. The use of double monochromators increases the linear dispersion, and the stray light suppression is improved compared to that achieved by single monochromators. The system also consists of CD920 integrated control electronics and an S900 detector. Powder samples were dispersed in methanol for measurements. Data acquisition and analysis were carried out by F-900 software provided by Edinburgh Analytical Instruments, UK. A Xenon flash lamp with a frequency range of 10–100 Hz was used as the excitation source. The emission spectrum for a particular sample was obtained with a lamp frequency of 100 Hz. Multiple scans (at least five) were taken to minimize fluctuations in peak intensity and maximize the S/N ratio. Fluorescence lifetime measurements were based on the well-established time-correlated single-photon counting (TCSPC) technique. EXAFS experiments were performed at the Raja Ramanna Centre for Advanced Technology (RRCAT), Indore, India, at the dispersive beamline BL-8 in transmission mode using the 2.5 GeV 100 mA INDUS-2 synchrotron source. Other related information on instrumentation and sample preparation for EXAFS measurements is mentioned in our earlier reports.15–17
3. Results and discussion
3.1. Powder X-ray diffraction (PXRD): phase purity and crystal structure
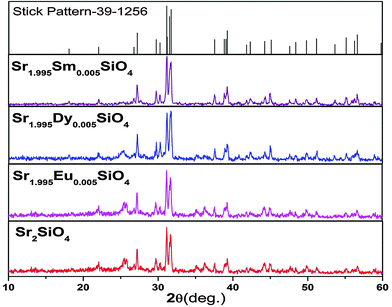
The purity and crystallinity of the as-prepared Sr2SiO4 and Sr2SiO4:Ln3+ (Ln = Eu, Dy, Sm) samples were characterized using powder X-ray diffraction (XRD). It can be seen from the XRD patterns in Fig. 1 that the diffraction peaks of both Sr2SiO4 and Sr2SiO4:Ln3+ (Ln = Eu, Dy, Sm) samples could be indexed to the orthorhombic phase of α′-Sr2SiO4 (JCPDS card No. 39-1256).XRD data consisting of hkl values and an interplanar spacing corresponding to α′-Sr2SiO4 were also evaluated (ESI,† Table T1). The incorporation of lanthanide ions does not change the XRD pattern, which confirms that doping is appropriate and has not distorted the structure of strontium silicate. As no impurity peaks were observed, it is possible to suggest that both samples are a single phase of α′-Sr2SiO4. No obvious shifting of peaks or other impurity phases can be detected in Ln3+-doped samples, which indicates that Ln3+ ions are efficiently dissolved in the Sr2SiO4 host lattice by replacing Sr2+ because of their similar ionic radii and very low levels of doping (0.5 mol%).
Fig. 2 shows the crystal structure of α′-Sr2SiO4 and the coordination geometry of the Sr2+ ion. Its structure is well described in the literature and shows a close resemblance to the similar non-close-packed K2SiO418 structure. In one unit cell of α′-Sr2SiO4, there are 28 atoms: 8 Sr, 4 Si and 16 O atoms. Out of 8 strontium atoms, 4 are Sr(1) and 4 are Sr(2), i.e. the distribution ratio of SrO9 to SrO10 is 50![[thin space (1/6-em)]](https://www.rsc.org/images/entities/char_2009.gif) :
:![[thin space (1/6-em)]](https://www.rsc.org/images/entities/char_2009.gif) 50. Si atoms in SiO4 tetrahedra form a parallel chain. The Sr(1) sites are arranged in the form of linear chains (Si–O–Sr(1)–O–Sr(2)), whereas the Sr(2) sites display zigzag patterns of (Sr(1)–O–Sr(2)–O–Sr(1)) along the b-axis.19
50. Si atoms in SiO4 tetrahedra form a parallel chain. The Sr(1) sites are arranged in the form of linear chains (Si–O–Sr(1)–O–Sr(2)), whereas the Sr(2) sites display zigzag patterns of (Sr(1)–O–Sr(2)–O–Sr(1)) along the b-axis.19
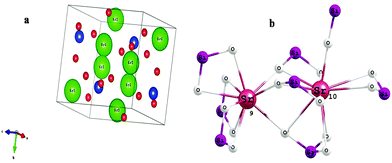 | ||
| Fig. 2 (a) Crystal structure of α′-Sr2SiO4. (b) Schematic of 9- and 10-coordinated Sr2+ in strontium silicate. | ||
3.2. Photoluminescence investigations
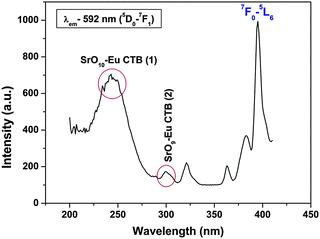
![[thin space (1/6-em)]](https://www.rsc.org/images/entities/char_2009.gif) 152 cm−1) and another relatively less intense band at ∼296 nm (33
152 cm−1) and another relatively less intense band at ∼296 nm (33![[thin space (1/6-em)]](https://www.rsc.org/images/entities/char_2009.gif) 784 cm−1), both of which are assigned to charge transfer bands: CTB-1 and CTB-2, which are respectively due to Sr(2) and Sr(1) polyhedra. In both the cases, the charge transfer is O2− → Eu3+ only, but oxygens are from different polyhedral, i.e. SrO9 and SrO10. In one case it is Sr9–O → Eu and in the other case Sr10–O → Eu CT. The peaks that are seen at 320, 360, 380 and 395 nm are due to f–f transitions from the 7F0 ground state to 5H3, 5L9, 5G3 and 5L6 (most intense) levels, respectively. The existence of two charge transfer bands further confirms the presence of two different types of Sr, i.e. Sr(1) and Sr(2), in α′-Sr2SiO4.
784 cm−1), both of which are assigned to charge transfer bands: CTB-1 and CTB-2, which are respectively due to Sr(2) and Sr(1) polyhedra. In both the cases, the charge transfer is O2− → Eu3+ only, but oxygens are from different polyhedral, i.e. SrO9 and SrO10. In one case it is Sr9–O → Eu and in the other case Sr10–O → Eu CT. The peaks that are seen at 320, 360, 380 and 395 nm are due to f–f transitions from the 7F0 ground state to 5H3, 5L9, 5G3 and 5L6 (most intense) levels, respectively. The existence of two charge transfer bands further confirms the presence of two different types of Sr, i.e. Sr(1) and Sr(2), in α′-Sr2SiO4.
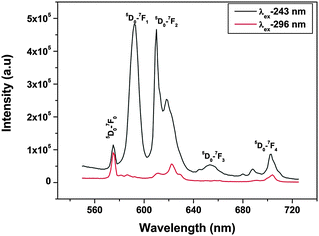
To get an idea of the origin of CTB-1 at 243 nm and CTB-2 at 296 nm, emission spectra were obtained at both the wavelengths and are shown in Fig. 4. The emission spectrum that was acquired at 243 nm shows the typical features of europium ions at 575, 592, 615, 653 and 697 nm due to 5D0 to 7FJ transitions of Eu3+, where J = 0, 1, 2, 3 and 4, respectively. Among all the transitions that were observed, 5D0 → 7F1 at 592 nm and 5D0 → 7F2 at 615 nm are special because of their peculiarity as symmetry-sensitive transitions and are generally known as a magnetic dipole transition (MDT) and hypersensitive electric dipole transition (EDT), respectively. In general, at a crystal site with inversion symmetry, EDTs are strictly forbidden and MDT is usually the most intense emission peak; whereas at a site without inversion symmetry, EDT is usually the strongest emission line, because transitions with ΔJ = ±2 are hypersensitive to small deviations from inversion symmetry. The most sensitive parameter for understanding symmetry is the asymmetry ratio (I), which is defined as the ratio of the integral intensity of EDT (5D0 → 7F2) to that of MDT (5D0 → 7F1). In the spectra obtained at 243 nm excitation, there are two special characteristics: (i) the intensities of 5D0 → 7F1 at 592 nm and 5D0 → 7F2 at 615 nm are comparable, which is because of the fact that europium ions are distributed at sites with inversion as well as non-inversion symmetry, i.e. Sr(1) and Sr(2), and (ii) the presence of a 5D0 → 7F0 line, which is forbidden by both electric and magnetic dipole mechanisms, at a higher-energy position (575 nm) than its usual position at around 580 nm. The 5D0 → 7F0 transition normally appears when the site symmetry is very low, either Cn or Cnv.20 These two observations confirm that europium occupies both the symmetric Sr(1) site and asymmetric Sr(2) site and excitation at 243 nm excites both the Eu3+ ions at Sr(1) and Sr(2) sites.
On the other hand, the emission spectrum that was recorded at 296 nm shows entirely different characteristics. The first and foremost observation is that the intensity of the 5D0 → 7F0 transition is higher than that of all the others and the second is the absence of a 5D0 → 7F1 magnetic dipole transition. This shows that radiation at 296 nm excites europium ions mostly at relatively asymmetric SrO9 sites.
It can be inferred from the abovementioned discussion that excitation at 243 and 296 nm, which corresponds to charge transfer (O → Eu) from SrO10 and SrO9, respectively, leads to entirely different emission characteristics. Judging from their respective emission spectra, it appears that radiation at 243 and 296 nm may excite different types of europium ion. To further substantiate the results of emission spectroscopy, photoluminescence decay measurements were carried out. It can be seen from luminescence decay measurements using λex of 243 nm (ESI,† Fig. S1) that biexponential behavior with lifetime values of 1.2 ms (fast-decaying, T1) and 4.7 ms (slow-decaying, T2) was observed, which indicates the presence of europium ions at two different sites, whereas monoexponential behavior was observed (ESI,† Fig. S1) on exciting at 296 nm with a lifetime of the order of 1.2 ms (only fast species, T1). From all these discussions, we can say that there are two types of europium ion: 1.2 ms and 4.7 ms (T1 and T2); radiation at 243 nm excites both of them; whereas, radiation at 296 nm selectively excites 1.2 ms (T1) species only.
Assuming a given phonon energy (the same host for lanthanide ions), a relatively longer PL decay time should be attributed to a more symmetric site, as the f–f transition becomes more forbidden, whereas a shorter decay time is often associated with an asymmetric site due to relaxation in the selection rules. Species T1 (1.2 ms) arises because of Eu3+ ions occupying Sr(2) sites without inversion symmetry, whereas the major species T1 (4.7 ms) can be ascribed to Eu3+ ions occupying Sr(2) sites with inversion symmetry.
To obtain the individual spectra of species T1 (1.2 ms) and T2 (4.7 ms), time-resolved emission spectroscopy was carried out using 243 nm as excitation wavelength. Fig. 5 shows the individual TRES spectra of T1 and T2, which were derived after appropriate slicing and mathematical calculation (ESI,† Table T2).
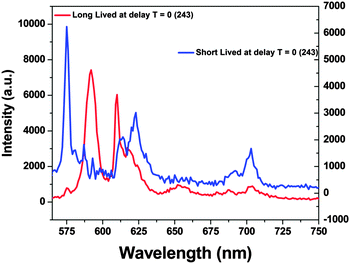 | ||
| Fig. 5 Emission spectra of the two RE ion species obtained after allowing suitable delay times following TRES measurements (at 243 nm excitation). | ||
It can be seen from the TRES spectra that for long-lived species (T2), the intensity of MDT is more than that of EDT and the 5D0 → 7F0 transition is hardly seen, whereas for short-lived species, 5D0 → 7F0 is very intense, large splitting in spectral lines is seen and MDT is absent or negligible. From this observation, we can conclude that T2 is present at symmetric 10-coordinated Sr(1) sites, whereas T1 is present at relatively asymmetric 9-coordinated Sr(2) sites.
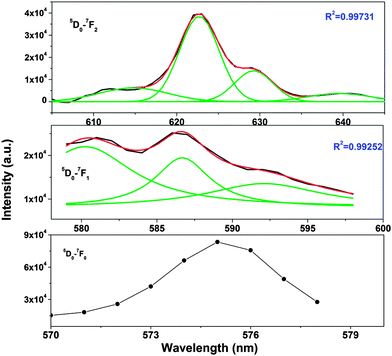
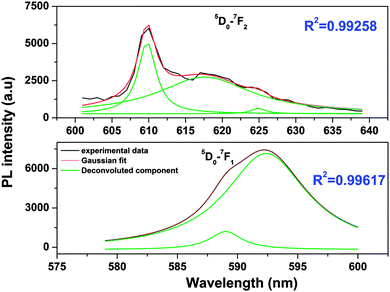
From the Stark splitting pattern shown for short-lived species in Fig. 6, one line for the 5D0 → 7F0 transition, three lines for the 5D0 → 7F1 magnetic dipole transition and four lines for the 5D0 → 7F0 electric dipole transition of Eu3+ were resolved, whereas for long-lived species as shown in Fig. 7, the 5D0 → 7F0 transition is absent but two lines for a J = 0 → J = 1 transition and three lines for a J = 0 → J = 2 transition of Eu3+ were resolved. According to the branching rules of various point groups,20–22 it can be inferred that the actual site symmetry of T1, i.e. the actual site symmetry of Eu3+ in 9-coordinated Sr–O polyhedra, is C2v, whereas the site symmetry of Eu3+ in 10-coordinated Sr–O polyhedra is C3v.
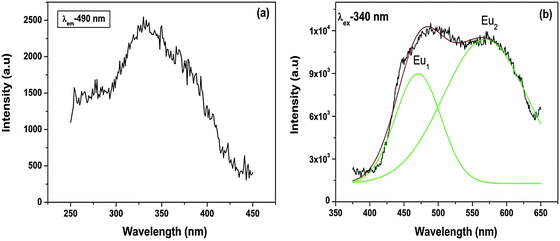
Because Eu2+ transitions involve 5d orbitals, an effect due to the crystal field can be seen in their emission spectra. Fig. 8b shows the emission spectrum of Sr2SiO4:Eu2+ at an excitation wavelength of 340 nm. The spectrum displays two peaks at 490 nm (Eu1) and 560 nm (Eu2). This shows the stabilization of Eu2+ at two different sites.
The crystal field is related to the ionic radius by the following equation:
 | (1) |
It can be seen from the abovementioned equation that the crystal field strength is inversely proportional to the ionic radius. As in the case of SrO10 and SrO9, the average Sr–O bond lengths are 2.85 and 2.69 Å, respectively, the crystal field strength at Sr9 is higher than at Sr10. Therefore, the crystal field splitting of the d-orbital will be more for Eu at an Sr9 site than at an Sr10 site. As a result, the difference in energy between the lowest electronic levels in the excited state and ground state is greater in the case of Sr10. As a result, more energy is required for the de-excitation of Eu2+ at a Sr10 site than at a Sr9 site; therefore, emission occurs at a lower wavelength. The peak at 490 nm is due to EuSr(10) and the peak at 550 nm is due to EuSr(9).
PL decay corresponding to emissions at 490 and 560 nm (ESI,† Fig. S2), which are due to Eu2+ sitting at SrO10 sites and SrO9 sites, respectively, exhibits monoexponential behavior with lifetime values of 0.483 and 1.73 μs.
Based on the phonon energy concept (the same host for lanthanide ions), the longer lifetime should be attributed to the more symmetric site as the electronic transition becomes more forbidden, which corresponds to longer decay times. As discussed in the earlier section, SrO10 is more symmetric than SrO9.
Therefore, the 1.73 μs species arises because Eu2+ ions occupy symmetric 10-coordinated Sr(1) sites, whereas the 0.483 μs species is due to Eu2+ ions at relatively asymmetric 9-coordinated Sr(2) sites.
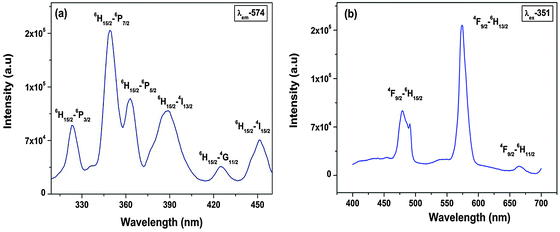
Photoluminescence (PL) decay lifetime measurements (ESI,† Fig. S3) of the 4F9/2 → 6H13/2 (yellow) transition for the Sr2SiO4:Dy3+ system at excitation and emission wavelengths of 351 and 574 nm, respectively, show monoexponential behavior. Therefore, in Sr2SiO4, Dy3+ is homogeneously distributed, occupying relatively asymmetric 9-coordinated Sr sites only.
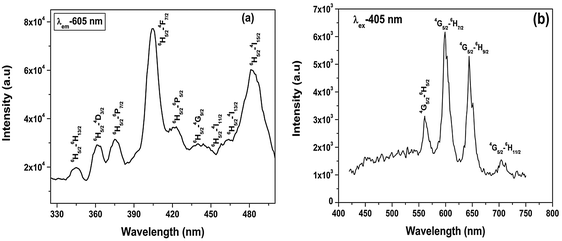
To get a clearer picture of the local site around a Sm3+ ion in the strontium silicate host, lifetime measurements at excitation and emission wavelengths of 405 and 605 nm were carried out. The PL decay curve for Sr2SiO4:Sm3+ (ESI,† Fig. S4) shows a monoexponential profile with a lifetime value of 2.3 ms, which indicates a homogeneous distribution of Sm3+ ions in Sr2SiO4. Based on fluorescence lifetime and emission spectroscopy results, it can be inferred that Sm3+ mainly occupies 9-coordinated Sr(2) sites in Sr2SiO4.
3.3. X-ray absorption spectroscopy
In order to compensate for oscillations in the absorption spectra, μ(E) has been converted to an absorption function χ(E) defined as follows:23
 | (2) |
 | (3) |
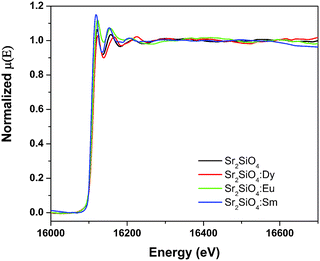
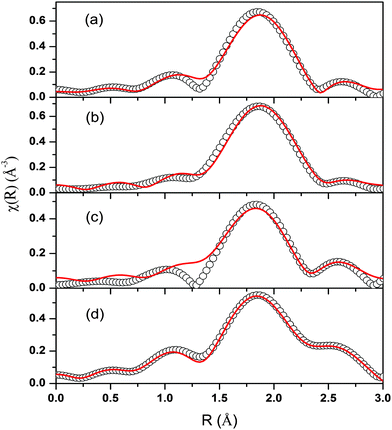
The spectra of χ(R) versus R have been generated for all the samples from the spectra of μ(E) versus E following the methodology described above and the best-fit spectra of χ(R) versus R of the samples are shown in Fig. 12. The structural parameters (atomic coordination and lattice parameters) of Sr2SiO4 that were used for the simulation of theoretical EXAFS spectra of the samples were obtained from values reported in the literature.10,13 There are two crystallographic sites of strontium in the structure, of which one is 10-coordinated and the other is 9-coordinated. Scattering paths were generated using each Sr atom as central atom and were used in fitting the experimental data with 50% weightage given to each crystallographic site. The bond distances, coordination numbers (including scattering amplitudes) and disorder (Debye–Waller) factors (σ2), which give the mean square fluctuations in the distances, were used as fitting parameters and are summarized in tabular form (ESI,† Table T3).
3.4. Computational results
In order to rationalize the experimental results and to get insight into the local structure, theoretical calculations were carried out on Sr2SiO4 (undoped and doped with Eu/Sm/Dy atoms). All calculations were carried out using spin-polarized DFT with a plane-wave basis set implemented in the Vienna Ab-initio Simulation Package (VASP). Electron–ion interactions were described by the projector augmented wave (PAW) method. The spin-polarized generalized gradient approximation using the Perdew–Burke–Ernzerhof (PBE) functional has been used to calculate the exchange–correlation energy. The cut-off energy for the plane-wave basis set was fixed at 400 eV. Geometry optimization was performed by ionic relaxation using a conjugate gradient minimization. Geometries were considered to be converged when the force on each ion became 0.01 eV Å−1 or less. The total energy convergence was tested with respect to the sizes of the plane-wave basis set and the simulation cell and the total energy was found to be accurate to within 1 meV. Three-dimensional periodic boundary conditions were applied to approximate a bulk solid (i.e. the orthorhombic phase of Sr2SiO4). A conventional cubic unit (α = β = γ = 90°) cell containing 28 atoms (8 Sr, 4 Si, 16 O) was used for calculations. Structural optimization was performed with respect to atomic coordinates and unit cell parameters. A Monkhorst–Pack k-point grid of 3 × 3 × 3 was employed to map the first Brillouin zone. For the orthorhombic unit cell, the lattice parameters were found to be a = 5.673 Å, b = 7.073 Å and c = 9.766 Å. These values are excellent in comparison to the experimental lattice constants (a = 5.682 Å, b = 7.091 Å and c = 9.772 Å). In the case of doped Sr2SiO4, out of the 8 Sr atoms in the unit cell, one atom was replaced with a Eu/Sm/Dy atom. As mentioned previously, two types of Sr atom (9-coordinated and 10-coordinated) are present in Sr2SiO4; therefore, both 9- and 10-coordinated sites were considered for replacement and optimizations were carried out without any symmetry constraints. The energetics of the doped structures are tabulated (ESI,† Table T4).In terms of energetics, it is clear that the 9-coordinated site is more favourable than its 10-coordinated counterpart (ESI,† Table T4). However, it can be noted that the difference in stability for Eu3+ doping between 9- and 10-coordinated sites is only 0.03 eV (of the order of room-temperature energy). In contrast, for Dy and Sm doping, the difference in stability between the two sites is much higher (∼0.6–0.7 eV). These results are in excellent agreement with those obtained by experimental methods, where both Dy and Sm were found to occupy only 9-coordinated sites and the presence of Eu at both 9- and 10-coordinated sites was reported. Therefore, it can be inferred that the destabilization of 10-coordinated occupancy by a strong metal–oxygen bond for Dy and Sm is the cause of such an observation.
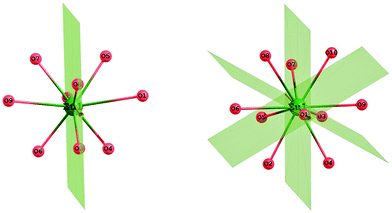
In order to further rationalize the results, we focused our attention on the geometrical aspects of the SrO9 and SrO10 polyhedra of Sr2SiO4. In SrO9 polyhedra, the average Sr–O bond length was found to be 2.68 Å (shortest bond: 2.50 Å, longest bond: 3.04 Å) and for SrO10 polyhedra, the average Sr–O bond length was found to be 2.84 Å (shortest bond: 2.38 Å, longest bond: 3.04 Å) (ESI,† Fig. S5 and S6). The theoretically calculated values of the average Sr–O bond length in SrO9 and SrO10 polyhedra are in agreement with the experimental values of 2.698 Å and 2.852.13 Further symmetry observations for these two polyhedra (C2v for SrO9 and C3v for SrO10) are shown in Fig. 13 and tabulated (ESI,† Table T5). It can be seen from the table that SrO9 has lower symmetry of C2v than that of SrO10, which has C3v symmetry. The relatively higher symmetry of SrO10 polyhedra is in line with the experimental result presented in Section 3.2.2, as well as previous reports.10
Importantly, SrO10 polyhedra have a short Sr–O bond at 2.38 Å, which is not present in SrO9 polyhedra. Furthermore, we noticed that the substitution of Eu at Sr does not distort the original SrO9 and SrO10 polyhedra (ESI,† Fig. S7), but the inclusion of Dy and Sm leads to the distortion of polyhedra to a greater extent (ESI,† Fig. S8 and S9). In particular, the substitution of Sr in SrO10 polyhedra by Dy and Sm leads to substantial changes by reducing the length of the shortest metal–oxygen bond from 2.38 Å in the original SrO10 polyhedra to 2.18/2.29 Å, respectively. Simultaneously, few other M–O bonds were also reduced in length. The contraction of these M–O bonds leads to the elongation of some other M–O bonds (from 2.8–3.0 Å in the original SrO10 polyhedra to 2.9–3.5/2.9–3.2 Å for DyO10/SmO10). This observed distortion is in line with the energetics values presented in Table T4 (ESI†), where the difference in stability for substitution by Dy and Sm at 9- and 10-coordinated sites was found to be quite large at ∼0.6–0.7 eV. It can be noted that despite the ionic radii of these three cations, Sm3+ (1.13 Å), Eu3+ (1.12 Å), and Dy3+ (1.09 Å) being comparable with that of the Sr2+ ion, the strength of the metal–oxygen bond in the M–O dimer (M = Eu, Dy, Sm) is quite different for the three. The values in eV per atom follow the following trend: Sr–O (2.66) < Eu–O (2.95) < Sm–O (3.58) < Dy–O (3.84).27
Therefore, on the basis of these results, it is inferred that Dy and Sm form much stronger bonds with oxygen in comparison to Sr and Eu (Sr and Eu have comparable values). The stability of Dy–O/Sm–O bonds leads to the formation of a few strong metal–oxygen bonds in DyO10/SmO10 by losing other metal–oxygen bonds in the polyhedra. Thus, the relatively enhanced stability of Dy–O/Sm–O bonds leads to the contraction of a few metal–oxygen bonds. As a consequence, the remaining metal–oxygen bonds become weaker or elongated. This asymmetrical contraction/elongation phenomenon in the DyO10/SmO10 polyhedron leads to significant distortion with respect to the original SrO10 polyhedra. These results explain very well that in experiments, a Eu atom could substitute Sr at both 9- and 10-coordinated sites; however, Dy and Sm could not substitute Sr at 10-coordinated sites.
3.5. Conclusions
In the present study, we carried out an exhaustive experimental and theoretical investigation to get in-depth knowledge of the local symmetry of SrO9 and SrO10 polyhedra in Sr2SiO4. Undoped and lanthanide ion-doped (Eu, Dy and Sm) Sr2SiO4 have been synthesized using a sol–gel method and characterized using XRD and photoluminescence (PL) spectroscopy. In terms of structure, it was found that there are two types of strontium polyhedra in strontium silicate: asymmetric SrO9 and relatively symmetric SrO10. The local point groups of these two polyhedra were determined using emission spectroscopy taking europium as the probe ion, which was further supported by theoretical measurements. Based on PL data and emission dynamics, it was inferred that Eu occupies both 9- and 10-coordinated Sr sites in strontium silicate, whereas Sm and Dy occupy specifically 9-coordinated Sr sites only. These results were further corroborated using Sr K-edge extended X-ray absorption fine structure (EXAFS) measurements. Theoretical calculations using DFT also suggested that energetically Eu is stable in both SrO9 and SrO10 polyhedra, whereas Sm and Dy destabilize 10-coordinated Sr polyhedra by strengthening individual metal–oxygen bonds.References
- J. Y. Park, M. A. Lim, C. H. Kim, H. D. Park, J. T. Park and S. Y. Choi, Appl. Phys. Lett., 2003, 82, 683–685 CrossRef CAS PubMed.
- N. Lakshminarasimhan and U. V. Varadaraju, J. Electrochem. Soc., 2005, 152, H152–H156 CrossRef CAS PubMed.
- D. V. Sunitha, H. Nagabhushana, S. C. Sharma, B. M. Nagabhushana, B. Daruka Prasad and R. P. S. Chakradhar, Spectrochim. Acta, Part A, 2014, 127, 381–387 CrossRef CAS PubMed.
- H. Nagabhushana, D. V. Sunitha, S. C. Sharma, B. Daruka Prasad, B. M. Nagabhushana and R. P. S. Chakradhar, J. Alloys Compd., 2014, 595, 192–199 CrossRef CAS PubMed.
- Z. Song, X. Ding, S. Yang, F. Du, L. Bian, S. Duan and Q. L. Liu, J. Lumin., 2014, 152, 199–202 CrossRef CAS PubMed.
- J. Barzowska, A. Chruścińska, K. Przegietka and K. Szczodrowski, Radiat. Phys. Chem., 2014, 104, 31–35 CrossRef CAS PubMed.
- M. A. Tshabalala, H. C. Swart and O. M. Ntwaeaborwa, J. Vac. Sci. Technol., A, 2014, 32, 021401 Search PubMed.
- X. Xu, X. Zhang, T. Wang, J. Qiu and X. Yu, Mater. Lett., 2014, 127, 40–43 CrossRef CAS PubMed.
- J. Qin, B. Lei, J. Li, Y. Liu, H. Zhang, M. Zheng, Y. Xiao and K. Chao, ECS J. Solid State Sci. Technol., 2013, 2, R60–R64 CrossRef CAS PubMed.
- M. Catti, G. Gazzoni and G. Ivaldi, Acta Crystallogr., Sect. C, 1983, 39, 29–34 CrossRef.
- S. K. Gupta, N. Pathak, S. K. Thulasidas and V. Natarajan, J. Lumin., 2014 DOI:10.1016/j.jlumin.2014.10.009.
- S. K. Gupta, M. K. Bhide, R. M. Kadam, V. Natarajan and S. V. Godbole, J. Exp. Nanosci., 2015, 10, 610–621 CrossRef CAS PubMed.
- S. K. Gupta, M. Mohapatra, S. Kaity, V. Natarajan and S. V. Godbole, J. Lumin., 2012, 132, 1329–1338 CrossRef CAS PubMed.
- S. K. Gupta, M. Kumar, V. Natarajan and S. V. Godbole, Opt. Mater., 2013, 35, 2320–2328 CrossRef CAS PubMed.
- S. Basu, D. K. Patel, J. Nuwad, S. N. Jha, D. Bhattacharyya, V. Sudarsan, R. K. Vatsa and S. K. Kulshreshtha, Chem. Phys. Lett., 2013, 561–562, 82–86 CrossRef CAS PubMed.
- S. Basu, S. Varma, A. N. Shirsat, B. N. Wani, S. R. Bharadwaj, A. Chakrabarti, S. N. Jha and D. Bhattacharyya, J. Appl. Phys., 2012, 113, 043508 CrossRef PubMed.
- N. L. Misra, A. K. Yadav, S. Dhara, R. Phatak, S. K. Mishra, A. K. Poswal, S. N. Jha, A. K. Sinha and D. Bhattacharyya, Anal. Sci., 2013, 29, 579 CrossRef CAS.
- J. Yang, L. Yang, W. Liu, Y. Zhang, H. Fan, Y. Wang, H. Liu, J. Lang and D. Wang, J. Alloys Compd., 2008, 454, 506 CrossRef CAS PubMed.
- A. Nag and T. R. N. Kutty, J. Mater. Chem., 2004, 14, 1598–1604 RSC.
- X. Y. Chen and G. K. Liu, J. Solid State Chem., 2005, 178, 419–428 CrossRef CAS PubMed.
- X. Y. Chen, W. Zhao, R. E. Cook and G. K. Liu, Phys. Rev. B: Condens. Matter Mater. Phys., 2004, 70, 205122 CrossRef.
- J. Qiang, L. Yongsheng, L. Renfu, L. Liu, L. Wenqin and C. Xueyuan, J. Phys. Chem. C, 2009, 113, 2309–2315 Search PubMed.
- D. C. Konigsberger and R. Prince, in X-ray Absorption: Principles, Applications, Techniques of EXAFS, SEXAFS and XANES, ed. D. C. Konigsberger and R. Prins, Wiley & Sons, New York, 1988 Search PubMed.
- M. Newville, B. Ravel, D. Haskel, J. J. Rehr, E. A. Stern and Y. Yacoby, Physica B, 1995, 208, 154–156 CrossRef.
- R. D. Shannon, Acta Crystallogr., Sect. A: Cryst. Phys., Diffr., Theor. Gen. Crystallogr., 1976, 32, 751–767 CrossRef.
- H.-D. Nguyen, I.-H. Yeo and S.-I. Mho, ECS Trans., 2010, 28, 167–173 CAS.
- W. M. Haynes, CRC Handbook of Physics and Chemistry, 94th edn, 2013 Search PubMed.
Footnote |
| † Electronic supplementary information (ESI) available. See DOI: 10.1039/c5nj01191d |
| This journal is © The Royal Society of Chemistry and the Centre National de la Recherche Scientifique 2015 |

