
 Open Access Article
 This Open Access Article is licensed under a
 Creative Commons Attribution 3.0 Unported Licence
Coupling of surface energy with electric potential makes superhydrophobic surfaces corrosion-resistant
Rahul
Ramachandran
and
Michael
Nosonovsky
*
Department of Mechanical Engineering, College of Engineering & Applied Science, University of Wisconsin-Milwaukee, Milwaukee, WI 53211, USA. E-mail: nosonovs@uwm.edu; Fax: +1-414-229-6958; Tel: +1-414-229-2816
First published on 28th August 2015
Abstract
We study the correlation of wetting properties and corrosion rates on hydrophobized cast iron. Samples of different surface roughnesses (abraded by sandpaper) are studied without coating and with two types of hydrophobic coatings (stearic acid and a liquid repelling spray). The contact angles and contact angle hysteresis are measured using a goniometer while corrosion rates are measured by a potentiodynamic polarization test. The data show a decrease in corrosion current density and an increase in corrosion potential after superhydrophobization. A similar trend is also found in the recent literature data. We conclude that a decrease in the corrosion rate can be attributed to the changing open circuit potential of a coated surface and increased surface area making the non-homogeneous (Cassie–Baxter) state possible. We interpret these results in light of the idea that the inherent surface energy is coupled with the electric potential in accordance with the Lippmann law of electrowetting and Le Châtelier's principle and, therefore, hydrophobization leads to a decrease in the corrosion potential. This approach can be used for novel anti-corrosive coatings.
Introduction
Corrosion of metals is a highly undesirable process since it damages metallic materials used for various components leading to their gradual destruction. Consequently, various types of anti-corrosive coatings have been developed, including ones which prevent the contact of the material with the corrosive environment, such as aqueous solutions. A relatively new type of coating which repels water and aqueous solutions is the superhydrophobic coating which modifies wetting properties of a material.1The contact angle (CA) is the main parameter characterizing wetting of a solid surface by a liquid, usually, water. Hydrophilic surfaces have a water CA less than 90° while hydrophobic surfaces have a water CA greater than 90°. For an ideally smooth homogenous surface, the equilibrium CA (θ0) of a liquid droplet (say, of water) is given by the Young equation 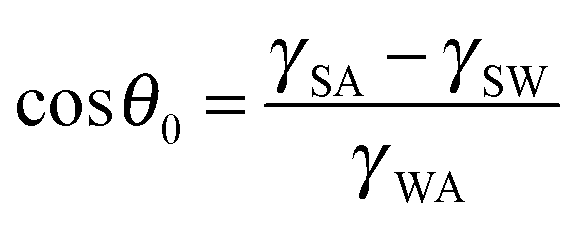 where γSA, γSW, and γWA are the surface free energies of the solid–air, solid–water, and water–air interfaces.2 However on real surfaces, which are rough and heterogeneous, the contact angle is different from the equilibrium value.3 The effect of roughness and chemical heterogeneity on the CA is incorporated into two well-known models of wetting, namely the Wenzel4 and Cassie–Baxter5 models. According to the Wenzel model, the effective contact angle of a rough surface is given by
cos![[thin space (1/6-em)]](https://www.rsc.org/images/entities/char_2009.gif) θw = Rfcosθ0 θw = Rfcosθ0 | (1) |
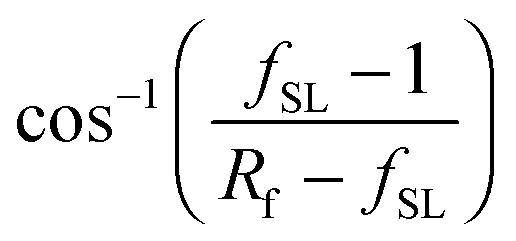
| cosθCB = rffSLcosθ0 − 1 + fSL | (2) |
 .8
.8
Contact angle hysteresis (CAH), which is the difference between the maximum CA (advancing CA, e.g., in front of a moving droplet) and the minimum CA (receding CA, e.g., at the rear of a moving droplet) is a parameter used to characterize the adhesion between a liquid and a surface. Surfaces that exhibit a water CA greater than 150° and very low CAH (<10°) are said to be superhydrophobic. But there are a number of important exceptions, and sometimes called the “petal effect”.9,10 While the CA characterizes wetting during normal loading, CAH characterizes wetting during shear loading at the solid–liquid interface. Adhesion under both these types of loadings can be measured separately using the centrifugal adhesion balance.11,12
Besides water-repellency, the superhydrophobic surfaces have many emerging applications such as self-cleaning, drag reduction in water flow, antifouling,13 icephobicity,14–16 oleophobicity,17 water filtering,18etc. One newly emerging area of application for hydrophobic and superhydrophobic surfaces is corrosion inhibition. There are a number of recent experimental studies of how superhydrophobicity can reduce corrosion, although there are few studies of the fundamental physicochemical mechanisms involved or potential applications to fresh water materials. Typically, electrochemical corrosion occurs when a metallic surface is oxidized while in contact with an electrically conducting solution called electrolyte. A typical electrolyte used in corrosion studies is 3.5 wt% aqueous solution of sodium chloride in water, with an electrical conductivity of 5.3 Ω−1 m−1 due to solvated ions. A hydrophobic/superhydrophobic surface with a non-homogeneous interface would have a reduced interfacial contact area between the electrolyte and the metallic surface.
Making a metallic surface superhydrophobic is a challenging task. Typically, a stable combination of a low-energy surface coating with a hierarchical roughness having roughness details of characteristic length scales from microns down to nanometers is needed. Several attempts to create corrosion-resistant superhydrophobic coatings have been reported in the literature.1 To operate in an aggressive corrosive environment, a superhydrophobic surface needs to resist chemical etching as well as degradation due to prolonged exposure. Also the surface roughness features and coatings need to withstand mechanical wear. Mechanical abrasion,19–21 etching,22,23 oxidation,24,25 galvanic replacement,26 and templating27–30 are some of the methods used to create roughness on these surfaces. Several methods such as immersion coating,19,21,23–25,31–34 spin coating,35 chemical vapor deposition,26 spray coating,20,36etc. are used to reduce surface energy. Such surfaces exhibit reduction in corrosion current and maintain superhydrophobicity upon prolonged exposure to corrosive environments.
Superhydrophobicity as a means of corrosion inhibition has been studied on several metallic materials such as stainless steel,20 cold rolled steel,27–30 copper,21,22,36–39 zinc,26,40 aluminum,19,23,31,41 titanium,24,25,34 and magnesium alloys.32,33,42 The results from the literature of corrosion tests on some of the aforementioned materials are summarized in Table 1. The general trend observed in these results is that the corrosion current decreases several folds when the surface is rendered superhydrophobic. Also the corrosion potential tends to become more positive. These two tendencies are interpreted as the signs of reduced corrosion rates for superhydrophobic surfaces. Most of the methods to produce superhydrophobic surfaces involved polymer coatings which might act as diffusion barriers, oxide formation which resulted in passivation of materials, or fillers which reduced the coating permeability. Each of these factors contributed to corrosion inhibition. Therefore, the superior corrosion resistance was not the result of the superhydrophobicity alone, but a synergistic effect of several factors listed above. The influence of the superhydrophobicity alone on reducing corrosion current can be determined by comparing the entries of columns pertaining to flat-coated and rough-coated samples in Table 1.
| Ref. | Material | Uncoated samples | Surface texturing | Hydrophobic coating | Flat, coated samples | Rough, coated samples | ||||||
|---|---|---|---|---|---|---|---|---|---|---|---|---|
| CA (deg) | i corr (μA cm−2) | E corr (mV) | CA (deg) | i corr (μA cm−2) | E corr (mV) | CA (deg) | i corr (μA cm−2) | E corr (mV) | ||||
| Weng et al.27 | Cold rolled steel (CRS) | 72 | 32.73 | −839 | Roughness from leaf template | Electroactive epoxy | 81 | 10.11 | −564 | 155 | 4.33 | −244 |
| Chang, et al.28 | CRS | 73 | 4.03 | −844 | Roughness from leaf template | Epoxy/organophilic clay | 94 | 1.05 | −628 | 153 | 0.1 | −207 |
| Peng et al.29 | CRS | 77 | 20.1 | −944 | Roughness from leaf template | UV-curable epoxy acrylate polymer | 81 | 5.44 | −730 | 153 | 2.3 | −394 |
| Chang, et al.30 | CRS | 6.97 | −821 | Roughness from leaf template | Epoxy/graphene composite | 82 | 1.07 | −678 | 128 | 0.1 | −411 | |
| Yuan et al.22 | Copper | 61 | 34 | −190 | Etching | 2,2,3,4,4,4-Hexafluorobutyl acrylate | — | — | — | 159 | 1.61 | 80 |
| Motlagh et al.20 | Stainless steel (SS) | 64 | — | — | Silica particles | Perfluorodecyltriethoxysilane | — | — | — | 166 | 0.035 | — |
| Ou et al.25 | Titanium alloy | 5 | 0.497 | −325 | Etching, oxidation | 1H,1H,2H,2H-Perfluorooctyltrichlorosilane | 114.2 | 0.0464 | −151 | 151.8 | 0.0039 | 1 |
| Feng et al.19 | Aluminum alloy | 45 | 125.9 | −1.51 | Boiling water treatment | Stearic acid | — | — | — | 155 | 16.59 | −0.88 |
| Xu et al.32 | Magnesium alloy | 30.9 | 0.996 | −1584.7 | Electrochemical machining | Tridecafluoro octyltriethoxysilane | 106.6 | — | — | 165.2 | 0.0968 | −1422 |
Fig. 1 shows the corrosion current density as a function of the contact angle based on the same data. In Fig. 1a this dependency is shown for materials with the tendency of low corrosion in their native state, whereas Fig. 1b shows the data for materials with a high tendency of corrosion in their native state. In all these cases, the corrosion current density decreased significantly as soon as the contact angle became greater than 90° indicating that hydrophobicity leads to corrosion inhibition. A further decrease in corrosion current density is seen as stable air pockets are established in the Cassie–Baxter state. Feng et al.19 reported superhydrophobic aluminum alloy surfaces with fSL ∼ 0.05, which showed 87% reduction in corrosion current density compared to uncoated alloys. Similarly, Xu et al.32 reported superhydrophobic magnesium alloy surfaces with fSL ∼ 0.046 with a 90% reduction in corrosion current density. Effective corrosion resistant surfaces require not only large contact angles, but also minimal fractional solid–liquid interfacial area. It can be concluded that the mechanisms which correlate the superhydrophobicity with the corrosion rates, such as the formation of a Cassie heterogeneous interface, may explain the experimental data reported in the literature.
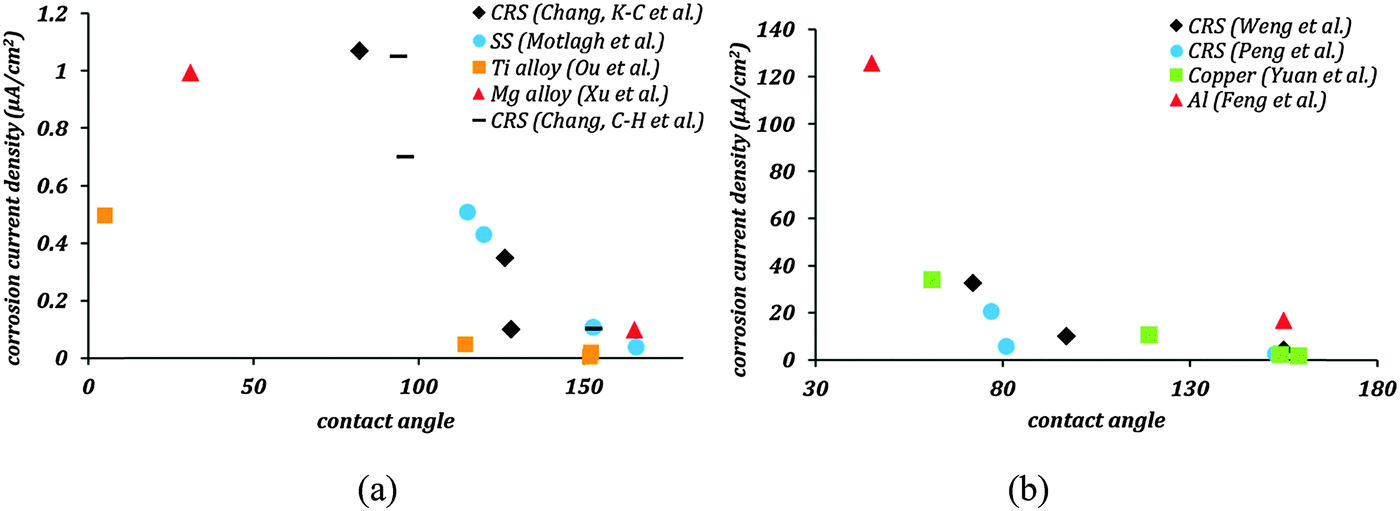 | ||
| Fig. 1 (a and b) Corrosion current density as a function of contact angle from the published literature. The trend clearly shows a significant decrease in corrosion current densities with an increase in the contact angle. The lowest corrosion current densities occur in the Cassie–Baxter domain, where the contact angle is much greater than 90°. | ||
Electrochemical foundations of corrosion and wetting
Corrosion current is the main characteristic of the rate of the electrochemical corrosion. This type of corrosion occurs when a metal (electrode) is brought into contact with an electrolyte. During corrosion, a metal (M) transforms from its pure state to more stable oxidized states. This involves an anodic oxidation reaction| M → Mz+ + ze− | (3) |
| 2H+ + 2e− → H2 | (4) |
| O2 + 4H+ + 4e− → 2H2O | (5) |
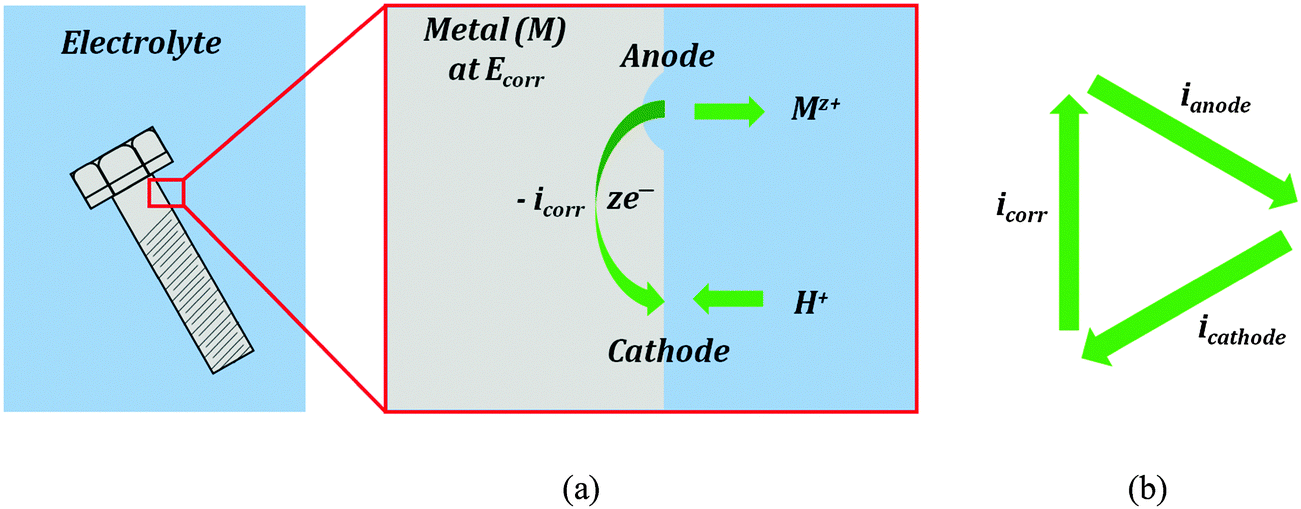 | ||
| Fig. 2 (a) A typical electrochemical corrosion process in the presence of an electrolyte. Material is removed from anodic sites and then deposited as corrosion products (rust) at cathodic sites. (b) The dynamic equilibrium current is zero. | ||
While the total current between the electrode and electrolyte is zero, the transfer of ions (such as Mz+ or H+) occurs in both directions, and the transfer rate is proportional to the anodic/cathodic/corrosion current. The ion transfer effectively results in corrosion of the metal (e.g., rusting). Therefore, the corrosion current can be used as a measure of the corrosion rate. However, the corrosion current cannot be measured directly. Various corrosion tests have been developed to evaluate the corrosion current.
One such corrosion test that is commonly used is the potentiodynamic polarization test (PPT). During the PPT, the potential of the sample electrode is changed above and below Eoc, and corresponding changes in the current are measured as a function of the potential. The value of the potential above or below Eoc is called the overpotential, overvoltage, or polarization, η. During an anodic polarization, the potential is increased with respect to Eoc resulting in the oxidation of the electrode, while during a cathodic polarization the potential is decreased resulting in the reduction of the electrode. The electric current density i as a function of the overpotential is given by the Butler–Volmer equation involving both the anodic and cathodic exponential terms.
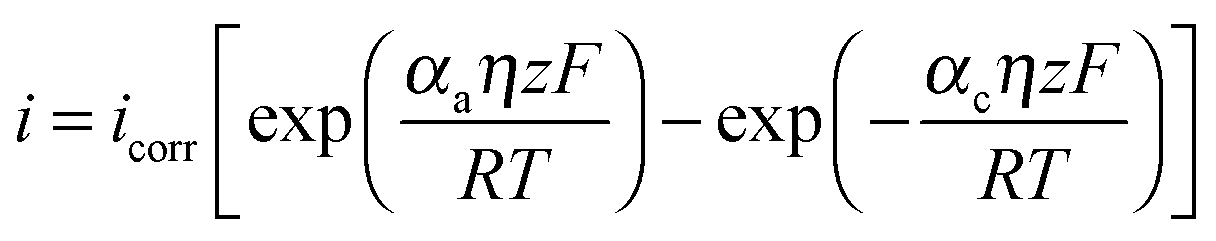 | (6) |
485 C mol−1 is the Faraday constant, R = 8.31 J K−1 mol−1 is the universal gas constant, T is the absolute temperature, and z is the number of electrons involved in the reaction per molecule. Note that zero overpotential η = 0 corresponds to the dynamic equilibrium |ianode| = |icathode| as it has been explained above. Therefore, in order to find icorr from the experimental data plot of i vs. η, one should subtract the exponential term, either anodic or cathodic, from the net dependency and consider the difference at η = 0 (Fig. 3a).
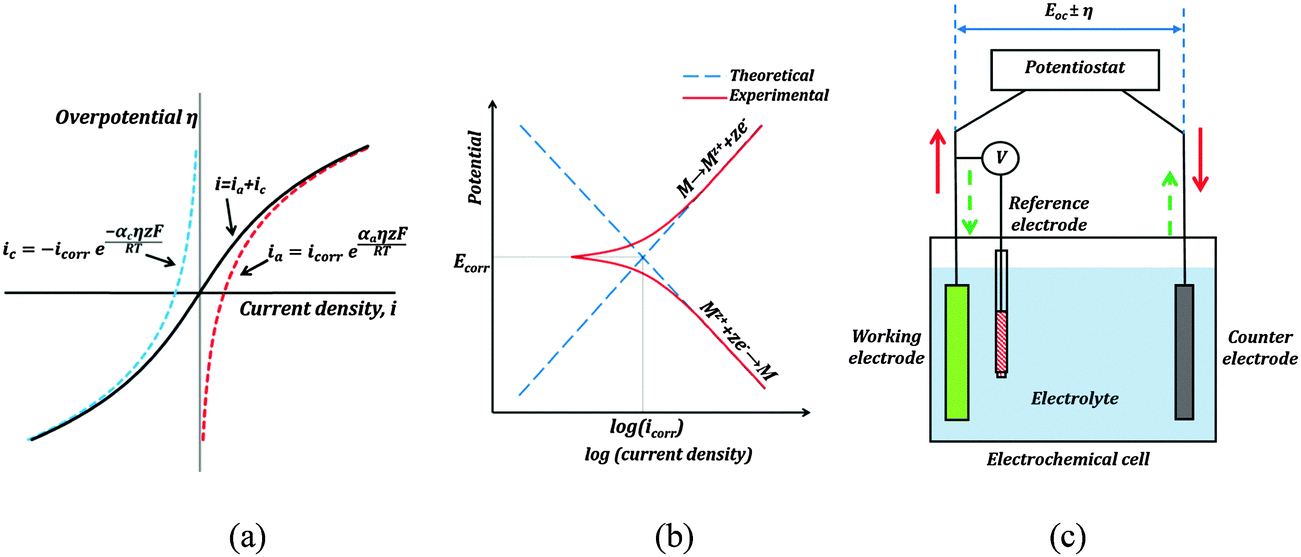 | ||
| Fig. 3 (a) A typical i vs. η dependency based on the Butler–Volmer equation (b) red curves show the Tafel plot of the net (anodic and cathodic) current. Corrosion current can be obtained by extrapolating along the tangential lines corresponding to the exponential polarization curves. (c) A typical three electrode set-up for the PPT corrosion measurement. The red arrows show current flow during anodic polarization, and the broken green arrows show current flow during cathodic polarization. | ||
Since the current changes over several orders of magnitude during a typical corrosion test, a plot of η vs. logi called the Tafel plot is usually made (Fig. 3b). The linear regions of the anodic and cathodic plots correspond to the exponential terms of the Butler–Volmer equation, and tangential straight lines can be extrapolated as to intersect at icorr.
The typical set-up used in a PPT test is shown in Fig. 3c. It employs a three electrode electrochemical cell. In a three electrode system, one electrode is the working electrode which undergoes corrosion, the second is a reference electrode to measure potential difference between the working electrode and the electrolyte, and the third is a counter electrode (usually of an electrochemically inert material, such as gold, platinum, or carbon), which completes the circuit by allowing the current flow. There is negligible current flow through the reference electrode due to high resistance of the voltmeter. The electrode potential of the reference electrode is known and highly stable (saturated calomel is often used as the reference electrode material). A potentiostat is used to sweep across a range of voltages, and measure the corresponding currents.
Wetting and electric properties of an interface are related to each other by the so-called Lippmann equation of electrowetting, which states that the contact angle at a solid–liquid interface subjected to the applied voltage η is given by
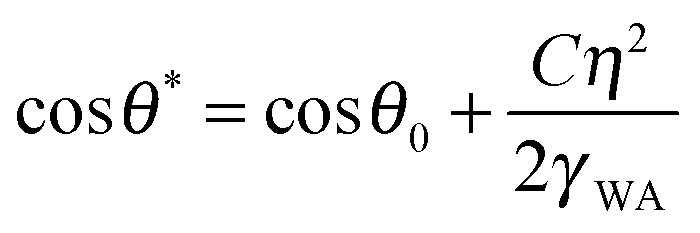 | (7) |
Note that the effect of the electric potential applied to the interface on the surface energy and the equilibrium contact angle (eqn (7)) is similar to the effects of roughness (eqn (1)) and heterogeneity (eqn (2)). In accordance with Le Châtelier's principle, one could expect that changing the wetting properties would result in a certain compensatory change of the corrosion potential, which, in turn, could lead to a change of the corrosion current and, finally, of the rate of corrosion.
In this paper we correlate two surface phenomena namely, wetting and corrosion. Surface wettability is determined by parameters like surface energy, roughness and homogeneity of the interface. We study theoretically, how each of these affects the corrosion current and the rate of corrosion. Then we describe experiments to correlate wetting properties with the corrosion rate, followed by discussion and comparison to theoretical predictions.
Theoretical model
In this section, we discuss how changing the wetting properties by modifying the surface roughness in the Wenzel and Cassie–Baxter states affects the corrosion rate. First, we establish how the solid–liquid contact area and surface roughness affect the electric current in the Cassie–Baxter state in accordance with Ohm's law. Then, we relate the corrosion rate to the current using Faraday's law of electrolysis. Finally, we apply the Nernst equation to relate the corrosion rate to the surface energy due to the decrease of the chemical potential.Ohm's law and the wetting states
Ohm's law E = IR provides the relationship between the interfacial potential E and current I with the interfacial resistance R. The resistance is inversely proportional to the interfacial solid–liquid contact area ASL. We can write,| I ∝ ASL ∝ rffSL | (8) |
Fig. 4 shows variation of the current with the contact angle (θ) for a substrate whose equilibrium contact angle is 75°. Here we consider non-homogeneity (Cassie–Baxter state) created by pockets of trapped air. The corrosion current decreases with increasing apparent contact angle (θ). As the value of fSL decreases, the current across the interface also decreases. The air pockets serve to increase the interfacial electrical resistance.
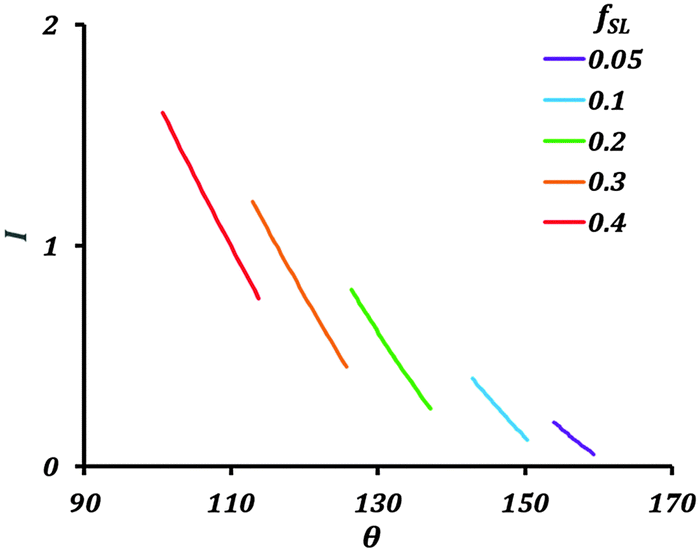 | ||
| Fig. 4 Variation of the current (I) with contact angle (θ) and fractional solid–liquid interfacial area (fSL). | ||
The theory predicts a large reduction in corrosion current with a decrease in solid–liquid interfacial area. Generating a stable hydrophobic surface can significantly decrease corrosion. The main factor affecting the corrosion current in the Cassie–Baxter state is fSL.
Faraday's law of electrolysis and wetting properties
Mass of material removed in corrosion reaction is given by Faraday's law of electrolysis,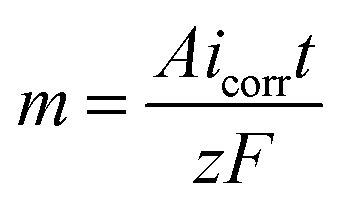 | (9) |
Rate of corrosion and the surface free energy
From absolute reaction theory, the rate at which the metal molecules are oxidized can be written as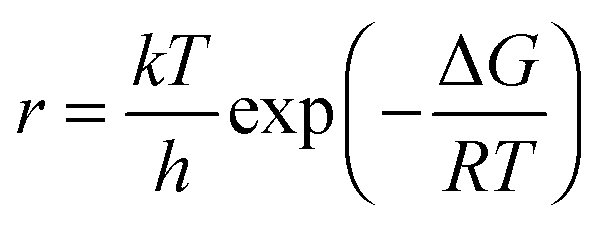 , where r is in s−1, k is Boltzmann's constant, h is Planck's constant, and ΔG is the activation energy. The activation energy for a corrosion reaction of a metal can be written as
 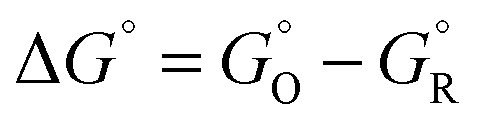 , where
 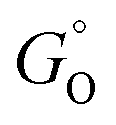 and
and  are free energies associated with the oxidized state and the metal respectively. If the metal surface is not ideally smooth, but is instead composed of surface asperities, assuming complete oxidation of the surface
 | (10) |
 | (11) |
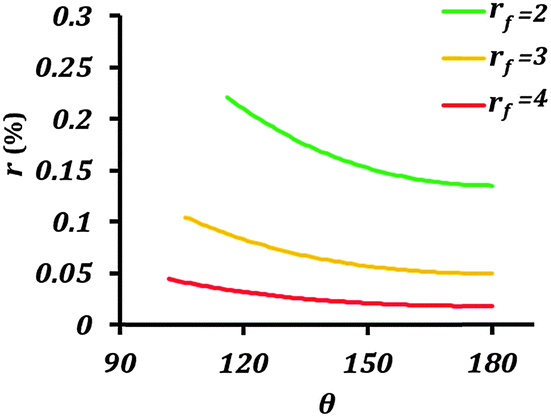 | ||
| Fig. 5 Rate of corrosion reaction (r) as a function of contact angle (θ) for different values of the roughness factor (rf). The equilibrium contact angle of the surface was assumed to be 50°. | ||
The main conclusion of this section is that rendering the electrode surface rough and the interface with the electrolyte non-homogeneous provides a coupling mechanism for the wetting and corrosion properties. In other words, both increased surface roughness rf and decreased solid–liquid (electrode–electrolyte) contact area, fSL, simultaneously affect the effective surface energy and the rate of corrosion.
Experimental
To further investigate the relationship of the corrosion rate and wetting, we conducted several experiments on metallic materials typically used for fresh water industry applications (e.g., water pipes and other similar components) including steel and cast iron. Out of these two, cast iron turned out to be a material of interest which can relatively easily be hydrophobized and also subjected to corrosion at a significant rate. For that end, a procedure was developed which is outlined in this section, and followed by PPT tests on ADI90 Cast iron (CI) samples.Surface roughening
CI samples were cut into 25 mm squares of approximately 6 mm thickness. The sample set identifiers are given in parenthesis, the number 1 denotes uncoated, while 2 and 3 denote two types of hydrophobic coatings. The surfaces were roughened as described below, and then the samples were ultrasonically cleaned in water, then in ethanol, and then air dried. One set of samples was mechanically abraded by successively using 320, 400, 600, 800, 1200 grit silicon carbide papers, followed by polishing with a soft cloth impregnated with 3 μm alumina particles to obtain a smooth surface (samples P1). Another set was abraded by using 320 grit silicon carbide paper to obtain a rough surface (samples R1). A third set was roughened by sandblasting for 30 s to obtain an extremely rough surface (samples S1).Hydrophobic coating
Following the procedure of hydrophobization suggested by Yuan46 with some modifications, the samples (P2, R2, and S2) were immersed in acetic acid (CH3COOH) solution (36%) for two hours, followed by hydrogen peroxide solution (15%) for three hours. After that, the samples were immersed in a 0.01 M solution of stearic acid (CH3(CH2)16COOH) in ethanol for 24 hours. Then the samples were taken out of the solution and air dried. Stearic acid coating was used to study if hydrophobization by monolayers can inhibit corrosion.Another set of samples (P3, R3, and S3) was spray coated with a commercial liquid repelling treatment (Rust-Oleum® NeverWet®). First the samples were spray coated with a base coat and allowed to dry for 30 min. Then four top coats were applied for 2 minutes between each coat. The top coat was allowed to dry for 3 hours.
Contact angle and surface roughness measurements
The as-placed water contact angles (CAs) were measured using a ramé-hart goniometer (model 250) by placing three pure water droplets of 10 μl at different locations on the surface. The contact angle hysteresis (CAH) was calculated by the tilting plate method. The samples were observed at 20× using an Olympus Lext OLS4100 microscope and average surface roughness (Sa) of an area 0.625 μm × 0.625 μm was measured.Potentiodynamic polarization test
The corrosion behavior of samples was studied using the PPT procedure. A standard three electrode system with the sample as a working electrode, saturated calomel as a reference electrode, and platinum as a counter electrode was used. A potentiostat (Biologic SP-200) with EC-Lab software was used for voltage sweep and data acquisition. The electrolyte was 3.5 wt% NaCl solution. The exposed area of the working electrode was circular with a diameter of 1 cm or approximately 0.79 cm2. The samples were kept in contact with the electrolyte for 30 min to reach the open circuit potential. The potential was varied at a rate of 0.116 mV s−1 during the tests. The results from the experiments are discussed in the following section.Results and discussion
The polished sample P1 had the lowest CA of 50.5° among uncoated samples, while P2 had the lowest CA of 95.4° among stearic acid-coated ones. Roughening of the samples led to an increase in the CA in uncoated samples. All the uncoated samples showed significant CAH. Once the stearic acid coating was applied, all the samples became hydrophobic with a CA > 90°. The sample P2 was only slightly hydrophobic with a CA of 95.4°. The sample R2 had a CA of 110.0°. The sand blasted sample S2 had the highest CA of 124.4° among stearic acid coated ones. The stearic acid-coated samples also showed large CAH values. Water droplets were placed on each of the samples P1, R1, S1, P2, R2, and S2 and then the samples were tilted to a vertical position. The water droplet clung to the surface in all the cases, showing strong adhesion with the surface. This also suggested that most of the surface cavities were filled with water, than air. The CAH of the samples also reveal high adhesion with water. The adhesive forces can be quantified using a centrifugal adhesion balance.11 All the samples coated with NeverWet were superhydrophobic. It was extremely difficult to place water droplets on the surface for CA measurement. They rolled off at the slightest disturbance, making CAH measurement extremely difficult. Samples P3, R3, and S3 had contact angles of 160.3°, 158.5°, and 150.7° respectively, with negligible CAH. The results of the CA measurements are presented in Table 2.| Sample ID | CA (deg) | CAH (deg) | S a (μm) | i corr (μA cm−2) | E corr (mV) | Corrosion rate (mmpy) |
|---|---|---|---|---|---|---|
| P1 | 50.5 | 27.5 | 0.042 | 5.81 | −646.9 | 0.144 |
| R1 | 73.5 | 24.7 | 0.144 | 5.22 | −641.2 | 0.130 |
| S1 | 69.9 | 27.5 | 2.335 | 18.01 | −602.6 | 0.449 |
| P2 | 95.4 | 24.7 | 0.086 | — | — | — |
| R2 | 110.0 | 36.5 | 0.216 | — | — | — |
| S2 | 124.4 | 60.0 | 2.843 | 11.98 | −608.0 | 0.299 |
| P3 | 160.3 | — | 9.001 | 6.33 × 10⁻⁶ | −315.9 | 0.158 × 10⁻⁶ |
| R3 | 158.5 | — | 8.849 | 3.16 × 10⁻⁸ | −40.3 | 0.789 × 10⁻⁹ |
| S3 | 150.7 | — | 9.884 | 7.10 × 10⁻⁴ | −298.5 | 0.177 × 10⁻⁴ |
It is difficult to conclude from direct observations whether the wetting state for the samples P2, R2, and S2 was Wenzel or Cassie–Baxter; however, it was found that surfaces immersed in water tended to reflect light indicating the possible presence of air pockets. Due to the extreme water repellency observed for P3, R3, and S3, it can be concluded that they were in the Cassie–Baxter state.
The average surface roughness values for samples P1 and R1 were 0.042 and 0.144 μm. For S1 the roughness was on the micron scale with a value of 2.335 μm. The samples P2, R2 and S2 had average surface roughness values of 0.086, 0.216, and 2.843 μm respectively. These roughness values are higher than those for corresponding hydrophilic samples. The average surface roughness values for P3, R3, and S3 were substantially higher than those for corresponding hydrophilic and hydrophobic samples. The optical images of samples P1, P2, and P3 are shown in Fig. 6, while the surface topographies of all the samples are shown in Fig. 7.
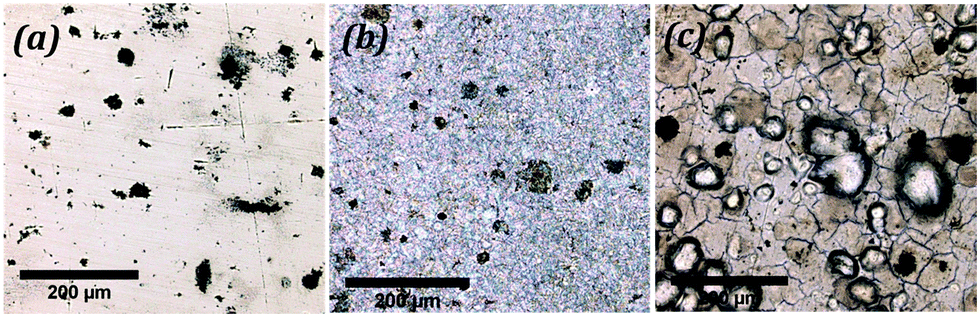 | ||
| Fig. 6 Optical images of surfaces of the samples (a) P1, (b) P2, and (c) P3. The coating on P3 is visibly different with cracks and bubbles on the surface. | ||
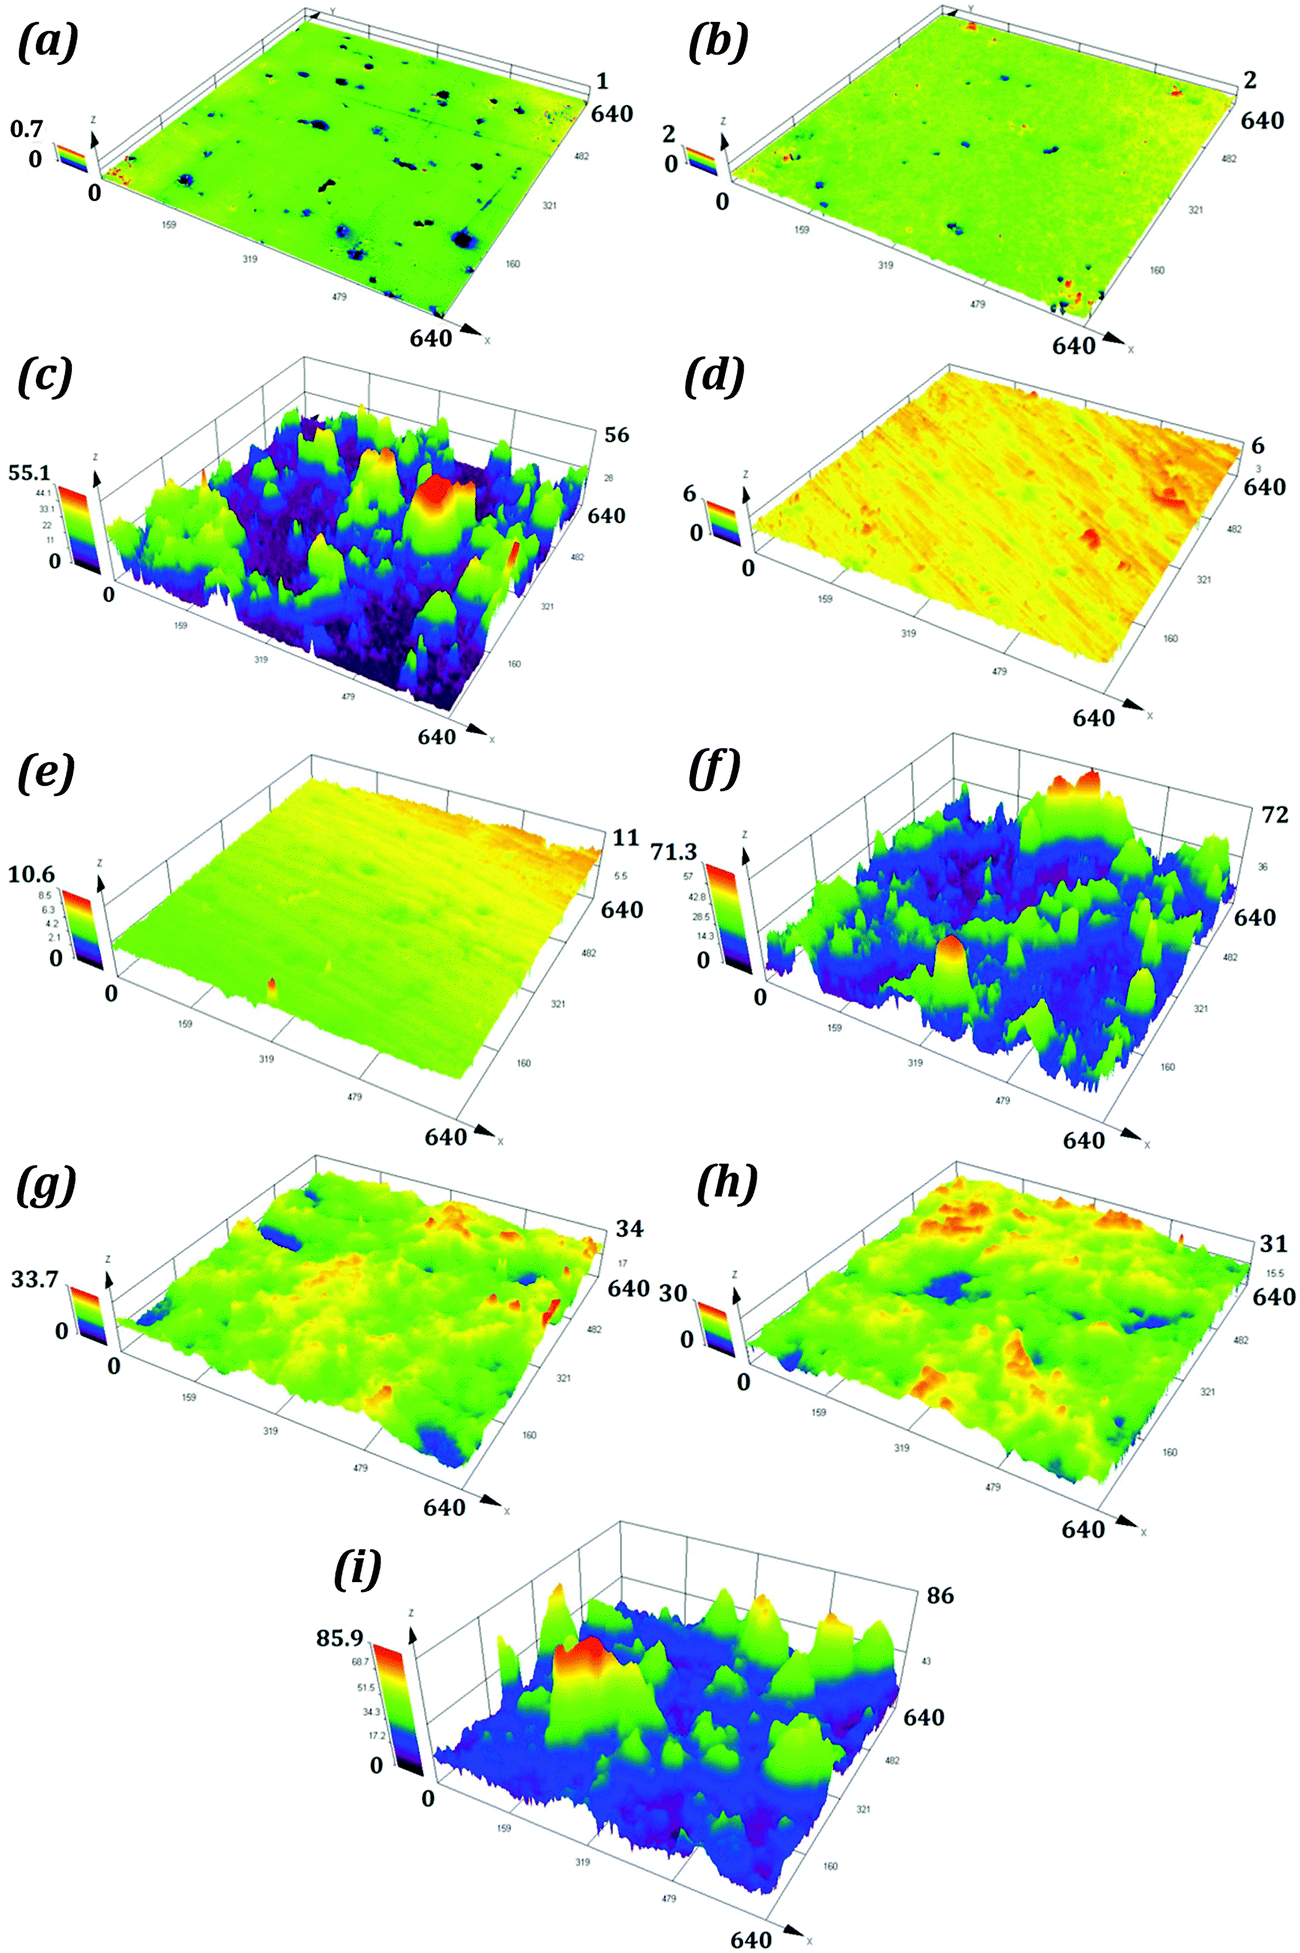 | ||
| Fig. 7 (a)–(i) The surface topographies of P1, P2, P3, R1, R2, R3, S1, S2, and S3 respectively. Coating with the liquid repellent spray results in a drastic change in surface roughness as seen in the case of P3, R3, and S3. All scales are in μm. | ||
The Tafel plots were obtained from the EC-Lab software (Fig. 8). For the samples P2 and R2 the PPT did not produce any characteristic Tafel plots, which might be caused by poor stability of the stearic acid coating on the samples with low roughness. Consequently, no corrosion current and potential were measured on these samples.
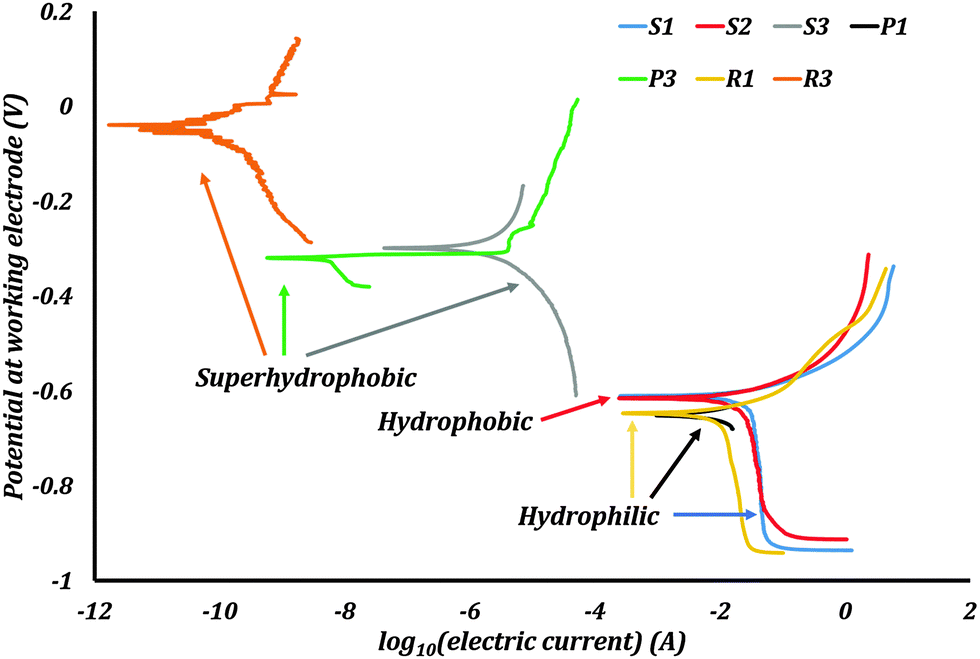 | ||
| Fig. 8 Potentiodynamic polarization curves of the samples. Rendering the surface superhydrophobic is seen to decrease the corrosion current density as well as shift the corrosion potential closer to the reference electrode potential. | ||
Corrosion current densities, corrosion potentials, and corrosion rates were obtained from these plots using the software. These values are presented in Table 2. The polished sample P1 had an icorr of 5.81 μA cm−2. After rendering it superhydrophobic, the resulting sample P3 had an icorr of 6.33 × 10⁻⁶ μA cm−2. The sample R1 had an icorr of 5.22 μA cm−2. Rendering it superhydrophobic resulted in sample R3 with icorr 3.16 × 10⁻⁸ μA cm−2. The samples S1, S2 and S3 had an icorr of 18.01, 11.98, and 7.10 × 10⁻⁴ μA cm−2 respectively. The corrosion potentials also showed a significant change with the wettability of the surface. The absolute values of the corrosion potentials decreased by more than 50% for the superhydrophobic samples. Consequently, the corrosion rates of the superhydrophobic samples were several orders smaller than those of the hydrophilic and hydrophobic samples. A repeated PPT on samples gives corrosion current values of similar magnitudes.
The hydrophilic samples P1, R1, and S1 showed significant rusting on their surfaces after PPT. The hydrophobic samples P2, R2, and S2 also showed rusting on their surfaces, with a loss of hydrophobicity after PPT. The loss of hydrophobicity on P2, R2, and S2 is due to the combined effect of corrosion as well as destruction of trapped air pockets under hydrostatic pressure. The superhydrophobic samples P3, R3, and S3 however had no visible rusting on their surfaces following the PPT. These samples were robust, retaining their superhydrophobicity and ability to trap pockets of air at the surface.
The trends observed in the experimental data were that the corrosion current density decreased and the corrosion potential increased as a result of rendering a surface superhydrophobic. The corrosion potentials of most metals and alloys in their native state are negative. Therefore, these metals and alloys have the tendency to get oxidized into corrosion products. The corrosion potential of a hydrophobic surface typically shifts to a value closer to that of the reference electrode. This means a lower thermodynamic tendency to oxidize. Also, the reduction in the solid–liquid interfacial contact area by the formation of trapped air pockets results in excellent corrosion resistance.
The experimental results obtained with CI samples showed a similar trend to the results from the published literature. Corrosion current densities decreased by several magnitudes and corrosion potentials shifted in the positive direction once the surfaces were made superhydrophobic. These were signs of corrosion inhibition.
The samples P1 and R1 had sub-micron scale surface roughness. As the roughness of the samples increased from P1 to R1, the corrosion current density decreased and the corrosion potential increased, but only slightly. Interestingly, when the roughness increased to the scale of microns for S1, the corrosion current density increased three folds. This can be explained by the formation of homogenous solid–liquid interfacial contact. Roughness at such an interface can amplify the effects of corrosion similar to what is observed in the Wenzel model. An increase in surface roughness leads to an increase in surface area exposed to the electrolyte. Therefore more reaction sites are available for corrosion to proceed and hence the increased corrosion current density. Having a homogenous solid–liquid interface is detrimental to the metal or alloy.
When the samples were hydrophobized with stearic acid, the surface roughness changed. This is due to the reaction of cast iron with acetic acid, as well as hydrogen peroxide. The stearic acid coating as well as the surface roughness are seen to impart hydrophobicity to the samples. The corrosion current density decreases in the case of S2 when compared with S1. The difference between S1 and S2 is in the type of interface formed when in contact with the electrolyte. The sample S1, as seen before, has an amplified corrosion tendency due to its very rough surface and hydrophilicity. The sample S2 is hydrophobic and can sustain some trapped pockets of air compared to S1 as observed when S2 was dipped in water. These air pockets result in reduced electrode–electrolyte contact. Hence the decrease in corrosion current density from S1 to S2. But hydrophobic S2 has higher corrosion current densities than hydrophilic P1 and R1. Even though S2 has a non-homogenous interface, its effective solid–liquid contact is more than P1 and R1 due to its high surface roughness. This suggests that as long as the wetting regime on a surface is not purely Cassie–Baxter, the effect of roughness is more pronounced than the contact angle on corrosion.
In the case of samples P3, R3, and S3, the roughness of the cast iron itself was not of particular importance. After applying the spray coating, the surface roughness of all three samples increased drastically. The coating itself was visible to the naked eye, and felt rough to touch. Under the microscope, the coating was seen to have cracks and bubbles on the surface (Fig. 6c). These surface features resulted in the extremely high surface roughness values. The surfaces of P3, R3, and S3 looked unaffected to the naked eye after the PPT.
For the samples P2, R2, and S2, the stearic acid coating was not visible to the naked eye. These surfaces showed signs of corrosion after the PPT. Stearic acid usually forms a monolayer on the surface that renders the surface hydrophobic. This layer is not robust like the spray coating. Such a fragile layer may also undergo a Cassie–Baxter to Wenzel wetting transition due to the hydrostatic pressure in the corrosion cell. This may be a reason for the relatively feeble performance of S2.
In most of the published literature, epoxy or similar coatings were employed. These coatings themselves act as diffusion barriers to ionic species or are less permeable to air. Such coatings were far superior offering 85% or higher drop in corrosion current densities compared to uncoated metals or alloys. In the case of our experiments, we employed both thick coatings as well as monolayers. Therefore, the effects of surface roughness and non-homogenous hydrophobic interface on corrosion inhibition were isolated in this study. The thickness of coating on P3, R3 and S3 was much larger than the stearic acid monolayer on S2. This suggests that thickness of coating has a significant part to play in corrosion inhibition. Thicker coatings provide a tortuous path for the corrosive agents. In the case of a Cassie–Baxter to Wenzel transition, a relatively thick coating can act as a second line of defense against the corrosive agents.
The general principle of chemical equilibrium (Le Châtelier's principle) states that when many factors affect equilibrium of a system, any change in status quo prompts an opposing reaction in the responding system. While further studies of fundamental mechanisms of corrosion on non-wetting surfaces may be required to understand the underlying mechanisms, we note that the observed trends are consistent with this principle. In the case of an electrode immersed in the electrolyte, the equilibrium surface energy depends both on the inherent surface energy of the material and on the potential of the electrode. By rendering the electrode surface hydrophobic we decrease the inherent surface energy. This shift in equilibrium of the system is compensated by a change in the potential difference between the surface and the wetting liquid. A positive change in potential was observed in all the cases discussed here. However, the absolute value of the potential decreased, which, in accordance with the electrowetting laws such as the Lippmann equation (eqn (7)), corresponds to increasing surface energy. This change in corrosion potential can lead to a decrease in the corrosion current density for the surface, and thus the rate of corrosion. This trend is also universally observed in the cases discussed here.
Conclusions
We discussed the principles of corrosion and electrowetting as well as mechanisms which led to their correlation with the superhydrophobicity. The mechanism of electrochemical corrosion was discussed and the technique for measuring corrosion parameters was introduced. Corrosion test data were compiled from recent literature to highlight the trends observed in critical parameters related to corrosion. A facile, scalable hydrophobic coating using stearic acid was developed on cast iron. A commercial liquid repelling spray was used to render cast iron superhydrophobic. Corrosion tests were performed on cast iron in hydrophilic, hydrophobic and superhydrophobic states. Both the compiled data as well as our experimental results showed a decrease in corrosion current density and an increase in corrosion potential after superhydrophobization. This can be explained in light of Le Châtelier's principle. A stable non-homogenous solid–electrolyte–air interface was essential for superior corrosion resistance. A theoretical model was developed and validated with the experimental data. This will provide a fundamental understanding of wetting phenomena in corrosion inhibition.We studied here a relatively new area of corrosion inhibition employing hydrophobic/superhydrophobic surfaces. The existence of a stable non-homogenous interface and the significant reduction in corrosion current density meant that similar coating will find applications in the water industry like water pipelines, gauges, probes, etc. An ideal superhydrophobic coating for corrosion inhibition should satisfy two requirements: it should be able to withstand Cassie–Baxter to Wenzel transition under duress, and it should provide a tortuous path for the corrosive agents trying to attack the metallic surface.
Acknowledgements
We would like to acknowledge NSF IUCRC FRP award 1331532 support and thank Prof. Pradeep Rohatgi for discussions and Mr Emad Omrani for help with sample preparation and PPT training.References
- M. F. Montemor, Surf. Coat. Technol., 2014, 258, 17–37 CrossRef CAS PubMed
.
- R. Tadmor, Langmuir, 2004, 20, 7659–7664 CrossRef CAS PubMed
- K. L. Cho, A. H. Wu, I. I. Liaw, D. Cookson and R. N. Lamb, J. Phys. Chem. C, 2012, 116, 26810–26815 CAS
- R. N. Wenzel, Ind. Eng. Chem., 1936, 28, 988–994 CrossRef CAS
- A. B. D. Cassie and S. Baxter, Trans. Faraday Soc., 1944, 40, 546–551 RSC
- A. J. B. Milne and A. Amirfazli, Adv. Colloid Interface Sci., 2012, 170, 48–55 CrossRef CAS PubMed
- T. Nishino, M. Meguro, K. Nakamae, M. Matsushita and Y. Ueda, Langmuir, 1999, 15, 4321–4323 CrossRef CAS
- J. Bico, U. Thiele and D. Quere, Colloids Surf., A, 2002, 206, 41–46 CrossRef CAS
- L. Feng, Y. Zhang, J. Xi, Y. Zhu, N. Wang, F. Xia and L. Jiang, Langmuir, 2008, 24, 4114–4119 CrossRef CAS PubMed
- B. Bhushan and M. Nosonovsky, Philos. Trans. R. Soc., A, 2010, 368, 4713–4728 CrossRef CAS PubMed
- R. Tadmor, P. Bahadur, A. Leh, H. E. N'guessan, R. Jaini and L. Dang, Phys. Rev. Lett., 2009, 103, 266101 CrossRef
- H. E. N'guessan, A. Leh, P. Cox, P. Bahadur, R. Tadmor, P. Patra, R. Vajtai, P. M. Ajayan and P. Wasnik, Nat. Commun., 2012, 3, 1242 CrossRef PubMed
- M. Nosonovsky and B. Bhushan, Curr. Opin. Colloid Interface Sci., 2009, 14, 270–280 CrossRef CAS PubMed
- V. Hejazi, K. Sobolev and M. Nosonovsky, Sci. Rep., 2013, 3, 2194 Search PubMed
- J. B. Boreyko and C. P. Collier, ACS Nano, 2013, 7, 1618–1627 CrossRef CAS PubMed
- J. B. Boreyko, B. R. Srijanto, T. D. Nguyen, C. Vega, M. Fuentes-Cabrera and C. P. Collier, Langmuir, 2013, 29, 9516–9524 CrossRef CAS PubMed
- M. Liu, S. Wang, Z. Wei, Y. Song and L. Jiang, Adv. Mater., 2009, 21, 665–669 CrossRef CAS PubMed
- L. Feng, Z. Y. Zhang, Z. H. Mai, Y. M. Ma, B. Q. Liu, L. Jiang and D. B. Zhu, Angew. Chem., Int. Ed., 2004, 43, 2012–2014 CrossRef CAS PubMed
- L. Feng, Y. Che, Y. Liu, X. Qiang and Y. Wang, Appl. Surf. Sci., 2013, 283, 367–374 CrossRef CAS PubMed
- N. V. Motlagh, F. C. Birjandi, J. Sargolzaei and N. Shahtahmassebi, Appl. Surf. Sci., 2013, 283, 636–647 CrossRef PubMed
- P. Li, X. Chen, G. Yang, L. Yu and P. Zhang, Appl. Surf. Sci., 2014, 289, 21–26 CrossRef CAS PubMed
- S. Yuan, S. O. Pehkonen, B. Liang, Y. P. Ting, K. G. Neoh and E. T. Kang, Corros. Sci., 2011, 53, 2738–2747 CrossRef CAS PubMed
- X. Shi, T. A. Nguyen, Z. Suo, J. Wu, J. Gong and R. Avci, Surf. Coat. Technol., 2012, 206, 3700–3713 CrossRef CAS PubMed
- F. Zhang, S. Chen, L. Dong, Y. Lei, T. Liu and Y. Yin, Appl. Surf. Sci., 2011, 257, 2587–2591 CrossRef CAS PubMed
- J. Ou, M. Liu, W. Li, F. Wang, M. Xue and C. Li, Appl. Surf. Sci., 2012, 258, 4724–4728 CrossRef CAS PubMed
- R. Qiu, D. Zhang and P. Wang, Corros. Sci., 2013, 66, 350–359 CrossRef CAS PubMed
- C. Weng, C. Chang, C. Peng, S. Chen, J. Yeh, C. Hsu and Y. Wei, Chem. Mater., 2011, 23, 2075–2083 CrossRef CAS
- C. Chang, M. Hsu, C. Weng, W. Hung, T. Chuang, K. Chang, C. Peng, Y. Yen and J. Yeh, J. Mater. Chem. A, 2013, 1, 13869–13877 CAS
- C. Peng, K. Chang, C. Weng, M. Lai, C. Hsu, S. Hsu, S. Li, Y. Wei and J. Yeh, Polym. Chem., 2013, 4, 926–932 RSC
- K. Chang, M. Hsu, H. Lu, M. Lai, P. Liu, C. Hsu, W. Ji, T. Chuang, Y. Wei, J. Yeh and W. Liu, Carbon, 2014, 66, 144–153 CrossRef CAS PubMed
- F. Zhang, L. Zhao, H. Chen, S. Xu, D. G. Evans and X. Duan, Angew. Chem., Int. Ed., 2008, 47, 2466–2469 CrossRef CAS PubMed
- W. Xu, J. Song, J. Sun, Y. Lu and Z. Yu, ACS Appl. Mater. Interfaces, 2011, 3, 4404–4414 CAS
- Z. She, Q. Li, Z. Wang, L. Li, F. Chen and J. Zhou, Chem. Eng. J., 2013, 228, 415–424 CrossRef CAS PubMed
- S. C. Vanithakumari, R. P. George and U. K. Mudali, Corrosion, 2013, 69, 804–812 CrossRef CAS PubMed
- H. Chen, X. Zhang, P. Zhang and Z. Zhang, Appl. Surf. Sci., 2012, 261, 628–632 CrossRef CAS PubMed
- X. H. Xu, Z. Z. Zhang, J. Yang and X. Zhu, Colloids Surf., A, 2011, 377, 70–75 CrossRef CAS PubMed
- X. Chen, G. Yang, L. Kong, D. Dong, L. Yu, J. Chen and P. Zhang, Mater. Chem. Phys., 2010, 123, 309–313 CrossRef CAS PubMed
- Y. Fan, C. Li, Z. Chen and H. Chen, Appl. Surf. Sci., 2012, 258, 6531–6536 CrossRef CAS PubMed
- G. Verma, S. K. Dhoke and A. S. Khanna, Surf. Coat. Technol., 2012, 212, 101–108 CrossRef CAS PubMed
- T. Ning, W. Xu and S. Lu, Appl. Surf. Sci., 2011, 258, 1359–1365 CrossRef CAS PubMed
- S. S. Pathak and A. S. Khanna, Prog. Org. Coat., 2008, 62, 409–416 CrossRef CAS PubMed
- K. Liu, M. Zhang, J. Zhai, J. Wang and L. Jiang, Appl. Phys. Lett., 2008, 92, 183103 CrossRef PubMed
- E. Bormashenko and O. Gendelman, Chem. Phys. Lett., 2014, 599, 139–141 CrossRef CAS PubMed
- T. N. Krupenkin, J. A. Taylor, E. N. Wang, P. Kolodner, M. Hodes and T. R. Salamon, Langmuir, 2007, 23, 9128–9133 CrossRef CAS PubMed
- T. Krupenkin and J. A. Taylor, Nat. Commun., 2011, 2, 448 CrossRef PubMed
- Z. Yuan, J. Xiao, C. Wang, J. Zeng, S. Xing and J. Liu, J. Coat. Technol. Res., 2011, 8, 773–777 CrossRef CAS
| This journal is © the Owner Societies 2015 |