
 Open Access Article
 This Open Access Article is licensed under a
 Creative Commons Attribution 3.0 Unported Licence
Forensic electrochemistry: indirect electrochemical sensing of the components of the new psychoactive substance “Synthacaine”†
Loanda R.
Cumba
ab,
Athanasios V.
Kolliopoulos
b,
Jamie P.
Smith
b,
Paul D.
Thompson
b,
Peter R.
Evans
b,
Oliver B.
Sutcliffe
*b,
Devaney R.
do Carmo
a and
Craig E.
Banks
*b
aFaculdade de Engenharia de Ilha Solteira UNESP – Universidade Estadual Paulista, Departamento de Física e Química, Av. Brasil Centro, 56 – CEP 15385-000, Ilha Solteira, SP, Brazil
bFaculty of Science and Engineering, School of Science and the Environment, Division of Chemistry and Environmental Science, Manchester Metropolitan University, Chester Street, Manchester M1 5GD, UK. E-mail: c.banks@mmu.ac.uk; o.sutcliffe@mmu.ac.uk; Web: http://www.craigbanksresearch.com Fax: +44 (0)161-247-6831, +44 (0)161-247-6831; Tel: +44 (0)161-247-1196, +44 (0)161-247-1531
First published on 23rd June 2015
Abstract
“Synthacaine” is a New Psychoactive Substance which is, due to its inherent psychoactive properties, reported to imitate the effects of cocaine and is therefore consequently branded as “legal cocaine”. The only analytical approach reported to date for the sensing of “Synthacaine” is mass spectrometry. In this paper, we explore and evaluate a range of potential analytical techniques for its quantification and potential use in the field screening “Synthacaine” using Raman spectroscopy, presumptive (colour) testing, High Performance Liquid Chromatography (HPLC) and electrochemistry. HPLC analysis of street samples reveals that “Synthacaine” comprises a mixture of methiopropamine (MPA) and 2-aminoindane (2-AI). Raman spectroscopy and presumptive (colour) tests, the Marquis, Mandelin, Simon's and Robadope test, are evaluated towards a potential in-the-field screening approach but are found to not be able to discriminate between the two when they are both present in the same sample, as is the case in the real street samples. We report for the first time a novel indirect electrochemical protocol for the sensing of MPA and 2-AI which is independently validated in street samples with HPLC. This novel electrochemical approach based upon one-shot disposable cost effective screen-printed graphite macroelectrodes holds potential for in-the-field screening for “Synthacaine”.
Introduction
In the last few years there has been a striking increase in the sale of “New Psychoactive Substances” (NPSs) formerly known as “legal highs”.1 These chemicals may be bought through the internet at low cost and are sometimes pure compounds which display highly similar chemical structures to existing controlled substances within the phenethylamine class.“Synthacaine” is a slang term derived from “synthetic” and “cocaine” however this “legal cocaine” product, like many branded as “legal highs”, differs considerably with respect to their constitution and in batches from the same vendor, due to variations in regional legislative control. Brazilian “Synthacaine”, for example, contains primarily dimethocaine,2 whereas camfetamine was identified in samples seized in Ireland.3 Blends are not uncommon in Europe, for example, mixtures of MAM-2201 (a synthetic cannabinoid)4 or methiopropamine (MPA)5 with benzocaine have been reported in Italy and Austria respectively. In the UK, “Synthacaine” is distributed principally as a mixture of two CNS-stimulants, methiopropamine6–8 and 2-aminoindane (2-AI),9 which mimic the effects of the controlled stimulant methamphetamine. The prevalence of blended “legal high” products has given rise to both legal and analytical challenges in the rapid detection of these substances by law enforcement and customs officials – as many of the field tests are unable to reliably discern individual components with a mixture of compounds.
Electrochemistry is an advantageous analytical tool that is adaptable to an in-the-field device, in light of its portability, and can exhibit sensitivity and selectivity toward many target analytes. Previous work on the development of robust electrochemical methods for the sensing of the synthetic cathinones, either in their pure form10 or in the presence of common adulterants11 have the potential as rapid, simple and cost-effective on-the-spot analytical screening tools with graphite screen-printed electrodes.
In this paper the further development of our novel electrochemical sensing protocol utilizing disposable graphite screen-printed electrodes is reported and compared against alternative techniques (e.g. colour tests or Raman spectroscopy) utilized as presumptive screening tools for the detection of illicit drugs. Our methodology offers a low-cost, single-shot, disposable yet highly reproducible and reliable sensing platform for a potential portable sensing approach for the detection of NPSs. This electrochemical protocol as a tool is validated in street sample of “Synthacaine” which has been independently validated with HPLC showing excellent agreement and providing validation that our electroanalytical approach can be used for the quantification of “legal high” samples.
Experimental
All chemicals were of commercial quality (obtained from Sigma-Aldrich, Gillingham, UK) and used without further purification. 2-Aminoindane hydrochloride (2-AI) was obtained from Apollo Scientific Limited (Stockport, UK) and used without further purification. The street sample of “Synthacaine” was obtained from obtained from “Buy Research Chemicals UK” (http://www.brc-chemicals.com) and used without further purification.1H- and 13C-NMR spectra were acquired on a JEOL AS-400 (JEOL, Tokyo, Japan) NMR spectrometer operating at a proton resonance frequency of 400 MHz. Samples of (±)-methiopropamine, 2-aminoindane and “Synthacaine” (10 mg/0.60 mL) were dissolved in either CDCl3 or DMSO-d6 and filtered prior to analysis. Infrared spectra were obtained in the range 4000–400 cm−1 using a ThermoScientific Nicolet iS10ATR-FTIR instrument (ThermoScientific, Rochester, USA). GC-MS spectra were recorded on an Agilent 6890 gas chromatograph with split-splitless injection (sample volume: 1 μL) and a HP-5MS column (30 m × 0.25 mm, 0.25 μm film thickness). Helium (He) was used as the carrier gas at a flow rate of 1.0 mL min−1. The GC was coupled to an Agilent 5973 MSD (EI, 70 eV, TIC mode scanning m/z 50–500) and injector port was set at 275 °C, the transfer line at 280 °C. The following temperature program was used: 60 °C for 3 min, 20 °C min−1 to 280 °C, 280 °C for 5 min. High-resolution mass spectra were recorded on an Agilent 1260 infinity LC coupled to a 6540 UHV accurate mass Q-TOF mass spectrometer by looped injection using electrospray ionisation (ESI, collision energy: 15 eV). Ultraviolet spectra were obtained using a Unicam 300 UV spectrophotometer (ThermoScientific, Rochester, USA). Thin-Layer Chromatography (TLC) was carried out on aluminium-backed SiO2 plates (Merck, Darmstadt, Germany) and spots were visualised using ultra-violet light (254 nm). Melting points were determined using Gallenkamp 5A 6797 apparatus (Gallenkamp, Germany) and are uncorrected. Optical rotation values [α]22D (10−1 deg cm2 g−1) were performed on a Bellingham & Stanley ADP-220 polarimeter (Bellingham & Stanley, Tunbridge Wells, UK).
All solutions were prepared using deionised water of resistivity no less than 18.2 MΩ cm and were vigorously degassed prior to electrochemical measurements with high purity, oxygen free nitrogen. Solutions containing MPA (1 mg mL−1) in carbonate buffer (pH 10.50); 2-AI (1 mg mL−1) in carbonate buffer (pH 10.50); “Synthacaine” (1 mg mL−1) in carbonate buffer (pH 10.50) and the mediator, N,N′-(1,4-phenylene)dibenzenesulfonamide, (1 mg mL−1) in methanol (note: the mediator solution was sonicated for 3 minutes to ensure dissolution) were prepared prior to analysis. Working solutions of lower concentrations were prepared by appropriate dilution of the stock solution as detailed above.
Synthesis of (±)-methiopropamine hydrochloride (MPA)
The title compound was prepared using an adaptation of the synthesis reported by Blicke et al.6 as an off-white crystalline powder (3.06 g, 14%) after recrystallization from ethanol–acetone: Mpt. (ethanol–acetone) 137–138 °C (Lit. 131–133 °C;8Rf [SiO2, EtOAc–n-hexane (1![[thin space (1/6-em)]](https://www.rsc.org/images/entities/char_2009.gif) :3)] = 0.1; [α]22D = 0 (c = 0.5 g/100 mL, MeOH); UV (H2O): λmax = 233.0 nm (A = 0.316, c = 9.9 × 10⁻⁴ g/100 mL); IR (ATR-FTIR): 2721.0 (C–H), 2457.0 (NH2+) and 1601.0 cm−1 (C
:3)] = 0.1; [α]22D = 0 (c = 0.5 g/100 mL, MeOH); UV (H2O): λmax = 233.0 nm (A = 0.316, c = 9.9 × 10⁻⁴ g/100 mL); IR (ATR-FTIR): 2721.0 (C–H), 2457.0 (NH2+) and 1601.0 cm−1 (C![[double bond, length as m-dash]](https://www.rsc.org/images/entities/char_e001.gif) C, aromatic); 1H-NMR (400 MHz, CDCl3) δ1H (ppm) = 9.71 (2H, bs, CH2CH(CH3)NH2+CH3), 7.21 (1H, dd, J = 5.0, 0.92 Hz, thiophene-5H), 7.08 (1H, dd, J = 5.0, 3.5 Hz, thiophene-4H), 6.98 (1H, dd, J = 3.5, 0.92 Hz, thiophene-3H), 3.62 (1H, dd, J = 14.0, 4.1 Hz, CH2CH(CH3)NH2+CH3), 3.34 (1H, ddq, J = 14.0, 10.3, 4.1 Hz, CH2CH(CH3)NH2+CH3), 3.18 (1H, dd, 14.0, 10.3 Hz, CH2CH(CH3)NH2+CH3), 2.71 (3H, s, CH2CH(CH3)NH2+CH3) and 1.43 ppm (3H, d, J = 6.9 Hz, CH2CH(CH3)NH2+CH3); 13C-NMR (100 MHz, CDCl3) δ13C (ppm) = 137.6 (thiophene-2C), 127.4 (thiophene-3C), 127.2 (thiophene-4C), 125.1 (thiophene-5C), 57.3 (CH2CH(CH3)NH2+CH3), 33.6 (CH2CH(CH3)NH2+CH3), 30.4 (CH2CH(CH3)NH2+CH3) and 15.9 ppm (CH2CH(CH3)NH2+CH3); LRMS (EI-, 70 eV): m/z = 154 (0.5%, [M − H]), 140 (1), 97 (36), and 58 (100); HRMS (ESI+, 15 eV) calculated for [M + H] C8H14NS: 156.0841, found: 156.0844.
C, aromatic); 1H-NMR (400 MHz, CDCl3) δ1H (ppm) = 9.71 (2H, bs, CH2CH(CH3)NH2+CH3), 7.21 (1H, dd, J = 5.0, 0.92 Hz, thiophene-5H), 7.08 (1H, dd, J = 5.0, 3.5 Hz, thiophene-4H), 6.98 (1H, dd, J = 3.5, 0.92 Hz, thiophene-3H), 3.62 (1H, dd, J = 14.0, 4.1 Hz, CH2CH(CH3)NH2+CH3), 3.34 (1H, ddq, J = 14.0, 10.3, 4.1 Hz, CH2CH(CH3)NH2+CH3), 3.18 (1H, dd, 14.0, 10.3 Hz, CH2CH(CH3)NH2+CH3), 2.71 (3H, s, CH2CH(CH3)NH2+CH3) and 1.43 ppm (3H, d, J = 6.9 Hz, CH2CH(CH3)NH2+CH3); 13C-NMR (100 MHz, CDCl3) δ13C (ppm) = 137.6 (thiophene-2C), 127.4 (thiophene-3C), 127.2 (thiophene-4C), 125.1 (thiophene-5C), 57.3 (CH2CH(CH3)NH2+CH3), 33.6 (CH2CH(CH3)NH2+CH3), 30.4 (CH2CH(CH3)NH2+CH3) and 15.9 ppm (CH2CH(CH3)NH2+CH3); LRMS (EI-, 70 eV): m/z = 154 (0.5%, [M − H]), 140 (1), 97 (36), and 58 (100); HRMS (ESI+, 15 eV) calculated for [M + H] C8H14NS: 156.0841, found: 156.0844.
Electrochemistry
Voltammetric measurements were carried out using a Palmsens (Palm Instruments BV, The Netherlands) potentiostat/galvanostat and controlled by PSTrace software version 4.4 for Windows 7. All electrochemical measurements were performed at room temperature (cyclic voltammetry and linear sweep). Experiments were performed using screen-printed graphite electrode (SPE) with a 3 mm diameter working electrode area. The screen-printed graphite electrodes were fabricated in-house with appropriate stencil designs using a microDEK 1760RS screen-printing machine (DEK, Weymouth, UK). This screen-printed electrode design has been previously reported.10,12–20 For the case of each fabricated electrode, first a carbon ink formulation (Product Code: C2000802P2; Gwent Electronic Materials Ltd, UK), which is utilized for the efficient connection of all three electrodes and as the electrode material for both the working and counter electrodes, was screen-printed onto a polyester (Autostat, 250 micron thickness) flexible film. After curing the screen-printed carbon layer in a fan oven at 60 degrees Celsius for 30 minutes, next a silver/silver chloride reference electrode was included by screen-printing Ag/AgCl paste (Product Code: C2040308D2; Gwent Electronic Materials Ltd, UK) onto the polyester substrates, which was subsequently cured once more in a fan oven at 60 degrees celsius for 30 minutes. Finally, a dielectric paste (Product Code: D2070423D5; Gwent Electronic Materials Ltd, UK) was then printed onto the polyester substrate to cover the connections and define the active electrode areas, including that of the working electrode (3 mm diameter). After curing at 60 degrees celsius for 30 minutes the SPEs are ready to be used. These electrodes have been characterized electrochemically in a prior paper and have heterogeneous electron transfer rate constants of 1.08 × 10⁻³ cm s−1. The reproducibility and repeatability of the fabricated batches of electrodes were explored through comparison of cyclic voltammetric responses using Ru(NH3)2+/3+ redox probe in 1 M KCl. Analysis of the voltammetric data revealed the % relative standard deviation (%RSD) to correspond to no greater than 0.82% (N = 20) and 0.76% (N = 3) for the reproducibility and repeatability of the fabricated GSPEs (for use in electroanalysis).High performance liquid chromatography (HPLC)
Reverse phase high-performance liquid chromatography was performed with an integrated Agilent HP Series 1100 Liquid Chromatograph (Agilent Technologies, Wokingham, UK) fitted with an in-line degasser, 100-place auto-injector and diode-array UV absorbance detector (monitoring at 233 nm (MPA) and 207 nm (2-AI) respectively). Data analysis was carried out using ChemStation for LC (Ver. 10.02) software (Agilent Technologies, Wokingham, UK). The mobile phase was aqueous acetonitrile:ammonium formate buffer (10 mM, pH 3.5 ± 0.02) (10:90 v/v); the flow rate was 1.2 mL min−1 with an injection volume of 10 μL. Six replicate injections of each calibration standard were performed. The stationary phase (ACE 3 C18, 150 mm × 4.6 mm i.d., particle size: 3 μm) used in the study was obtained from HiChrom Limited (Reading, UK). The column was fitted with a guard cartridge (ACE 3 C18) and maintained at an isothermal temperature of 22 °C with an Agilent HP Series 1100 column oven with a programmable controller (Agilent Technologies, Wokingham, UK).
:10) with mobile phase to give the test solution.
:75% v/v; 50:50% v/v and 75:25% v/v (methiopropamine hydrochloride:2-aminoindane hydrochloride) were prepared by mixing appropriate volumes of solutions (10 mg mL−1) of the reference standards in methanol.
Results and discussion
The “Synthacaine” street sample was obtained as detailed in the Experimental section with its (unknown) composition initially determined using High Performance Liquid Chromatography (HPLC).High performance liquid chromatography
Elliott et al.22 have reported utilising HPLC and LC–MS techniques to separately determine 2-AI and MPA in the toxicological screening of the analytes in plasma, however, no fully validated methods (or limits of detection and quantification) for the substances have, to-date, been reported. A HPLC chromatographic method was developed employing an isocratic elution (see Experimental section), to ensure both optimal detection of the analytes and a rapid analysis time. The two baseline resolved analytes eluted at 4.8 (2-AI) and 5.4 (MPA) min respectively (Fig. 1a and 1b) with peak fronting (As ∼ 0.5–0.6) observed in each case. Calibration standards were prepared and the strongly UV-absorbing (±)-methiopropamine demonstrated a linear response (r2 = 0.999) over a 5.0–80.0 μg mL−1 range with good repeatability (RSD = 0.78–1.11%, N = 6). The limits of detection and quantification for MPA were determined as being 0.31 and 0.94 μg mL−1. The method was also suitable for the detection and quantification of 2-AI, which exhibited a weaker UV response. 2-AI also demonstrated a linear response (r2 = 0.999) over a 10.0–160.0 μg mL−1 range with satisfactory repeatability (RSD = 0.58–1.19%, N = 6) and the limits of detection and quantification determined to be 0.83 μg mL−1 and 2.54 μg mL−1 respectively. The validation parameters for the method are summarised in Table 1. | ||
| Fig. 1 Representative chromatograms of solutions containing: (a) uracil (peak a, 10 μg mL−1), 2-AI hydrochloride (2-AI, peak b, 20 μg mL−1) and (±)-methiopropamine hydrochloride (MPA, peak c, 10 μg mL−1) at 207 nm; (b) uracil (peak a, 10 μg mL−1), (±)-2-AI hydrochloride (2-AI, peak b, 20 μg mL−1) and (±)-methiopropamine hydrochloride (MPA, peak c, 10 μg mL−1) at 233 nm and (c) purchased sample of “Synthacaine” (40 μg mL−1) at 207 nm obtained using an ACE 3 C18 column (150 mm × 4.6 mm i.d., particle size: 3 μm); mobile phase: acetonitrile:10 mM ammonium formate (pH 3.5) (10:90 v/v); detector wavelengths (DAD): 207 (2-AI) and 233 nm (MPA) respectively. The t0 was determined from the tR of a solution of uracil (10 μg mL−1). The peak eluting (circa. 1.48 min) in chromatograms (a) and (b) is a system peak. | ||
:10 mM ammonium formate (pH 3.5) (10:90 v/v); detector wavelengths (DAD): 207 (2-AI) and 233 nm (MPA) respectively. See Fig. 1 for representative chromatograms
| 2-Aminoindane (2-AI) | (±)-Methiopropamine (MPA) | |
|---|---|---|
| a Determined from the retention time of a solution of uracil (10 μg mL−1) [peak (a)] eluting from the column. b Relative retention time (with respect to 2-aminoindane). c N expressed in plates per m. d Limit of detection (based on the standard deviation of the response and the slope). e Limit of quantification (based on the standard deviation of the response and the slope). f y = 19.468x + 33.665. g y = 20.616x + 0.9295. | ||
| Chromatographic peak (see Fig. 1) | (b) | (c) |
| UV detection wavelength (nm) | 207 | 232 |
| t R (min) (t0 = 1.69 mina) | 4.8 | 5.4 |
| RRTb | 1 | 1.1 |
| Capacity ator (k′) | 1.84 | 2.2 |
| N (plates) | 11370 (75800)c |
13530 (90200)c |
| H (m) | 1.32 × 10⁻⁵ | 1.11 × 10⁻⁵ |
| Resolution (Rs) | — | 1.94 |
| Symmetry ator (As) | 0.5 | 0.6 |
| LODd (μg mL−1) | 0.83 | 0.31 |
| LOQe (μg mL−1) | 2.54 | 0.94 |
| Co-efficient of regression (r2) | 0.999f | 0.999g |
| Precision (%RSD, N = 6) | ||
| 160 μg mL−1 | 0.58 | n.d. |
| 80 μg mL−1 | 0.60 | 0.78 |
| 40 μg mL−1 | 0.81 | 0.89 |
| 20 μg mL−1 | 0.84 | 0.89 |
| 10 μg mL−1 | 1.19 | 1.11 |
| 5 μg mL−1 | n.d. | 1.02 |
The purchased sample of “Synthacaine” was analysed using the validated method at a concentration of 40 μg mL−1 (Fig. 1c). The results confirm that the sample only contained the two alleged components (tR = 4.8 min [minor, 2-AI, 42.3% w/w, %RSD = 3.23%, N = 3] and tR = 5.4 min [major, (±)-methiopropamine, 57.2% w/w, %RSD = 1.31%, N = 3], unlike other NPSs this sample of “Synthacaine” appeared to be of high purity (99.5% w/w) there was no evidence (confirmed by 1H-NMR, vide supra) that it contained any additional NPSs or commonly used diluents and/or adulterants. Next, attention was turned to exploring whether presumptive colour tests can be potentially used for the in-the-field determination of “Synthacaine” and its components.
Presumptive colour tests
Presumptive colour tests were carried out according to the United Nations recommended guidelines.21 As there are no reports regarding the presumptive testing of 2-AI and MPA, the following standard presumptive tests were applied in this study: (i) Marquis test; (ii) Mandelin test; (iii) Simon's test and (iv) Robadope test. The preparation of the reagents and test procedure is detailed in the Experimental section. A solution of each reference standard (10 mg mL−1) was prepared in methanol and 1–2 drops placed into a dimple well of a spotting tile. The required presumptive test reagent (1–2 drops) was then added and any colour change or other noticeable effect occurring immediately on addition of the reagents was noted and observations were made again after 5 min. The results (see ESI, SI-1†) indicated that the secondary amine, MPA, gave a positive reaction with Marquis and Simon's reagents, whilst the primary amine, 2-AI, gave a positive reaction with the Mandelin and Robadope reagents. The sample of “Synthacaine” obtained from Buy Research Chemicals UK (http://www.brc-chemicals.com), which purported to contain an undisclosed mixture of (±)-methiopropamine and 2-AI, was screened against the standard tests. The sample (see ESI, SI-2†) gave a positive reaction with Marquis, Mandelin and Simon's reagents indicating that the sample may indeed contain both (±)-methiopropamine and 2-AI, however, the colour observed with Mandelin reagent was a much darker brown-red than that observed with the pure 2-AI reference standard, indicating that there may be either another compound (adulterant or diluent) present or interference between the mixture of components and test reagents. The absence of additional adulterants/diluants, the sample (10 mg/0.6 mL−1) was confirmed through 1H-NMR (400 MHz, DMSO-d6) analysis and comparison with standards of (±)-methiopropamine and 2-AI (recorded under identical conditions). The 1H-NMR data indicated that the “Synthacaine” sample was essentially a mixture of MPA and 2-AI in a ratio of 60:40% (MPA:2-AI). As NMR is not considered a routine method of analysis in many forensic laboratories, we investigated whether any interference between the components and/or the test reagents was a possible explanation of our observations. Solutions containing 25:75% v/v; 50:50% v/v and 75:25% v/v (MPA:2-AI) were prepared by mixing appropriate volumes of solutions (10 mg mL−1) of the reference standards in methanol and screened against the standard tests. The data (see ESI, SI-3†) indicated that in all cases the test reagents (when compared to the pure standards) confirmed the presence of MPA (even at concentrations circa. 25% v/v), however, the presence of 2-AI (indicated by a positive reaction with Mandelin and Robadope reagents) was not as easy to discriminate using this method and was only visible when present at high concentrations (circa. 75% v/v). In none of the mixtures was the intense red-brown colour with Mandelin's reagent observed, demonstrating that the utilisation of this presumptive colour test in particular for products containing these two compounds is potentially problematic and cannot be relied upon in these cases. The NMR spectra are illustrated in Fig. SI-4.† Following the failure of the presumptive colour tests to determine the components of “Synthacaine”, Raman Spectroscopy was next explored.
Raman spectroscopic detection of MPA and 2-AI
Raman spectroscopy has been reported to be used in the screening of NPSs,23,24 but is yet to be explored towards Synthacaine and its components. The analysis of MPA, 2-AI and MPA/2-AI simultaneously was consequently performed using Raman Spectroscopy with the obtained spectra depicted in Fig. SI-5† for 2-AI and MPA. In the Raman spectrum of 2-AI it is possible to identify the peaks similar to those seen in the spectra of amphetamine which is expected since 2-AI is an analogue of amphetamine.25,26 Note: due to the phenomenon of fluorescence, the Raman spectrum for MPA failed to produce a satisfactory result. Fig. 1C shows the Raman spectra for the simultaneous detection of MPA/2-AI in different ratios: (a) 50% w/w of MPA + 50% w/w of 2-AI, (b) 75% w/w of MPA + 25% w/w of 2-AI and (c) 25% w/w of MPA + 75% w/w of 2-AI. Again, in light of the fluorescence omitted by the MPA, visible in Fig. 1C, it is not possible to simultaneously detect both MPA/2-AI together using Raman Spectroscopy as is the case for the “Synthacaine” sample. Given the failure of the presumptive colour tests and the Raman Spectroscopy to provide a satisfactory detection approach for “Synthacaine”, the use of an electrochemical protocol was explored.Electrochemical detection of MPA and 2-AI
In order to overcome the limitations identified above with the presumptive (colour) tests and the Raman spectroscopy which demonstrated that analysis of the components of “Synthacaine” cannot be performed, attention was turned in order to explore the use of electrochemical techniques which has been previously applied into the sensing of other NPSs11 but not yet examined for “Synthacaine”.Initially, the direct electrochemical oxidation of MPA and 2-AI (167 μg mL−1) in pH 10.50 carbonate buffer using screen-printed graphite electrodes (SPEs) was explored using cyclic voltammetry (see Fig. SI-6†). The direct electrochemical response was tested towards a range of different pHs (2.00, 7.00 and 10.50) where it was observed that MPA undergoes electrochemical oxidisation with the largest signal at basic pHs (pH 10.50) whereas 2-AI is found to be inactive across the entire pH range. In the case of MPA, an oxidation wave appears at approximately +0.94 V (vs. Ag/AgCl) (Fig. SI-6A†) with no visible reversible wave which is indicative of an electrochemically irreversible process. For the case of 2-AI, there was no cyclic voltammetric response (Fig. SI-6B†) observed. It is clear that the direct electrochemical oxidation of both compounds, as would be needed for sensing the components of the street sample “Synthacaine”, is not viable using a direct electrochemical approach utilising carbon electrodes, and as such, the direct simultaneous detection of analytes is not be possible. To overcome this limitation, an indirect electrochemical methodology was then developed.
In this approach, chemical moieties are employed which first chemically react with the target analytes, in this case MPA and 2-AI, to produce a product which can be electrochemically monitored and provide the indirect electrochemical signal with which to measure the target analytes. Based on previous work for the indirect detection of amine cyclohexylamine27 the following mediator was chosen: N,N′-(1,4-phenylene)dibenzenesulfonamide.
To select the optimum pH for the indirect detection of MPA and 2-AI, the pKa of the target analytes, which were estimated using structure based predictions are 9.9 and 10.4,28 respectively, was taken into account. It is desirable for the amine groups of both analytes to be used as bases (i.e. a pH above the pKa) and not as their conjugative acids as in this form they do not react with the selected mediators.27
Fig. 2A depicts typical linear sweep voltammograms observed using the indirect sensing approach where the product is monitored using SPEs. Through the addition of aliquots of MPA (pH 10.50) at concentrations over the range 0.50–8.92 μg mL−1 (in carbonate buffer), new reduction peaks are clearly evident, as shown in Fig. 2A. The voltammetric peak at −0.01 V (vs. Ag/AgCl) corresponds to the mediator while the peak observed at −0.22 V (vs. Ag/AgCl) relates to the reaction of the mediator with the SPE surface (II).29 The electrochemical reduction of MPA (III) is observed at −0.36 V (vs. Ag/AgCl) with an increase in the current intensity and a small displacement of potential into negative regions following the addition of MPA aliquots. Analysis of the resultant calibration curve constructed using the peak at −0.357 V (vs. Ag/AgCl) (IP/μA = −0.21 [μg mL−1] + 0.13 μA; R2 = 0.995 and n = 3), Fig. 2A inset, revealed a calculated limit of detection (3σ) equal to 0.41 μg mL−1 with relative standard deviation (%RSD) equal to 4.78 (n = 3). Note that in this case and herein, a single SPE was used in each of the reported electrochemical experiments; these experiments were repeated with a new SPE utilised for each concentration addition where identical peak heights were observed with that using the same SPE suggesting either approach is viable.
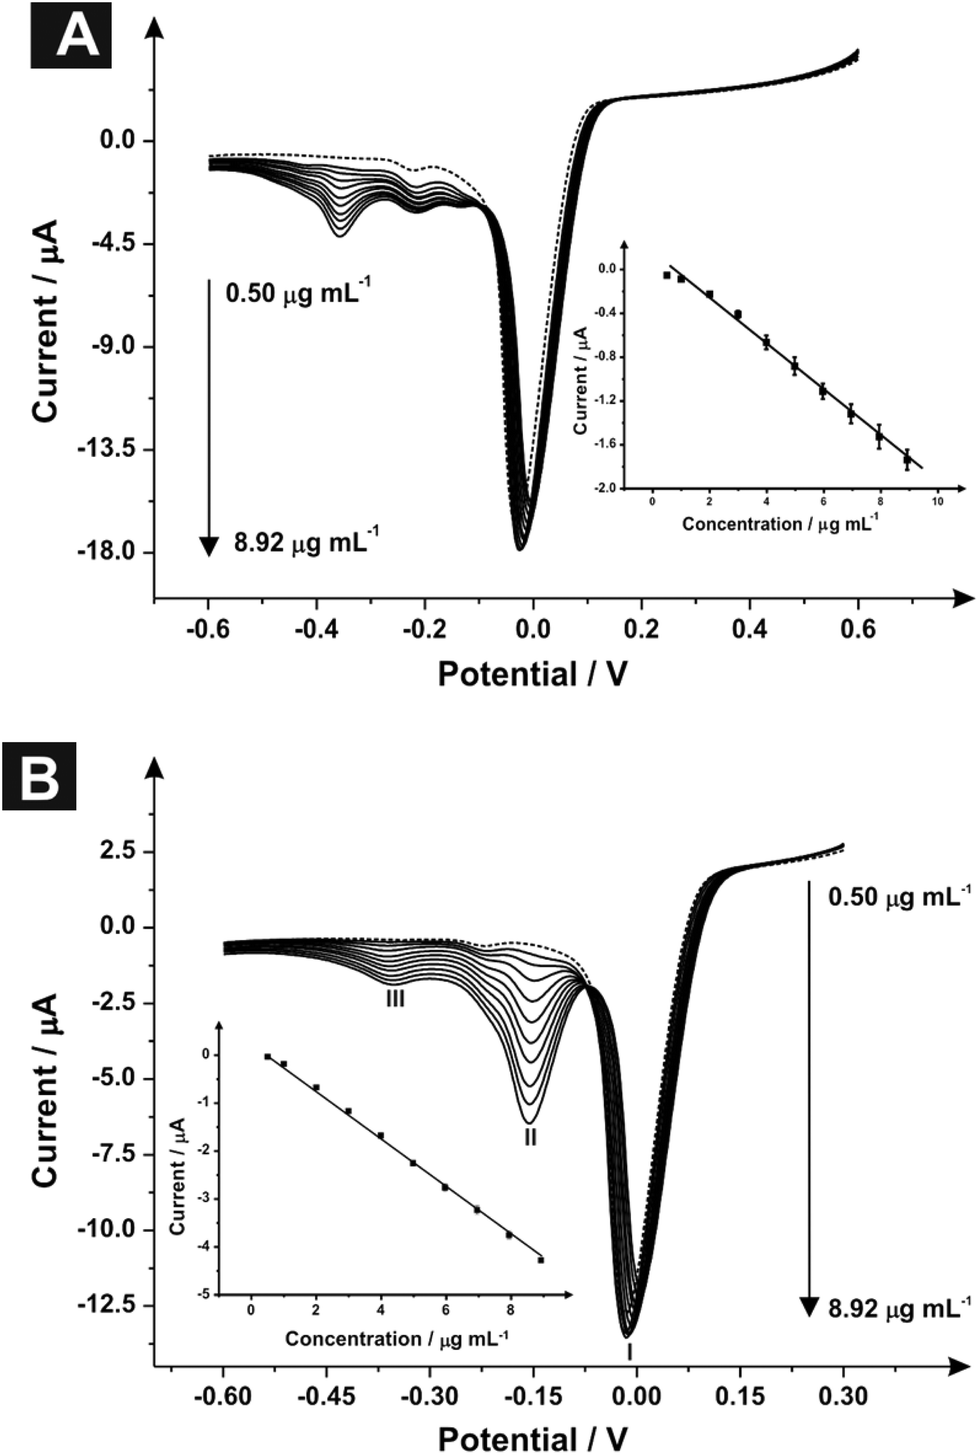 | ||
| Fig. 2 Linear sweep voltammograms of (A) MPA and (B) 2-AI over a range concentrations (0.50–8.92 μg mL−1) using SPE (scan rate: 100 mV s−1vs. Ag/AgCl) and N,N′-(1,4-phenylene)dibenzenesulfonamide, (1 mg mL−1) mediator; the dotted line represents a blank. Inset: The analytical curves corresponding to the anodic peak current for the oxidation of MPA and 2-AI over the concentration range. | ||
Fig. 2B depicts typical linear sweep voltammograms acquired through the addition of 2-AI aliquots using SPEs over the concentration range of 0.50–8.92 μg mL−1 into a carbonate buffer (pH 10.50) solution. The voltammetric measurements, similarly to MPA, showed three reduction peaks: (I) reduction of the mediator at −0.01 V (vs. Ag/AgCl), (II) reduction of 2-AI at −0.16 V (vs. Ag/AgCl) and (III) the reaction of the mediator with the SPE surface in −0.37 V (vs. Ag/AgCl).29 Following additions of 2-AI, an increase in the current intensity of the reduction peak at −0.16 V and a small increase of potential into cathodic regions. Fig. 2B insert shows the obtained linear calibration curve from the linear sweep voltammograms constructed using the peak at −0.16 V (IP/μA = −0.51 [μg mL−1] + 0.32 μA; R2 = 0.999 and N = 3) analysis thereafter revealed a limit of detection (3σ) equal to 0.161 μg mL−1 and a relative standard deviation (%RSD) of 3.98.
Attention was next turned to exploring the proposed indirect electrochemical protocol towards the simultaneous sensing of both MPA/2-AI, both were analyzed via linear sweep voltammetry. Following the same method as before, aliquots of both MPA/2-AI were added to a solution of pH 10.50 carbonate buffer over the range of 1.00–9.90 μg mL−1 with the resultant voltammograms observed in Fig. 3. Analysis again shows three reduction peaks, however this time they are belonging to: (I) the reduction of the mediator at −0.01 V (vs. Ag/AgCl), (II) the reduction of 2-AI at −0.16 V (vs. Ag/AgCl) and (III) the reduction of MPA at −0.36 V (vs. Ag/AgCl). Separate calibration plots for peaks (II) and (III) were constructed (Fig. 3 inset) with each showing two linear responses over the entire concentration range studied. It is important to note that the mediators react to a considerable extent over the timescales of the reaction such that no waiting times are required ensuring that the electrochemical protocol is time efficient.
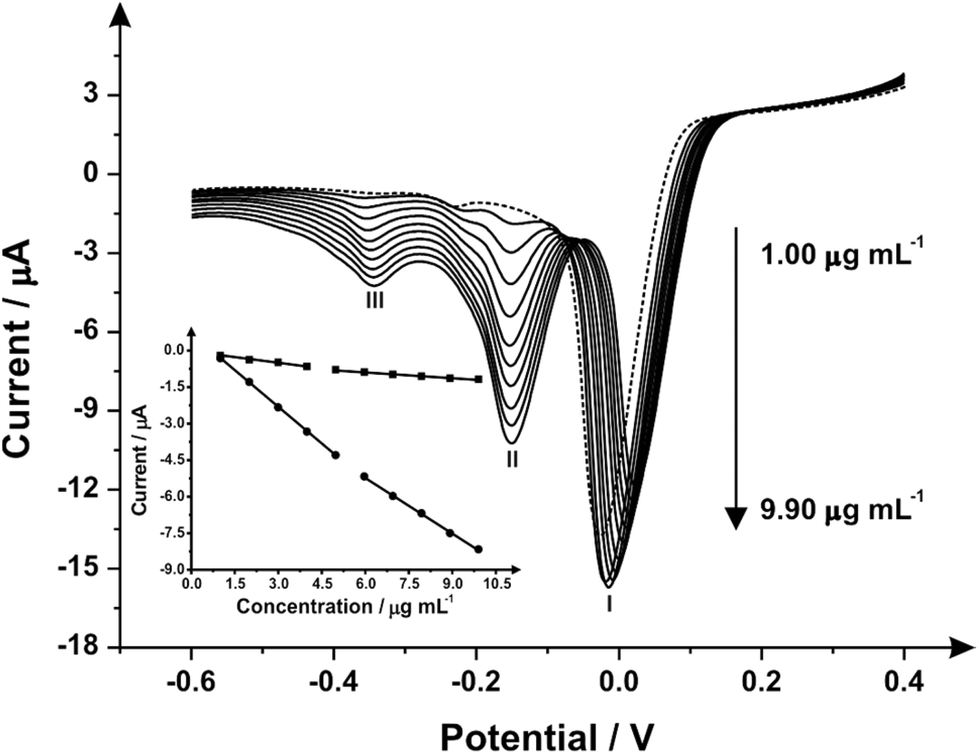 | ||
| Fig. 3 Linear sweep voltammograms recorded over a range of MPA/2-AI (simultaneous detection) concentrations (1.00–9.90 μg mL−1) using a SPE (scan rate: 100 mV s−1vs. Ag/AgCl) and N,N′-(1,4-phenylene)dibenzenesulfonamide, (1 mg mL−1) mediator; the dotted line represents a blank. (Inset) Two analytical curves corresponding to the anodic peak current for the oxidation of MPA and 2-AI over the concentration range. | ||
The limit of detection (3σ) for both analytes were calculated from the resultant calibration plots; for MPA over the first linear region of 1.00–3.98 μg mL−1 (IP/μA = −0.14[μg mL−1] − 0.07 μA; R2 = 0.993 and N = 3) it was calculated to be equal to 0.49 μM with a relative standard deviation (% RSD) of 4.56. The second linear range, 4.98–9.90 μg mL−1, (IP/μA = −0.09[μg mL−1] − 0.37 μA; R2 = 0.997 and N = 3), had a calculated limit of detection (3σ) of 0.631 μg mL−1 with a relative standard deviation (%RSD) of 4.23. For 2-AI the limit of detection (3σ) was calculated to be: over the first linear range, 1.00–4.98 μg mL−1, (IP/μA = −1.01 [μg mL−1] + 0.70 μA; R2 = 0.999 and N = 3) a 0.07 μM and the second, 5.96–9.90 μg mL−1, (IP/μA = −0.76 [μg mL−1] − 0.64 μA; R2 = 0.999 and N = 3) 0.42 μg mL−1 with relative standard deviation (%RSD) equal to 4.12 and 3.86 respectively. Schemes 1 and 2 shows the proposed indirect electrochemical methodology for the sensing of MPA, 2-AI and MPA/2-AI (simultaneous detection). Through this scheme, the origin of the peaks presented in each voltammogram described above for the reduction of: MPA, 2-AI, MPA/2-AI and mediator are explained. It is interesting to consider the limitation of this indirect approach. Currently, “Synthacaine” in the UK is comprised of just only MPA and 2-AI. In our approach, the mediators only react with primary and secondary amines and due to the formed electrochemical products, produce new analytical signals which are well resolved from each other. Currently since “Synthacaine” is a new compound, there are no reports of it being “cut” with other chemicals. For instance, synthetic cathinones contain caffeine.11 Since this is not a primary or secondary amine, caffeine will not be an interferent. However, other compounds, which are primary or secondary amines could cause a problem. For instance, we explored the use of the mediator towards the sensing of methamphetamine and amphetamine and find that new voltammetric signals appear at −0.35 V (vs. SCE; pH 10) and −0.17 V (vs. SCE; pH 10) which will potentially overlap with the electrochemical signal for the mediator with MPA and 2-AI. Note that due to “Synthacaine” being newly introduced (at the time of writing this paper) more information is required to understand its composition but likely will not deviate much. In such instances where the sample mixture is complex, recourse to HPLC with electrochemical detectors would be needed; such work is underway.
 | ||
| Scheme 1 Proposed indirect electrochemical methodology for the sensing of MPA. Step 1: Electrochemical process: Electrochemical oxidation of mediator appears at +0.07 (vs. Ag/AgCl). (1) Chemical step: Reaction of MPA with the sulfonimide (oxidized form of the mediator). (2) Electrochemical step: Reduction of sulfonimide (oxidized form of the mediator) appears at −0.01 V (vs. Ag/AgCl). (3) Electrochemical step (analytical signal): reduction of the MPA with the sulfonimide intermediate appears at −0.36 V (vs. Ag/AgCl). | ||
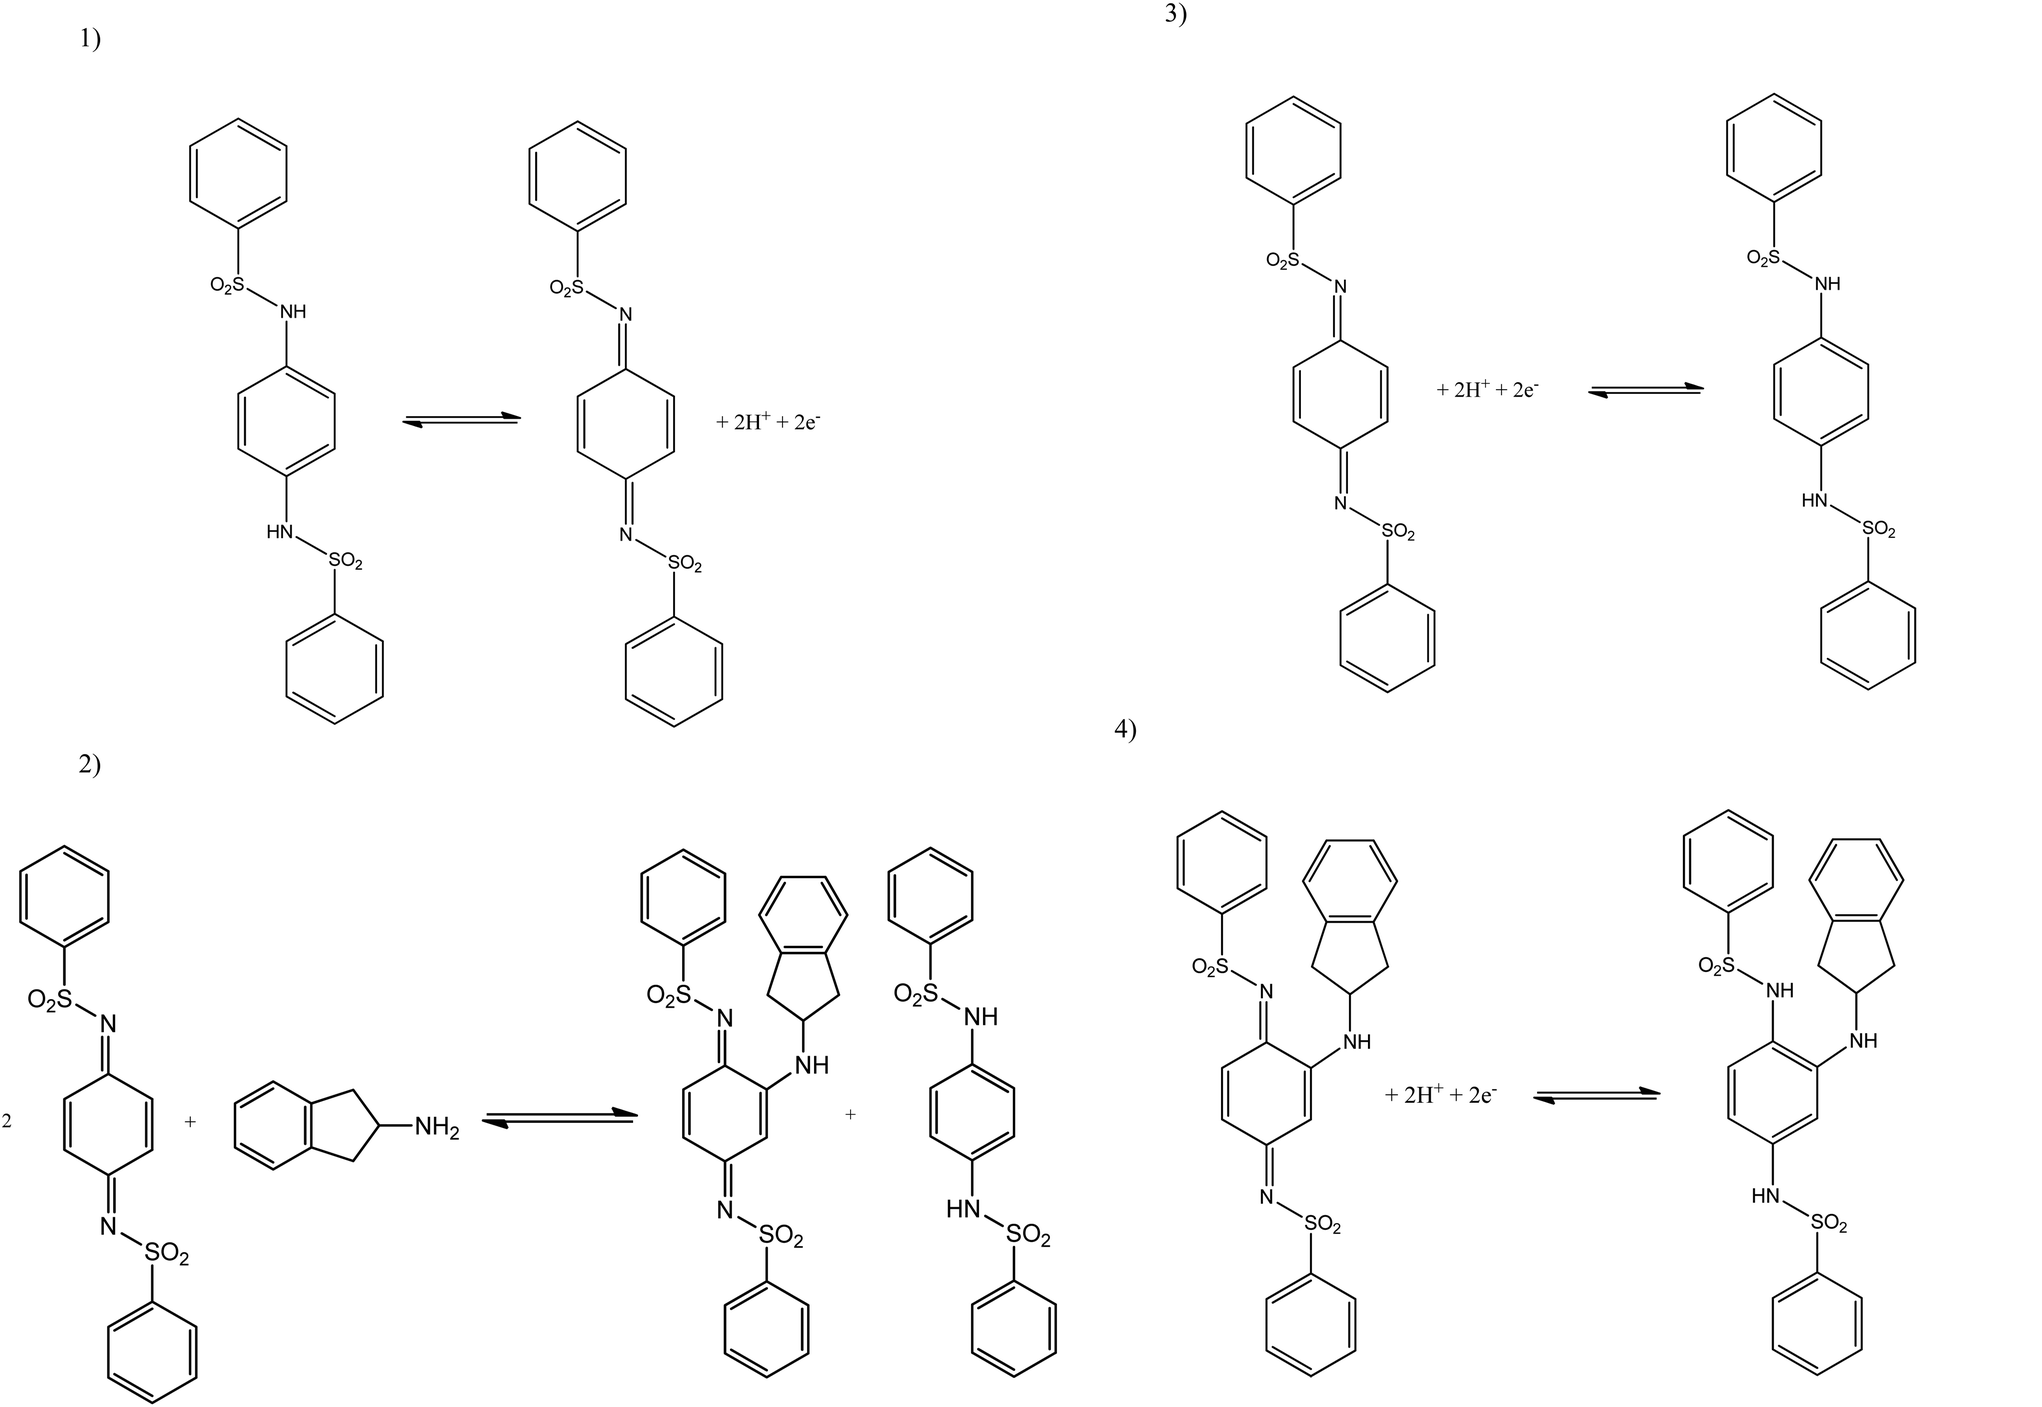 | ||
| Scheme 2 Proposed indirect electrochemical methodology for the sensing of 2-aminoindane. (1) Electrochemical step: Electrochemical oxidation of mediator appears at +0.09 V (vs. Ag/AgCl). (2) Chemical step: reaction of 2-aminoindane with the sulfonimide (oxidized form of the mediator). (3) Electrochemical step: reduction of sulfonimide (oxidized form of the mediator) appears at −0.01 V (vs. Ag/AgCl). (4) Electrochemical step (analytical signal): reduction of the 2-aminoindane with the sulfonimide intermediate appears at −0.16 V (vs. Ag/AgCl). | ||
Electrochemical detection of “Synthacaine” and independent validation
The above indirect electrochemical protocol was next explored towards the sensing of the street sample “Synthacaine”. Fig. 4 shows the indirect electrochemical oxidation of “Synthacaine” (a mixture of MPA and 2-AI) using SPEs. Following analysis through the standard addition protocol, the obtained linear sweep voltammograms over the range of 0.00–19.61 μg mL−1 it is possible to see three reduction peaks: (I) the reduction of the mediator at 0.20 V, (II) the reduction of 2-AI at −0.15 V and (III) the reduction of MPA at −0.34 V. The displacement of the peaks (compared with the previous electrochemical responses) is due to matrix effects of the “Synthacaine” sample. Calibration plots for peaks (II) and (III) were constructed (see Fig. 4 inset) and each showing two linear responses over the entire concentration range. The second linear response was used in both cases for the calculation of the MPA and 2-AI concentrations inside the “Synthacaine” sample. Table 2 lists the parameters obtained of the linear response for MPA and 2-AI. The comparison of the electrochemical and high performance liquid chromatography (HPLC) results are reported in Table 3 which independently validates the proposed indirect electrochemical sensing protocol.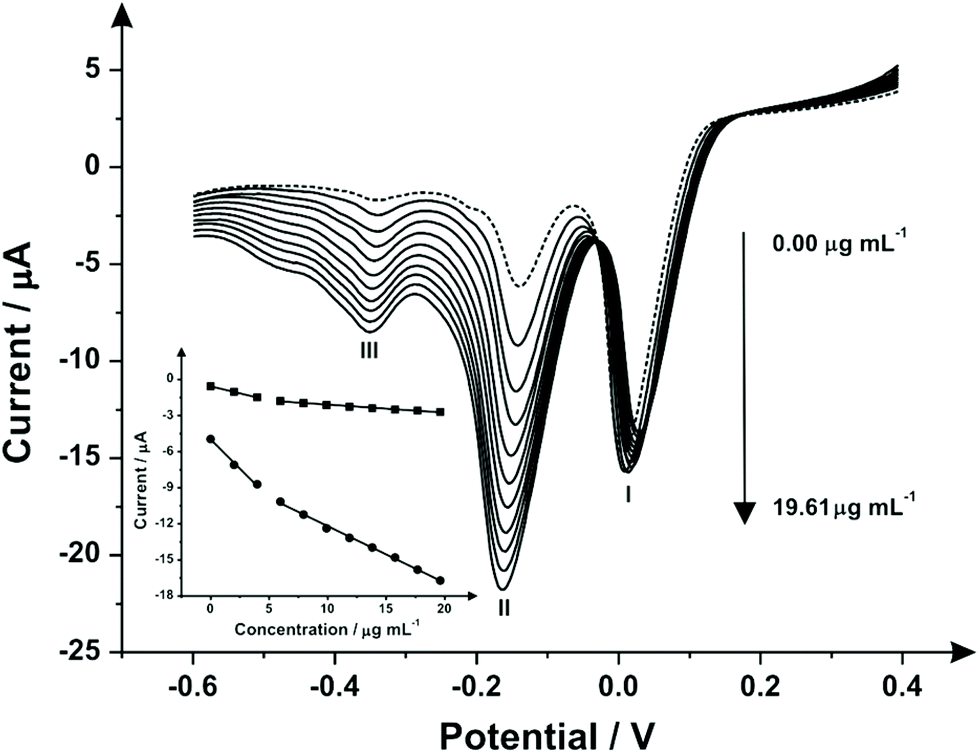 | ||
| Fig. 4 Linear sweep voltammograms following a series of standard additions of “Synthacaine” over the range 0.00–19.61 with N,N-(1,4-phenylene)dibenzenesulfonamide, (1 mg mL−1) mediator. Analysis of peaks II and III yielded calibration plots for 2-AI and MPA respectively. (Scan rate: 100 mV s−1vs. Ag/AgCl). | ||
| “Synthacaine” | MPA | 2-Aminoindane | ||
|---|---|---|---|---|
| I | II | I | II | |
| Linear concentration range (μg mL−1) | 0.00–3.98 | 5.96–19.61 | 0.00–3.98 | 5.96–19.61 |
| Slope of calibration graph (μg mL−1) | −0.23 | −0.07 | −1.07 | −0.47 |
| Intercept (μA) | −0.57 | −1.45 | −4.69 | −7.47 |
| Correlation coefficient | 0.997 | 0.989 | 0.988 | 0.990 |
| Relative standard deviation (%RSD) | 4.83 | 3.81 | 2.85 | 4.12 |
| Synthacaine | ||
|---|---|---|
| Electrochemical % w/w | HPLC % w/w | |
| MPA | 57.90 | 57.20 |
| 2-AI | 41.52 | 42.30 |
| Purity | 99.42 | 99.50 |
Conclusions
This paper has presented for the first time a thorough overview of analytical methodologies for the sensing of newly available psychoactive substance “Synthacaine”. Within the scope of developing a reproducible technique that is cost-effective, rudimentary in function and potentially scaled down to a portable ‘on-site’ sensor; a novel indirect electrochemical approach is postulated. Utilising graphite screen-printed electrochemical sensors in tandem with a N,N′-(1,4-phenylene)dibenzenesulfonamide mediator (1 mg mL−1) the two components of “Synthacaine” (a mixture of MPA and 2-AI) were, for the first time, successfully indirectly quantified when analysed with linear sweep voltammetry. The developed electroanalytical protocol was applied to ‘street’ samples and validated with independently performed High Performance Liquid Chromatography (HPLC) wherein comparable values for the quantification of ‘street’ samples were achieved. The work presented within the manuscript details the potential for the development of an indirect electrochemical sensor, shown to be vastly superior to a direct approach by improving resolution between two similar analytes, which is capable of quantifying ‘street’ samples of “Synthacaine”. With further development the developed protocol has the potential of rapidly detecting a wide array of ‘NPSs and consequently aiding authorities in the fight against “legal highs”’.Acknowledgements
Financial support for this research was supplied by Coordenação de Aperfeiçoamento de Pessoal de Nível Superior (CAPES) – Process no 99999.001285/2014-09 and a British Council Institutional Link grant (no. 172726574).References
- J. Hillebrand, D. Olszewski and R. Sedefov, Subst. Use Misuse, 2010, 45, 330–340 CrossRef PubMed.
- A. Rigon and R. Takahashi, Psychopharmacology, 1996, 127, 323–327 CrossRef CAS.
- P. Kavanagh, D. Angelov, J. O'Brien, J. D. Power, S. D. McDermott, B. Talbot, J. Fox, C. O'Donnell and R. Christie, Drug Test. Anal., 2013, 5, 247–253 CrossRef CAS PubMed.
- D. Lonati, E. Buscaglia, P. Papa, A. Valli, T. Coccini, A. Giampreti, V. M. Petrolini, S. Vecchio, G. Serpelloni and C. A. Locatelli, Ann. Emerg. Med., 2014, 64, 629–632 CrossRef PubMed.
- M. Lanza, W. J. Acton, P. Sulzer, K. Breiev, S. Jürschik, A. Jordan, E. Hartungen, G. Hanel, L. Märk, T. D. Märk and C. A. Mayhew, J. Mass Spectrom., 2015, 50, 427–431 CrossRef CAS PubMed.
- F. F. Blicke and J. H. Burckhalter, J. Am. Chem. Soc., 1942, 64, 477–480 CrossRef CAS.
- J. F. Casale and P. A. Hays, Microgram J., 2011, 8, 53–57 CAS.
- D. Angelov, J. O'Brien and P. Kavanagh, Drug Test. Anal., 2013, 5, 145–149 CrossRef CAS PubMed.
- S. D. Brandt, R. A. Braithwaite, M. Evans-Brown and A. T. Kicman, in Novel Psychoactive Substances, ed. P. I. D. M. Wood, Academic Press, Boston, 2013, DOI:10.1016/B978-0-12-415816-0.00011-0, pp. 261–283.
- J. P. Smith, J. P. Metters, C. Irving, O. B. Sutcliffe and C. E. Banks, Analyst, 2014, 139, 389–400 RSC.
- J. P. Smith, J. P. Metters, O. I. G. Khreit, O. B. Sutcliffe and C. E. Banks, Anal. Chem., 2014, 86, 9985–9992 CrossRef CAS PubMed.
- J. P. Smith, J. P. Metters, D. K. Kampouris, C. Lledo-Fernandez, O. B. Sutcliffe and C. E. Banks, Analyst, 2013, 138, 6185–6191 RSC.
- J. Metters, F. Tan and C. Banks, J. Solid State Electrochem., 2013, 17, 1553–1562 CrossRef CAS PubMed.
- J. P. Metters, R. O. Kadara and C. E. Banks, Analyst, 2011, 136, 1067–1076 RSC.
- J. P. Metters, R. O. Kadara and C. E. Banks, Analyst, 2013, 138, 2516–2521 RSC.
- J. P. Metters, F. Tan, R. O. Kadara and C. E. Banks, Anal. Methods, 2012, 4, 3140–3149 RSC.
- E. P. Randviir, D. A. C. Brownson, J. P. Metters, R. O. Kadara and C. E. Banks, Phys. Chem. Chem. Phys., 2014, 16, 4598–4611 RSC.
- E. P. Randviir, D. K. Kampouris and C. E. Banks, Analyst, 2013, 138, 6565–6572 RSC.
- A. V. Kolliopoulos, J. P. Metters and C. E. Banks, Anal. Methods, 2013, 5, 3490–3496 RSC.
- L. R. Cumba, J. P. Smith, D. A. C. Brownson, J. Iniesta, J. P. Metters, D. R. do Carmo and C. E. Banks, Analyst, 2015, 140, 1543–1550 RSC.
- G. Nagy, I. Szöllősi and K. Szendrei, Colour Tests for Precursor Chemicals of Amphetamine-Type Substances The Use of Colour Tests for Distinguishing between Ephedrine-Derivatives, http://www.unodc.org/pdf/scientific/SCITEC20-fin.pdf, accessed 30/03/2015.
- Y. N. A. Soh and S. Elliott, Drug Test. Anal., 2014, 6, 696–704 CrossRef CAS PubMed.
- S. E. J. Bell, D. Thorburn Burns, A. C. Dennis, L. J. Matchett and J. S. Speers, Analyst, 2000, 125, 1811–1815 RSC.
- S. E. J. Bell, D. T. Burns, A. C. Dennis and J. S. Speers, Analyst, 2000, 125, 541–544 RSC.
- N. Milhazes, P. Martins, E. Uriarte, J. Garrido, R. Calheiros, M. P. M. Marques and F. Borges, Anal. Chim. Acta, 2007, 596, 231–241 CrossRef CAS PubMed.
- L. D. Simmler, A. Rickli, Y. Schramm, M. C. Hoener and M. E. Liechti, Biochem. Pharmacol., 2014, 88, 237–244 CrossRef CAS PubMed.
- A. V. Kolliopoulos, J. P. Metters and C. E. Banks, Environ. Sci: Water Res. Technol., 2015, 1, 40–46 Search PubMed.
- Chemicalize.org, Properties Viewer, http://www.chemicalize.org, accessed April 2015.
- R. Adams and C. R. Walter, J. Am. Chem. Soc., 1951, 73, 1152–1155 CrossRef CAS.
Footnote |
| † Electronic supplementary information (ESI) available. See DOI: 10.1039/c5an00858a |
| This journal is © The Royal Society of Chemistry 2015 |