Transmission versus transflection mode in FTIR analysis of blood plasma: is the electric field standing wave effect the only reason for observed spectral distortions?†
Emilia
Staniszewska-Slezak
ab,
Anna
Rygula
b,
Kamilla
Malek
*ab and
Malgorzata
Baranska
ab
aFaculty of Chemistry, Jagiellonian University, Ingardena 3, 30-060 Krakow, Poland
bJagiellonian Centre for Experimental Therapeutics (JCET), Jagiellonian University Bobrzynskiego 14, 30-348 Krakow, Poland. E-mail: malek@chemia.uj.edu.pl; Fax: +48 12 634 0515; Tel: +48 12 663 2064
First published on 15th December 2014
Abstract
Fourier transform infrared (FTIR) microspectroscopy is assessed in terms of two techniques (i.e., transmission and transflection) as a method for rapid measurements of blood plasma. Apart from the expected effect of the electric field standing wave (EFSW), we also noticed that second-derivative IR spectra recorded in transflection mode exhibited a significant shift in the amide I band (up to 1667 cm−1) in comparison to the one recorded in transmission (1658 cm−1). This has not been reported thus far in studies of the EFSW distortion of IR spectra of biological material. The thinner the sample deposited on the low-e microscope slide, the lower the position of the amide I band found in FTIR spectra, suggesting various plasma compositions after stratification or certain changes in secondary protein conformations due to chemical and/or physical effects. There are potentially several phenomena that can occur at the surface of both IR substrates affecting the protein profile, including changes in optical properties (refractive index), variation in water content in the sample, and segregation of plasma components. All three hypotheses are discussed here, with the help of atomic force microscopy (AFM).
1. Introduction
Analytical applications of FTIR microspectroscopy in studies on tissue sections, cell cultures or other biological materials have been shown in numerous reports.1–5 The choice of biological material for diagnostic purposes is dictated by the presence of a proper marker for a disease; to date plasma and serum are preferable in medical diagnostics due to least invasive way of sample collection from patients. The use of FTIR spectroscopy for such purposes requires a reliable and rapid approach. A careful examination of factors affecting spectral FTIR profiles, standardization of sample preparation and spectral measurements are still necessary.6–10 For instance, Ollesch and co-workers recently reported details on FTIR microspectroscopy of serum and plasma showing advantages of measuring undiluted and dried plasma samples in transmission mode for the diagnosis of urinary bladder cancer.6 Similar results were shown in studies on ovarian cancer using ATR FTIR spectra of plasma and serum.11We use FTIR spectroscopy to analyse the spectral profile of plasma. This provides a rapid method of data collection with the use of a commercially available FTIR microscope, as a few thousand spectra are recorded in a few minutes from a minimal volume of an air-dried sample (0.5–1 μL) to remove water that obscures infrared spectra. To maximize the sensitivity of this approach, the drop coating deposition substrates must be carefully chosen. Inorganic crystals like CaF2 windows and metal microscope slides are commonly used for transmission and transflection FTIR measurements, respectively. We chose both techniques and CaF2 and Ag/SnO2-coated microscope slides, respectively, for our studies on FTIR plasma profiles. It has been demonstrated that the electric field standing wave (EFSW) can lead to significant distortion of transflection FTIR spectra of biological samples such as tissues and cells.12–14 The major issue of EFSW corresponds to non-linear response of absorbance along with the increase of sample thickness, consequently leading to alternation of band ratios. To the best of our knowledge, no other spectral distortions associated with the EFSW effect have been reported to date. The impact of this effect on an analysis of FTIR spectra can be reduced by calculating second-derivative spectra.13 Moreover, Wrobel et al. have shown in simulations of experimental variability that distortion of infrared spectra by the EFSW is almost completely averaged out for inhomogeneous samples of sufficient thickness (ca. 5 μm), while changes in intensity ratios become more significant for samples of less than 2 μm thickness.15
The aim of our work was comparison of IR optical substrates dedicated to biofilm measurements by using both of the most popular techniques—transmission and transflection—and to check whether EFSW is the only reason for observed spectral distortions. For this purpose we performed an examination of topography and spectral features of plasma deposits placed on two common slides, that is, the CaF2 window and the MirrIR (Ag/SnO2) slide. Each of the IR substrates represents different chemical, surface and optical properties, and apart from a potential distortion of spectra features due to the EFSW, questions arise on whether both types of FTIR spectra for the same plasma sample provide similar spectral profiles. Observed spectral differences are discussed along with topography and adhesion measurements using atomic force microscopy (AFM).
2. Experimental
2.1. Sample preparation
All animal experiments were performed in accordance with institutional guidelines and were approved by the Animal Care and Ethics Committee of Jagiellonian University. Blood samples were collected from three healthy C57 BL/6J mice with the use of 10 u. nadroparin per 1 ml of blood as an anti-clotting agent. Blood was centrifuged at 1000g for 10 min, and plasma was immediately separated. Time between blood collection and centrifugation was approximately 10 min. Next 1 μl and 0.5 μl of each sample were manually spotted onto low-e microscope slides (MirrIR, Kevley Technologies®) and CaF2 windows, respectively, and left to dry in a temperature-controlled laboratory (24 °C). Both IR substrates unused before the experiment were cleaned in an autoclave and wiped off with ethanol before deposition of plasma samples. The drying process took approximately 3 min giving deposits with ∼5 mm in diameter on both substrates. The volume of plasma was adjusted to provide FTIR spectra with absorbance below 1.2. To investigate whether there is an effect of water content on the FTIR profile of plasma measured by using the transflection technique, the low-e microscope slide was heated to 45 °C, and then the plasma drop was placed on the slide. According to the manufacturer of the MirrIR slides (Kevley Technologies, Ohio, USA), the slides are stable up to 400 °C, so chemical/physical changes on the surface of the slides should be excluded. For this experiment, we used the plasma of two mice.2.2. FTIR imaging and data processing
A liquid-nitrogen-cooled MCT FPA (mercury cadmium telluride focal plane array) detector comprising 4096 pixels arranged in a 64 × 64 grid format was used to measure FTIR images with an Agilent 670-IR spectrometer and 620-IR microscope operating in rapid scan mode. Transflection and transmission measurements were recorded with a 15× Cassegrain objective collecting 64 scans from a plasma sample deposited on a low-e microscope slide and a CaF2 window, respectively. Background measurements were acquired on blank substrates with 128 scans per pixel. All spectra were collected in the range of 3800–900 cm−1 with a spectral resolution of 8 cm−1. The imaging area measured using this accessory and FPA detector was ∼350 × 350 μm2 with each pixel sampling from an area of 5.5 × 5.5 μm2. Recording 4096 spectra took 3 min. For one of the plasma samples air-dried at room temperature on both slides, the same imaged area was investigated next by using the AFM technique.FTIR spectra embedded in each spectral image were first quality screened and then extracted using CytoSpec v. 1.4.03 software.16 The quality test for sample thickness was performed according to absorbance over the “fingerprint region” (900–1750 cm−1) to remove spectra with maximum absorbance less than 0.4 or greater than 1.2. Then second-derivative spectra were calculated using a Savitzky–Golay algorithm (9 points of smoothing). Cluster maps were constructed by using unsupervised hierarchical cluster analysis (UHCA) in the spectral regions 900–1800 and 2800–3600 cm−1. For UHCA imaging, a Ward's algorithm was used, while spectral distances were computed as D-values. Analysis of cluster maps indicated that five classes represent a general trend of variation observed in transflection FTIR spectra. For comparison, three- and seven-class UHCA analysis is shown in Fig. S1 (see ESI†). The same parameters were employed in UHCA analysis of transmission chemical images. For each cluster map, the mean spectrum was extracted while integral intensities for selected bands were calculated by using OPUS 7.0 software. A straight line was drawn between the peaks of the two defined frequency limits. The area above and below this line was integrated for raw and second-derivative FTIR spectra, respectively.
2.3. Atomic force microscopy (AFM) measurements
AFM measurements were performed with a WITec Alpha 300 system in PFM modes using force modulation probes (k = 2.8 N m−1, WITec). An area of 770 × 20 μm2 was scanned for each sample in both AFM modes, composed of five smaller images. Image resolution was 512 × 64 pixels for an area of 150 × 20 μm2; 20 μm of each small image was overlapped with the next one.The PFM mode is working in intermediate contact mode but with non-resonance frequency, so as a result of measurement, apart from the topography, the mechanical surface properties like adhesion and stiffness are acquired. Note that the software version used here does not have an option for AFM system calibration and recalculation of results to proper units. Therefore, we present the adhesion parameter in relative values (volts), the raw data delivered by the software, which are proportional to adhesion force.
3. Results and discussion
3.1. Topography of plasma deposits
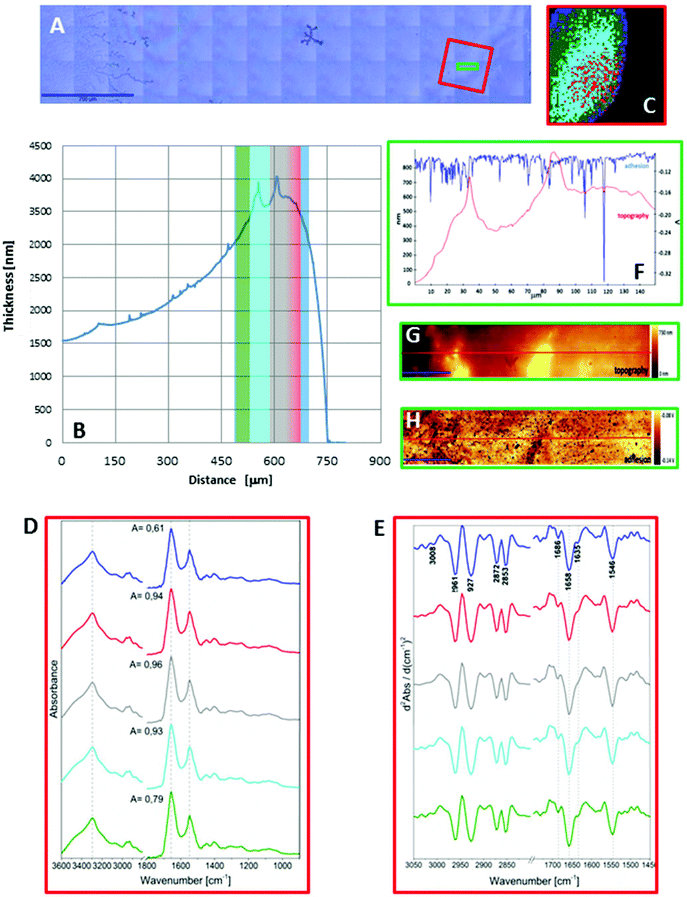
As seen in Fig. 1A and 2A, the dried spots of mice plasma placed on both substrates represent slightly different morphologies. A schematic cross section of both deposits is depicted in Scheme 1. Topography of both samples from their edges within the 770 μm distance were measured using AFM technique, whereas the overall shapes were derived from changes in absorbance of the amide I band in the IR images (Fig. S2, ESI†). A typical “coffee ring” was formed for plasma placed on the CaF2 slide due to pre-concentration of the sample upon evaporation of the material on the surface (see Fig. 1A, Scheme 1). The AFM topography of this sample shows changes in thickness of the deposit from 1.5 to 4.0 μm through the 770 μm distance from the edge of the sample (Fig. 1B). A few reports have shown that such a deposit of biological material results in a flow of solute material from the centre of the drop to its perimeter.6,17–19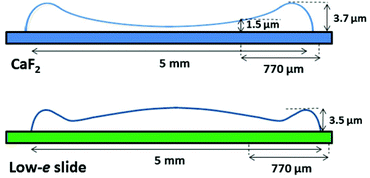 | ||
| Scheme 1 Schematic showing shapes of plasma deposits on CaF2 window (upper) and low-e microscope slide (lower). | ||
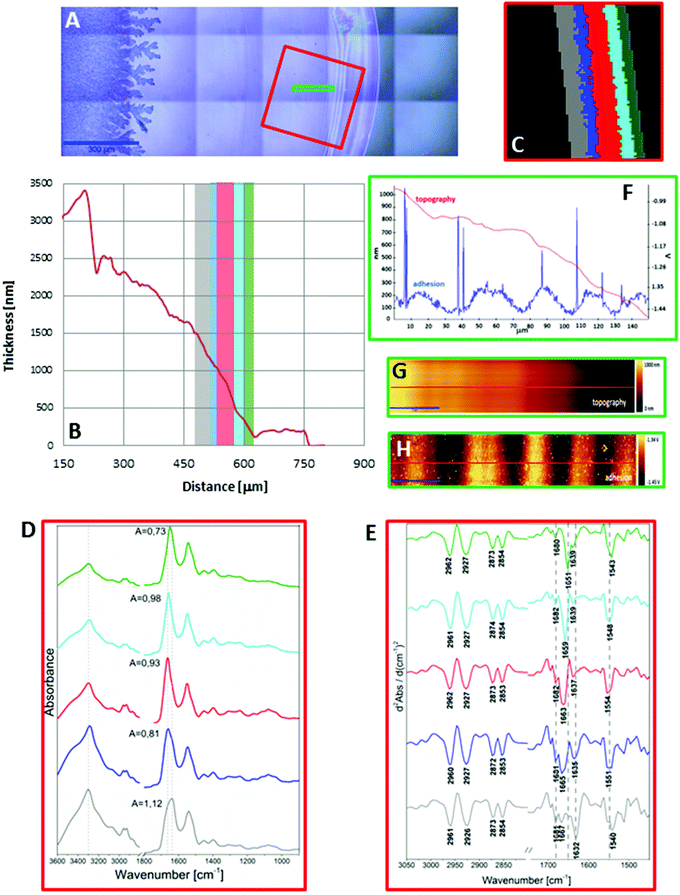
In turn, a slightly different cross section of plasma was found for the sample placed on the low-e microscope slide (Scheme 1, Fig. 2B and S2 in ESI†). Here the deposit became thicker going from the periphery to the centre, then forming a thinner ring and again it became almost as thick as in the periphery of the sample. In addition, the white light images of both samples show the presence of fern-like patterns in the centre of the samples (Fig. 1A and 2A). This is an effect of crystallisation of electrolytes such as NaCl, bicarbonates and urea.17 More patterns are formed in the centre of the plasma drop deposited on the low-e slide than on the CaF2 substrate. The formation of similar fern-like patterns has been observed in deposits of tears and human serum investigated by means of Raman spectroscopy.17,18
3.2. IR features of the plasma deposits
Fig. 1C and 2C depict 5-class cluster maps of plasma (animal 1) constructed with the use of unsupervised hierarchical cluster analysis (UHCA) while Fig. 1D, E and 2D, E show mean FTIR spectra with their second derivatives recorded in the transmission and transflection techniques, respectively.At first glance, mean FTIR spectra of plasma recorded in transmission and reflection geometry are found to be similar, showing the same general spectral profile, including the presence of normal modes for common biological macromolecules (proteins, lipids, etc.); see Fig. 1D and 2D. Total absorbance of IR spectra recorded in the transmission technique changes almost linearly along with the thickness of samples as depicted by absorbance of the amide I band (see Fig. 1B and D) in contrast to transflection IR spectra (see Fig. 2B and D). Next, we compared the intensity ratio for bands of the methyl groups observed at 2962 and 1446 cm−1 [νas(CH3)/δ(CH3)] to identify spectral variation resulting from the EFSW effect (see Table 1). As expected, this ratio negligibly changes in spectra collected in the transmission geometry, whereas it varies from 0.8 to 1.8 for transflection spectra. In the latter, the ratio is constant for the 0.12–0.50 μm thickness of plasma (∼0.8, green and cyan classes; see Fig. 2C and Table 1), and then it considerably rises for the other classes with thickness in the range of 0.5–1.5 μm, indicating a strong EFSW effect. According to Wrobel and co-workers, a strong contribution of the EFSW is expected for samples of thickness below ∼5 μm.15
| Class | Thickness of the plasma deposit [μm] | ν as(CH3)/δ(CH3) ratio | Position of amide I [cm−1] | Amide A/amide II ratio | Amide I/amide II ratio |
|---|---|---|---|---|---|
| a For transmission, the range of values is given only due to good reproducibility of spectra among UHCA classes. | |||||
| Transflection mode | |||||
| Green | 0.12–0.32 | 0.85 | 1651 | 3.86 | 1.85 |
| Cyan | 0.32–0.49 | 0.83 | 1659 | 5.39 | 1.95 |
| Red | 0.49–1.01 | 1.47 | 1663 | 6.09 | 3.27 |
| Blue | 1.01–1.11 | 1.31 | 1665 | 9.56 | 3.60 |
| Grey | 1.11–1.50 | 1.82 | 1667 | 8.78 | 2.78 |
| Average values from all spectra | 0.48 | 1658 | 7.25 | 2.06 | |
| Transmission mode | |||||
| 3.00–3.75 | 0.29–0.32 | 1658 | 6.07–6.19 | 2.07–2.15 | |
Apart from this effect, we also noticed that second-derivative IR spectra recorded in the transflection mode exhibit a significant shift of amide I and II bands in comparison to the ones recorded in transmission. This has not yet been reported in studies on EFSW distortion of IR spectra for biological material.12–15 The observed spectral differences in the amide I/II region are depicted in Fig. 2E and summarized in Table 1. All transmission IR spectra of the same plasma sample show the presence of both amide bands at 1658 and 1547 cm−1 (see Fig. 1E and Table 1). The same observation was found in FTIR spectra of plasma for two other animals indicating that the spectral profile does not change between individuals (see Fig. S3 and S4, ESI†). For the transflection geometry, the position of the amide I band shifts from 1667 cm−1 in the thickest class (the grey cluster) to 1651 cm−1 in the thinnest investigated fragment (the green cluster (Fig. 2B and E); in comparison to the transmission measurement (1658 cm−1), it is shifted down to 7 cm−1 and up to 9 cm−1. The graph in Fig. 3A illustrates that the relationship between the position of the amide I band and the sample thickness is proportional in transflection measurements. This means that the thinner the sample deposited on the low-e microscope slide, the lower the position of the amide I band found in the FTIR spectra. This observation suggests changes in composition of plasma after stratification or segregation of plasma proteins in contact with the low-e microscope slide or physical effects. Several phenomena can occur at the surface of both IR substrates affecting the spectral profile; we considered three of them: changes in optical properties/reflective index, variation in content of water, and segregation of proteins/biomolecules due to flow on the IR substrate. All three hypotheses are discussed below.
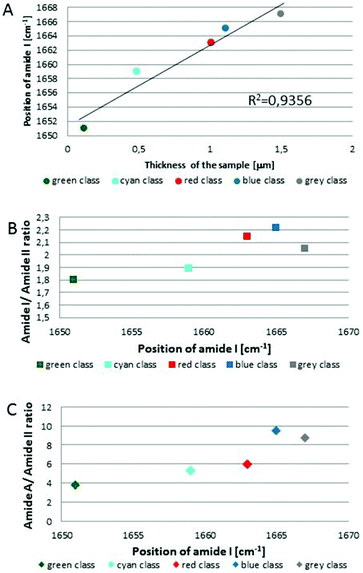 | ||
| Fig. 3 Variation in position of amide I band as function of sample thickness with fitting to linear function for each class of UHCA analysis in transflection FTIR spectra (A), variation in the amide I/amide II band ratio (B), and amide A/amide II band ratio (C) as function of amide I band position. Colours on graphs correspond to colours of UHCA classes in Fig. 2C. | ||
Fig. S5 (in ESI†) displays all raw spectra extracted from the thinnest and thickest classes of UHCA for both geometries. This comparison clearly shows that all spectra are not distorted in a manner illustrated in Romeo and Diem.20 None of them exhibited a scattering background. Transmission spectra are virtually identical with changes in total absorbance (Fig. S5A and B†) as discussed above, while transflection spectra mainly differ in relative intensity between the fingerprint and wavenumber regions indicating the presence of EFSW (Fig. S5C and D†).
The other explanation of the observed shift of the amide bands can rely on differences in refractive indices of both IR windows. Wehbe et al. also observed differences in the amide I position in average FTIR spectra collected from cells grown on crystal inorganic salts.14 The maximum of the amide I band was shifted from 1656.0 to 1654.5 cm−1 on ZnS and CaF2, respectively. This was explained by the occurrence of optical artefacts associated with a lower refractive index of CaF2 (1.4) in comparison to ZnS (2.25). We observed the 1658 cm−1 band recorded on the CaF2 substrate and the bands in range of 1651–1667 cm−1 for plasma on the MirrIR slide, while the refractive indexes of the CaF2 and MirrIR slides are 1.414 and 2.0,24 respectively.14,24 In addition, when we compare mean transmission and transflection spectra from entire IR images, such as in the work of Wehbe et al.,14 both amide I bands were observed at the same position and band ratios of the average transflection spectrum were very similar to those calculated for the average transmission spectrum (see Table 1).
The contribution of other effects such as Mie scattering or Fresnel reflection on the observed distortion of transflection FTIR spectra can also be considered. However, the contribution of Mie scattering would suggest that the plasma deposit on the low-e microscope slide consisted of particles of a size similar to the wavelength that scatter the infrared light. This effect is rather exclusive; hence FTIR spectra of both deposits should exhibit similar distortions. In turn, Mitlin and Leung have reported changes in intensity, shape and position of the OH stretching mode of ice films deposited on a metal surface in FTIR reflection–absorption spectra as a function of film thickness.25 They have noted that the OH dangling bonds located on the external surface of the film and formation of different ice phases upon increasing film thickness strongly affect reflection coefficients for parallel- and perpendicular-polarized IR light. However, such spectra changes could also be attributed to differences in the water network structures.25 These suggest that a complex optical phenomenon or/and artefacts must be considered to fully understand the observed variation in the amide I/II positions within an area of ∼350 × 350 μm2. If this is the case, it is also worth mentioning here that no other bands are shifted and the amide bands show the highest intensity in IR spectrum, suggesting that artefacts in the transflection spectra of plasma may result instead from a potential optical distortion of high-intensity bands than from changes in the protein structure.
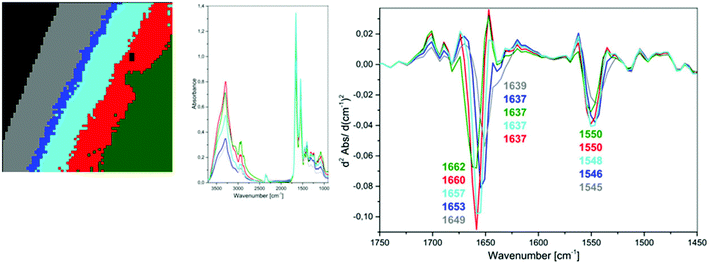 | ||
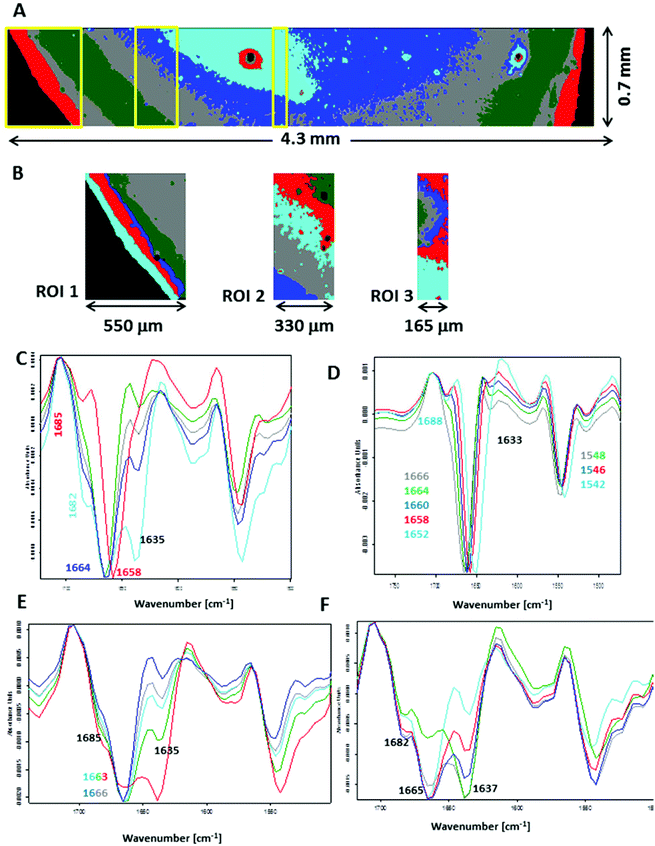
| Fig. 4 UHCA analysis for plasma deposited on low-e slide heated to 45 °C; 5-class cluster map along with mean spectra and second derivatives corresponding to each class. | ||
Therefore, we concluded that this band of high intensity in the grey class in Fig. 2 should be assigned to the bending vibrations of water molecules rather than to an amide I band of β-pleated structure of proteins. This observation also indicates that the spectral variation in the amide region of the transflection IR spectra is not associated with plasma drying rate but rather water content.
To closely examine this issue, we recorded FTIR images across the plasma deposit placed on both substrates. Fig. S7 (see ESI†) shows UHCA analysis for the transmission geometry. Mean second-derivative FTIR spectra are similar to those displayed in Fig. 1E, confirming that the amide I/II spectral region recorded using this technique is “homogenous” across the whole deposit. In general, a slight change in the intensity of a shoulder at ∼1635 cm−1 indicated variation of content of water, and in particular in the centre of the sample where fern-like patterns were present. Fig. 5 illustrates a detailed UHCA analysis and second-derivative spectra of the plasma deposit placed on the low-e microscope slide. A cluster map for the entire deposit clearly showed that the FTIR profile of plasma deposited on this IR substrate exhibited a stripe-like pattern (see Fig. 5A). Its mean FTIR spectra indicated that spectra from the edge of the deposit represented the IR features typical for the transmission FTIR spectra (red trace in Fig. 5C), whereas spectra from the other classes exhibited the presence of the amide I band at 1664 cm−1 along with increasing intensity of two shoulders at 1685 and 1635 cm−1 going from the edge to the centre of the sample. Since we assigned the 1635 cm−1 to water, and the two other bands (1664 and 1685 cm−1) were clearly associated with the amide I vibrations, it was expected that increasing water content in the sample changed an H-bonding 3D-network resulting in modifications of protein structure. A contribution of other plasma components like electrolytes was also expected. We selected some smaller regions of interest to show changes in FTIR profile in detail (see Fig. 5B). Second-derivative spectra in the amide I/II region from ROI 1 showed variation in the position of both amide bands as previously discussed, but without a water contribution (Fig. 5D), whereas FTIR spectra from ROI 2 and 3 exhibit spectral features typical for high water content. We roughly estimated that the most pronounced changes in wavenumbers of the amide bands appeared within ∼500 μm from the edge of the deposit.
4. Conclusions
Comparing results for the plasma measured by using two infrared imaging modes, transmission and transflection, one can see significant differences among them. Spectra collected in transmission mode show the same positions of the amide bands and the ratio of their intensities regardless of the thickness of the measured sample. Measurements of plasma in transflection mode were disturbed and strongly depended on thickness of the biofilm sample. Some spectral disturbances could be explained by the expected electric field standing wave effect, but the shift of amide I (1651–1667 cm−1) band in comparison to the one recorded in transmission (1658 cm−1) has not been reported until now. It is clear that IR light passes through the sample in a different manner in both techniques and this can be a primary reason for observed variations in spectral features. However, if we compare transflection FTIR of plasma with 1.5 μm thickness with transmission ones for the sample with ∼3.0 μm thickness, we still observe a 9 cm−1 difference in the wavenumber of the amide I bands; see the grey and green classes in Fig. 1 and 2, respectively. Our discussion showed that two effects can contribute to the observation, namely variation in content of water and optical artefacts. However, in the case of the latter we excluded typical light dispersion and Mie scattering observed previously in chemical images of tissues. Water molecules strongly change FTIR features of plasma proteins in the centre of the deposit placed on the MirrIR slide contrary to the CaF2 window, whereas optical phenomena are very likely responsible for changes observed at the edge of the deposit. In addition, the discussed differences in surface features of both plasma deposits and variation in the water content in plasma placed on the MirrIR slide may indicate modulation of reflected and refracted infrared light such as in the Fresnel phenomenon that leads to observed spectral differences between transflection and transmission geometry.To summarize, it seems that the EFSW effect reported thus far is not the only reason for spectral distortions observed in the transflection-mode measurements and in particular for a liquid biomaterial, suggesting the need for further investigations on the use of this FTIR technique. Studies that must be undertaken include the extent to which transflection geometry can be employed for measurements of chemically heterogeneous fluids, especially in the context of other similar studies showing that relatively flat and properly thick tissue cross sections can still be examined by means of this FTIR mode for diagnostic purposes when chemical changes due to pathology are pronounced.
Acknowledgements
This work was supported by the National Center of Science (DEC-2013/08/A/ST4/00308) and the European Union from resources of European Regional Development Fund under Innovative Economy Programme (grant coordinated by JCET-UJ, No POIG.01.01.02-00-069/09).References
- Vibrational Spectroscopy for Medical Diagnosis, ed. M. Diem, P. R. Griffiths and J. M. Chalmers, Wiley, Chichester, UK, 2008 Search PubMed.
- K. Malek, B. R. Wood and K. R. Bambery, in Optical Spectroscopy and Computational Methods in Biology and Medicine, ed. M. Baranska, Springer, 2014, pp. 419–474 Search PubMed.
- T. P. Wrobel, K. Malek, S. Chlopicki, L. Mateuszuk and M. Baranska, Analyst, 2011, 136, 5247 RSC.
- T. P. Wrobel, K. M. Marzec, K. Majzner, K. Kochan, M. Bartus, S. Chlopicki and M. Baranska, Analyst, 2012, 137, 4135 RSC.
- K. Majzner, T. P. Wrobel, A. Fedorowicz, S. Chlopicki and M. Baranska, Analyst, 2013, 138, 7400 RSC.
- J. Ollesch, S. L. Drees, H. M. Heise, T. Behrens, T. Brüning and K. Gerwert, Analyst, 2013, 138, 4092 RSC.
- E. Staniszewska, A. K. Bartosz, K. Malek and M. Baranska, Biomedical Spectroscopy and Imaging, 2013, 2, 317 CAS.
- D. Perez-Guaita, J. Ventura-Gayete, C. Perez-Rambla, M. Sancho-Andreu, S. Garrigues and M. de la Guardia, Microchem. J., 2013, 106, 202 CrossRef CAS PubMed.
- T. Vahlsing, U. Damm, V. R. Kondepati, S. Leonhardt, M. D. Brendel, B. R. Wood and H. M. Heise, J. Biophotonics, 2010, 3, 567 CrossRef CAS PubMed.
- J. Ollesch, M. Heinze, H. M. Heise, T. Behrens, T. Brüning and K. Gerwert, J. Biophotonics, 2014, 7, 210 CrossRef CAS PubMed.
- K. Gajjar, J. Trevisan, G. Owens, P. J. Keating, N. J. Wood, H. F. Stringfellow, P. L. Martin-Hirsch and F. L. Martin, Analyst, 2013, 138, 3917 RSC.
- J. Filik, M. D. Frogley, J. K. Pijanka, K. Wehbe and G. Cinque, Analyst, 2012, 137, 853 RSC.
- P. Bassan, J. Lee, A. Sachdeva, J. Pissardini, K. M. Dorling, J. S. Fletcher, A. Henderson and P. Gardner, Analyst, 2013, 138, 144 RSC.
- K. Wehbe, J. Filik, M. D. Frogley and G. Cinque, Anal. Bioanal. Chem., 2013, 405, 1311 CrossRef CAS PubMed.
- T. P. Wrobel, B. Wajnchold, H. J. Byrne and M. Baranska, Vib. Spectrosc., 2014, 71, 115 CrossRef CAS PubMed.
- P. Lasch, http://www.cytospec.com.
- J. Filik and N. Stone, Anal. Chim. Acta., 2008, 616, 177 CrossRef CAS PubMed.
- F. Bonnier;, F. Petitjean, M. J. Baker and H. J. Byrne, J. Biophotonics, 2014, 7, 167 CrossRef PubMed.
- C. Ortiz, D. Zhang, Y. Xie, A. E. Ribbe and D. Ben-Amotz, Anal. Biochem., 2006, 353, 157 CrossRef CAS PubMed.
- M. Romeo and M. Diem, Vib. Spectrosc., 2005, 38, 129 CrossRef PubMed.
- S. Kidoaki and T. Matsuda, Langmuir, 1999, 15, 7639 CrossRef CAS.
- V. Kopecký Jr. and V. Baumruk, Vib. Spectrosc., 2006, 42, 184 CrossRef PubMed.
- C. Hughes, M. Brown, G. Clemens, A. Henderson, G. Monjardez, N. W. Clarke and P. Gardner, J. Biophotonics, 2014, 7, 180 CrossRef CAS PubMed.
- P. Bassan, A. Sachdeva, J. Lee and P. Gardner, Analyst, 2013, 138, 4139 RSC.
- S. Mitlin and K. T. Leung, J. Phys. Chem. B, 2002, 106, 6234 CrossRef CAS.
Footnote |
| † Electronic supplementary information (ESI) available: Fig. S1, 3- and 7-class UHCA analysis of FTIR images for the transflection mode. Second-derivative spectra represent mean spectra of each class. Colors of spectra correspond to the colors in cluster maps. Fig. S2. Chemical images for amide I band constructed on raw FTIR spectra from deposits of plasma placed on CaF2 window (A) and low-e microscope slide (B). Fig. S3. UHCA analysis for plasma of two other animals (transmission mode): (A) 5-class cluster map along with mean FTIR spectra and second derivatives corresponding to each class (animal 2); (B) 5-class cluster map along with mean FTIR spectra and second derivatives corresponding to each class (animal 3). Fig. S4. UHCA analysis for plasma of two other animals (transflection mode): (A) 5-class cluster map along with mean FTIR spectra and second derivatives corresponding to each class (animal 2); (B) 5-class cluster map along with mean FTIR spectra and second derivatives corresponding to each class (animal 3). Fig. S5, raw FTIR spectra extracted from UHCA analysis for (A) transmission geometry (blue and magenta classes in Fig. 1C) and (B) transflection geometry (green and grey classes in Fig. 2C). Fig. S6, 5-class UHCA analysis of plasma after 1 h (A) and 1 month (B) storing a sample on a low-e microscope slide in a desiccator. Fig. S7, 5-class UHCA analysis of whole plasma deposit for FTIR image collected in ransmission mode; second derivative spectra represent mean spectra of each class; colors of spectra correspond to colors in cluster maps. See DOI: 10.1039/c4an01842g |
| This journal is © The Royal Society of Chemistry 2015 |

