 Open Access Article
Tetragonal tungsten bronze-type nanorod photocatalysts with tunnel structures: Ta substitution for Nb and overall water splitting
Ping
Wang
a,
Larissa
Schwertmann
a,
Roland
Marschall
ab and
Michael
Wark
*ac
aLaboratory of Industrial Chemistry, Faculty of Chemistry and Biochemistry, Ruhr-University Bochum, Universitaetsstrasse 150, 44801 Bochum, Germany
bInstitute of Physical Chemistry, Justus-Liebig-University Giessen, Heinrich-Buff-Ring 58, 35392 Giessen, Germany
cInstitute for Chemistry, Technical Chemistry, Carl von Ossietzky University Oldenburg, Carl-von-Ossietzky-Str. 9-11, 26129 Oldenburg, Germany. E-mail: michael.wark@uni-oldenburg.de; Fax: +49 441 798 3330; Tel: +49 441 798 3675
First published on 24th April 2014
Abstract
Tetragonal tungsten bronze-type tantalum (Ta) substituted Sr2KNb5O15 nanorod photocatalysts with tunnel structures were prepared by a facile and low-cost molten salt method using potassium chloride (KCl) at 850 °C for only 2 h. Although all native photocatalysts did not possess any detectable activity in pure water splitting, after deposition of NiOx (double-layered Ni/NiO) as co-catalysts, samples of Sr2KNb5O15 and Sr2KTa5O15 can split pure water into H2 and O2 in a stoichiometric amount (≈2![[thin space (1/6-em)]](https://www.rsc.org/images/entities/char_2009.gif) :
:![[thin space (1/6-em)]](https://www.rsc.org/images/entities/char_2009.gif) 1), which can be ascribed to the improved charge carrier separation and transfer in the presence of NiOx. Furthermore, Ta substitution effects on the photocatalytic behaviour were systematically investigated for hydrogen production by aqueous methanol reforming. The average H2 formation rates of Sr2KNb5−xTaxO15 first decrease with tantalum substitution for x < 2.5, presumably due to a decreased amount of absorbed photons and an obvious reduction of their exposed surface areas, whereas the activity is significantly improved for samples containing more Ta (x > 2.5) and especially the fully substituted Sr2KTa5O15. This can be explained by a stronger driving force for photogenerated conduction band electrons to reduce water.
1), which can be ascribed to the improved charge carrier separation and transfer in the presence of NiOx. Furthermore, Ta substitution effects on the photocatalytic behaviour were systematically investigated for hydrogen production by aqueous methanol reforming. The average H2 formation rates of Sr2KNb5−xTaxO15 first decrease with tantalum substitution for x < 2.5, presumably due to a decreased amount of absorbed photons and an obvious reduction of their exposed surface areas, whereas the activity is significantly improved for samples containing more Ta (x > 2.5) and especially the fully substituted Sr2KTa5O15. This can be explained by a stronger driving force for photogenerated conduction band electrons to reduce water.
Introduction
Photocatalytic water splitting and hydrogen production by semiconductor photocatalysis for converting solar energy into chemical energy has drawn ever-growing interest in both science and engineering fields.1,2 During the past few years, several types of semiconductor photocatalysts such as bulk-type simple oxides (TiO2, Nb2O5, Ta2O5, ZnO and ZrO2, etc.) as well as perovskite-type oxides (SrTiO3, K4Nb6O17, NaTaO3, and A2La2Ti3O10 (A = Na, K and Rb), etc.) have been widely studied.3–6 It is well known that the superior photocatalytic ability of layered oxides can be attributed to the unique structure, compared to the above-mentioned bulk-type oxides.7The past two decades have also witnessed great efforts on the synthesis of tunnel-structured oxides, such as BaTi4O9 and A2Ti6O13 (A = Na, K, Rb), etc.8,9 The deficient perovskite tetragonal tungsten bronze-type (TTB) niobates (A1)4(A2)2(A3)4Nb10O30, consisting of corner-sharing NbO6 octahedra arrays and three different tunnels (A1, A2 and A3) for cation filling, have been widely investigated as ferroelectric and piezoelectric materials in view of their large spontaneous polarization and high dielectric constants.10–14 They also exhibit dominant electron–hole separation and transport via static electric fields between structure-induced dipole moments in distorted metal–oxygen polyhedra. Therefore, a slight structural modification by altering the cation-site occupancy has a dramatic effect on the charge mobility. However, to our knowledge except the paper by Wu, et al.,15 there have been no reports on photocatalytic properties of the modified tunnel-structure bronze-type niobates.
In principle on all the three cation positions A1, A2 and A3 a cation exchange can be done, but since recent studies in niobate/tantalate systems have shown that the substitution of the Nb site with tantalum (Ta) could considerably improve the photocatalytic activity,16–18 we concentrated on this substitution. However, most reports of substitution effects are focused on the photodegradation of organic compounds. It still remains a great challenge to directly split water into H2 and O2 and to determine the variation of the Ta substitution induced-structure properties and photocatalytic behaviour. In the present work, by employment of a simple and cost-effective molten salt technique, the Sr2KNb5−xTaxO15 nanorod photocatalysts with different Nb/Ta substitution ratios were synthesized. The Ta substitution effect on the photocatalytic behaviour for photocatalytic hydrogen production from methanol reforming was systematically investigated.
Experimental
Photocatalysts preparation
Powders of Sr2KNb5−xTaxO15 with x = 0, 1, 2.5, 4 and 5 were prepared by molten salt method.19 SrCO3 (≥99.99%, Aldrich), K2CO3 (>99.9%, Alfa Aesar), Nb2O5 (99.99%, Alfa Aesar), and Ta2O5 (99.85%, Alfa Aesar) were used as starting materials. The desired stoichiometric molar ratios of the starting materials were ground together with potassium chloride (KCl: 99.5%, Honeywell Riedel-de Haën) at a weight ratio of 1![[thin space (1/6-em)]](https://www.rsc.org/images/entities/char_2009.gif) :
:![[thin space (1/6-em)]](https://www.rsc.org/images/entities/char_2009.gif) 2. The well-mixed powders were heated at different calcination temperatures for 2 h in air using a corundum crucible. After cooling down to room temperature, the mixture was intensively washed with distilled water in order to remove any residual salts and then dried in air at 80 °C. The 1.0 wt% NiOx loaded samples were prepared by impregnation method:20,21 the respective powders were dispersed in a suitable amount of Ni(NO3)2 (99.9985%, STREM Chemicals) solution and heated under constant stirring until the water was completely evaporated. The resulting powder was dried at 80 °C in air, followed by calcination at 200 °C for 2 h, and further treated by reduction under H2 flow at 300 °C for 2 h and re-oxidation under O2 flow at 200 °C for 1 h.
2. The well-mixed powders were heated at different calcination temperatures for 2 h in air using a corundum crucible. After cooling down to room temperature, the mixture was intensively washed with distilled water in order to remove any residual salts and then dried in air at 80 °C. The 1.0 wt% NiOx loaded samples were prepared by impregnation method:20,21 the respective powders were dispersed in a suitable amount of Ni(NO3)2 (99.9985%, STREM Chemicals) solution and heated under constant stirring until the water was completely evaporated. The resulting powder was dried at 80 °C in air, followed by calcination at 200 °C for 2 h, and further treated by reduction under H2 flow at 300 °C for 2 h and re-oxidation under O2 flow at 200 °C for 1 h.
Characterization
The X-ray diffraction (XRD) patterns of all samples were recorded with a PANalytical MPD diffractometer using Cu-Kα radiation (λ = 0.1541 nm), and the data were collected from 10° to 60° (2θ). Static N2 physisorption measurements were carried out at −196 °C using an Autosorb-1MP Quantachrome system and samples were degassed at 200 °C for 6 h before the measurements. The UV-Vis diffuse reflectance spectra were measured using MgO as a reference on a UV/Vis Varian Cary 4000 spectrophotometer. Band gap energies were calculated by analysis of the Tauc-plots resulting from Kubelka–Munk transformation of diffuse reflectance spectra. Powder samples were sputter-coated with a thin layer of Au particles and then examined in scanning electron microscopes (SEM) using a LEO (Zeiss) 1530 Gemini field-emission. The transmission electron microscope (TEM) images were recorded by a Philips/FEI Tecnai F20 S-TWIN TEM instrument operating at 200 kV.Photocatalytic activity for H2 production
Photocatalytic reactions were performed in a typical double-walled inner irradiation-type quartz reactor connected to a closed gas evolution system.19,22 The reaction temperature was maintained at 10 °C to prevent any thermal catalytic effect with a double-walled quartz jacket filled with a flow of cooling water from a thermostat (LAUDA). A 500 W Hg mid-pressure immersion lamp (Peschl UV-Consulting) was used as a light source. High-purity Argon (6.0) was used as carrier gas for the reaction products, of which continuous gas flow was set to 50 NmL min−1 controlled by a Bronkhorst mass flow controller. The evolved gases were analyzed online using a multi-channel analyzer (Emerson) equipped with a detector for the determination of the concentration of hydrogen (thermal conductivity detector), oxygen (paramagnetism) and carbon dioxide (IR). In a typical run, 0.1 g of photocatalyst powder was suspended in 500 mL distilled water. In case of photocatalytic methanol reforming, an additional 50 mL of methanol was added. Prior to irradiation, the whole system including the photocatalysts was purged with argon to remove air completely.Results and discussion
Synthesis of materials optical and physical properties
In order to determine the optimum calcination temperature, Sr2KTa5O15 was prepared under different calcination temperatures from 850 to 1050 °C (higher than the melting point of KCl, 774 °C) and the photocatalytic activity of these samples was probed by photocatalytic methanol reforming for H2 production. As shown in Fig. 1, the diffraction peaks of the Sr2KTa5O15 (JCPDS 40-0345) become sharper and stronger with increasing temperature, indicating the increase of the average crystallite size and the improvement of the crystallinity of Sr2KTa5O15 crystals. As shown in Table 1, the sample calcined at 850 °C shows a BET surface area of 8.5 m2 g−1, and an increase in calcination temperature resulted in the significantly decreased surface areas of 5.3 and 2.7 m2 g−1 for samples calcined at 950 °C and 1050 °C, respectively. Presumably enhanced particle growth results in a loss of active surface sites with increasing temperature, leading to an increasingly detrimental effect on the photoactivity for H2 production. Therefore, we chose for the preparation of the samples with different Nb/Ta ratios Sr2KNb5−xTaxO15 (x = 0, 1, 2.5, 4 and 5) a temperature of 850 °C.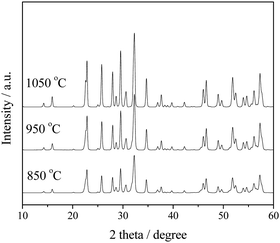 | ||
| Fig. 1 XRD patterns of typical Sr2KTa5O15 samples synthesized with different calcination temperatures for 2 h. | ||
Structural properties
X-ray powder diffraction patterns of Sr2KNb5−xTaxO15 (x = 0, 1, 2.5, 4 and 5) with different molar Nb/Ta ratios prepared at 850 °C for 2 h are shown in Fig. 2. All the powders are well-crystallized and no significant shifts are observed in the diffraction patterns. This indicates that Ta5+ has diffused into the tetragonal tungsten bronze (TTB) structure to form a solid solution in which Ta5+ occupies the Nb lattice sites, because the effective ionic radii of Nb5+ and Ta5+ ions in the Sr2KNb5−xTaxO15 are similar (64 pm), and on the contrary, the effective ionic radius of the Ta5+ ion is remarkably smaller than those of the Sr2+ ion and the K+ ion.23 As shown in Fig. 2a, the pattern of our Sr2KNb5O15 can be indexed to a TTB structure on basis of the reported data of bulk Sr2KNb5O15 crystals (JCPDS 34-0108, space group P4bm belonging to the point group 4 mm). However, the most intense reflection is (410), instead of (311, 420), and the intensity of (211) reflection decreases by more than half. This agrees very well with reported results,24–26 and can be attributed to the anisotropic growth of the Sr2KNb5O15 particles leading to a strong (001) orientation. It is important to note that some unknown impurity (<3%) was observed for Sr2KNb5O15, as indicated by the arrows in Fig. 2a. Interestingly, no impurity peaks were detected with increasing x and the phenomenon of the preferred (001) orientation growth gradually began to be weakened for these solid solutions, indicating that the anisotropic grain growth is inhibited by Ta5+ substitution. After complete substitution of Ta5+ for Nb5+, the Sr2KTa5O15 phase was derived according to the JCPDS 40-0345. The diffraction peak at about 46.3° splits into two peaks (Fig. 2b). This suggests that when substituting Nb5+ with Ta5+, the crystal structure transition to a symmetric center appeared from tetragonal point group 4mm to tetragonal point group 4/mmm), in good agreement with the literature.27,28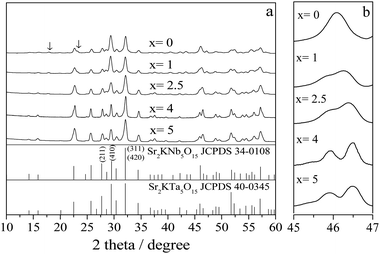 | ||
| Fig. 2 (a) XRD patterns of Sr2KNb5−xTaxO15 with x = 0, 1, 2.5, 4 and 5 prepared at 850 °C for 2 h, (b) enlarged XRD patterns of the Sr2KNb5−xTaxO15 ranging from 2θ = 45–47°. | ||
Representative SEM images of Sr2KNb5O15 (a), Sr2KNb2.5Ta2.5O15 (b) and Sr2KTa5O15 (c) samples are shown in Fig. 3. The samples display a nanorod-shaped morphology with the diameters in the range of 100–400 nm and the lengths up to a few microns, suggesting that the eutectic KCl salt favors the formation of nanorod morphology. With increasing Ta/Nb ratio most of the nanorods become more uniform in size, but also more agglomerated, and grow shorter in length, implying that the anisotropic grain growth can be to some extent be suppressed by the Ta5+ substitution, which is in accordance with the XRD analysis. A similar suppression caused by Ta5+ substitution was also found in other ceramic systems like (K0.44Na0.52Li0.04) (Nb0.96−xTaxSb0.04)O3, and Sr0.53Ba0.47Nb2−xTaxO6.29,30
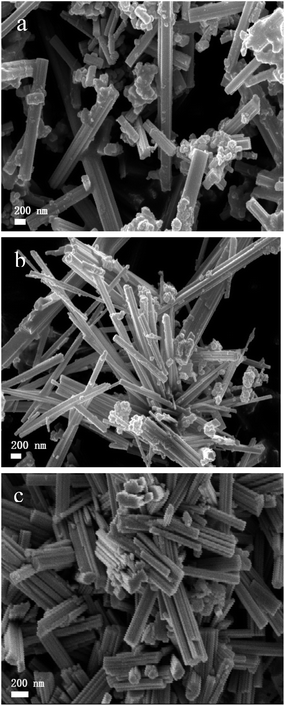 | ||
| Fig. 3 Representative SEM images of Sr2KNb5O15 nanorods (a) Sr2KNb2.5Ta2.5O15 (b) and Sr2KTa5O15 nanorods (c), respectively. | ||
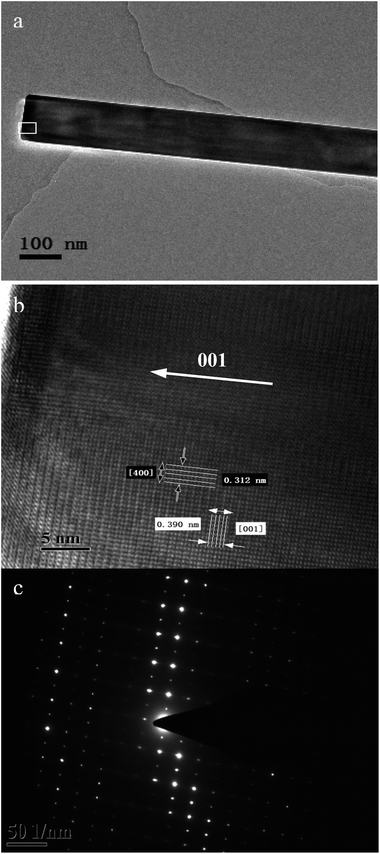
The microstructure, the lattice parameters and growth properties of the Sr2KNb5O15 and Sr2KTa5O15 nanorod samples were further studied by TEM, high-resolution TEM (HRTEM), and selected area electron diffraction (SAED). Fig. 4a shows a TEM image of a typical Sr2KNb5O15 nanorod at low magnification. The HRTEM image of the Sr2KNb5O15 sample taken from the top part of the Sr2KNb5O15 nanorod (as marked by a white rectangle in Fig. 4a) and the corresponding SAED pattern are presented in Fig. 4b and c, respectively. The lattice fringes of the Sr2KNb5O15 [001] and [400] planes are found to be about 0.39(0) nm and 0.31(2) nm, respectively and the SAED pattern can be assigned to tetragonal Sr2KNb5O15 single crystals with the electron beam closely parallel to [010] direction. These observations unambiguously indicate that the Sr2KNb5O15 nanorod is a high quality single crystal with tetragonal structure, grown along the [001] direction (marked by a white arrow in Fig. 4b).
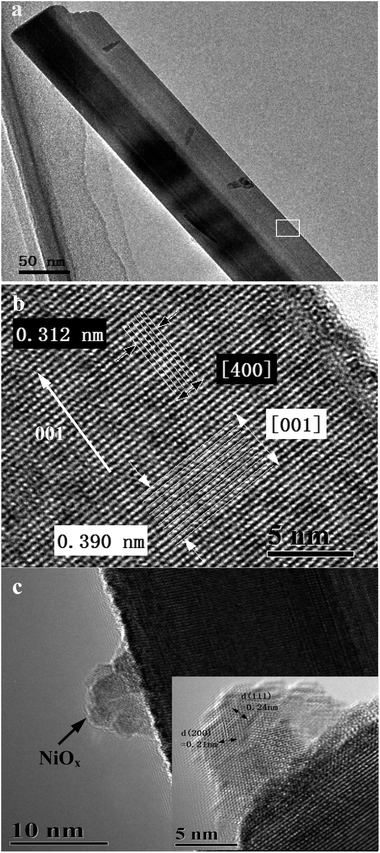
A typical Sr2KTa5O15 nanorod can be observed in the low-magnification TEM image of Fig. 5a. The HRTEM image in Fig. 5b, which corresponds to the area marked by a white rectangle in Fig. 5a, shows the same crystal planes and the same growth direction (as indicated by a white arrow) as illustrated in Fig. 4b. Therefore, clear evidence for preferential growth direction of Sr2KNb5O15 and Sr2KTa5O15 nanorod samples could be further found and both of them have the same [001] growth direction. Therefore, it is suggested that the use of molten salt as a reaction medium plays a dominant role for the formation of nanorod morphology and their preferential growth, while presumably the growth inhibition caused by Ta substitution in these Ta substituted samples, as observed in above XRD and SEM results, is limited.
Fig. 5c shows a representative TEM image of a typical 1.0 wt% NiOx loaded Sr2KTa5O15 sample. It can be clearly seen that distinguishable nano-NiOx co-catalyst particles are anchored on an individual Sr2KTa5O15 nanorod. The nano-NiOx co-catalyst particles consist of a solid Ni metal core and a brighter NiO outer layer. Furthermore, the inset on the lower right shows a lattice resolved HRTEM image of a nano-NiOx particle, in which the lattices of the out layer-cubic NiO can be determined to be the [111] and [200] crystal planes with d-spacings of 0.24 nm and 0.21 nm, respectively. The results demonstrate that the double-layered structure of metallic Ni and metal oxide NiO is created on the surface of the Sr2KTa5O15 nanorods photocatalyst by reduction–reoxidation processes. The formation of a Ni metal at the surface of photocatalyst results in the formation of a Schottky contact at the interface, and thus provides an opportunity to facilitate electron transport to the NiO shell to enhance the photocatalytic activity of the photocatalysts for overall water splitting as will be discussed below.
Optical and physical properties
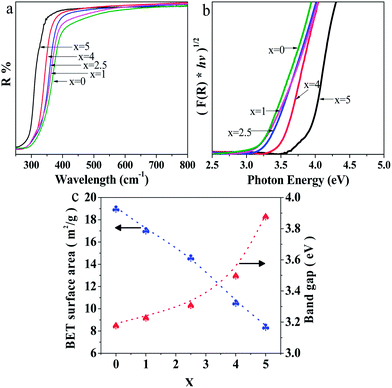
The UV-Vis diffuse reflectance spectra of Sr2KNb5−xTaxO15 with x = 0, 1, 2.5, 4 and 5 are shown in Fig. 6a. The absorption edges of Sr2KNb5−xTaxO15 obviously shift to shorter wavelengths with increasing Ta content. On basis of Kubelka–Munk transformation of the diffuse reflectance spectra, the band-gap energies from Tauc plots were larger than the apparent band-gap energies if direct transition is assumed for light absorption by the samples. As indicated in Fig. 6b, the assumption of indirect transition is in good agreement with apparent band gap energies, thus suggesting that the as-prepared oxides are indirect band gap semiconductors. Fig. 6c shows the band gaps of Sr2KNb5O15, Sr2KNb4Ta1O15, Sr2KNb2.5Ta2.5O15, Sr2KNb1Ta4O15 and Sr2KTa5O15 being estimated to about 3.19, 3.24, 3.32, 3.51 and 3.89 eV, respectively. The band gap of Sr2KNb5O15 is almost consistent with the reported value (3.24 eV).15 The data indicate that the band gaps do not linearly increase with the Ta substitution; for high Ta contents the band gap widening is more prominent.On the other hand, the BET surface areas of Sr2KNb5−xTaxO15 with x = 0, 1, 2.5, 4 and 5 decrease almost linearly with the substitution of Ta, as shown in Fig. 6c. The surface area of as-prepared Sr2KNb5O15 (19.1 m2 g−1) was improved by more than 60 times compared with that of the sintered sample (0.31 m2 g−1) by the conventional solid state reaction method,15 which may provide more active sites, reduce the recombination of photogenerated electron–hole pairs, and thus greatly enhance photocatalytic efficiency. This can be ascribed to the lower reaction temperature and the shorter reaction times (at 850 °C for 2 h) possible due to the intimate contacts in the molten salt moderated reaction.19,31,32
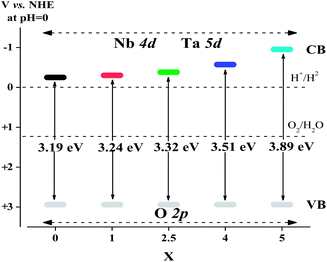
The band structure of photocatalysts is one of the important factors affecting the photonic efficiency. The valence band (VB) potentials of all Sr2KNb5−xTaxO15 solid solutions should be quite similar because of the same crystal structure and the same orbitals (O 2p orbitals) comprising the VB. Thus, the difference of band gap energies is due to the orbitals forming the conduction band (CB). According to the report by Scaife,33 for oxides containing no partly filled d-levels, the following equation can be used to approximately determine the flat band potential:
| Vfb(NHE) = 2.94 − Eg | (1) |
Effect of Ta substitution on photocatalytic H2 production by reforming of aqueous methanol solution
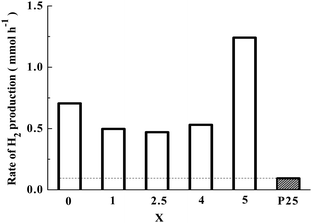
The photocatalytic H2 production rates over co-catalyst-free Sr2KNb5−xTaxO15 with x = 0, 1, 2.5, 4 and 5 from photocatalytic reforming of methanol are shown in Fig. 8. Note that the activities of photocatalysts with different Ta substitution molar ratio were compared by the average rate of H2 production in the first 1 h and the same photocatalytic trend can be obtained by at least three repeated measurements. For comparison, commercial TiO2 nanoparticles (Evonik P25) were also tested for photocatalytic H2 production under the same conditions. The Sr2KNb5−xTaxO15 solid solutions photocatalysts exhibited superior photocatalytic activity than P25. And it is clearly seen that the photocatalytic activity of Sr2KTa5O15 is much higher than that of Sr2KNb5O15. With the increased content of Ta substitution, the average formation rates of H2 decreased first, the lowest activity was observed for the Sr2KNb2.5Ta2.5O15, and then began to increase in the case of x > 2.5. It might be possible that the crystal sizes and crystallinity of the solid solutions negligibly influence the photocatalytic activity because their crystal sizes and high crystallinity were not significantly changed by Ta substitution from the XRD results. Therefore, the obvious decrease of H2 formation rate (x < 2.5) can be related to the decreased number of absorbed photons and lower specific surface areas. With higher Ta substitution (x > 2.5), the increase of H2 formation rate can be mainly attributed to the stronger driving force and more effective photoelectron transfer from the CB as described above.Photocatalytic overall water splitting
All native photocatalysts did not possess photocatalytic activity in pure water, probably due to the low charge separation and transfer efficiency. While 1.0 wt% NiOx was loaded as co-catalyst, the photocatalytic overall water splitting into stoichiometric amounts of H2 and O2 can be effectively promoted over prototypical examples of Sr2KNb5O15 and Sr2KTa5O15 photocatalysts. Fig. 9 shows the time course of H2 and O2 evolution from pure water over 1.0 wt% NiOx/Sr2KNb5O15 and 1.0 wt% NiOx/Sr2KTa5O15 photocatalysts under UV light irradiation for 5 h. After some short induction period of about 15 minutes of irradiation, the formation of H2 and O2 in a stoichiometric ratio (H2/O2 ≈ 2/1) was observed and there was no appreciable decrease by on-line monitoring of gas evolution, indicating that the samples are stable under UV light irradiation. Therefore, it is demonstrated that the presence of the double-layered nano-NiOx particles as co-catalysts on the surface of photocatalysts can improve the photocatalytic activity for overall water splitting. Based on the above TEM results, the formation of a Ni metal core at the surface of photocatalyst results in the formation of a Schottky contact at the interface, and thus facilitate electron transport to the NiO shell and suppress the backward reaction of water formation, leading to an enhancement of photocatalytic activity for overall water splitting.35–38 Furthermore, the average rates of H2/O2 evolution over Sr2KNb5O15 and Sr2KTa5O15 photocatalysts were estimated to be about 36.2/15.2 and 84.5/46.3 μmol h−1, respectively, thus the latter was more than 2 times higher than the former, in agreement with the above-presented comparison value from photocatalytic H2 production by methanol reforming. These experimental results not only proved the photocatalytical abilities of the tunnel structured photocatalysts for overall water splitting, but also consistently confirmed the above reasonable prediction resulting from the theoretical calculation of the band structures.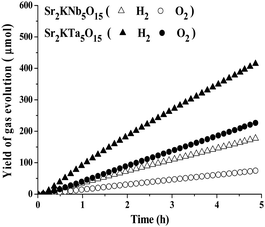 | ||
| Fig. 9 H2 and O2 evolution from pure water over 1.0 wt% NiOx loaded Sr2KNb5O15 and Sr2KTa5O15 for 5 h (conditions: 0.1 g of photocatalysts; 500 mL of H2O, Hg lamp). | ||
Conclusions
The novel Sr2KNb5Ta5−xO15 nanorod photocatalysts with tunnel structure were prepared by molten salt technique for 2 h at 850 °C. The effective improvement of the photocatalytic H2 production activity by Ta substitution has been demonstrated in methanol reforming. Compared to a bulk TiO2 sample, the Sr2KNb5Ta5−xO15 nanorod photocatalysts showed much higher activity. Moreover, by loading of NiOx co-catalyst on prototypical Sr2KNb5O15 and Sr2KTa5O15 photocatalysts, the decomposition of water into H2 and O2 at a stoichiometric amount (≈2![[thin space (1/6-em)]](https://www.rsc.org/images/entities/char_2009.gif) :
:![[thin space (1/6-em)]](https://www.rsc.org/images/entities/char_2009.gif) 1) under UV irradiation was observed, which can be attributed to the improved charge separation and transfer in the presence of double-layer structure NiOx co-catalyst. Therefore, it can be concluded that the tunnel structure photocatalysts are a new type of photocatalyst materials for overall water splitting from the view point of the tunable components because it consists of three different tunnels and octahedral arrays. Our ongoing work will continue to study on band gap engineering by controlling cation filling of three different tunnels and octahedral arrays, for extending the photosensitivity of photocatalytic oxides into the visible-light region.
1) under UV irradiation was observed, which can be attributed to the improved charge separation and transfer in the presence of double-layer structure NiOx co-catalyst. Therefore, it can be concluded that the tunnel structure photocatalysts are a new type of photocatalyst materials for overall water splitting from the view point of the tunable components because it consists of three different tunnels and octahedral arrays. Our ongoing work will continue to study on band gap engineering by controlling cation filling of three different tunnels and octahedral arrays, for extending the photosensitivity of photocatalytic oxides into the visible-light region.
Acknowledgements
We greatly appreciate Prof. Dr M. Muhler (RUB, Germany) for his support, Dr T. Reinecke (RUB, Germany) for XRD measurements. P.W. thanks for the scholarship support from the China Scholarship Council (CSC no. 2011614004). R.M. gratefully acknowledges funding in the Emmy-Noether program (MA 5392/3-1) of the German Science Foundation DFG. L.S. and M.W. thank the project “Sustainable Chemical Synthesis (SusChemSys)”, which is co-financed by the European Regional Development Fund (ERDF) and the state of North Rhine-Westphalia, Germany, under the Operational Programme “Regional Competitiveness and Employment” 2007–2013, for funding. M.W. additionally thanks the DFG under WA 1116.Notes and references
- P. Yang and J. M. Tarascon, Nat. Mater., 2012, 11, 560 CrossRef CAS PubMed.
- A. J. Bard and M. A. Fox, Acc. Chem. Res., 1995, 28, 141 CrossRef CAS.
- S. T. Martin, A. T. Lee and M. R. Hoffmann, Environ. Sci. Technol., 1995, 29, 2567 CrossRef CAS PubMed.
- F. E. Osterloh, Chem. Mater., 2008, 20, 35 CrossRef CAS.
- A. Kudo and Y. Miseki, Chem. Soc. Rev., 2009, 38, 253 RSC.
- X. B. Chen, S. H. Shen, L. J. Guo and S. S. Mao, Chem. Rev., 2010, 110, 6503 CrossRef CAS PubMed.
- Y. Miseki, H. Kato and A. Kudo, Energy Environ. Sci., 2009, 2, 306 CAS.
- M. Kohno, T. Kaneko, S. Ogura, K. Sato and Y. Inoue, J. Chem. Soc., Faraday Trans., 1998, 94, 89 RSC.
- S. Ogura, M. Kohno, K. Sato and Y. Inoue, Appl. Surf. Sci., 1997, 121, 521 CrossRef.
- A. Magneli and B. Blomberg, Acta Chem. Scand., 1951, 5, 372 CrossRef CAS PubMed.
- A. Simon and J. Ravez, C. R. Chim., 2006, 9, 1268 CrossRef CAS PubMed.
- S. Lanfredi, C. X. Cardoso and M. A. L. Nobre, Mater. Sci. Eng., B, 2004, 112, 139 CrossRef PubMed.
- E. Garcia-Gonzalez, A. Torres-Pardo, R. Jimenez and J. M. Gonzalez-Calbet, Chem. Mater., 2007, 19, 3575 CrossRef CAS.
- M. Prades, N. Maso, H. Beltran, E. Cordoncillo and A. R. West, Inorg. Chem., 2013, 52, 1729 CrossRef CAS PubMed.
- J. J. Wu, F. Q. Huang, Z. C. Shan and Y. M. Wang, Dalton Trans., 2011, 40, 6906 RSC.
- L. W. Zhang, H. B. Fu, C. Zhang and Y. F. Zhu, J. Phys. Chem. C, 2008, 112, 3126 CAS.
- S. M. Zhang, G. K. Zhang, S. J. Yu, X. G. Chen and X. Y. Zhang, J. Phys. Chem. C, 2009, 113, 20029 CAS.
- O. Palasyuk and P. A. Maggard, J. Solid State Chem., 2012, 191, 263 CrossRef CAS PubMed.
- P. Wang, P. Chen, A. Kostka, R. Marschall and M. Wark, Chem. Mater., 2013, 25, 4739 CrossRef CAS.
- K. Domen, A. Kudo, T. Onishi, N. Kosugi and H. Kuroda, J. Phys. Chem., 1986, 90, 292 CrossRef CAS.
- X. Wang, Q. Xu, M. R. Li, S. Shen, X. L. Wang, Y. C. Wang, Z. C. Feng, J. Y. Shi, H. X. Han and C. Li, Angew. Chem., Int. Ed., 2012, 51, 13089 CrossRef CAS PubMed.
- L. Schwertmann, M. Wark and R. Marschall, RSC Adv., 2013, 3, 18908 RSC.
- R. D. Shannon, Acta Crystallogr., Sect. A: Cryst. Phys., Diffr., Theor. Gen. Crystallogr., 1976, 32, 751 CrossRef.
- C. Duran, G. L. Messing and S. Trolier-Mckinstry, Mater. Res. Bull., 2004, 39, 1679 CrossRef CAS PubMed.
- Z. P. Yang, L. L. Wei, Y. F. Chang and B. Liu, J. Mater. Sci., 2007, 42, 3627 CrossRef CAS PubMed.
- Z. P. Yang, L. L. Wei and Y. F. Chang, J. Eur. Ceram. Soc., 2007, 27, 267 CrossRef CAS PubMed.
- L. L. Wei, Z. P. Yang, Y. F. Chang and R. I. Gu, J. Am. Ceram. Soc., 2008, 91, 1077 CrossRef CAS.
- L. Wei, Z. Yang, H. Ren and X. Chen, J. Am. Ceram. Soc., 2010, 93, 3986 CrossRef CAS.
- Z. P. Yang, R. Gu, L. L. Wei and H. M. Ren, J. Alloys Compd., 2010, 504, 211 CrossRef CAS PubMed.
- Z. P. Yang, Y. F. Chang and L. L. Wei, Appl. Phys. Lett., 2007, 90, 042911 CrossRef PubMed.
- D. Arney, C. Hardy, B. Greve and P. A. Maggard, J. Photochem. Photobiol., A, 2010, 214, 54 CrossRef CAS PubMed.
- N. McLamb, P. P. Sahoo, L. Fuoco and P. A. Maggard, Cryst. Growth Des., 2013, 13, 2322 CAS.
- D. E. Scaife, Sol. Energy, 1980, 25, 41 CrossRef CAS.
- B. Siritanaratkul, K. Maeda, T. Hisatomi and K. Domen, ChemSusChem, 2011, 4, 74 CrossRef CAS PubMed.
- M. Tian, W. Shangguan, J. Yuan, S. Wang and Z. Ouyang, Sci. Technol. Adv. Mater., 2007, 8, 82 CrossRef CAS PubMed.
- Y.-C. Chiou, U. Kumar and J. C. S. Wu, Appl. Catal., A, 2009, 357, 73 CrossRef CAS PubMed.
- Z. Zou, J. Ye, K. Sayama and H. Arakawa, Nature, 2001, 414, 625 CrossRef CAS PubMed.
- T. K. Townsend, N. D. Browning and F. E. Osterloh, ACS Nano, 2012, 6, 7420 CrossRef CAS PubMed.
| This journal is © The Royal Society of Chemistry 2014 |

