
 Open Access Article
 This Open Access Article is licensed under a
 Creative Commons Attribution 3.0 Unported Licence
PANDA: a self-driving lab for studying electrodeposited polymer films†
Harley
Quinn
 a,
Gregory A.
Robben
a,
Zhaoyi
Zheng
a,
Alan L.
Gardner
b,
Jörg G.
Werner
*abc and
Keith A.
Brown
*abd
a,
Gregory A.
Robben
a,
Zhaoyi
Zheng
a,
Alan L.
Gardner
b,
Jörg G.
Werner
*abc and
Keith A.
Brown
*abd
aDivision of Materials Science & Engineering, Boston University, Boston, MA 02215, USA. E-mail: brownka@bu.edu; jgwerner@bu.edu
bDepartment of Mechanical Engineering, Boston University, Boston, MA 02215, USA
cDepartment of Chemistry, Boston University, Boston, MA 02215, USA
dDepartment of Physics, Boston University, Boston, MA 02215, USA
First published on 6th August 2024
Abstract
We introduce the polymer analysis and discovery array (PANDA), an automated system for high-throughput electrodeposition and functional characterization of polymer films. The PANDA is a custom, modular, and low-cost system based on a CNC gantry that we have modified to include a syringe pump, potentiostat, and camera with a telecentric lens. This system can perform fluid handling, electrochemistry, and transmission optical measurements on samples in custom 96-well plates that feature transparent and conducting bottoms. We begin by validating this platform through a series of control fluid handling and electrochemistry experiments to quantify the repeatability, lack of cross-contamination, and accuracy of the system. As a proof-of-concept experimental campaign to study the functional properties of a model polymer film, we optimize the electrochromic switching of electrodeposited poly(3,4-ethylenedioxythiophene):poly(styrene sulfonate) (PEDOT:PSS) films. In particular, we explore the monomer concentration, deposition time, and deposition voltage using an array of experiments selected by Latin hypercube sampling. Subsequently, we run an active learning campaign based upon Bayesian optimization to find the processing conditions that lead to the highest electrochromic switching of PEDOT:PSS. This self-driving lab integrates optical and electrochemical characterization to constitute a novel, automated approach for studying functional polymer films.
New conceptsWe report and characterize a novel low-cost self-driving lab (SDL) that represents a new approach for studying functional polymer films. While SDLs have been explored for a number of facets of polymer research, they have not yet been able to study electrodeposited polymer films or the electrochromic behavior of films. Further, we introduce a new architecture for high-throughput study of electrically and optically active films that features a custom well plate with a transparent conductive bottom layer. Combining polymer electrodeposition and functional optical characterization enables closed-loop exploration of functional polymer films using a modular and open-source architecture that can be adopted by others and expanded upon to explore a wide array of properties for electrodeposited films. |
Introduction
Self-driving labs (SDL) have emerged as an enabling tool to accelerate research in materials science.1,2 These systems leverage robotics to perform high-throughput synthesis and characterization while using machine learning to select experiments to accelerate material discovery or optimization. In addition to their main advantage, SDLs can offer benefits over conventional research in terms of reproducibility, resources used per experiment, and collation of metadata. These systems have been experimentally benchmarked and found to reduce the number of experiments needed to achieve a given goal by up to 100 fold.2 SDLs have seen application in fields such as photovoltaics,3 battery research,4 semiconductor nanoparticles,5 additive manufacturing,6 catalysis,7 and organic lasing materials.8 As exemplified by the breadth of these applications, SDLs often take the form of bespoke systems to perform specific classes of experiments. There has been sustained effort to develop modular software tools that can apply to many different SDL formats, such as Coscientist9 or ChemOS,10 however, the application of SDLs in a given domain still requires innovations in the hardware specific to that space.One area that has received a particularly large amount of development with regard to SDLs is electrochemistry. Early work leveraged the common microtiter plate format to realize systems that could measure the electrochemical response of any well by mounting a set of electrodes on a moving gantry.11,12 This concept was further developed through the use of a communal working electrode and 96 parallel counter electrodes to allow for the whole plate to be characterized simultaneously.13 Further modifications to the array format have allowed researchers to include the ability to perform photochemistry alongside electrochemistry.11,14 Custom arrays have also been used with sustained electrochemical monitoring to study leeching for copper extraction.15 An alternate approach to using arrays of wells is to use a single electrochemical reactor multiple times. This approach has been more conducive to realizing closed-loop formulation and testing with systems being developed to study electrocatalysts,16 electrolytes,17 or the mechanism of electrochemical reactions.18 In parallel with these hardware advances, software tools specific to electrochemistry have emerged such as Hard Potato,19 a Python library for automating electrochemical experiments, and ExpFlow, a graphical user interface for automated electrochemical experiments.20
Despite these innovations, one area of electrochemistry that has been largely unexplored is the electrodeposition of polymer films. Electrodeposition is a powerful approach for realizing functional ultrathin films,21–23 however, the optimization has not yet taken advantage of the acceleration inherent to SDLs. While SDLs have been used to study polymer films prepared through other means such as spin coating,24,25 spray-coating,26 drop-casting,27,28 printing,27 and spontaneous solution spreading,29 electrodeposition and electrochemical characterization have yet to receive substantial attention. Furthermore, many functional properties of electrodeposited films require multi-modal characterization, such as optical characterization, that is incompatible with previously studied electrochemical SDLs.
Here, we introduce an open-source SDL that electrodeposits and functionally characterizes polymer films using a combination of electrochemical and optical techniques (Fig. 1). Experiments are performed in a novel well plate architecture in which the transparent bottom of each well constitutes the working electrode while enabling transmission optical characterization. We perform an extensive series of experiments to determine the precision and accuracy of fluid handling while ruling out the potential for cross-contamination. In addition, we validate the performance and reproducibility of the custom electrochemical cells. Finally, we demonstrate the functional performance of this SDL by running a fully autonomous campaign to optimize the electrochromic performance of electrodeposited poly(3,4-ethylenedioxythiophene) (PEDOT). Crucially, this system is low cost and open source, meaning that others can adopt or modify it to explore myriad properties for electrodeposited polymers.
 | ||
| Fig. 1 (A) A 3D rendering of the polymer analysis and discovery array (PANDA) highlighting the tool end and well plate in a green box. (B) Detailed 3D rendering of the tool end, featuring: (i) liquid handling attachment consisting of a custom pipette tip adapter, (ii) an electrochemical attachment enclosing a counter electrode and a reference electrode, and (iii) a telecentric lens attached to a camera for optical characterization. (i) Schematic showing the liquid handling system and calibrated performance. (ii) Schematic showing the electrochemical system with example cyclic voltammetry data. (iii) Schematic showing optical characterization system with a depiction of how the studied films are perceived in CIE L*a*b* coordinates. (C) Screenshot of PANDA interface showing real-time monitoring images (top left), main menu (top right), stock solution levels (bottom left), a captured image of an electrodeposited film (bottom center), and deck status (bottom right). A full resolution image is shown as Fig. S2 (ESI†). | ||
Experimental
Hardware
The robotic system was built around a modified CNC router (Fig. 1A – Genmitsu, PROVerXL 4030). The spindle was removed and replaced with a 3D printed modular tool holder that holds adapters for two electrodes of an electrochemical cell (Pt wire to serve as a counter electrode wrapped around a glass capillary housing an AgCl-coated Ag wire in a 1 M KCl solution capped with a glass frit to serve as a Ag/Ag+ reference electrode), pipette tip adapter attached via a tube to a syringe pump, and telecentric lens (#52-271, Edmund optics) with attached c-mount camera (Grasshopper 3, FLIR) (Fig. 1B). Accessories are attached to the deck of the mill using t-slots as mounting points to hold stock solutions, an electrolyte reference solution, waste vials, and a custom substrate mount (Fig. S1, ESI†). Mounted around the system are two process-monitoring cameras to allow visualization and recording of the key areas in the system including experiment progress and liquid handling (Fig. 1C). For liquid handling validation experiments, a piece of the deck was removed to allow the use of an analytical balance (Entris II Essential Precision Balance, Sartorius) while performing dispensing operations. For control of the fluidics, we integrated a syringe pump (Aladin Model A-1000, WPI) and for the electrochemistry a potentiostat (Interface 1010E, Gamry). Pictures detailing the system are included in Fig. S3 (ESI†).Software
The PANDA is controlled by a custom Python program that users interact with via a text-based terminal interface. Through this interface individual actions may be taken, such as updating the locations or contents of physical objects, generating experiment instruction sets, or initiating either a semiautonomous or fully autonomous campaign.The program is a composition of custom scripts and modules which themselves depend upon the Python Standard Library and third-party open-source libraries such as gpytorch for machine learning. The overall architecture represents each virtual or physical system component in its own module in an effort to realize a modular and easy to maintain codebase. The individual modules are then used as configurable building blocks by higher level components responsible for orchestrating the mill's movements; experiment generation, selection, execution, and analysis; communication with the research team through Slack; control of Open Broadcaster Software for monitoring; and database communication. Further details of the software are included in the ESI† (Fig. S4–S7 and Table S1) along with all code used in this work.
Chemicals and materials
For experiments to study fluid handling, de-ionized water (18.2 MΩ cm Milli-Q, Millipore) was used. For experiments to study the electrochemical system, the PANDA used potassium ferricyanide (5 mM or 10 mM, 99+%, Thermo Scientific) in de-ionized water with potassium chloride (0.1 M, 99+%, Thermo Scientific) as the supporting electrolyte.For the polymer film electrodeposition experiments, the deposition solution was made by dissolving 3,4-ethylenedioxythiophene (EDOT) (99%, Acros Organics) in a 1![[thin space (1/6-em)]](https://www.rsc.org/images/entities/char_2009.gif) :1 (v:v) ratio of methanol (HPLC, Thermo Scientific) to de-ionized water at concentrations between 0.01 and 0.1 M and adding poly(styrene sulfonic acid) sodium salt (1 mM, M.W. 70000 Da, Thermo Scientific). Lithium perchlorate (0.1 M, 99%, Sigma-Aldrich) was dissolved as the supporting electrolyte in de-ionized water and used for the oxidation and reduction of PEDOT films in the electrochromic characterization experiments.
:1 (v:v) ratio of methanol (HPLC, Thermo Scientific) to de-ionized water at concentrations between 0.01 and 0.1 M and adding poly(styrene sulfonic acid) sodium salt (1 mM, M.W. 70000 Da, Thermo Scientific). Lithium perchlorate (0.1 M, 99%, Sigma-Aldrich) was dissolved as the supporting electrolyte in de-ionized water and used for the oxidation and reduction of PEDOT films in the electrochromic characterization experiments.
Working electrode fabrication and electrochemical measurements
Glass slides (86 × 126 mm2, polished borofloat glass – S.I. Howard Glass Co., Inc.) were cleaned in acetone followed by isopropyl alcohol (IPA) and dried under a nitrogen stream prior to use. A conductive layer of indium tin oxide (ITO) was sputtered onto the glass slides using DC Magnetron sputtering (Angstrom, EvoVac). The slides were subsequently annealed at 400 °C for 5 minutes resulting in a sheet resistivity of 410 Ω sq−1.Polydimethylsiloxane (PDMS) sheets were made by pouring a 10:1 base:crosslinker ratio of Sylgard 184 (electron microscopy sciences) into a custom 3D printed polylactic acid (PLA) frame mounted on clean glass slides and then allowing it to cure at room temperature for 48 hours. After removal from the glass substrate, wells were laser-cut (Epilog, Fusion Edge 12) into the PDMS sheets using a custom template designed to mimic the geometry of commercially available 96-well plates. After cutting, the PDMS was thoroughly cleaned with de-ionized water and then rinsed with IPA. The PDMS gasket was then mounted onto the ITO-coated glass by applying a thin layer of uncured PDMS to the gasket and aligning it onto the ITO-coated glass using an alignment tool.
All electrochemical experiments were conducted using a Gamry Interface 1010E potentiostat in a three-electrode configuration. The ITO-coated glass served as the working electrode, a platinum wire (diameter 0.25 mm, 99.9% trace metals basis) was used as the counter electrode, and an AgCl-coated Ag wire in a 1 M KCl solution separated from the working solution by a glass frit was used as the reference electrode (Ag/AgCl reference electrode, CH Instruments). This is referred to as Ag/Ag+ in all experiments. The second cycle of cyclic voltammetry (CV) was used for all analyses to avoid any transient effects. Further details of the electrochemical experiments are included in the ESI† (Fig. S8, Tables S2 and S3).
Results and discussion
Validation of automated fluid handling and electrochemistry
In order to develop the confidence needed to utilize the PANDA as an SDL and perform polymer deposition experiments, it is first necessary to evaluate that each module of the system is functioning reliably. Foundational to any experiment is the ability to dispense fluid. As such, we began by exploring the accuracy and precision of PANDA-based fluid handling. Initially, we sought to compare the performance using each of the two conventional micro pipetting techniques: reverse pipetting and forward pipetting (Fig. 2A). In reverse pipetting, extra fluid is drawn into the pipette with the intended volume specified by the dispensing step. In forward pipetting, the intended volume is determined by the amount drawn into the pipette with an additional “blow-out” volume of air being used to ensure that all fluid is dispensed. To explore the performance of each approach, we performed 600 randomized experiments in which 100 μL was pipetted onto an analytical balance by the PANDA (Fig. 2B). Interestingly, we observed that forward pipetting produced more accurate results with the average dispensed quantity being 94.8 μL vs. 70.6 μL for reverse pipetting. While inaccuracies may on average be corrected, perhaps more important was the difference in precision with forward pipetting producing a more precise standard deviation of 1.7 μL vs. 4.0 μL for reverse pipetting. Based on these results, all subsequent work utilized forward pipetting.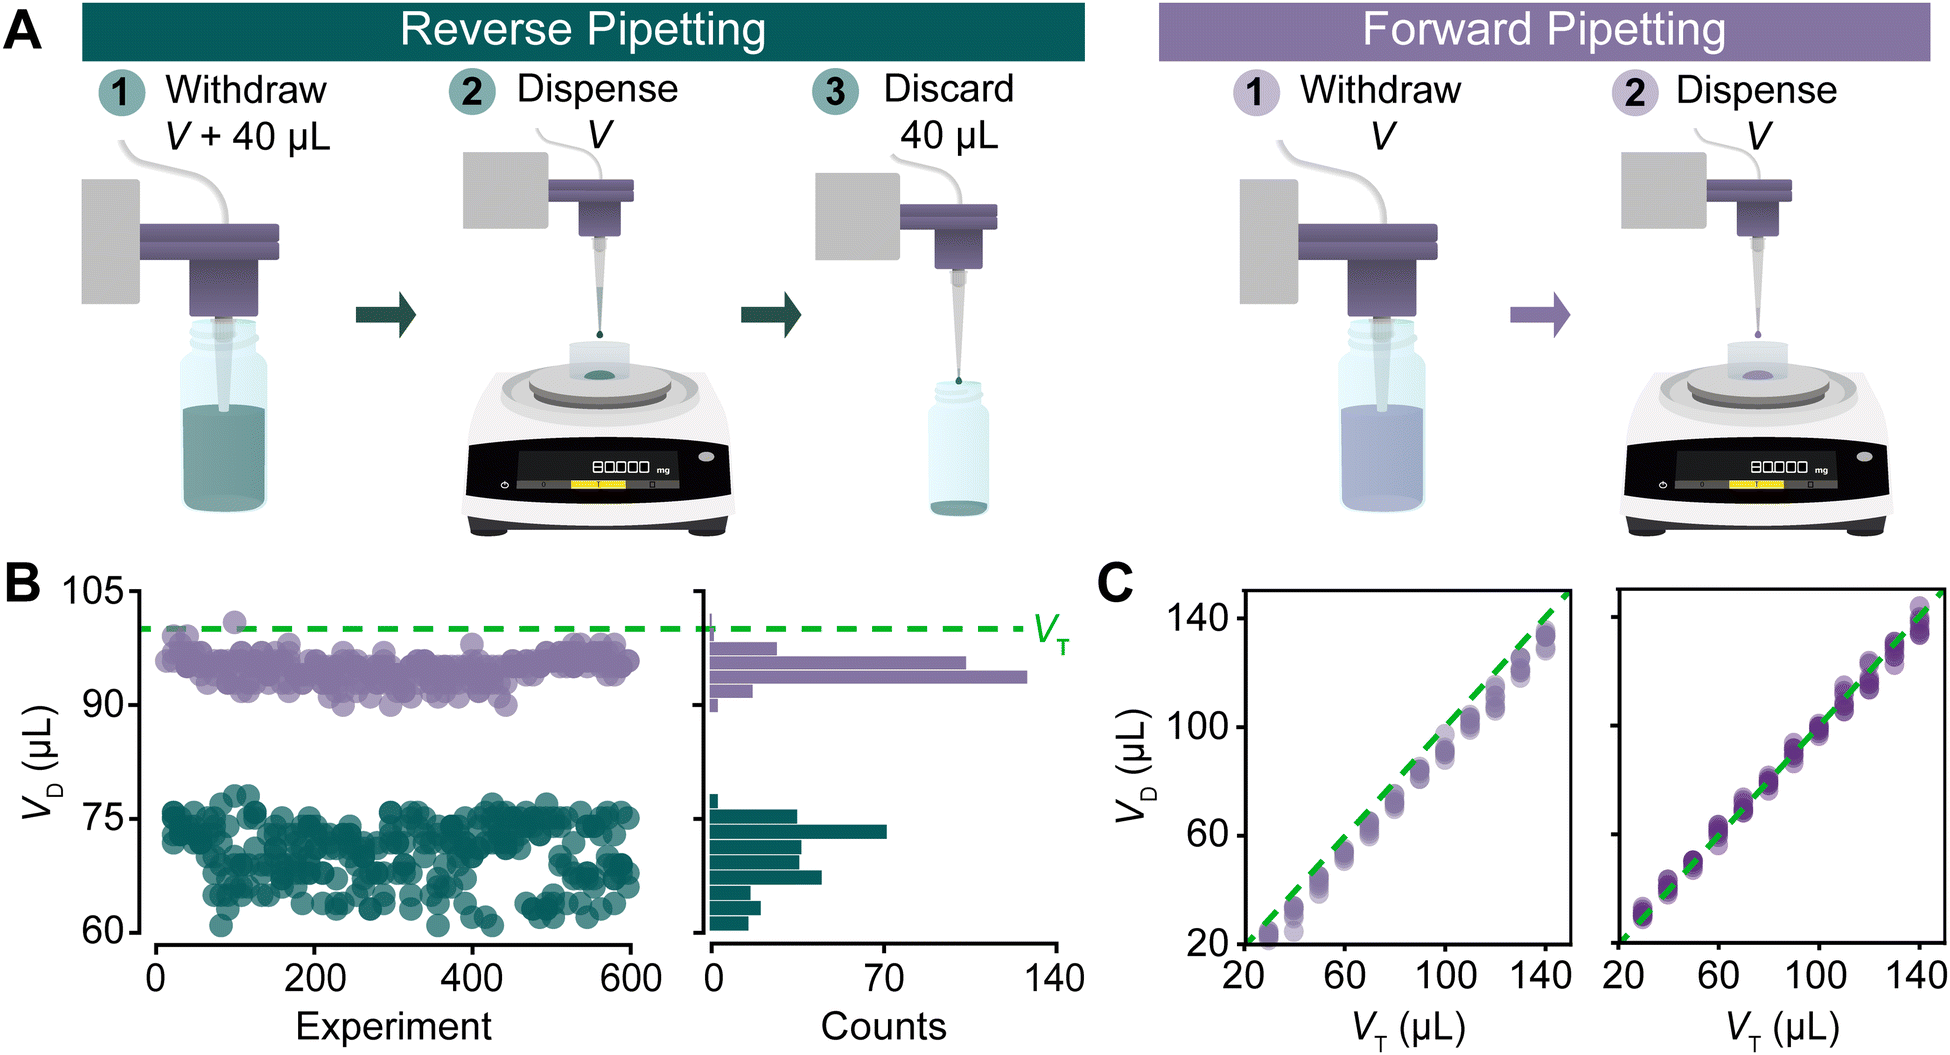 | ||
| Fig. 2 (A) Left schematic: Reverse pipetting process illustrated in three steps—(1) withdraw a programmed volume plus an additional 40 μL from the stock solution, (2) dispense the programmed volume into a container on an integrated analytical balance, (3) discard the remaining volume in the pipette tip. Right schematic: Forward pipetting process detailed in two steps—(1) withdraw a programmed volume from the stock solution, (2) dispense the entire solution into a container on an integrated analytical balance. (B) Comparison of volume dispensed VD when reverse pipetting (teal) and forward pipetting (purple) across 600 experiments. Histograms show the frequency of VD for each method. The 100 μL target volume VT is marked by a dashed green line. (C) Left: VDvs. VT over volumes ranging from 20 to 140 μL in 10 μL increments, with eight replicates per volume. Right: Result of a second set of experiments after calibrating with a linear shift. | ||
Having selected forward pipetting due to its comparatively high precision, we sought to determine a calibration strategy to improve the accuracy of fluid handling. In a calibration experiment, we dispensed volumes between 20 and 140 μL in 10 μL increments across eight replicates per volume while measuring the dispensed mass using the scale (Fig. 2C left). The root mean squared error (RMSE) for the parity line (green) was calculated to be 7.8 μL, providing a measure of the accuracy without calibration. Fitting the data to a line, we find an RMSE of 2.3 μL, consistent with the precision reported in the prior study. Based on the linear appearance of the data, we hypothesized that applying a linear calibration function to adjust the programmed volume VT would remove any systematic inaccuracies. Thus, we repeated the experiments with the newly calibrated volumes (Fig. 2C right). In the calibrated experiments, our accuracy improved to 2.8 μL, and our precision remained consistent at 2.3 μL, demonstrating a clear improvement in accuracy while maintaining precision with the application of a linear calibration function. To ensure accuracy throughout experiments we programmed the PANDA to perform 1000 withdrawals and dispensing actions with 3 different pipette tips and found minimal tip-to-tip variation (Fig. S9, ESI†). This allowed us to replace the pipette tip less frequently, saving time and minimizing waste.
Having calibrated the liquid handling system, we validated the electrochemical system next. While the materials that constitute the electrodes are relatively common, the geometry of the fluid cell is comparatively novel, meaning that well-to-well variability and repeatability should be assessed. Thus, we performed a series of experiments using aqueous K3Fe(CN)6 (FC), a standard redox probe,30 in a series of experiments with KCl as the supporting electrolyte. We programmed the PANDA to deposit 120 μL of the FC solution into a single well, perform CV (operating voltage between −0.2 and 0.6 V vs. Ag/Ag+, scan rate 50 mV s−1), remove the used solution, and then replicate this process for a total of ten experiments (Fig. 3A). The CV results (Fig. 3B) showed consistent anodic peak currents jpa, peak current differences Δjp, and peak separations ΔEp, indicating that the system is reproducible. This procedure was repeated in two additional wells to test well-to-well variability, results of which are shown in Fig. 3C. Importantly, the mean results for the three wells were within 6 mV and 0.03 mA cm−2 for their ΔEp and Δjp values, respectively.
 | ||
| Fig. 3 (A) Schematic of the K3Fe(CN)6 (FC) experiment process: (1) FC solution is added to a well, (2) cyclic voltammetry (CV) is performed, and (3) the solution is removed. (B) Ten CVs showing current density j vs. potential E vs. an Ag/Ag+ reference electrode. Key features are highlighted: peak-to-peak separation ΔEp in a shaded peach region, anodic peak height jpa between two dashed purple lines, and difference between anodic and cathodic peak current densities Δjp between two dashed blue lines. (C) Plot of jpavs. ΔEp from (B) with data from two additional wells with 10 experiments each. Marker color indicates the well used, with the X symbols denoting the averages for each well. (D) Schematic of the process used to rinse between experiments in the same well: (1) CV with FC, (2) removal of FC solution, (3) addition of electrolyte rinse, and (4) CV in the rinse solution. The result is shown as the bottom panel as Δjpvs. number of rinses with points colored by the residual FC concentration. (E) Schematics of the mixing strategies used in experiments: top—5 mM FC dispensed directly; middle—10 mM FC added and then diluted to 5 mM with electrolyte; bottom—electrolyte added first and then concentrated to 5 mM FC by adding 10 mM FC. In all experiments, a CV was performed after fluid handling. (F) Plot of jpavs. ΔEp resulting from the mixing strategies in (E). Marker color indicates the mixing sequence as shown in (E). The X symbols show the averages found for each method. | ||
As many workflows of polymer analysis will involve multiple fluid handling steps, it is necessary to evaluate the degree to which both the pipette tip and wells can be rinsed without residual solution remaining. The capability of performing sequential steps in a well is particularly important for in-loop film characterization without human intervention. Thus, we programmed the PANDA to withdraw FC solution, dispense it directly into waste, and then perform a rinsing action (withdrawing and dispensing) three times before withdrawing electrolyte solution from a different stock vial, dispensing it into a new well, and performing CV to determine the presence of any residual redox-active species (Fig. S10, ESI†). After three rinses, residual redox-active species were undetectable, establishing the pipette rinse protocol for subsequent experiments. For the evaluation of our well rinsing procedure, the PANDA was programmed to dispense FC solution into a well, execute a CV, remove the solution from the well, fill the well with 120 μL of electrolyte solution, and then perform CV again to determine the presence of any residual redox-active species over multiple repetitions (Fig. 3D top). Importantly, redox-active species were undetectable after four rinses, establishing the rinse protocol for subsequent experiments (Fig. 3D bottom). Based on the fitting of the linear portion of this curve, approximately 75% of the redox-active species is removed from the well with each rinsing cycle.
As a final set of experiments to validate the performance of the PANDA, we sought to evaluate its ability to mix solutions in the wells. This capability is critical for studying series of reagent concentrations using a combination of finite stock solutions. To explore this, we compared the CVs that resulted from three different processes that should have resulted in the same final concentration: (1) a premixed control that was 5 mM FC, (2) wells prepared by first depositing 10 mM FC and then an equal volume of electrolyte, and (3) wells prepared by first depositing an electrolyte solution and then 10 mM FC (Fig. 3E). A total of 18 CVs were performed in two separate wells with each well being rinsed after each experiment. Aside from the natural agitation arising from deposition, no further mixing was performed. The outcomes, depicted as jpaversus ΔEp, indicated that all preparation methods produced outcomes that were not statistically distinguishable (single factor ANOVA, α = 0.05, p-value = 0.45 for ΔEp and 0.14 for jpa), confirming that the solutions were adequately mixed (Fig. 3F).
Building PEDOT training data set
Following the successful validation of our liquid handling and electrochemical systems, we programmed the PANDA to electrodeposit PEDOT:PSS films as a proof of concept. Each experiment was a nine-step process (Fig. 4A) in which the PANDA, (1) selected a previously unused well, (2) dispensed an EDOT solution into that well, (3) conducted electrodeposition using potentiostatic chronoamperometry, (4) rinsed the well with electrolyte solution, (5) imaged the deposited film, (6) dispensed the inert supporting electrolyte solution for switching the electrochromic state, (7) reduced the film by applying a negative potential, (8) rinsed the well with electrolyte solution, and then (9) imaged the film in its bleached state (Fig. 4A). A flowchart detailing the software steps used by the PANDA is shown in Fig. S11 (ESI†). | ||
| Fig. 4 (A) Schematic showing the experimental sequence for depositing and characterizing a poly(3,4-ethylenedioxythiophene) (PEDOT) film. Dark blue arrows indicate the workflow. Scale bars are 2 mm. (B) Plots comparing deposition parameters (potential Edepvs. Ag/Ag+ and deposition time tdep) for 3,4-ethylenedioxythiophene (EDOT) solutions with concentrations of 0.01, 0.03, and 0.1 M. Marker color represents the colored/bleached contrast ΔE00 and total charge passed Q during reduction. (C) Plot of ΔE00vs. Q for all data shown in (B). Images at each point show optical images of the colored films. The points denoted by stars in (B) and (C) are the best-performing experiment and this data is also shown in (A). | ||
In considering how to explore the processing space associated with PEDOT:PSS, we identified three variables that would be pertinent to the final structure. Initially, we hypothesized that electrodeposition time, electrodeposition voltage, and EDOT concentration would be the most impactful three variables. Thus, to establish a training dataset in this three-dimensional space, we employed Latin hypercube sampling (LHS) to select 16 distinct experiments at each of three EDOT concentrations (0.01, 0.03, and 0.1 M), totaling 48 experiments. The parameters ranged from 0.8 to 1.6 V for the deposition potential and from 1 to 100 seconds for the deposition time, with the latter being selected in log space. We evaluated the outcomes by measuring the ΔE00, a color difference metric by CIE,31 reflecting the human-perceived color change (Fig. 4B top), and by quantifying the total charge passed during film reduction with a LiClO4 solution at −0.6 V for 60 s (Fig. 4B bottom). We observed a trend where darker (thicker) films passed more charge during reduction, although films with moderate coloration exhibited the most significant color change between their colored and bleached states (Fig. 4C). This finding agrees with prior work in which the color contrast increases with film thickness until it reaches an optimal value and then decreases with increasing thickness.32–34
Autonomous experimentation with machine learning model
While the prior experimental campaign showed that the PANDA was capable of autonomously depositing and functionally characterizing polymer films, these experiments were selected before starting the campaign, meaning that the experimental loop was open. Instead, the true value of SDLs is realized when each new experiment is selected based on the outcome of all prior experiments. Thus, we sought to show that the PANDA could be transformed into a true SDL by using machine learning to select each additional experiment. To test this concept, we implemented Bayesian optimization (BO) in which the data is modeled using a Gaussian process regression (GPR). Here, GPR was chosen as a surrogate model due to its exceptional performance in sparse data situations. Other surrogate models such as random forests or deep neural networks could be used especially as the quantity of data increases.35Leveraging the data from our prior campaign, we used the 48 LHS-selected data points as a training set to initially train the hyperparameters of the GPR using leave-one-out cross-validation. Noting that the optimal voltage was near the boundary, before proceeding to these BO-selected experiments, we expanded the range for our deposition parameters to 0.6–1.8 V for potential and included the 18 discrete EDOT concentrations (between 0.01–0.1 M) that could be obtained by mixing three stock solutions (0.01, 0.03, and 0.1 M) in 20 μL increments. The deposition time bounds remained the same (1–100 s). For each concentration, our ML model used LHS to generate 50000 possible experiments, adjusted hyperparameters using maximum likelihood probability, and used expected improvement to select an experiment to maximize ΔE00. Expected improvement was selected because it naturally balances exploration and exploitation without the need for an additional hyperparameter. Other acquisition functions such as upper confidence bound can be applied and have been shown to perform similarly.36 These chosen parameters were then used by the robotic system to deposit and characterize a PEDOT film.
The PANDA active learning campaign proceeded by iteratively selecting an experiment using the GPR, performing the selected experiment, and then integrating the new results into the model in real time (Fig. 5A). Due to our use of BO, the system naturally balanced exploring uncertain regions in parameter space and exploiting known high-performance areas. After 20 rounds of experimentation, the updated model predictions indicated a refined understanding of the parameter space, showing a realistic predicted measurement uncertainty (noise hyperparameter = 3.8) and identifying a reasonably smooth high-performing region which we assume to be the global maximum (Fig. 5B).
 | ||
| Fig. 5 (A) Plot illustrating ΔE00 for initial LHS training data (left), autonomous learning (AL) data in purple (center), and validation points (right) shown in the order the experiments were performed. Model predictions and uncertainties are shown as green triangles with error bars and the dashed gold line indicates the model's predicted optimum after all experiments. Examples of champion films are shown in their colored and bleached states (right). (B) Surface plots of tdepvs. Edep showing (top) ΔE00 predicted by the GPR model, (middle) uncertainty in the GPR model, and (bottom) computed expected improvement (EI). Data is shown after initial training data (left), after one AL experiment (middle), and after 20 AL experiments (right). (C) Magnified view of GPR-predicted ΔE00 after 20 experiments showing the AL data points. The bottom shows a magnified view of the maximum region with experiment order indicated by marker color. Stars indicate the parameters used for the validation experiments with the light purple showing the observed maximum and dark purple showing the predicted optimum. | ||
In order to evaluate the effectiveness of the campaign, we performed a series of validation experiments. First, we queried the model to predict the parameter values expected to result in the highest ΔE00. These conditions were replicated in seven validation experiments shown in dark purple (Fig. 5A predicted optimum), with the films being visually documented. Next, we retested the parameters from our observed maximum experiment during the active learning campaign by performing three additional replicates shown in light purple (Fig. 5A observed maximum). While the validation experiments were performed outside the autonomous loop, the same evaluation code was used to determine their respective ΔE00 values. When running an active learning campaign, it is prudent to explore both the predicted and observed maximum as both can be suboptimal for different reasons. The predicted optimum can be incorrect if the model is not accurate in this region. The observed maximum can be suboptimal if the champion observed during the campaign happened to experience a large fluctuation. Here, the means of both overlapped with the predicted optimum showing ΔE00 = 21.7 ± 0.7 while the observed maximum resulted in ΔE00 = 22.2 ± 1.2. The agreement between these values is likely a representation of both the smoothness of this space together with the high quality of the model.
The experiments chosen by the model, overlayed on the model's refined parameter space, highlighted exploratory areas (higher voltages) and exploitative zones (around 1.2–1.3 V). A zoomed-in view of the area sampled the most by the model, between 5 s < tdep < 7 s, 1.15 V < Edep < 1.4 V, and 0.1 M EDOT concentration, shows the order in which experiments were performed going from light (experiments performed first) to dark purple (experiments performed last). This illustrates the model testing the bounds of this smaller region of interest (Fig. 5C).
Conclusions
Taken together, we have demonstrated the use of a novel SDL for the synthesis and functional characterization of electrodeposited polymer films. Crucially, as this system was based on a new architecture, we performed extensive validation and calibration of the fluid handling and electrochemical subsystems. Finally, the autonomous optimization of PEDOT:PSS deposition conditions illustrates how this system can dynamically refine electrodeposition parameters. While the main novelty of this work is the demonstration of a novel SDL for evaluating functional polymer films, studying PEDOT using this tool provides a unique avenue for understanding its electrochromic performance. Specifically, while the electrochromic performance of PEDOT films has been evaluated in prior work,32–34,37,38 the extensive optimization that is possible using an SDL allowed us to determine a response surface connecting electrochromic performance and processing conditions. Thus, the general characteristics of this response surface are likely broadly transferrable. In particular, the response surface is smooth, exhibits a trade-off between voltage and deposition time in order to achieve high performance, and requires high precursor concentrations. Given the modular and low-cost nature of this system, it has potentially broad applicability. Ultimately, our findings support the continued development and investment in autonomous research platforms. As SDLs become more accessible across the materials community, bespoke SDL construction in a broad range of labs can provide low-cost and efficient means of studying new materials systems. As these systems evolve to become more sophisticated and user-friendly, they show promise of opening up new avenues in materials science and engineering.Author contributions
Harley Quinn: data curation, formal analysis, investigation, methodology, resources, software, writing – original draft, validation, and visualization. Gregory A. Robben: data curation, investigation, methodology, software, and writing – review and editing. Zhaoyi Zhang: investigation, resources, writing – review and editing, and validation. Alan L. Gardner: conceptualization, software, writing – review and editing. Jörg G. Werner: conceptualization, funding acquisition, supervision, and writing – review and editing. Keith A. Brown: conceptualization, funding acquisition, project administration, supervision, and writing – original draft.Data availability
The code used to control the PANDA can be found at https://github.com/BU-KABlab/PANDA-SDL. All data is presented in the main text and ESI.†Conflicts of interest
There are no conflicts to declare.Acknowledgements
This work was supported by the National Science Foundation (CBET-2146597), the Toyota Research Institute, and the Boston University College of Engineering for support through the Dean's Catalyst Award. The authors are grateful to the Boston University Photonics Center and Engineering Product Innovation Center for providing access to instrumentation and resources critical to this work.Notes and references
- M. Abolhasani and E. Kumacheva, The Rise of Self-Driving Labs in Chemical and Materials Sciences, Nat. Synth., 2023, 2(6), 483–492, DOI:10.1038/s44160-022-00231-0
.
- E. Stach, B. DeCost, A. G. Kusne, J. Hattrick-Simpers, K. A. Brown, K. G. Reyes, J. Schrier, S. Billinge, T. Buonassisi, I. Foster, C. P. Gomes, J. M. Gregoire, A. Mehta, J. Montoya, E. Olivetti, C. Park, E. Rotenberg, S. K. Saikin, S. Smullin, V. Stanev and B. Maruyama, Autonomous Experimentation Systems for Materials Development: A Community Perspective, Matter, 2021, 4(9), 2702–2726, DOI:10.1016/j.matt.2021.06.036
- X. Du, L. Lüer, T. Heumueller, J. Wagner, C. Berger, T. Osterrieder, J. Wortmann, S. Langner, U. Vongsaysy, M. Bertrand, N. Li, T. Stubhan, J. Hauch and C. J. Brabec, Elucidating the Full Potential of OPV Materials Utilizing a High-Throughput Robot-Based Platform and Machine Learning, Joule, 2021, 5(2), 495–506, DOI:10.1016/j.joule.2020.12.013
- A. Dave, Autonomous Optimization of Non-Aqueous Li-Ion Battery Electrolytes via Robotic Experimentation and Machine Learning Coupling, Nat. Commun., 2022, 13, 5454, DOI:10.1038/s41467-022-32938-1
- A. A. Volk, R. W. Epps, D. T. Yonemoto, B. S. Masters, F. N. Castellano, K. G. Reyes and M. Abolhasani, AlphaFlow: Autonomous Discovery and Optimization of Multi-Step Chemistry Using a Self-Driven Fluidic Lab Guided by Reinforcement Learning, Nat. Commun., 2023, 14(1), 1403, DOI:10.1038/s41467-023-37139-y
- K. L. Snapp, B. Verdier, A. E. Gongora, S. Silverman, A. D. Adesiji, E. F. Morgan, T. J. Lawton, E. Whiting and K. A. Brown, Superlative Mechanical Energy Absorbing Efficiency Discovered through Self-Driving Lab-Human Partnership, Nat. Commun., 2024, 15(1), 4290, DOI:10.1038/s41467-024-48534-4
- B. Burger, P. M. Maffettone, V. V. Gusev, C. M. Aitchison, Y. Bai, X. Wang, X. Li, B. M. Alston, B. Li, R. Clowes, N. Rankin, B. Harris, R. S. Sprick and A. I. Cooper, A Mobile Robotic Chemist, Nature, 2020, 583(7815), 237–241, DOI:10.1038/s41586-020-2442-2
- F. Strieth-Kalthoff, H. Hao, V. Rathore, J. Derasp, T. Gaudin, N. H. Angello, M. Seifrid, E. Trushina, M. Guy, J. Liu, X. Tang, M. Mamada, W. Wang, T. Tsagaantsooj, C. Lavigne, R. Pollice, T. C. Wu, K. Hotta, L. Bodo, S. Li, M. Haddadnia, A. Wołos, R. Roszak, C. T. Ser, C. Bozal-Ginesta, R. J. Hickman, J. Vestfrid, A. Aguilar-Granda, E. L. Klimareva, R. C. Sigerson, W. Hou, D. Gahler, S. Lach, A. Warzybok, O. Borodin, S. Rohrbach, B. Sanchez-Lengeling, C. Adachi, B. A. Grzybowski, L. Cronin, J. E. Hein, M. D. Burke and A. Aspuru-Guzik, Delocalized, Asynchronous, Closed-Loop Discovery of Organic Laser Emitters, Science, 2024, 384(6697), eadk9227, DOI:10.1126/science.adk9227
- D. A. Boiko, R. MacKnight, B. Kline and G. Gomes, Autonomous Chemical Research with Large Language Models, Nature, 2023, 624(7992), 570–578, DOI:10.1038/s41586-023-06792-0
- M. Sim, M. G. Vakili, F. Strieth-Kalthoff, H. Hao, R. J. Hickman, S. Miret, S. Pablo-García and A. Aspuru-Guzik, ChemOS 2.0: An Orchestration Architecture for Chemical Self-Driving Laboratories, Matter, 2024, S2590238524001954, DOI:10.1016/j.matt.2024.04.022
- T. Erichsen, S. Reiter, V. Ryabova, E. M. Bonsen, W. Schuhmann, W. Märkle, C. Tittel, G. Jung and B. Speiser, Combinatorial Microelectrochemistry: Development and Evaluation of an Electrochemical Robotic System, Rev. Sci. Instrum., 2005, 76(6), 062204, DOI:10.1063/1.1906106
- J. Zitka, J. Sileny, J. Kudr, Z. Koudelkova, L. Ilieva, L. Richtera, T. Syrovy, V. Adam and O. Zitka, Fully Automated Station for Testing, Characterizing and Modifying Screen-Printed Electrodes, Anal. Methods, 2022, 14(39), 3824–3830, 10.1039/D2AY01123A
- B. H. R. Gerroll, K. M. Kulesa, C. A. Ault and L. A. Baker, Legion: An Instrument for High-Throughput Electrochemistry, ACS Meas. Sci. Au, 2023, 3(5), 371–379, DOI:10.1021/acsmeasuresciau.3c00022
- J. Rein, J. R. Annand, M. K. Wismer, J. Fu, J. C. Siu, A. Klapars, N. A. Strotman, D. Kalyani, D. Lehnherr and S. Lin, Unlocking the Potential of High-Throughput Experimentation for Electrochemistry with a Standardized Microscale Reactor, ACS Cent. Sci., 2021, 7(8), 1347–1355, DOI:10.1021/acscentsci.1c00328
- D. Godfrey, J. H. Bannock, O. Kuzmina, T. Welton and T. Albrecht, A Robotic Platform for High-Throughput Electrochemical Analysis of Chalcopyrite Leaching, Green Chem., 2016, 18(7), 1930–1937, 10.1039/C5GC02306H
- M. Kodera and K. Sayama, An Automatic Robot System for Machine Learning–Assisted High-Throughput Screening of Composite Electrocatalysts, Digital Discovery, 2023, 2(6), 1683–1687, 10.1039/D3DD00116D
- I. Oh, M. A. Pence, N. G. Lukhanin, O. Rodríguez, C. M. Schroeder and J. Rodríguez-López, The Electrolab: An Open-Source, Modular Platform for Automated Characterization of Redox-Active Electrolytes, Device, 2023, 1(5), 100103, DOI:10.1016/j.device.2023.100103
- H. Sheng, J. Sun, O. Rodríguez, B. B. Hoar, W. Zhang, D. Xiang, T. Tang, A. Hazra, D. S. Min, A. G. Doyle, M. S. Sigman, C. Costentin, Q. Gu, J. Rodríguez-López and C. Liu, Autonomous Closed-Loop Mechanistic Investigation of Molecular Electrochemistry via Automation, Nat. Commun., 2024, 15(1), 2781, DOI:10.1038/s41467-024-47210-x
- O. Rodriguez, M. A. Pence and J. Rodriguez-Lopez, Hard Potato: A Python Library to Control Commercial Potentiostats and to Automate Electrochemical Experiments, Anal. Chem., 2023, 95(11), 4840–4845, DOI:10.1021/acs.analchem.2c04862
- R. Duke, S. Mahmoudi, A. P. Kaur, V. Bhat, I. C. Dingle, N. C. Stumme, S. K. Shaw, D. Eaton, A. Vego and C. Risko, ExpFlow: A Graphical User Interface for Automated Reproducible Electrochemistry, Digital Discovery, 2024, 3(1), 163–172, 10.1039/D3DD00156C
- C. Xia, X. Fan, M. Park and R. C. Advincula, Ultrathin Film Electrodeposition of Polythiophene Conjugated Networks through a Polymer Precursor Route, Langmuir, 2001, 17(25), 7893–7898, DOI:10.1021/la011259d
- A. Palma-Cando, I. Rendón-Enríquez, M. Tausch and U. Scherf, Thin Functional Polymer Films by Electropolymerization, Nanomaterials, 2019, 9(8), 1125, DOI:10.3390/nano9081125
- W. Wang, Z. Zheng, A. B. Resing, K. A. Brown and J. G. Werner, Conformal Electrodeposition of Ultrathin Polymeric Films with Tunable Properties from Dual-Functional Monomers, Mol. Syst. Des. Eng., 2023, 8(5), 624–631, 10.1039/d2me00246a
- S. Sun, A. Tiihonen, F. Oviedo, Z. Liu, J. Thapa, Y. Zhao, N. T. P. Hartono, A. Goyal, T. Heumueller, C. Batali, A. Encinas, J. J. Yoo, R. Li, Z. Ren, I. M. Peters, C. J. Brabec, M. G. Bawendi, V. Stevanovic, J. Fisher and T. Buonassisi, A Data Fusion Approach to Optimize Compositional Stability of Halide Perovskites, Matter, 2021, 4(4), 1305–1322, DOI:10.1016/j.matt.2021.01.008
- B. P. MacLeod, F. G. L. Parlane, T. D. Morrissey, F. Häse, L. M. Roch, K. E. Dettelbach, R. Moreira, L. P. E. Yunker, M. B. Rooney, J. R. Deeth, V. Lai, G. J. Ng, H. Situ, R. H. Zhang, M. S. Elliott, T. H. Haley, D. J. Dvorak, A. Aspuru-Guzik, J. E. Hein and C. P. Berlinguette, Self-Driving Laboratory for Accelerated Discovery of Thin-Film Materials, Sci. Adv., 2020, 6(20), eaaz8867, DOI:10.1126/sciadv.aaz8867
- C. C. Rupnow, B. P. MacLeod, M. Mokhtari, K. Ocean, K. E. Dettelbach, D. Lin, F. G. L. Parlane, H. N. Chiu, M. B. Rooney, C. E. B. Waizenegger, E. I. De Hoog, A. Soni and C. P. Berlinguette, A Self-Driving Laboratory Optimizes a Scalable Process for Making Functional Coatings, Cell Rep. Phys. Sci., 2023, 4(5), 101411, DOI:10.1016/j.xcrp.2023.101411
- A. Vriza, H. Chan and J. Xu, Self-Driving Laboratory for Polymer Electronics, Chem. Mater., 2023, 35(8), 3046–3056, DOI:10.1021/acs.chemmater.2c03593
- D. Bash, F. H. Chenardy, Z. Ren, J. J. Cheng, T. Buonassisi, R. Oliveira, J. N. Kumar and K. Hippalgaonkar, Accelerated Automated Screening of Viscous Graphene Suspensions with Various Surfactants for Optimal Electrical Conductivity, Digital Discovery, 2022, 1(2), 139–146, 10.1039/D1DD00008J
- R. Wang, L. Lüer, S. Langner, T. Heumueller, K. Forberich, H. Zhang, J. Hauch, N. Li and C. J. Brabec, Understanding the Microstructure Formation of Polymer Films by Spontaneous Solution Spreading Coating with a High-Throughput Engineering Platform, ChemSusChem, 2021, 14(17), 3590–3598, DOI:10.1002/cssc.202100927
- P. A. Rock, The Standard Oxidation Potential of the Ferrocyanide-Ferricyanide Electrode at 25° and the Entropy of Ferrocyanide Ion, J. Phys. Chem., 1966, 70(2), 576–580, DOI:10.1021/j100874a042
-
D. H. Alman, R. S. Berns, H. Komatsubara, W. Li, M. R. Luo, M. Melgosa, J. H. Nobbs, B. Rigg, A. R. Robertson and K. Witt, Improvement to Industrial Colour-Difference Evaluation, CIE Central Bureau, Vienna, Austria, 2001 Search PubMed
- J. Kawahara, P. A. Ersman, I. Engquist and M. Berggren, Improving the Color Switch Contrast in PEDOT:PSS-Based Electrochromic Displays, Org. Electron., 2012, 13(3), 469–474, DOI:10.1016/j.orgel.2011.12.007
- J. Y. Kim, J.-Y. Oh, S. Cheon, H. Lee, J. Lee, J.-I. Lee, H. Ryu, S. M. Cho, T.-Y. Kim, C.-S. Ah, Y.-H. Kim and C.-S. Hwang, Optimized Ion Diffusion Depth for Maximizing Optical Contrast of Environmentally Friendly PEDOT:PSS Electrochromic Devices, Opt. Mater. Express, 2016, 6(10), 3127, DOI:10.1364/OME.6.003127
- D. Levasseur, I. Mjejri, T. Rolland and A. Rougier, Color Tuning by Oxide Addition in PEDOT:PSS-Based Electrochromic Devices, Polymers, 2019, 11(1), 179, DOI:10.3390/polym11010179
- Y.-F. Lim, C. K. Ng, U. S. Vaitesswar and K. Hippalgaonkar, Extrapolative Bayesian Optimization with Gaussian Process and Neural Network Ensemble Surrogate Models, Adv. Intell. Syst., 2021, 3(11), 2100101, DOI:10.1002/aisy.202100101
- Q. Liang, A. E. Gongora, Z. Ren, A. Tiihonen, Z. Liu, S. Sun, J. R. Deneault, D. Bash, F. Mekki-Berrada, S. A. Khan, K. Hippalgaonkar, B. Maruyama, K. A. Brown, J. Fisher Iii and T. Buonassisi, Benchmarking the Performance of Bayesian Optimization across Multiple Experimental Materials Science Domains, npj Comput. Mater., 2021, 7(1), 188, DOI:10.1038/s41524-021-00656-9
- H. Jiang, W. Wu, Z. Chang, H. Zeng, R. Liang, W. Zhang, W. Zhang, G. Wu, Z. Li and H. Wang,
In Situ Polymerization of PEDOT:PSS Films Based on EMI-TFSI and the Analysis of Electrochromic Performance, e-Polym., 2021, 21(1), 722–733, DOI:10.1515/epoly-2021-0073
- C. J. Kousseff, F. E. Taifakou, W. G. Neal, M. Palma and C. B. Nielsen, Controlling Morphology, Adhesion, and Electrochromic Behavior of PEDOT Films through Molecular Design and Processing, J. Polym. Sci., 2022, 60(3), 504–516, DOI:10.1002/pol.20210522
Footnote |
| † Electronic supplementary information (ESI) available. See DOI: https://doi.org/10.1039/d4mh00797b |
| This journal is © The Royal Society of Chemistry 2024 |