
 Open Access Article
 This Open Access Article is licensed under a Creative Commons Attribution-Non Commercial 3.0 Unported Licence
Groundwaters in Northeastern Pennsylvania near intense hydraulic fracturing activities exhibit few organic chemical impacts†
Boya
Xiong
 a,
Mario A.
Soriano
Jr
b,
Kristina M.
Gutchess
b,
Nicholas
Hoffman
a,
Cassandra J.
Clark
c,
Helen G.
Siegel
b,
Glen Andrew D
De Vera
a,
Yunpo
Li
a,
Rebecca J.
Brenneis
a,
Austin J.
Cox
a,
Emma C.
Ryan
cd,
Andrew J.
Sumner
a,
Nicole C.
Deziel
c,
James E.
Saiers
b and
Desiree L.
Plata
*a
a,
Mario A.
Soriano
Jr
b,
Kristina M.
Gutchess
b,
Nicholas
Hoffman
a,
Cassandra J.
Clark
c,
Helen G.
Siegel
b,
Glen Andrew D
De Vera
a,
Yunpo
Li
a,
Rebecca J.
Brenneis
a,
Austin J.
Cox
a,
Emma C.
Ryan
cd,
Andrew J.
Sumner
a,
Nicole C.
Deziel
c,
James E.
Saiers
b and
Desiree L.
Plata
*a
aDepartment of Civil and Environmental Engineering, Massachusetts Institute of Technology, Cambridge, Massachusetts, USA. E-mail: dplata@mit.edu
bSchool of the Environment, Yale University, New Haven, Connecticut, USA
cDepartment of Environmental Health Sciences, School of Public Health, Yale University, New Haven, Connecticut, USA
dTufts University, Department of Public Health and Community Medicine, 136 Harrison Avenue, Boston, MA 02111, USA
First published on 12th January 2022
Abstract
Horizontal drilling with hydraulic fracturing (HDHF) relies on the use of anthropogenic organic chemicals in proximity to residential areas, raising concern for groundwater contamination. Here, we extensively characterized organic contaminants in 94 domestic groundwater sites in Northeastern Pennsylvania after ten years of activity in the region. All analyzed volatile and semi-volatile compounds were below recommended United States Environmental Protection Agency maximum contaminant levels, and integrated concentrations across two volatility ranges, gasoline range organic compounds (GRO) and diesel range organic compounds (DRO), were low (0.13 ± 0.06 to 2.2 ± 0.7 ppb and 5.2–101.6 ppb, respectively). Following dozens of correlation analyses with distance-to-well metrics and inter-chemical indicator correlations, no statistically significant correlations were found except: (1) GRO levels were higher within 2 km of violations and (2) correlation between DRO and a few inorganic species (e.g., Ba and Sr) and methane. The correlation of DRO with inorganic species suggests a potential high salinity source, whereas elevated GRO may result from nearby safety violations. Highest-concentration DRO samples contained bis-2-ethylhexyl phthalate and N,N-dimethyltetradecylamine. Nevertheless, the overall low rate of contamination for the analytes could be explained by a spatially-resolved hydrogeologic model, where estimated transport distances from gas wells over the relevant timeframes were short relative to the distance to the nearest groundwater wells. Together, the observations and modeled results suggest a low probability of systematic groundwater organic contamination in the region.
Environmental significanceThis work illustrates that a large sampling of groundwater wells in Northeastern Pennsylvania have not been substantially contaminated with hydrophobic organic contaminants spanning a spectrum of volatilities (volatile organic, gasoline-, or diesel-range organic compounds) even after a decade of intense hydraulic fracturing activity. The reasons for this can include the relatively protective nature of groundwater flow in the area, long transport times of sorption-retarded chemicals, and a lack of systematic chemical releases from oil and gas well operations. Nevertheless, accidental chemical releases are commonly documented, albeit with limited specificity. |
Introduction
Over the past 15 years, horizontal drilling with hydraulic fracturing (HDHF) has enabled the United States (U.S.) to become a net energy exporter by boosting natural gas and oil production from shale and other low-permeable formations.1 This activity has been extensive in rural Pennsylvania, where over half of the residents rely on shallow groundwater as a source of drinking water. As a result, the public and scientific communities have expressed concern over the potential for HDHF and attendant activities to contaminate shallow groundwater.2–5 Given the limited experimental evaluation, it remains unclear whether the increasing number and density of HDHF activities leads to elevated organic compound contamination in shallow groundwater over prolonged periods of time or broad distributions of space.To date, studies of groundwater organic contamination by HDHF have primarily focused on groundwater quality impairment by methane,5–13 traced to failure of gas-well integrity in some cases. In contrast, data on a broad spectrum of organic contaminants remain scarce, where the number of targeted compounds is limited. In 2013, Gross et al.14 revealed groundwater contamination due to surface spills in Colorado, using publicly available data (n = 62) that included the concentration of benzene, toluene, ethylbenzene, and xylene. More recently, a search for 21 volatile organic compounds (VOCs) in the Marcellus region (50 homes) indicated 7 compounds were detected universally, but with concentrations well below EPA Maximum Contaminant Levels (MCLs).15 A similar study targeted 25 VOCs over the Eagle Ford, Haynesville, and Fayetteville regions in southern Texas (n = 116), and detected benzene in 2–13% of the samples at levels well below the MCL.16 Additional data that encompass expanded analyte lists are needed, especially considering the wide range of compounds that are used in hydraulic fracturing fluids or detected in wastewaters.17–19 For example, Llewellyn et al.20 adopted non-targeted two-dimensional gas chromatography with mass spectrometry, ultimately detecting 2-butoxyethanol associated with a single chemical release event. While providing critical information, such focused studies preclude identification of pervasive contamination pathways (such as surface spills, wastewater pond leakage, and subsurface transport in a fracture). To this end, Drollette et al.21 found select diesel and gasoline-range organic compounds in a small subset of groundwater samples (n = 64) collected in Northeastern Pennsylvania (PA) over 2012–2014. In that case, ancillary geochemical indicators22 were consistent with a surface-derived source, rather than the upward migration of formation brine over geologic or short time horizons. One caveat presented by the authors was that the industry was relatively young at the time, and groundwater contamination mechanisms via shallow groundwater routes that occur on slower timescales may have not yet evolved. Weighing this hypothesis and considering the influence of episodic events observed to date,14,20,21,23 there is a clear need to revisit areas of heavy HDHF development with broad spectrum organic compound analyses in groundwater studies of large sample size and spatiotemporal distribution to enable elucidation of any emergent, prevalent contamination mechanisms.
Although occurrences of organic chemicals in groundwater have been linked to HDHF incidents in select cases, chemical concentrations at levels exceeding health standards are rare to date.15,21 This could arise from: (1) episodic releases of HDHF-associated fluids limiting likelihood of contamination; (2) limited travel distances due to low porewater velocities and/or sorption-retarded transport; (3) natural biochemical degradation of target analytes prior to impacting drinking-water receptors; or (4) insufficient availability of samples at the necessary spatial and temporal resolution to capture transient events. As an example of these instances, Brantley et al.24 reported 20% of gas wells had at least one non-administrative notice of violation in PA, and Maloney et al.25 reported 31% of unconventional wells across 4 states had spills. Demonstrating the constraining impact of water lifetime, McMahon et al.15,16 estimated the distribution of groundwater age (quantified by 3H level) above four major HDHF active formations and found that groundwater age predated shale-gas drilling. In other words, waters were recharged prior to commencement of HDHF activities, suggesting a low likelihood of HDHF contaminating groundwater. Relatedly, Rogers et al.18 illustrated that only 15 of 659 disclosed organic fracturing fluid compounds had sufficiently fast transport times and high chemical persistence (i.e., resistance to natural degradation as measured by chemical half-lives) to survive transit from an HDHF well to a groundwater well (at least 10 of those 15 were confirmed to be within the analytical window investigated here). Finally, the low frequency of elevated organic contamination detection may result from the small number of targeted organic analytes compared to the large number of organic chemicals used in fracturing fluids or infrequent temporal–spatial sampling. This is certainly the case for the voluntary testing of private wells by homeowners in these regions, where organic contaminant analyses are rarely conducted.26 Such management practice imparts uncertainty on drinking water quality, where homeowners assume some risk of exposure to health-relevant pollutants without awareness or systematic means of detection.
To determine the degree of such risk, we undertook a broad spectrum organic chemical analysis of shallow groundwater in Northeastern PA of the largest sample size to date (n = 94). In this region, more than 1000 unconventional gas wells have been completed since 2008 and much of the rural population relies on private wells for drinking water. Specifically, we quantified volatile organic compounds, an integrated measure of gasoline- and diesel-range organic hydrocarbons, and then qualitatively evaluated a subset of those using two-dimensional gas chromatography coupled with time-of-flight mass spectrometry (GC × GC-TOF-MS). It is important to note that the gasoline- and diesel-range organic hydrocarbons (GRO and DRO, respectively) capture a volatility range shared by compounds in gasoline and diesel fuel (from volatile to semi-volatile), but GRO and DRO are not necessarily derived from any gasoline or diesel sources. Hoelzer et al.27 have previously expounded upon the composition of GRO and DRO range in a set of hydraulic fracturing flowback and produced waters. The analysis presented here does not stipulate that GRO or DRO are derived from oil and gas drilling activities; the analytical range is simply valuable to interrogate fingerprints of oil and gas activity. To elucidate possible sources of organic chemicals to nearby groundwaters, we explored relationships between their occurrence and various geochemical indicators (both conservative and non-conservative), as well as Pennsylvania Department of Environmental Protection (PA DEP) violation reports. Further, we applied a spatially explicit model of coupled groundwater flow and solute transport to estimate transport over a wide range of organic chemical behavior. These model results can be contrasted to direct distance-to-well or well-density metrics for assessing risk. The easier-to-determine metrics are readily available to most interested parties, such as well operators, homeowners, public health experts who postulate that distance and exposure are related, and to policy makers. Indeed, because upstream/downstream groundwater modeling is both costly and difficult to be conducted with the necessary resolution and speed to inform where UOG wells should be permitted, legislation for such permits often relies on setback distance—a linear distance required between a UOG well and a private home. Thus, the linear distance and other well distribution metrics we applied are most valuable from both a policy and a public health proxy perspective. We seek to evaluate if these metrics or other mechanistic indicators are valuable for projecting risk of groundwater contamination proximal to HDHF activities.
Experimental methods
Groundwater sampling sites and sampling procedure
Ninety-four private water sources (n = 90 groundwater wells; n = 4 springs) within Bradford County, PA and neighboring Tioga County, PA (n = 5) (Fig. 1) were sampled from June through September 2018. The approach to recruiting participants, permissions and Institutional Review Board documentation are described in Clark et al. (in revision)28 and detailed in the ESI.† All wells were purged until temperature, pH, dissolved oxygen, and specific conductance remained stable over three consecutive readings that were recorded at 3 min intervals (YSI ProPlus Multiparameter Meter; YSI 556 Meter). Samples were collected as close to the wellhead as possible and upstream of water treatment systems, filtered for select analyses noted below, and preserved according to U.S. Geological Survey standards.29 For VOC and gasoline range organic compound (GRO) analyses, samples were collected in pre-combusted 40 mL sealed glass vials containing 1 mL of 50% v/v hydrochloric acid and stored on ice or at 4 °C. Samples for diesel range organic compound (DRO) analysis were collected in a pre-combusted, 250 mL amber jar, filled half way, capped with Teflon lined caps, and frozen until analysis. Water samples for methane headspace analysis were collected in 57 mL or 157 mL serum vials (Wheaton), treated with sodium azide tablets (Sigma Aldrich) to yield a final concentration of approximately 4 mM, and closed with pre-treated butyl rubber stoppers (Bellco Glass, Inc.) and aluminum crimp caps. Detailed sampling methods can be found in Li et al. 2021.30 | ||
| Fig. 1 Groundwater well sampling sites and unconventional oil and gas (UOG) wells developed since 2000 in Bradford County, PA. The inset highlights Bradford County. Colored triangles indicate UOG wells listed by spud date; black stars show the sampled drinking water wells. Note that UOG refers to wells that were registered for use with horizontal drilling with hydraulic fracturing (HDHF) technologies. Both oil and gas are produced in this region, but gas is the dominant product.31 Spud dates are publicly available and reflect well drilling dates, but not necessarily chemical injection or production timelines. | ||
Samples for major cations were filtered with a 0.45 μm polyether sulfone filter, acidified and collected in acid-washed high-density polyethylene (HDPE) bottles. Samples for anion analysis were also filtered, but un-acidified and frozen shortly after collection until analysis. Field blanks were collected daily for each type of sample using lab, 18 MΩ MilliQ water.
Chemical analysis
VOCs and GRO were quantified within two months of sample collection using purge and trap coupled with gas chromatography with a flame ionization detector (GC-FID; Agilent 7890B; 59 VOC detection limits in Table S1†). Following liquid–liquid extraction with dichloromethane,32 DROs were quantified using GC-FID (Table S1†). Lab blanks were analyzed daily. A subset of these extracts were analyzed using a Leco Pegasus® 4D GC × GC-TOF-MS21 for compound-specific analysis. Some samples were analyzed for hydrophilic organic compounds (e.g., liquid chromatography-amenable compounds) content via solid phase extraction with methanol (see ESI†) and subsequent analysis via an Agilent liquid chromatography-tripleQ-mass spectrometer. Methane was analyzed using a simple headspace equilibrium method adapted from Magen et al.33 and an SRI 8610C GC-FID.Major cations, major anions, and trace metals were analyzed by inductively couple plasma optical emission spectrometry, ion chromatography, and inductively coupled mass spectrometry, respectively (see ESI†). Major anion and cation information was used to delineate water types according to four previously defined22 classifications: low-salinity waters (Cl less than 20 ppm) dominated by Ca–HCO3 (Type A) or Na–HCO3 (Type B) and high-salinity waters (Cl greater than 20 ppm) with molar-based Br/Cl less than 0.001 (Type C) or greater than 0.001 (Type D).
Database and statistical analysis
The Pennsylvania Spatial Data Access34 well database was used to identify the oil and gas wells nearest to the groundwater wells. We included both conventional and unconventional oil and gas wells because both activities may lead to organic contamination; only three out of the 94 nearest oil and gas wells were conventional wells, and those were all plugged. Most of these oil and gas wells (77) were classified as active, whereas 17 were plugged or inactive. Only two wells were classified as ‘undetermined’ or ‘combined oil and gas’ well type; all remaining wells were ‘oil or gas’ well type.To calculate the distance between groundwater wells and the nearest oil and gas wells with some type of documented violation, information on wells with violations was extracted from the PA DEP violation reports35 in Bradford, Wyoming, Tioga, Sullivan Counties (to capture nearest wells on the border of Bradford County) with inspection dates ranging from 2007 to June 2018. First, violations were divided into six categories using their “violation code” outlined in Bradford compliance data: (i) spills/potential spills, (ii) erosion and potential erosion, (iii) cementing/casing failure, (iv) improper impoundments, (v) site restoration, and (vi) solid waste issue. Each category has a set of enforcements (Table S2†), which we have adapted from Rahm et al. 2015.36 Then, the remaining entries of violation that were not under the enforcement codes were manually searched for keywords within the “inspection comments” to include incorrectly indexed violations. Specific keywords included: erosion, fluid, brine, spill, contaminated, leak, and release for the spill/potential spill and erosion types. For other categories, keywords included cementing, casing, impoundment, leak, and failure. Note here that “casing” includes high casing pressure violations. Some violations fell under two or more categories. Of 32![[thin space (1/6-em)]](https://www.rsc.org/images/entities/char_2009.gif) 980 violation entries, 1191 distinct violations were selected based on procedure described above. Of all violations, only two were associated with conventional wells, all were associated with a gas well type, and six were associated with inactive wells. In addition, we examined the possibility of relationship with distance to gas stations or leaking underground storage tanks (LUST).37 Statistical analyses were performed using built-in functions in OriginLab® Pro.
980 violation entries, 1191 distinct violations were selected based on procedure described above. Of all violations, only two were associated with conventional wells, all were associated with a gas well type, and six were associated with inactive wells. In addition, we examined the possibility of relationship with distance to gas stations or leaking underground storage tanks (LUST).37 Statistical analyses were performed using built-in functions in OriginLab® Pro.
Chemical transport and groundwater flow modeling
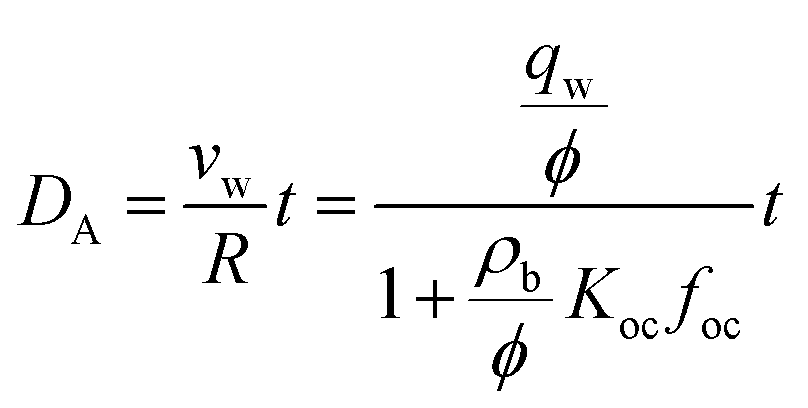
We estimated the spatiotemporal distribution of groundwater velocities and subsequently simulated transport away from gas-well locations using a calibrated, three-dimensional flow model.38 The control volume finite-element hydrologic simulator, Hydrogeosphere,39 was used to model coupled flow and transport over a 190 km2 area in southeastern Bradford County that encompassed eight of the sampled domestic wells and 30 unconventional well pads. The eight domestic groundwater wells were selected to include both high and low observed DRO levels to capture potential positive and negative controls. The model domain was horizontally discretized into triangular elements with a maximum side length of 30 meters and vertically discretized into 21 layers that extended from the ground surface to an average depth of 300 m (i.e., distributed vertically), which roughly corresponds to the base of fresh groundwater in the region.40,41 Hydraulic conductivity, K, was adjusted in model calibration through a Gauss–Marquardt–Levenberg optimization scheme42 and successfully validated by multiple existing datasets (see ESI†).Groundwater velocities were computed from the calibrated model and were used within a Monte Carlo framework to infer the distribution in transport length scales for weakly- and strongly-adsorbing organic contaminants (e.g., acrylamide (logKoc = 0.55) and bis-2-ethylhexyl phthalate (logKoc = 4.99), where Koc is in L kgoc−1).43 Note that these were chosen to represent extrema that capture a range of sorptivity of the chemicals that are frequently disclosed (see ESI†). Assuming a linear, equilibrium reaction governs contaminant adsorption, the advective-transport distance of the contaminant (DA) varies proportionately with time (t), such that
 | (1) |
 | (2) |
000 Monte Carlo samples from uniform distributions of ϕ, ρb, foc and from a lognormal distribution of qw, which was estimated by fitting the log-normal probability density function to the 2 × 10⁷ calculations of qw made at each finite element within the groundwater model domain (Table S4†). Here, we underscore that the results represent a distribution of output values that capture the sensitivity to input parameter choice (i.e., the model accounts for variability of the input mean through the large number of simulations and combinations of possible parameters).
As a thought exercise, we also used the calibrated model to simulate forward-in-time location probability from hypothetical spills or underground leaks at each well pad in the domain. Thirty well pads in the modeled area were set as source locations, where 13 of these had documented spills between 2009–2014.44 Forward location probability describes the likely future position of a solute after its release from a known source location, where a unit probability “mass” is introduced at time zero via a line source extending from the surface to the bottom of the domain.45 We assume rapid vertical transport within the unsaturated zone in order to account for a worst-case aquifer contamination event. Location probabilities at 1, 5, 10, and 25 years post-spill were illustrated with maps.
Results and discussion
Trace levels of organic compounds detected in groundwater wells
In this region of intense HDHF activity, the concentrations of VOCs were generally well below MCLs (Fig. 2, Table S3†). One sample from southeastern Bradford County contained 4.1 ± 0.2 ppb trichloroethene, approaching the 5 ppb MCL (Table S3†). The five most frequently detected compounds were bromochloromethane (detected in 99% of samples; 0.17 ppb limit of quantification (LOQ)), trichloroethene (54%, 0.05 ppb LOQ), chloroform (35%, 0.18 ppb LOQ), toluene (28%, 0.05 ppb LOQ), bromomethane (26%, 0.08 ppb LOQ), 1,2-dichloroethane/benzene (co-eluting compounds under FID detection; 20% detection, 0.06 ppb LOQ) (Table S3†). GRO compounds were detected in all of samples at concentrations ranging from 0.08 to 2.2 ± 0.7 ppb, where 92% of these contained less than 1 ppb GRO. DRO compounds were also detected in all samples at concentrations ranging from 2.8 to 102 ppb, and 94% of these contained less than 30 ppb DRO (Fig. 2). These ranges are consistent with previous findings21 in this region collected over 2012–2014 (specifically, Drollette et al.21 found GRO concentrations from 0–8 ppb and DRO levels from 0–157 ppb; n = 64); indicating no substantial decline or increase over time.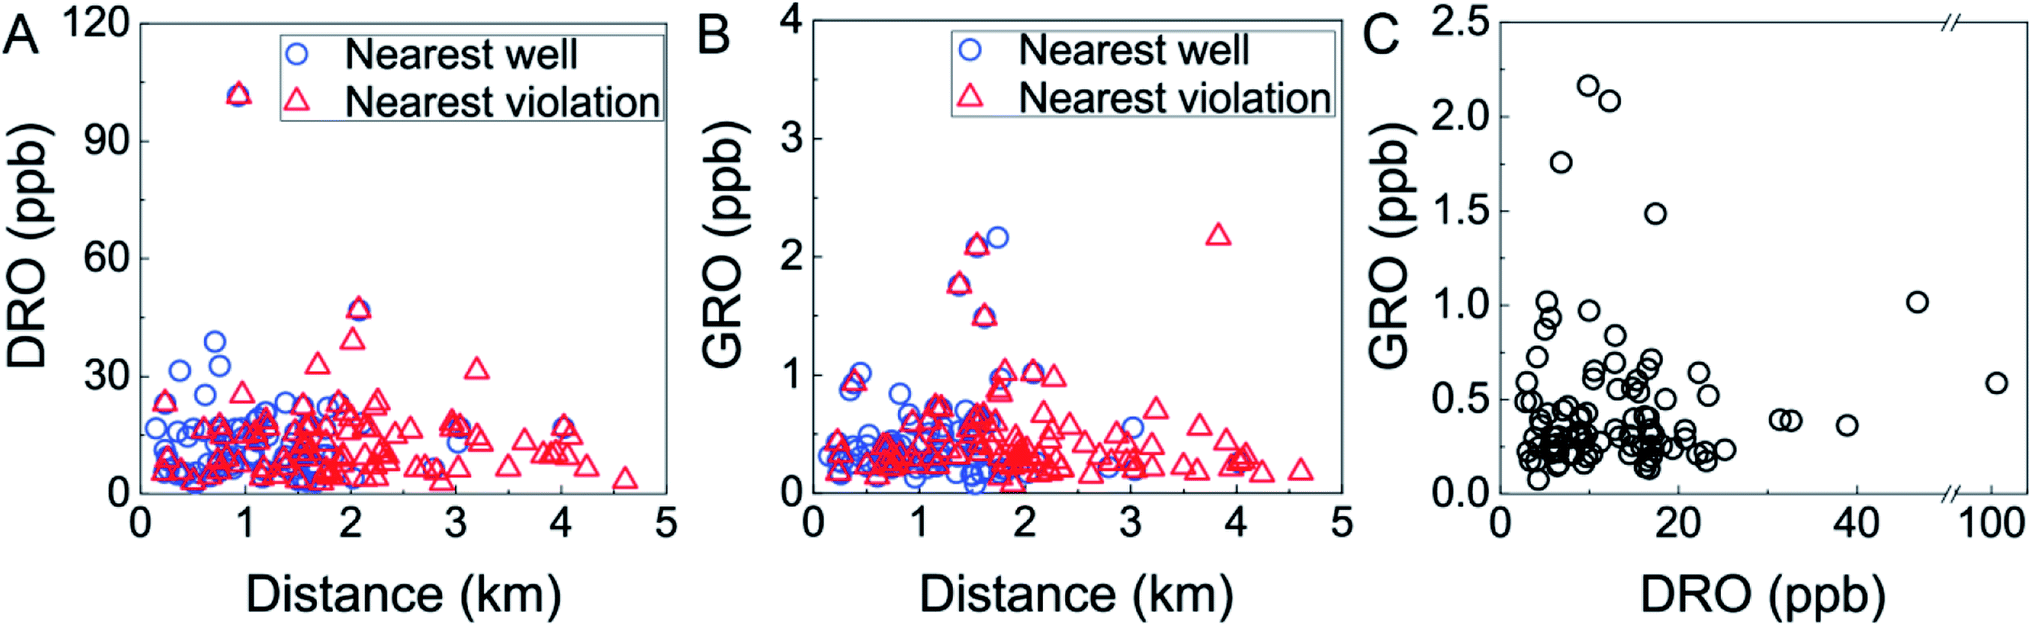 | ||
| Fig. 2 DRO and GRO proximity metrics. (A) Diesel range organic (DRO) levels were not correlated linearly with distance to nearest oil and gas well (Spearman correlations: p = 0.433, ρ = 0.084) or oil and gas well with violation (p = 0.772, ρ = 0.030). (B) Gasoline Range Organic (GRO) compounds were not correlated linearly with distance to nearest oil and gas well (Spearman correlations: p = 0.913, ρ = 0.011) or oil and gas well with violation (p = 0.124, ρ = −0.159). However, there was a significantly higher GRO level within 2 km of a violation versus violated wells beyond a 2 km set back distance (p = 0.02101, ρ = 0.73382). (C) GRO and DRO were not correlated (Spearman correlations, p = 0.628, ρ = 0.052). | ||
The five highest concentrations of GRO and DRO were measured in samples collected within 2 km of gas well operations (Fig. 2A and B), but were not correlated with one another (i.e., high GRO and DRO were not co-occurring; Fig. 2C). This lack of a clear GRO-to-DRO signature has been observed previously in groundwater21 and was investigated in flowback and produced water, where no consistent relationship or characteristic GRO-to-DRO was observed.27 Previously, Osborn et al.6 set a threshold value of 1 km to the nearest gas well as a critical delineator for elevated fugitive methane levels. Acknowledging that GRO or DRO compounds are less volatile and mobile than methane, we found that neither GRO nor DRO displayed statistically significant correlations with distance to nearest well (GRO: n = 94, p = 0.913, ρ = 0.011; DRO: n = 90, p = 0.433, ρ = 0.084; Spearman correlations, Fig. 2A and B). Similarly, no threshold or “cut off” distance (i.e., 1, 1.5, 2, 3 km) to nearest gas well yielded a statistically significant difference in GRO or DRO levels of samples (p > 0.05, Mann–Whitney U test). Interestingly, when exploring potential relationships between GRO or DRO levels with distance to nearest gas well with environmental health and safety (EHS) violations, we found GRO was statistically more likely to be elevated within 2 km of a gas well with a violation (p = 0.021, Mann–Whitney U test). We found no such statistically significant difference for DRO, irrespective of cut-off distance. Neither GRO nor DRO displayed a linear correlation with distance to nearest violation (GRO: p = 0.124, ρ = −0.159; DRO: p = 0.772, ρ = 0.030; Spearman Correlations, Fig. 2A and B). Note that previous relationships have been observed in this region between DRO and nearest EHS violation,21 whereas our data provides some evidence of relationship between GRO and nearest EHS violation. This may reflect the stochastic nature of spills and subsequent groundwater impingement, temporal variability between our study (2018) and the previous one (2011–2014), or result from discrepancy in the sample size and corresponding spatiotemporal distribution. Taken together, these results imply that distance to the nearest HDHF operation or currently documented violation alone cannot provide robust prediction of the occurrence of organic contamination in proximal water-supply aquifers. One might expect this result if release mechanisms are highly variable or the hydrogeological transport influences the distribution of contaminants.
Evaluation of pathways for organic chemical transport
For the samples containing elevated organic compound levels (n = 5, 0.93–2.17 ppb GRO; n = 5, 31.3–101.6 ppb DRO), we examined the potential source and pathway of organic occurrence associated with HDHF via fingerprinting of inorganic constituents (e.g., Br/Cl ratios), organic chemical composition, or dissolved methane concentration. Using the entire dataset (n = 94 GRO; n = 90 DRO), we examined five potential transport pathways: upward migration with deep formation brine, lateral transport from faulty wells, surface transport following accidental spills, leakage from waste ponds, and LUST or local traffic.Deep brine upward migration or lateral transport from faulty wells
We adapted a classification method22 that uses inorganic composition to distinguish groundwaters that are predominantly meteoric in origin from those comprised of a mixture of meteoric water and deep formation brines. These categories are low-salinity waters (Cl < 20 ppm) dominated by Ca–HCO3 (Type A) or Na–HCO3 (Type B) and high-salinity waters (Cl > 20 ppm) with Br/Cl less or greater than 0.001 (Type C or D, respectively). Type D waters reflect mixing of dilute, meteoric water with small proportions of brines sourced from middle-Devonian formations. Application of this classification yielded no statistically significant relationship between any specific water type and elevated organic compound levels (GRO p = 0.733; DRO p = 0.830; Kruskal–Wallis test, a non-parametric one-way ANOVA test, Fig. 3). In particular, Type D waters were not correlated with elevated GRO or DRO, indicating that intrusion of deep formation fluids into shallow groundwater was not responsible for the observed trace organic compounds. Moreover, if the organic compounds had migrated from depth, one might anticipate higher GRO concentrations (>2 ppb) relative to DRO concentrations (<20 ppb) (due to sorption-retarded transport and lower diffusivity of the later21), which was rarely observed (only 1 of 12 Type D with DRO). Note that only 13% (n = 14) of groundwaters in this study were classified as Type D, whereas 65% were categorized as Type A (Ca–HCO3 dominant; low salinity).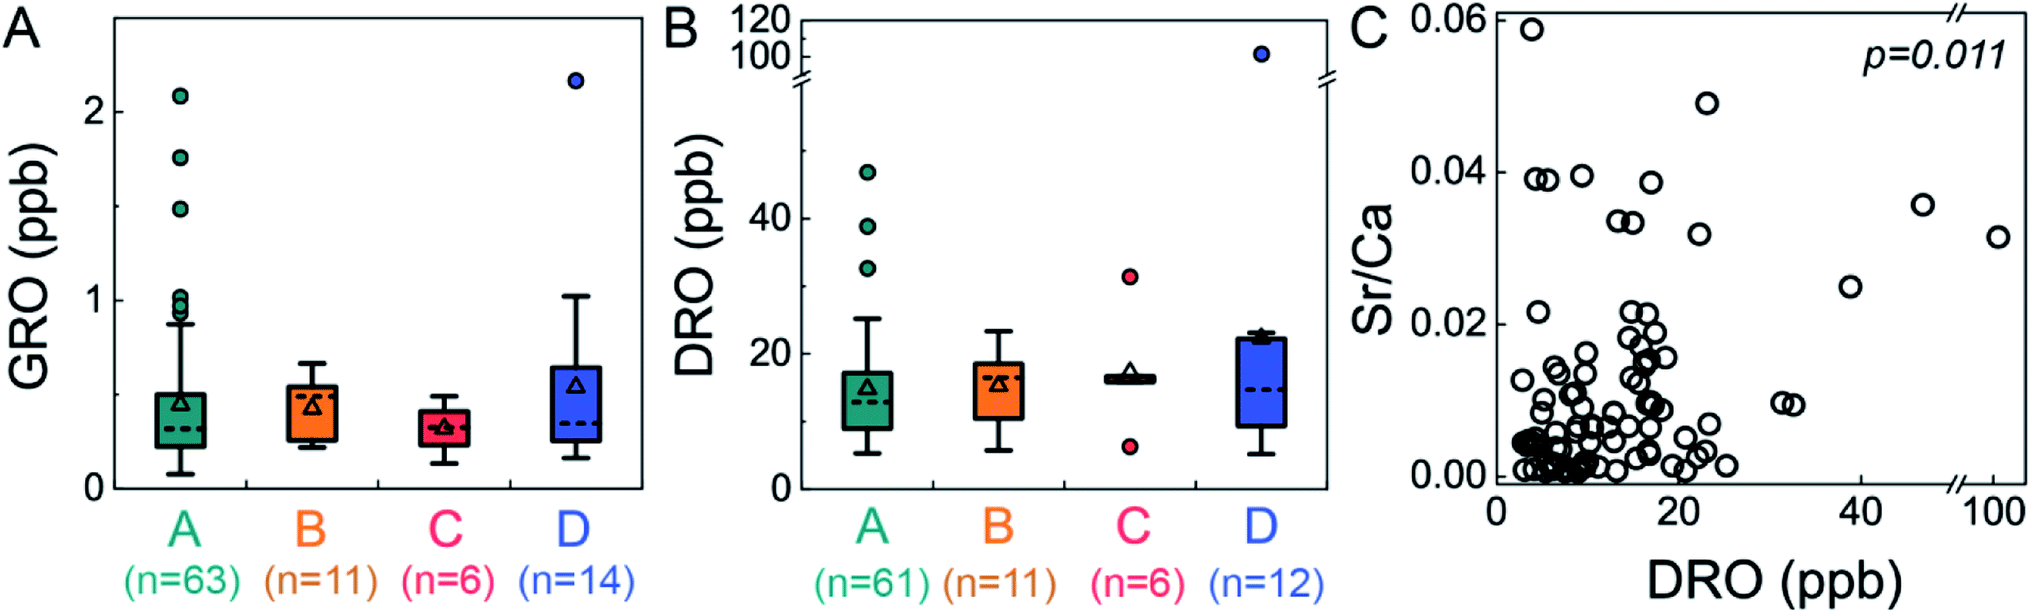 | ||
| Fig. 3 Neither GRO nor DRO levels were significantly different between water types, but DRO was correlated to Sr/Ca ratios. This suggests that upward migration of deep formation brine was not the dominant source of low-level GRO and DRO to shallow groundwater aquifers (GRO p = 0.733; DRO p = 0.830 via Kruskal–Wallis test). Nevertheless, DRO was correlated with Sr/Ca ratios with statistical significance (Spearman correlation, p = 0.011, ρ = −0.269), suggesting the DRO originated from saline fluids. DRO stands for diesel-range organic compounds, GRO stands for gasoline range organic compounds, and water Types A–D22 reflect low-salinity waters (Cl < 20 ppm) dominated by Ca–HCO3 (Type A) or Na–HCO3 (Type B) and high-salinity waters (Cl > 20 ppm) with Br/Cl less or greater than 0.001 (Type C or D, respectively). | ||
Beyond the water typing analysis, we considered correlations with inorganic species individually and found some statistically significant relationships. Interestingly, we found significant correlation between DRO and the level of Ba (Spearman correlation, p = 0.013, ρ = 0.260), Sr (p = 0.014, ρ = 0.258), Mn (p = 0.010, ρ = 0.271), the Sr/Ca ratio (p = 0.011, ρ = −0.269), NO3 (p = 0.043, ρ = −0.213), and Fe (p = 0.027, ρ = 0.233); no such correlation was found for other inorganic species (e.g., Pb, Li, Na, Cl, and Br) or between GRO and any inorganic species. Sr/Ca ratios have been used previously to distinguish formation fluid sources,22 where higher Sr/Ca ratios (0.03–0.17) were attributed to Marcellus formation fluid compared to lower Sr/Ca ratios (0.002–0.08) attributed to Upper Devonian sources. While there is some overlap in the range between these two formations, our data dominantly reflect an Upper Devonian sources, with only 12 samples are in the previously defined22 “Marcellus range”. The two samples with highest DRO levels were in the Upper Devonian range (Sr/Ca 0.031 to 0.035). Thus, these individual ion correlations may suggest elevated DRO could derive from higher salinity fluid, through natural or augmented pathways.
Finally, DRO or GRO levels were uncorrelated with self-reported private well depth (Fig. S1†) and topographic location (e.g., hillslope or valley, Fig. S2†). This is consistent with samples collected soon after the onset (circa 2008) of HDHF activities in Northeastern PA for methane and hydrocarbon gases5 (2011) and organic compounds21 (2011–2014). Taken together, our results imply that despite over ten years of HDHF activity in the region, there remains a lack of striking evidence linking occurrence of DRO and GRO in domestic groundwater with migration of deep brines. This can be reconciled with the significant DRO and Ba, and DRO and Sr/Ca ratios, if one invokes a path where the fluid brine and DRO are rapidly impinged on a groundwater source (e.g., through a direct spill or release).
Lateral transport via leaky casing or poorly cemented well annuluses to groundwater has been demonstrated previously for both light hydrocarbons (i.e., nC1–nC3)5 and postulated for a hydraulic fracturing chemical (e.g. 2-butoxyethanol).20 Such lateral transport from faulty wells would result in the occurrence of relatively low DRO, high GRO, and elevated levels of light hydrocarbon production gasses. However, there was no obvious enrichment of GRO relative to DRO. Here, we note that the starting composition of the GRO and DRO cannot be presumed; it is widely varying in flowback fluids due to both spatial, temporal, geological source and chemical additive effects.27 There was a significant correlation between DRO and methane concentration (Spearman correlation, p = 0.029, ρ = 0.242), but no such correlation was found between the GRO and methane concentration (Fig. S3;† nor was there a relationship with well age, Fig. S4†), indicating the relationship may not have been causative. In other words, if faulty well casing gave rise to both methane and DRO, GRO would be co-occurring necessarily, unless GRO was somehow absent in casing-derived fluids.
Surface spills or leaking waste ponds
In our data set, four samples contained low GRO co-occurring with high DRO. Two possible pathways of contamination could result in preferential loss of volatile GRO compounds relative to lower volatility DRO compounds: surface spills and leakage from compromised waste ponds. The lack of correlation between DRO level and distance to wells with applicable violations (Fig. 2A) suggests that subsurface transport following documented violations was not responsible for the observed DRO levels. Note that this finding (with n = 90) contrasts previous relationships (where n = 23) between DRO and distance-to-nearest well or violation,21 where surface spills gave rise to detected DRO signatures. It is possible that stochastic processes, rather than deterministic ones, can explain such observations and apparent discrepancies through time.Potential sources of DRO in the most concentrated samples (e.g., 30–100 ppb DRO) might be illuminated by compound specific analysis. First, the GC × GC-TOF-MS signatures lacked the fingerprints of gasoline, kerosene, and diesel range organic compounds (Fig. 4; no correlations with LUST or gas stations existed; Fig. S7 and S8†). Second, analyses of the top two DRO samples revealed the presence of bis-2-ethylhexyl phthalate in both samples, and N,N-dimethyltetradecylamine in the sample with the highest DRO concentration (Fig. 4). Both structures were confirmed with authentic standards. These chemicals were not found in the other samples where DROs were detected (0–100 ppb; n = 5), or in contemporary field (n = 7) and lab (n = 7) blanks (Fig. S5†), suggesting the chemical was not introduced during sampling or analysis. The detected phthalate is an anticipated human carcinogen46 and is used in drilling and hydraulic fracturing fluids.47 However, phthalates are pervasive industrial chemicals with many other documented uses. Bis-2-ethylhexyl phthalate has been reported in residential groundwater in Bradford and Dimock Pennsylvania,21,48 flowback waters from the Marcellus Shale, Barnett Shale, Fayetteville and Denver-Julesburg basin,27,47,49,50 and surface runoff adjacent to an incident of gas well spill.51N,N-dimethyltetradecylamine is speculated for use as a cationic surfactant in the oil and gas industry,52 but has not been reported in any literature or chemical use database (e.g., FracFocus.org).
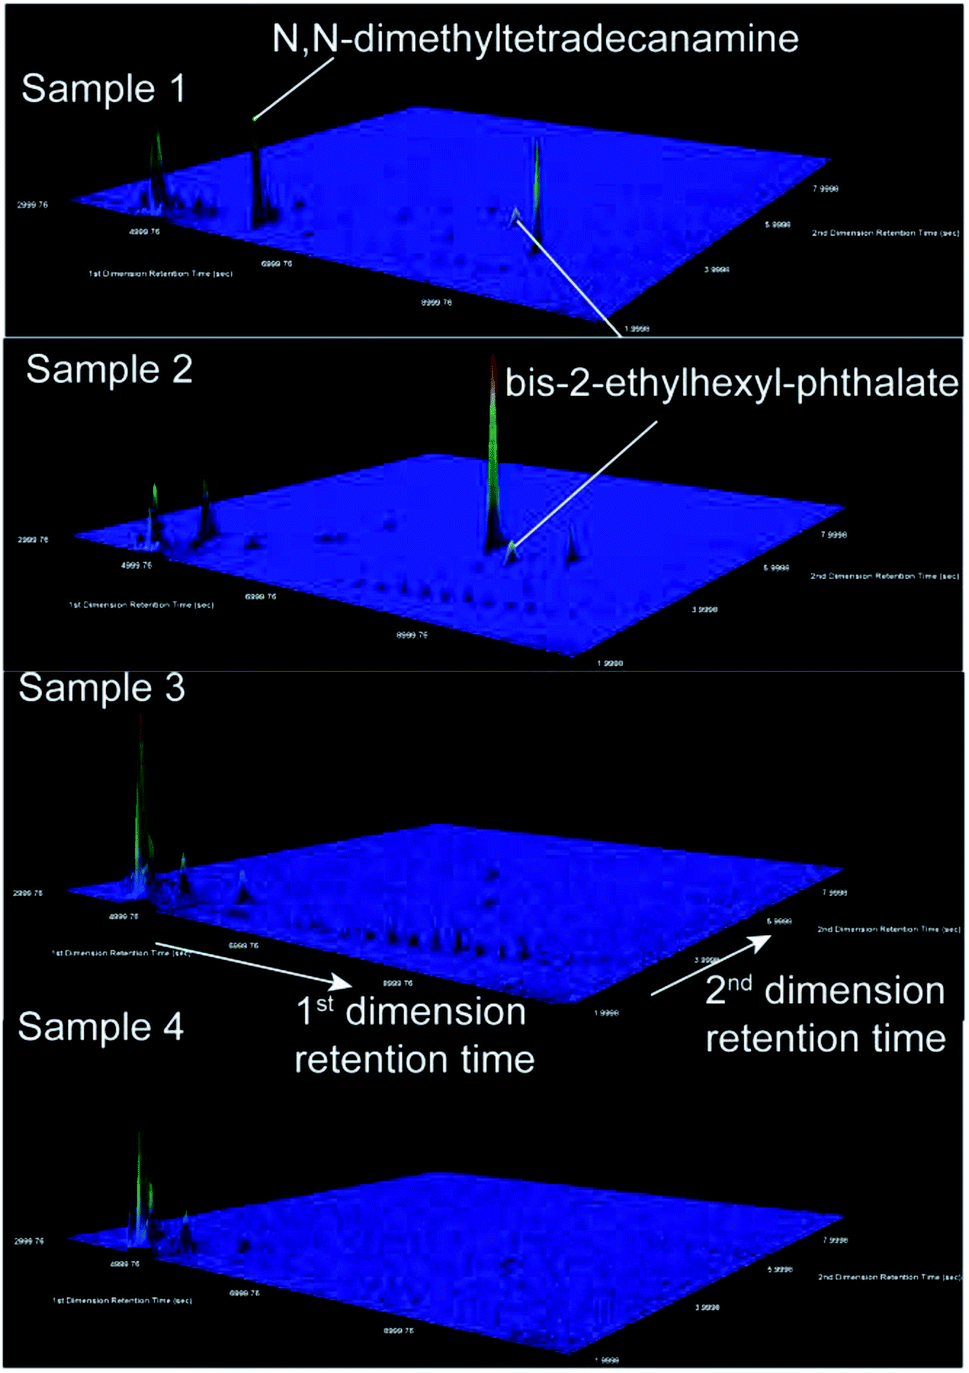 | ||
| Fig. 4 Extracted ion chromatograms (m/z 41) illustrate detection of N,N-dimethyltetradecylamine and bis-2-ethylhexyl phthalate using GC × GC-TOF-MS in high DRO samples (1 and 2) and no detection in low DRO samples (3 and 4). Mass spectra of samples 1, 2, and the bis-2-ethylhexyl phthalate standard are given in the ESI (Fig. S5†). N,N-dimethyltetradecanamine identification was also confirmed with an authentic standard. These signals were absent in 14 field and lab blanks, and absent in two field blanks collected at the same time and two lab blanks extracted on the same date as samples 1 and 2 (Fig. S5†). The z-axis is scaled automatically to the highest intensity peak. The color map indicates the extracted ion intensity (where the maximum height is colored red) and the small peaks (colored royal blue) are close to the baseline intensity due to their small abundance. | ||
The highest-level DRO sample (101 ppb) also contained elevated salinity with a Type D signature, which could result from contamination via either transport of high salinity water leaking from a waste storage impoundment located 930 m away (violation incident documented in 2012). For the sample with the second highest DRO, a pit violation was reported 2 km away (documented in 2012). Critically, we emphasize that sorption-retarded transport times for bis-2-ethylhexyl phthalate over these length scales are prohibitively long to explain their occurrence at these distances from the wells with reported violations. As such, if these DRO compounds have a source derived from flowback or produced waters, the input to local groundwaters would have to occur either via a nearby or direct surface spill, well blowout, or some accelerated transport scheme (e.g., preferential flow path; not considered in transport model as these are not well documented in the study region). Lastly, for the sample that contains the highest GRO (2.16 ± 0.71 ppb), there was a brine spill at a gas well located 3.8 km from the domestic well (documented in 2012).
Limited chemical transport over decadal time scales
Our analyses (n = 94) revealed that the majority of samples have exceedingly low levels of organic contaminants in groundwater in spite of proximity to intense HDHF activities (see ESI Fig. S9†) and over a decade of development. To explain this observation (and presuming that sufficient chemical releases occur), we hypothesized that the timescales of organic chemical transport under the hydrogeological conditions in the Appalachian region are long relative to the current timescale of HDHF development. Natural degradation would further reduce the likelihood that a chemical survives transport to a groundwater well over relevant timescales.18 Using a three-dimensional flow and transport model,38 we calculated the spatial distribution of specific discharge (qw) and average linear porewater velocity (vw) considering a plausible range of porosity, for an area in southeastern Bradford County that included 8 sampled domestic wells and 30 adjacent gas well pads. Estimates of vw span more than four orders of magnitude (maximum vw = 0.65 km per year, minimum vw = 0.0003 km per year). The median vw was 0.012 km per year, while the 10th and 90th percentiles differ by more than one order of magnitude (0.003 km per year and 0.049 km per year, respectively; see ESI† for contextualization of these estimates). This velocity distribution was used to calculate sorption-retarded transport distances of acrylamide18,53 and bis-2-ethylhexyl phthalate,21 representing the 25th and 75th percentile (logKoc of 0.55 and 4.99, respectively, where Koc is in L kgoc−1) of organic carbon-water partition coefficients of disclosed compounds. This range was determined by analyzing a disclosed fracturing chemical dataset, that included all reported chemicals until 2014 in four states with major shale plays,54 where 508 out 959 chemicals have available logKoc (Fig. S10†). Here, we note that geologically-derived compounds present in flowback and produced water are excluded in this approach (but also have Koc values within the disclosed chemical space27). The retardation factor (R), was calculated using eqn (3):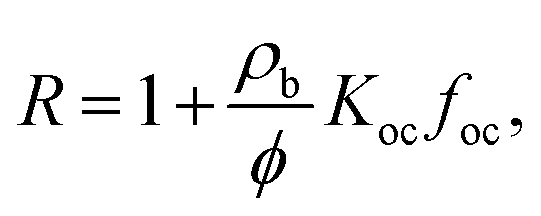 | (3) |
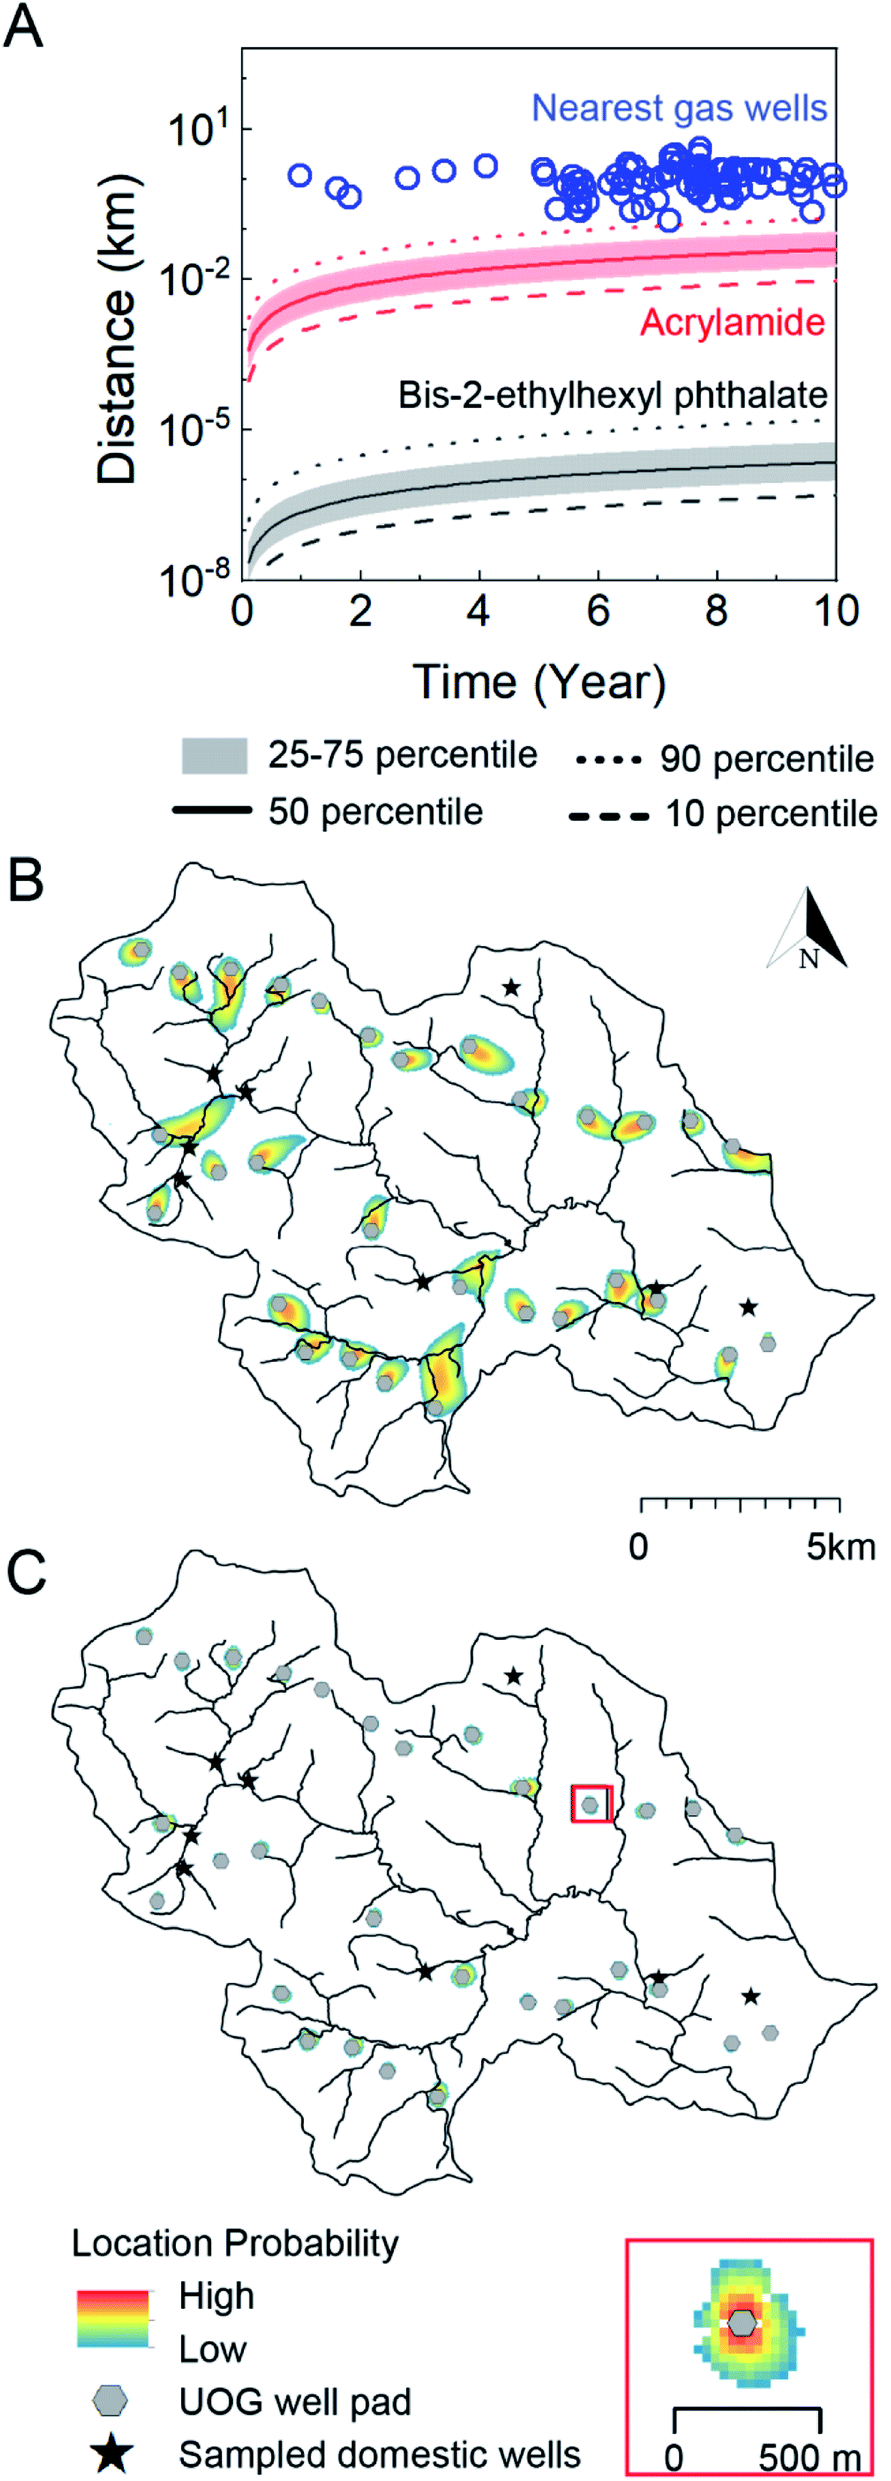 | ||
| Fig. 5 Contaminant transport length-scales are short relative to the distance to nearest oil and gas well over the timescale of unconventional oil and gas well development in Northeastern PA. (A) Gas well drilling age and distance to nearest groundwater well (blue circles) are shown alongside transport distance as a function of time considering a distribution of hydrological conditions in southeastern sub-region of Bradford county, PA and two representative end-members: acrylamide (red, logKoc = 0.55) and bis-2-ethylhexyl phthalate (black/gray, logKoc = 4.99, where Koc is in L kgoc−1). The solid, dashed, dotted, and shaded regions refer groundwater transport velocities that bound the distribution of the results. B (acrylamide) and C (bis-2-ethylhexyl phthalate) illustrate geospatially specific transport distances about 30 gas well pads (gray circles) near 8 groundwater wells (black stars) in southeastern Bradford County after 10 years. The heat maps in B and C delineate the location probability of acrylamide and bis-2-ethylhexyl phthalate ten years after a pulse-type injection from each gas well. The low probability is always set as 10−7, and high probability is a function of the size of the plume and is defined as 10−0.8 (0.16) in B, and 10−0.004 (0.99) in C. The inset shows a scaled site for viewing. The area of gas wells is not proportional to the map scale. The evolution of the transport zones over 1, 5, and 25 year time frames are available in the ESI (Fig. S11†). | ||
Over the 10 year time horizon, the transport distance of the phthalate was always shorter than the distance between gas wells and drinking water wells (Fig. 5A), even under the maximum groundwater velocity scenario (0.0007 km over 10 years). This is also true for the case of acrylamide considering velocities at or below the 75th percentile (0.08 km at year 10); only at maximum groundwater velocities can acrylamide transport distance approach 2 km (transporting from gas wells to adjacent groundwater wells) in 4.1 years. This indicates that contamination of a groundwater via subsurface transport from a gas well could occur only for the fastest transport compounds (e.g., with the lowest Koc values) under the fastest groundwater velocities. As a point of reference, an unretarded chemical traveling with the fastest groundwaters would reach a transport distance of 2 km after approximately 3 years and 152 m (setback distance considered by PA DEP) in around 0.2 years (see Soriano et al. articles38,55 for a full analysis of unretarded transport for a “worst case” scenario). This finding is consistent with the analysis by Rogers et al. 2015.18 The 10 year transport distances for the majority of organic contaminants are too short relative to the distance between gas wells and groundwater wells to account for chemical contamination via subsurface transport mechanisms. Considering the setback distance (gas-well structure to occupied residence) of 152 m suggested by the PA DEP,56 modeling results at 90th-percentile velocity suggest that it would take 9.1 years for acrylamide and 97000 years for phthalate to reach the nearest domestic well; a distance of 1 km increases these times to 33 and 18000 years, respectively. Over these timescales, natural attenuation18 would further reduce the likelihood of detecting organic contaminants in groundwater. Importantly, we note that setback distance has not been established in all states despite the EPA's recommendation, and the distance restriction of some states can be as low as 50 m (e.g., Ohio).57
To illustrate contaminant-transport behavior within the heterogeneous aquifer system that underlies the study area, we used the coupled flow and transport model to simulate the location probability of acrylamide and the phthalate after ten years, assuming a point source at each of the gas well pads (Fig. 5B and C). The modeled domain included all gas well pads in the region (n = 30) and sampled groundwater wells in our study (n = 8). In the case of acrylamide (Fig. 5B), only three groundwater wells spatially overlapped with a low probability (∼10−7 to 10−6) area of contaminant transport. Under no circumstance could the modeled phthalate travel from a gas well to a nearby groundwater well (Fig. 5C). An important feature is that the solute plumes never propagate from the source in radially symmetric fashion, but rather, travels in one, advection-dominant direction. Multiple groundwater wells are located “upstream” or shifted away from the direct “downstream” path of gas wells, leading to low or no probability of contamination. This holds even after 25 years of transport time has elapsed (Fig. S11†), despite gas well-to-groundwater well distances as short as 200 m. Considering these restrictive circumstances for groundwater impairment due to subsurface transport, it is perhaps unsurprising that poor correlations between organic contaminant level and distance to nearest gas wells exist in this and other studies.
McMahon et al.15 previously observed low levels of organic contamination in PA groundwater, utilizing 3H and SF6-calibrated modeled groundwater-age distribution to illustrate that groundwaters were older than HDHF activities. Thus, absent any catastrophic impacts or surface releases,58 more time was needed for water-borne contaminant transport. Our results support this finding, where we provided a fundamentally different approach to indicate that organic chemical impacts via subsurface transport to groundwater from HDHF activities require long timescales, exceeding the development timeline of HDHF.
Here, we highlight a few important features of the model and note opportunities for further improvement. First, the model only accounts for contamination at the well pads, excluding accidents such as roadside spills during fluid and waste transportation. Nevertheless, spills at well pads are probable sources of HDHF-associated water contamination59 and the groundwater physics is illustrative nonetheless. Second, this groundwater model does not account for contaminant transport in surface waters (e.g., streams or rivers) that may have orders of magnitude more rapid transport velocities.60 Generally speaking, in the model domain, groundwater tends to move toward adjacent rivers, suggesting that groundwater wells that intersect a path between a gas well and river may be more vulnerable to contamination incidents from HDHF activities. Third, the model does not account for reactive-transport within the vadose zone, which would tend to reduce the concentrations of surface-derived contaminants that reach groundwater. Fourth, the model does not consider multi-contaminant interaction, enhanced organic sorption (locally high foc), natural degradation,61 or volatilization, which would all combine to reduce the contaminant load at a particular time and place away from the pulsed input (i.e., these results are maxima).
Implications
In private residential areas proximal to intense HDHF activity over a decade, our sampling (n = 94) and chemical analysis revealed an overall low level of organic industrial chemicals in groundwater, with a few occurrences of elevated DRO-range chemicals. While mismanagement violations did occur near these groundwater wells, the distances of the violations were prohibitively long to explain chemical occurrence in nearby groundwater wells. Overall, through both experimentally determined organic contaminant concentration with a relatively large sample size and spatially resolved contaminant transport modeling in groundwater, our results illustrate that the physical separation between HDHF activities and groundwater-derived drinking water supply can serve to reduce chemical exposure. We observed poor correlations of low organic contaminant contents with the distance to nearest gas wells or the wells with EHS violations,13,21 with the exception of the relationship between GRO and distance to nearest violation, which may result from the fact that low detection frequencies hinder the utility of statistical analysis to examine causal relationships or reflect the stochasticity of contamination events.Considering the potential importance of such events, we note that there are imprecisely documented violation entries in the PA DEP disclosed violation reports. These should be corrected and appropriately documented (e.g., EHS violation are sometimes mistakenly recorded as administrative violations). The quantity and type of chemicals spilled should be recorded systematically if any meaningful interpretations of the rates, frequencies, or chemical fates are to be inferred. In addition, we emphasize that accidents that occur away from well pads during transportation were noticeably absent from violation databases. Future vulnerability models would be able to predict the impacts from these events only with accurate reporting measures. These findings highlight that the rapid response to groundwater contamination events would require systematic documentation of HDHF operations or incidents coupled with proactive evaluation of groundwater vulnerability with geospatially-specific hydrogeological modeling tools (e.g., as part of the permitting process).
Such modeling was illustrated here and underscores two important features of contaminant transport: (1) many chemicals used in HDHF required long timescales to reach groundwater wells via subsurface transport (as shown previously18), and (2) groundwater transport tended to dominate in advection-driven directions rather than in all directions equally, as might be implied by distance-to-nearest well assessment. Thus, distance-based metrics to gauge exposure in epidemiologic studies and others must be utilized with caution. In contrast to the commonly adopted distance correlation, we provide an approach that accounts for the physics of groundwater flow and solute transport.
Estimating transport direction and distance over long timescales is not possible without spatially resolved hydrogeological modeling. Although our transport model and calculation was limited to southeastern Bradford County, the approach can identify regions with higher groundwater vulnerability and be applied to assess the impact of HDHF on groundwater quality in other shale plays in the long term. Considering that stochastic accidents (rather than deterministic deep subsurface transport processes) have been shown to give rise to groundwater contamination repeatedly,20,21,62,63 the utility of hydrogeologic modeling to evaluate groundwater vulnerability following such accidental releases becomes clear. For example, in the event of an HDHF well breach or chemical spill on or off the well pad, groundwater vulnerability modeling could be used to predict which drinking water sources could be impacted and on what timescale. This would allow for (a) more informed response to the spill, saving remediation costs and reducing ecological impacts, (b) targeted home drinking water treatments to protect public health, and (c) more accurate estimates of the timeline of the crisis and anticipated impacts, informing both response strategies as well as potential regulatory and oversight frameworks (i.e., reducing the cost of local and federal response in a way that still protects the environment and public health). To make this vision a reality and enable response to crises, near-term future work should focus on developing transport-direction related variables that are simple to calculate and alleviate the need for computationally intensive 3D models. Until that time, the use of linear distance metrics may be a de facto necessity for any policy tools designed to protect public living near UOG operations.
Author contributions
BX oversaw and conducted the analysis and wrote the paper, MAS Jr conducted analysis and wrote the paper, KMG, NH, CJC, HGS, GAD, YL, RJB, AJC, ECR, and AJS all conducted field sample collection and/or laboratory analysis, and DLP, NCD, and JES conceived of and designed the experiments, oversaw analysis and interpretation, and wrote the paper.Conflicts of interest
The authors declare no conflict of interest.Acknowledgements
Inorganic constituents were analyzed at the Yale Analytical and Stable Isotope Center (YASIC) and the Cary Institute of Ecosystem Studies (Millbrook, NY). This work was conducted under Assistance Agreement No. CR839249 awarded by the U.S. Environmental Protection Agency (EPA) to Yale University. It has not been formally reviewed by EPA. The views expressed in this document are solely those of the authors and do not necessarily reflect those of the Agency.References
- U.S. Energy Information Administration and U.S. Department of Energy, Annual Energy Outlook 2019 (With Projections to 2050). 2019. (accessed by 9/14/2021) Search PubMed.
- A. Vengosh, R. B. Jackson, N. Warner, T. H. Darrah and A. Kondash, A critical review of the risks to water resources from unconventional shale gas development and hydraulic fracturing in the United states, Environ. Sci. Technol., 2014, 48(15), 8334–8348 CrossRef CAS PubMed.
- R. D. Vidic, S. L. Brantley, J. M. Vandenbossche, D. Yoxtheimer and J. D. Abad, Impact of shale gas development on regional water quality, Science, 2013, 340(6134), 1235009 CrossRef CAS PubMed.
- D. J. Rozell and S. J. Reaven, Water pollution risk associated with natural gas extraction from the Marcellus Shale, Risk Anal., 2012, 32(8), 1382–1393 CrossRef PubMed.
- T. H. Darrah, A. Vengosh, R. B. Jackson, N. R. Warner and R. J. Poreda, Noble gases identify the mechanisms of fugitive gas contamination in drinking-water wells overlying the Marcellus and Barnett shales, Proc. Natl. Acad. Sci. U. S. A., 2014, 111(39), 14076–14081 CrossRef CAS PubMed.
- S. G. Osborn, A. Vengosh, N. R. Warner and R. B. Jackson, Methane contamination of drinking water accompanying gas-well drilling and hydraulic fracturing, Proc. Natl. Acad. Sci. U. S. A., 2011, 108(20), 8172–8176 CrossRef CAS PubMed.
- T. H. Darrah, R. B. Jackson, A. Vengosh, N. R. Warner, C. J. Whyte, T. B. Walsh, A. J. Kondash and R. J. Poreda, The evolution of Devonian hydrocarbon gases in shallow aquifers of the northern Appalachian basin: Insights from integrating noble gas and hydrocarbon geochemistry, Geochim. Cosmochim. Acta, 2015, 170, 321–355 CrossRef CAS.
- E. Barth-Naftilan, J. Sohng and J. Saiers, Methane in groundwater before, during, and after hydraulic fracturing of the marcellus shale, Proc. Natl. Acad. Sci. U. S. A., 2018, 115(27), 6970–6975 CrossRef CAS PubMed.
- D. I. Siegel, N. A. Azzolina, B. J. Smith, A. E. Perry and R. L. Bothun, Methane concentrations in water wells unrelated to proximity to existing oil and gas wells in Northeastern Pennsylvania, Environ. Sci. Technol., 2015, 49(7), 4106–4112 CrossRef CAS PubMed.
- E. C. Botner, A. Townsend-Small, D. B. Nash, X. Xu, A. Schimmelmann and J. H. Miller, Monitoring concentration and isotopic composition of methane in groundwater in the Utica Shale hydraulic fracturing region of Ohio, Environ. Monit. Assess., 2018, 190(6), 322 CrossRef PubMed.
- K. M. Révész, K. J. Breen, A. J. Baldassare and R. C. Burruss, Carbon and hydrogen isotopic evidence for the origin of combustible gases in water-supply wells in north-central Pennsylvania, Appl. Geochem., 2010, 25(12), 1845–1859 CrossRef.
- M. L. St Thomas, A. Szynkiewicz, A. M. Faiia, M. A. Mayes, M. L. McKinney and W. G. Dean, Chemical and isotope compositions of shallow groundwater in areas impacted by hydraulic fracturing and surface mining in the central Appalachian Basin, Eastern United States, Appl. Geochem., 2016, 71, 73–85 CrossRef.
- R. B. Jackson, A. Vengosh, T. H. Darrah, N. R. Warner, A. Down, R. J. Poreda, S. G. Osborn, K. Zhao and J. D. Karr, Increased stray gas abundance in a subset of drinking water wells near Marcellus Shale gas extraction, Proc. Natl. Acad. Sci. U. S. A., 2013, 110(28), 11250–11255 CrossRef CAS PubMed.
- S. A. Gross, H. J. Avens, A. M. Banducci, J. Sahmel, J. M. Panko and B. E. Tvermoes, Analysis of BTEX groundwater concentrations from surface spills associated with hydraulic fracturing operations, J. Air Waste Manage. Assoc., 2013, 63(4), 424–432 CrossRef CAS PubMed.
- P. B. McMahon, B. D. Lindsey, M. D. Conlon, A. G. Hunt, K. Belitz, B. C. Jurgens and B. A. Varela, Hydrocarbons in upland groundwater, Marcellus Shale region, Northeastern Pennsylvania and southern New York, USA, Environ. Sci. Technol., 2019, 53(14), 8027–8035 CrossRef CAS PubMed.
- P. B. McMahon, J. R. Barlow, M. A. Engle, K. Belitz, P. B. Ging, A. G. Hunt, B. C. Jurgens, Y. K. Kharaka, R. W. Tollett and T. M. Kresse, Methane and benzene in drinking-water wells overlying the eagle ford, Fayetteville, and Haynesville shale hydrocarbon production areas, Environ. Sci. Technol., 2017, 51(12), 6727–6734 CrossRef CAS PubMed.
- E. G. Elliott, A. S. Ettinger, B. P. Leaderer, M. B. Bracken and N. C. Deziel, A systematic evaluation of chemicals in hydraulic-fracturing fluids and wastewater for reproductive and developmental toxicity, J. Exposure Sci. Environ. Epidemiol., 2017, 27(1), 90 CrossRef CAS PubMed.
- J. D. Rogers, T. L. Burke, S. G. Osborn and J. N. Ryan, A framework for identifying organic compounds of concern in hydraulic fracturing fluids based on their mobility and persistence in groundwater, Environ. Sci. Technol. Lett., 2015, 2(6), 158–164 CrossRef CAS.
- W. T. Stringfellow, J. K. Domen, M. K. Camarillo, W. L. Sandelin and S. Borglin, Physical, chemical, and biological characteristics of compounds used in hydraulic fracturing, J. Hazard. Mater., 2014, 275, 37–54 CrossRef CAS PubMed.
- G. T. Llewellyn, F. Dorman, J. Westland, D. Yoxtheimer, P. Grieve, T. Sowers, E. Humston-Fulmer and S. L. Brantley, Evaluating a groundwater supply contamination incident attributed to marcellus shale gas development, Proc. Natl. Acad. Sci. U. S. A., 2015, 112(20), 6325–6330 CrossRef CAS PubMed.
- B. D. Drollette, K. Hoelzer, N. R. Warner, T. H. Darrah, O. Karatum, M. P. O'Connor, R. K. Nelson, L. A. Fernandez, C. M. Reddy, A. Vengosh, R. B. Jackson, M. Elsner and D. L. Plata, Elevated levels of diesel range organic compounds in groundwater near Marcellus gas operations are derived from surface activities, Proc. Natl. Acad. Sci. U. S. A., 2015, 112(43), 13184–13189 CrossRef CAS PubMed.
- N. R. Warner, R. B. Jackson, T. H. Darrah, S. G. Osborn, A. Down, K. Zhao, A. White and A. Vengosh, Geochemical evidence for possible natural migration of marcellus formation brine to shallow aquifers in Pennsylvania, Proc. Natl. Acad. Sci. U. S. A., 2012, 109(30), 11961–11966 CrossRef CAS PubMed.
- R. E. Jackson, A. Gorody, B. Mayer, J. Roy, M. Ryan and D. Van Stempvoort, Groundwater protection and unconventional gas extraction: the critical need for field-based hydrogeological research, Groundwater, 2013, 51(4), 488–510 CrossRef CAS PubMed.
- S. L. Brantley, D. Yoxtheimer, S. Arjmand, P. Grieve, R. Vidic, J. Pollak, G. T. Llewellyn, J. Abad and C. Simon, Water resource impacts during unconventional shale gas development: The Pennsylvania experience, Int. J. Coal Geol., 2014, 126, 140–156 CrossRef CAS.
- K. O. Maloney, S. Baruch-Mordo, L. A. Patterson, J.-P. Nicot, S. A. Entrekin, J. E. Fargione, J. M. Kiesecker, K. E. Konschnik, J. N. Ryan and A. M. Trainor, Unconventional oil and gas spills: materials, volumes, and risks to surface waters in four states of the us, Sci. Total Environ., 2017, 581, 369–377 CrossRef PubMed.
- R. Bryan, M. Swistock and E. William, Drinking Water Quality in Rural Pennsylvania and the Effect of Management Practices. The Center for Rural Pennsylvania, Pennsylvania, USA, 2009, pp. 32–45 Search PubMed.
- K. Hoelzer, A. J. Sumner, O. Karatum, R. K. Nelson, B. D. Drollette, M. P. O'Connor, E. L. D'Ambro, G. J. Getzinger, P. L. Ferguson, C. M. Reddy, M. Elsner and D. L. Plata, Indications of transformation products from hydraulic fracturing additives in shale-gas wastewater, Environ. Sci. Technol., 2016, 50(15), 8036–8048 CrossRef CAS PubMed.
- C. X. Clark, B. Xiong, M. Soriano, K. Gutchess, H. Siegel, E. Ryan, N. Johnson, K. Cassell, E. Elliott, Y. Li, A. Cox, N. Bugher, L. Glist, R. Brenneis, K. Sorrentino, J. Plano, X. Ma, J. Warren, D. Plata, J. Saiers and N. Deziel, Assessing unconventional oil and gas exposure in the Appalachian basin: comparison of exposure surrogates and residential drinking water measurements, Environ. Sci. Technol., 2022 DOI:10.1021/acs.est.1c05081.
- U.S. Geological Survey, National Field Manual for the Collection of Water-Quality Data (nfm). 2018. (Accessed by 07/01/2018) Search PubMed.
- Y. Li, N. A. Thelemaque, H. G. Siegel, C. J. Clark, E. C. Ryan, R. J. Brenneis, K. M. Gutchess, M. A. Soriano, B. Xiong, N. C. Deziel, J. E. Saiers and D. L. Plata, Groundwater Methane in Northeastern Pennsylvania Attributable to Thermogenic Sources and Hydrogeomorphologic Migration Pathways, Environ. Sci. Technol., 2021, 55(24), 16413–16422, DOI:10.1021/acs.est.1c05272.
- U.S. Energy Information Administration, Marcellus Region Drilling Productivity Report. https://www.eia.gov/petroleum/drilling/pdf/marcellus.pdf (accessed by 9/14/ 2021) Search PubMed.
- G. J. Getzinger, M. P. O'Connor, K. Hoelzer, B. D. Drollette, O. Karatum, M. A. Deshusses, P. L. Ferguson, M. Elsner and D. L. Plata, Natural gas residual fluids: Sources, endpoints, and organic chemical composition after centralized waste treatment in Pennsylvania, Environ. Sci. Technol., 2015, 49(14), 8347–8355 CrossRef CAS PubMed.
- C. Magen, L. L. Lapham, J. W. Pohlman, K. Marshall, S. Bosman, M. Casso and J. P. Chanton, A simple headspace equilibration method for measuring dissolved methane, Limnol. Oceanogr.: Methods, 2014, 12(9), 637–650 CrossRef.
- Pennsylvania Department of Environment Protection, Pennsylvania Spatial Data Access 2019. (accessed by 4/21/2019) Search PubMed.
- Pennsylvania Department of Environment Protection, Oil and Gas Compliance Report, 2019 Search PubMed.
- B. G. Rahm, S. Vedachalam, L. R. Bertoia, D. Mehta, V. S. Vanka and S. J. Riha, Shale gas operator violations in the Marcellus and what they tell us about water resource risks, Energy Policy, 2015, 82, 1–11 CrossRef.
- Pennsylvania Department of Environmental Protection, Storage Tank Reports. 2019. (accessed by 8/17/2019) Search PubMed.
- M. A. Soriano Jr, H. G. Siegel, K. M. Gutchess, C. J. Clark, Y. Li, B. Xiong, D. L. Plata, N. C. Deziel and J. E. Saiers, Evaluating domestic well vulnerability to contamination from unconventional oil and gas development sites, Water Resour. Res., 2020, 56(10), e2020WR028005 CrossRef.
- P. Brunner and C. T. Simmons, Hydrogeosphere: A fully integrated, physically based hydrological model, Groundwater, 2012, 50(2), 170–176 CrossRef CAS.
- J. H. Williams, Evaluation of well logs for determining the presence of freshwater, saltwater, and gas above the Marcellus Shale in Chemung, Tioga, and Broome counties, New York, Sci. Invest. Rep., 2010, 5224, 27 Search PubMed.
- D. W. Risser, J. H. Williams, K. L. Hand, R.-A. Behr and A. K. Markowski, Geohydrologic and Water-Quality Characterization of a Fractured-Bedrock Test Hole in an Area of Marcellus Shale Gas Development, Pennsylvania Geological Survey, Bradford County, Pennsylvania, 2013 Search PubMed.
- D. E. Welter, J. T. White, R. J. Hunt and J. E. Doherty, Approaches in Highly Parameterized Inversion— Pest++ Version 3, a Parameter Estimation and Uncertainty Analysis Software Suite Optimized for Large Environmental Models, Reston, VA, 2015, p. 54 Search PubMed.
- U.S. Environmental Protection Agency and Syracuse Research Corporation (SRC), Estimation Programs Interface Suite for Microsoft Windows, Version 4.11, 2012, (accessed by 8/17/2019) Search PubMed.
- L. A. Patterson, K. E. Konschnik, H. Wiseman, J. Fargione, K. O. Maloney, J. Kiesecker, J.-P. Nicot, S. Baruch-Mordo, S. Entrekin, A. Trainor and J. E. Saiers, Unconventional oil and gas spills: Risks, mitigation priorities, and state reporting requirements, Environ. Sci. Technol., 2017, 51(5), 2563–2573 CrossRef CAS PubMed.
- R. Neupauer and J. Wilson, Forward and backward location probabilities for sorbing solutes in groundwater, Adv. Water Resour., 2004, 27(7), 689–705 CrossRef CAS.
- National Toxicology Program and US Department of Health and Human Services, Public Health Services, Report on Carcinogens. 2014, (accessed by 11/12/2019) Search PubMed.
- S. J. Maguire-Boyle and A. R. Barron, Organic compounds in produced waters from shale gas wells, Environ. Sci.: Processes Impacts, 2014, 16(10), 2237–2248 RSC.
- U.S. Environmental Protection Agency, Dimock Residential Groundwater Site. 2015, (accessed by 11/12/2019) Search PubMed.
- I. Ferrer and E. M. Thurman, Chemical constituents and analytical approaches for hydraulic fracturing waters, Trends Environ. Anal. Chem., 2015, 5, 18–25 CrossRef CAS.
- Y. Lester, I. Ferrer, E. M. Thurman, K. A. Sitterley, J. A. Korak, G. Aiken and K. G. Linden, Characterization of hydraulic fracturing flowback water in Colorado: Implications for water treatment, Sci. Total Environ., 2015, 512, 637–644 CrossRef PubMed.
- U.S. Environmental Protection Agency, Pollution Situation Report/Statoil Eisenbarth Well Response - Removal Polrep Initial Removal Polrep. 2014, (accessed by 8/17/2019) Search PubMed.
- U.S. Environmental Protection Agency, Chemview: Chemical Data Reporting Database under the Toxic Substances Control Act, 2016, (accessed by 11/12/2019) Search PubMed.
- B. Xiong, Z. Miller, S. Roman-White, T. Tasker, B. Farina, B. Piechowicz, W. D. Burgos, P. Joshi, L. Zhu and C. A. Gorski, Chemical degradation of polyacrylamide during hydraulic fracturing, Environ. Sci. Technol., 2018, 52(1), 327–336 CrossRef CAS PubMed.
- M. Elsner and K. Hoelzer, Quantitative survey and structural classification of hydraulic fracturing chemicals reported in unconventional gas production, Environ. Sci. Technol., 2016, 50(7), 3290–3314 CrossRef CAS PubMed.
- M. A. Soriano, H. G. Siegel, N. P. Johnson, K. M. Gutchess, B. Xiong, Y. Li, C. J. Clark, D. L. Plata, N. C. Deziel and J. E. Saiers, Assessment of groundwater well vulnerability to contamination through physics-informed machine learning, Environ. Res. Lett., 2021, 16(8), 084013 CrossRef.
- N. Richardson, M. Gottlieb, A. Krupnick and H. Wiseman, The state of state shale gas regulation. Resources for the Future 2013 Search PubMed.
- Ohio Division of Oil and Gas Resources, Frequently asked questions. http://oilandgas.ohiodnr.gov/oil-gas-faq (accessed by 8/17/ 2019).
- L. A. Patterson, K. E. Konschnik, H. Wiseman, J. Fargione, K. O. Maloney, J. Kiesecker, J.-P. Nicot, S. Baruch-Mordo, S. Entrekin and A. Trainor, Unconventional oil and gas spills: risks, mitigation priorities, and state reporting requirements, Environ. Sci. Technol., 2017, 51(5), 2563–2573 CrossRef CAS PubMed.
- M. Shanafield, P. G. Cook and C. T. Simmons, Towards quantifying the likelihood of water resource impacts from unconventional gas development, Groundwater, 2019, 57(4), 547–561 CrossRef CAS PubMed.
- M. Hrachowitz, P. Benettin, B. M. van Breukelen, O. Fovet, N. J. K. Howden, L. Ruiz, Y. van der Velde and A. J. Wade, Transit times—the link between hydrology and water quality at the catchment scale, Wiley Interdiscip. Rev.: Water, 2016, 3(5), 629–657 CrossRef.
- S. Jasechko, D. Perrone, K. M. Befus, M. Bayani Cardenas, G. Ferguson, T. Gleeson, E. Luijendijk, J. J. McDonnell, R. G. Taylor, Y. Wada and J. W. Kirchner, Global aquifers dominated by fossil groundwaters but wells vulnerable to modern contamination, Nat. Geosci., 2017, 10, 425 CrossRef CAS.
- J. S. Harkness, G. S. Dwyer, N. R. Warner, K. M. Parker, W. A. Mitch and A. Vengosh, Iodide, bromide, and ammonium in hydraulic fracturing and oil and gas wastewaters: Environmental implications, Environ. Sci. Technol., 2015, 49(3), 1955–1963 CrossRef CAS PubMed.
- N. E. Lauer, J. S. Harkness and A. Vengosh, Brine spills associated with unconventional oil development in north dakota, Environ. Sci. Technol., 2016, 50(10), 5389–5397 CrossRef CAS PubMed.
Footnote |
| † Electronic supplementary information (ESI) available. See DOI: 10.1039/d1em00124h |
| This journal is © The Royal Society of Chemistry 2022 |