
 Open Access Article
 This Open Access Article is licensed under a Creative Commons Attribution-Non Commercial 3.0 Unported Licence
Highly selective gas sensing enabled by filters
Jan
van den Broek
 ,
Ines C.
Weber
,
Andreas T.
Güntner
and
Sotiris E.
Pratsinis
*
,
Ines C.
Weber
,
Andreas T.
Güntner
and
Sotiris E.
Pratsinis
*
Particle Technology Laboratory, Institute of Energy & Process Engineering, Department of Mechanical and Process Engineering, ETH Zurich, CH-8092 Zurich, Switzerland. E-mail: sotiris.pratsinis@ptl.mavt.ethz.ch
First published on 12th November 2020
Abstract
Portable and inexpensive gas sensors are essential for the next generation of non-invasive medical diagnostics, smart air quality monitoring & control, human search & rescue and food quality assessment to name a few of their immediate applications. Therein, analyte selectivity in complex gas mixtures like breath or indoor air remains the major challenge. Filters are an effective and versatile, though often unrecognized, route to overcome selectivity issues by exploiting additional properties of target analytes (e.g., molecular size and surface affinity) besides reactivity with the sensing material. This review provides a tutorial for the material engineering of sorption, size-selective and catalytic filters. Of specific interest are high surface area sorbents (e.g., activated carbon, silica gels and porous polymers) with tunable properties, microporous materials (e.g., zeolites and metal–organic frameworks) and heterogeneous catalysts, respectively. Emphasis is placed on material design for targeted gas separation, portable device integration and performance. Finally, research frontiers and opportunities for low-cost gas sensing systems in emerging applications are highlighted.
 Jan van den Broek | Jan van den Broek received his MSc (2016) in material science from ETH Zürich, Switzerland where he is now a PhD candidate in mechanical and process engineering. He develops highly selective gas sensing systems by combining chemical sensors with sorption filters. For this he received the best poster award in Exposure Measurement Methods and Techniques during the 2019 Annual Meeting of the European Aerosol Conference in Gothenburg, Sweden that was attended by over 1000 registered participants. Today he focuses on the integration of sensors into handheld devices and realistic testing for breath analysis, air pollution monitoring and food quality assessment. |
 Ines C. Weber | Ines C. Weber received her BSc (2016) and MSc (2018) in material science from the Swiss Federal Institute of Technology (ETH Zürich). Currently, she is a PhD candidate at the Particle Technology Laboratory in the Mechanical and Process Engineering Department at ETH Zürich. Her research centers around highly selective nanostructured gas sensors enabled by reactive filter design. A particular focus is their use for breath analysis in medical and lifestyle applications, as well as indoor and outdoor air quality monitoring, in close collaboration with the Department of Chemistry at ETH Zürich and the University Hospital Zürich. |
 Andreas T. Güntner | Dr Andreas Güntner received his PhD (2016) in mechanical and process engineering from ETH Zürich where he is currently a lecturer and research group leader. His research aims to advance the understanding of micro & nanoscaled materials at the interface between physics, chemistry and medicine. The development of new sensing technologies in healthcare and environmental applications is a particular emphasis. He is double recipient of the ETH Medal, the Excellence Award for Product Design and Engineering from the European Federation of Chemical Engineering and the Gesellschaft für Aerosolforschung (GAeF) PhD Award by the Association for Aerosol Research, among other recognitions. |
 Sotiris E. Pratsinis | Professor S. E. Pratsinis teaches Mass Transfer and Micro-Nano-Particle Technology at ETH Zürich. He has graduated 43 PhDs, now at leading positions in industry and academia worldwide. Currently he advises four PhDs and four post-docs. He has published 400+ refereed articles, filed 20+ patents that are licensed to industry and have contributed to creation of four spinoffs. His research on multiscale particle dynamics pioneered flame aerosol synthesis of nanomaterials with closely controlled characteristics. This contributed decisively to identifying the origins of nanosilver toxicity, led to novel heterogeneous catalysts and, for the first time, flame-made gas sensors, nutritional supplements, dental and theranostic materials. |
1. Introduction
Gas sensors allow modern electronic devices to smell their environment. By utilizing portable and inexpensive sensors, a multitude of promising applications1 can be realized (Fig. 1): smart air quality control (indoor2 and outdoor3) with distributed, interconnected or drone-borne sensors that communicate wirelessly chemical data in real-time to map toxic pollutants (e.g., formaldehyde,4 NOx5 or CFC-116); food quality assessment7 to monitor the production and distribution from plant growth (e.g., plant hormone ethylene8), regulate processing (e.g., acetic acid for aroma development in coffee9) and detect spoiling (e.g., ammonia for meat10) to minimize waste; non-invasive medical diagnostics by breath analysis11 to detect diseases (e.g., cancer12 or diabetes13) and monitor their progression, or personalized tracking of physiological data (e.g., dieting14 or exercise15); and in human search and rescue16 to assist first responders with robots capable to detect the unique human chemical signature17 similar to dogs (e.g., after earthquakes or avalanches18), just to highlight some.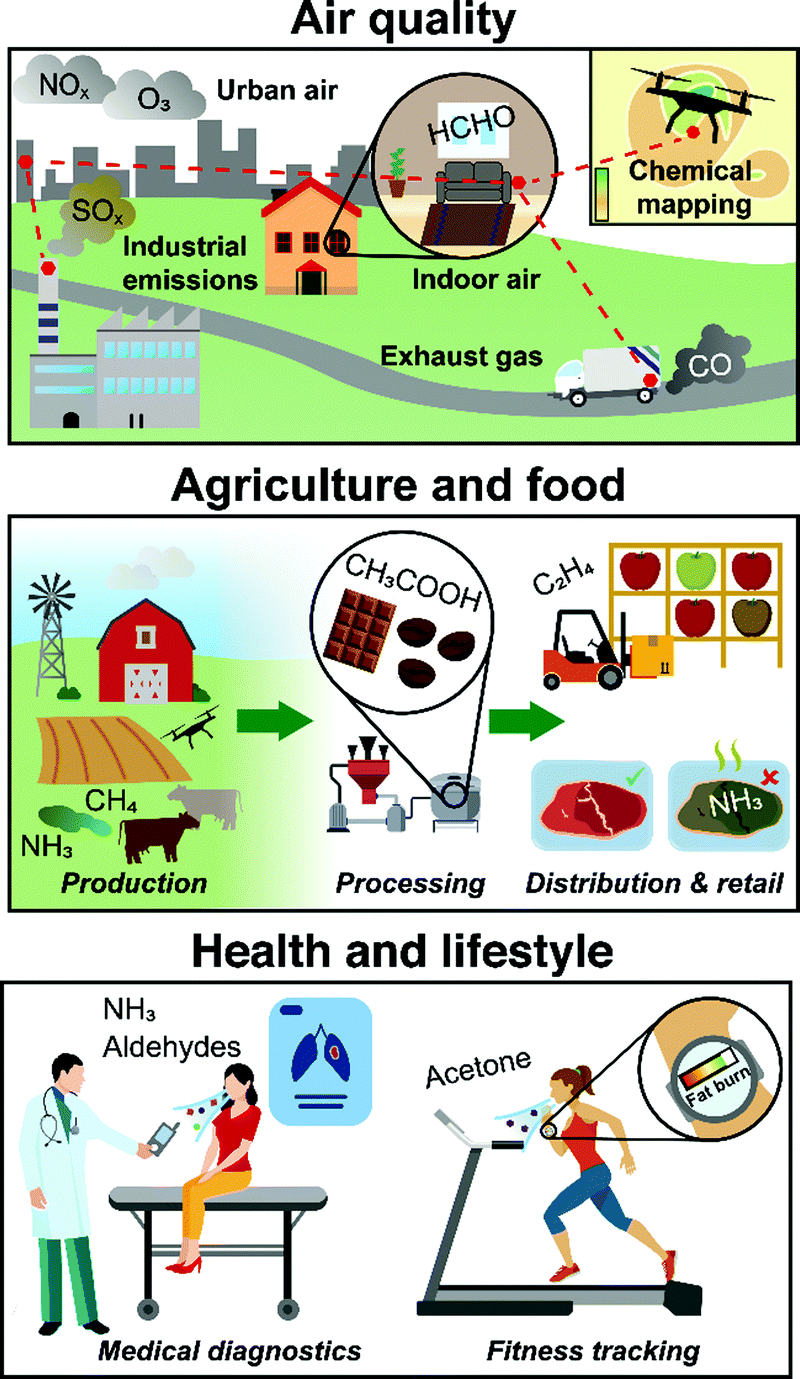 | ||
| Fig. 1 Compact and low-cost gas sensors in air quality monitoring, agriculture & food quality assessment and health & lifestyle applications. | ||
For integration into electronic devices, gas sensors need to be compact, inexpensive and simple-in-use. Most importantly, they need to detect selectively volatile organic compounds (VOCs) and gases at low ppb to ppm (parts-per-billion/million by volume) concentrations in mixtures without interference over hundreds of others (e.g., >800 in breath19 or >250 in indoor air20). State-of-the-art gas sensors (e.g., chemoresistive21 or optical22) provide this sensitivity by making use of nanomaterials having high specific surface area (e.g., 5 ppb acetone at 90% relative humidity (RH) by leached nanostructured Pd/SnO223 or sub-ppb detection of Cl2 by nanoparticle-based liquid crystal sensors24).
Most challenging, however, is selectivity, which can be tuned to some extent by material composition of single sensors including metastable phases,25 solid solutions,26 mixed oxides27 or heterostructures with unique morphology (e.g., hollow nanofibers28 or ordered macroporous oxides29). For example, the epsilon phase of WO3 (i.e., ε-WO3) stabilized by Cr-doping showed some acetone selectivity (>6) to ethanol, methanol NOx, NH3 and CO.25 Also, In4Sn3O12 reacts selectively to formaldehyde,30 Ti/ZnO to isoprene,31 Si/α-MoO3 to ammonia,32 or Ag/LaFeO3 to methanol.33 However, such selectivities are typically only moderate, apart rare exceptions exploiting unique analyte-sensor interactions (e.g., CuBr for ammonia34 or WO3 for NO235). This is often not sufficient in applications where interferant concentrations may be orders of magnitude higher than the target analyte (e.g., <8 ppb carcinogenic36 formaldehyde in indoor air with ∼1000 ppb CO background37).
To discriminate between analytes in gas mixtures, different sensors can also be combined to arrays (also called electronic noses or E-noses), overcoming selectivity limitations of single sensors.38 Reviews on material design,39 data processing algorithms40 and applications (e.g., food quality and safety monitoring,41 or breath analysis42) of sensor arrays address their potential. Generally, arrays process different sensor signals by statistical models to classify different odors. A variety of algorithms is used based on descriptive43 (e.g., principle component analysis, hierarchical cluster analysis) and predictive methods44 (e.g., artificial neural networks), often requiring a large set of data to “train” the models. Typically, arrays do not detect and discriminate specific analytes, but rather distinguish and classify analyte patterns (i.e., odors). For instance, a sensor array might differentiate lung cancer patients from healthy subjects45 or distinguish different quality grades of Indian black tea.46 Thereby, often broadly sensitive sensors are used, making the array susceptible to overfitting and bogus correlations from confounders.47 To discriminate multiple analytes and detect them with high accuracy in gas mixtures, distinctly selective sensors, ideally with orthogonal features,48 are most desirable for inclusion into arrays.
Filters represent a third approach to enhance the selectivity of gas sensors. They were first discussed in a review about selectivity in semiconductor gas sensors in 1987.49 Since then, filters were treated only as a side aspect in many books and reviews of gas sensors in general,50 gas sensor types (e.g., metal-oxide,51 arrays,52 zeolite,53 metal–organic frameworks,54 mesoporous materials,55 combustible56) and applications (e.g., environment, health and safety,57 automotive,58 explosives,59 pollution,60 indoor air quality,2 health monitoring and disease diagnostic61). Placed either in front (e.g., packed beds) or directly on top (e.g., overlayers) of sensors, filters alter the composition and/or concentration of analytes in gas mixtures before reaching the sensor. In the ideal case, the target analyte is not affected while interferants are removed, resulting in high selectivity (>1000) even with non-selective sensors.62 Already in 1980, a packed bed of zeolite 3A was tested to filter H2S to selectively detect H2 by a commercial SnO2 sensor (Taguchi, Figaro).62 Also, SiO2-covered SnO2 sensors eliminated interference by CO, CH4, ethanol and isobutane for selective H2 detection,63 charcoal and carbon cloth were used to protect CH4 sensors from poisoning by siloxanes,64 and zeolite 5A filters blocked H2S and ethylene for selective CO detection.65 Today, filters are well-established in most industrial sensors (e.g., CO66 and CH467 alarm sensors), however, their immense potential remains rather unexplored.
Only recently, filters were used to overcome selectivity issues of sensors for other, so far inaccessible, applications such as revealing methanol-adulterated liquors by separating methanol from ethanol in a packed bed sorption filter,68 detecting H2 leaks to fulfil, for the first time, stringent national standards by a polymer membrane on top of a plasmonic sensor,69 and monitoring body fat burn from breath acetone by combusting interferants on a Pt/Al2O3 filter70 preceding a Si/WO3 sensor. Thereby, the distinct advantage of filters is the exploitation of additional and complementary molecular properties (e.g., size, sorption affinity), often not accessible by sensors alone. By using advanced materials (e.g., microporous metal–organic frameworks, MOF) and material design on the nanoscale (e.g., heterostructures, nanocluster dopants), filters can be designed systematically to achieve high sensor selectivity. Most importantly, filters can be modular to the sensor and thus flexibly combined with different sensor technologies (e.g., optical,69 chemoresistive,71 electrochemical72) and even sensor arrays.73
Here, we systematically review sorption, size-selective and catalytic filters with guidelines for their design in assembling highly selective sensor systems. Selectivity improvement by filters comes at increased complexity of the sensing system and each filter type introduces distinct advantages and disadvantages, broadly summarized in Table 1. We address these characteristics by first introducing the underlying filter concepts and basic principles necessary for analyte separation. Then, specific implementations of such filters are presented, highlighting trends and critically comparing their performance. Finally, device integration and performance in practical cases are elaborated. We close by highlighting current challenges and opportunities.
| Filter type | Configuration | Selectivity | Flexibility for selectivity | Multi-analyte detection | Sensitivity | Analysis time | Power consumption | Size |
|---|---|---|---|---|---|---|---|---|
| Sorption | Packed bed | ↑↑ | ↑ | ○ | ○ | ○ | ○ | ↑ |
| Separation column | ↑↑ | ↑↑ | ↑↑ | ↓ | ↑↑ | ↑↑ | ↑↑ | |
| Size-selective | Overlayer | ↑ | ↑ | ○ | ○ | ○ | ○ | ○ |
| Membrane | ↑↑ | ↑↑ | ○ | ↓ | ↑ | ○ | ↑ | |
| Catalytic | Overlayer | ↑ | ↑ | ○ | ↑ | ○ | ○ | ○ |
| Packed bed | ↑↑ | ↑↑ | ○ | ○ | ○ | ↑ | ↑ | |
2. Sorption filters
Definitions & principles
A sorption filter exploits the difference between analytes flowing or diffusing through. So mixtures of analytes either adsorb74 onto or are absorbed in the filter to enhance the sensor selectivity downstream. Most sorption filters are based on adsorption, while absorption dominates gas chromatography (GC)-sensor systems. These filters are inexpensive and modular to the gas sensor,71 thus easy to implement and characterize. Most importantly, they are flexible as a wide range of sorbents is available to separate analytes based on polarity,75 hydrophilicity,71 boiling point,76 molecular weight68 or size.77 A drawback is their saturation,78 requiring replacement or regeneration by purging with clean air and/or by heating79 that tends to prolong sensor response and recovery times. However, by combining purging and heating, adsorbents can be regenerated within minutes80 as established for thermal desorption tubes in air quality monitoring.81For adsorption, the chemical surface groups (nonpolar, polar and analyte-specific), accessible surface area and pore size distribution of the adsorbent (filter) are important (Fig. 2a). Adsorption of analytes takes place through weak (10–100 meV) and reversible physical forces (i.e., van der Waals).82 Sorption filters are often packed beds of adsorbent particles, porous granules or fibers. To characterize their adsorption capacity for certain analytes, a breakthrough curve is recorded.83 Thereby, the analyte concentration at the filter outlet is measured for constant inlet analyte concentration and flow rate. The time for the outlet analyte concentration to reach a certain fraction (often 5%) of its inlet is defined as the breakthrough time.
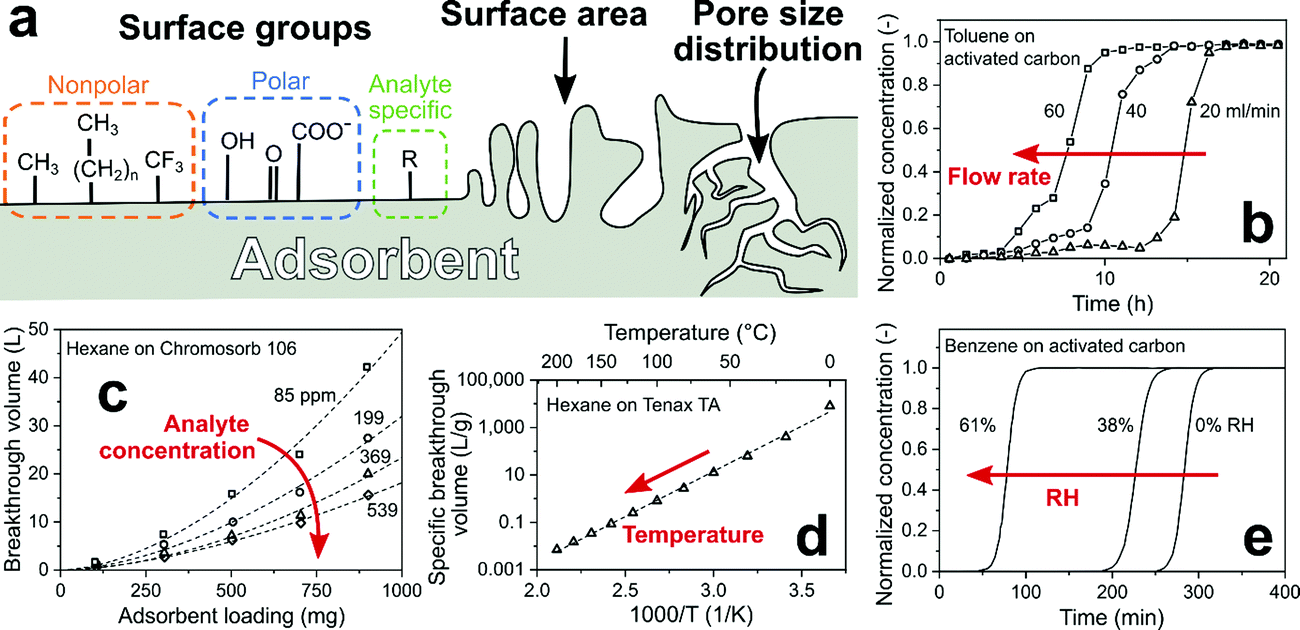 | ||
| Fig. 2 (a) Critical adsorbent (filter) properties: surface chemical groups, surface area and pore size distribution. (b) Effect of overall flow rate through the filter on the breakthrough time.84 (c) Effect of filter (adsorbent) loading and analyte concentration on breakthrough volume.85 (d) Effect of temperature on specific breakthrough volume.80 (e) Effect of RH on the breakthrough time.86 | ||
Decreasing the flow rate through the filter (adsorbent) prolongs the breakthrough time linearly (Fig. 2b),85 but typically lowers the sensor response as fewer analyte molecules reach the sensor.87 Breakthrough time multiplied by the flow rate gives the breakthrough volume that is flow rate-independent and increases proportionally with adsorbent loading since more surface area is available for analyte adsorption (Fig. 2c).85 However, larger filter loadings result in larger pressure drop88 through the filter and prolong the sensor response time. Typically, the breakthrough volume is normalized with respect to adsorbent loading.89 This material-specific property is useful in design of sorption filters and independent (for a wide range) of flow rate and adsorbent loading. At low analyte concentrations (<10 ppm), breakthrough volumes are independent of concentration, as typically seen in GC.90 This is important for gas sensing in breath analysis or indoor air monitoring where analyte concentrations are in that range (e.g., ∼500 ppb acetone in breath91 or ∼80 ppb formaldehyde in indoor air92). But concentrations can reach also hundreds of ppm in certain conditions (e.g., ethanol from cleaning products93 or propane/butane from gas cookers), where breakthrough occurs earlier as the capacity of adsorbent is exhausted. This is shown exemplarily in Fig. 2c for adsorption of 85–539 ppm hexane on a porous non-polar polymer adsorbent with large surface area (Chromosorb 106, >700 m2 g−1).85
Adsorption by physical forces is temperature-dependent (van’t Hoff law94) resulting in a steep decrease of breakthrough volumes with increasing temperature. This is shown in Fig. 2d for adsorption of hexane on a porous non-polar polymer adsorbent (Tenax TA), where increasing the temperature from 0 to 20 °C reduces the breakthrough volume by 95%.80 Heating is used to accelerate regeneration of sorption filters (e.g., packed zeolite bed75 for CH4 sensing within 2 h by heating to 250 °C) and control the separation of compounds by GC.95 Another factor is relative humidity (RH) that is omnipresent in most applications (e.g., up to 95% at 36 °C in exhaled human breath96). Adsorption of water leads to partial blocking of adsorption sites and reduces the breakthrough time, depending on adsorbent hydrophilicity. For instance, increasing the RH from 0 to 61% for weakly polar activated carbon fibers reduced the breakthrough time of benzene by 76% (Fig. 2e). In contrast, when using the non-polar polymer adsorbent Tenax TA, this time was not affected.97
Adsorbent materials & properties
Sorption filters preceding gas sensors are tabulated in Table 2, showing their composition, target analytes and figures of merit. First64 sorption filters for gas sensing were carbon-based77 (i.e., activated carbon, graphene, carbon molecular sieve, carbon fiber, etc.) as these were well established already for vapor filtration (e.g., gas masks98). Other important adsorbents include silica (silica gel99 and mesoporous silica100), porous polymers (e.g., Tenax TA101), activated alumina,102 zeolites103 and metal–organic frameworks (MOFs).104 These feature high porosity and surface area (Fig. 3a–d), resulting in high adsorption capacity. They are commercially available in a variety of shapes (e.g., powders, granules, pellets, fibers), specific surface areas, pore sizes and chemical functionalization (e.g., surface polarity).89 Specific surface areas range usually from 20 m2 g−1 for some porous polymers (e.g., Tenax GR89) up to 7000 m2 g−1 for ultra-high surface area MOFs105 (Fig. 3e).| Filter configuration | Filter material | Target analyte | Sensor | LODa (ppm) | Response time | Tested interferants (selectivity) | Ref. |
|---|---|---|---|---|---|---|---|
| a Lowest measured concentration. b Not detectable by the sensor. c Photoionization detector. d Thermal conductivity detector. e Nanoelectromechanical system. | |||||||
| Packed bed | Activated carbon | CH4 | Pellistor | 25![[thin space (1/6-em)]](https://www.rsc.org/images/entities/char_2009.gif) 000 000 |
— | Hexamethyldisiloxane (∞b) | 59 |
| CO | SnO2 | 20 | 2.5 min | Ethanol (0.11), H2 (0.07) | 76 | ||
| Ag/Al2O3 | Ethylene | Electrochemical | 0.02 | 10 min | Acetylene, NO, NO2, SO2 (all ∞b) | 141 | |
| Carbon cloth | CO | SnO2 | 15 | — | Butane, ethanol, ethyl acetate, heptane (all ∞b) | 66 | |
| Carbon cloth, charcoal granules | CH4 | Pellistor | 10000 |
12–50 s | Hexamethyldisiloxane (∞b) | 64 | |
| Indigo | Ozone | Electrochemical | 0.04 | ∼5 min | NO2 (∞b) | 143 | |
| Indigo/carbon nanotubes | NO2 | Organic semiconductor | 0.01 | — | Ozone (∞b) | 145 | |
| Zeolite 4A | H2 | SnO2 | 10 | — | H2S (∞b) | 62 | |
| Zeolite 5A | CO | Electrochemical | 0.03 | 5 s | Ethylene (∞b), H2S (∞b), CH4 (>1000), ethane (>1000), H2 (>1000) | 65 | |
| Zeolite MOR | CH4 | SnO2 | 1000 | — | Ethanol, hexane (both ∞b) | 75 | |
| Commercial GC column | Hayesep Q | H2, CH4 | SnO2 | 2 | <1 min | — | 158 |
| MXT-1 | VOCs (<14 carbon atoms) | PIDc | <0.015 | 30 min | — | 161 | |
| OV-1 megabore | Alcohols, acetaldehyde, acetone, ethyl acetate | In2O3 | 0.1 | <5 min | — | 159 | |
| OV-101 | Alkanes | TCDd | — | 5 s | — | 154 | |
| Rtx-VMS | cis-1,2-Dichloroethylene, benzene, trichloro-ethylene, toluene, terachloroethylene, p-xylene | PID | 1 μg L−1 (in liquid) | 15 min | Various ground water compounds | 157 | |
| Rtx-5 | 8 organophosphates/sulfates, 5 VOCs | NEMSe | 0.1 | 5 s | — | 158 | |
| Rxi-624 | Benzene, ethylbenzene, toluene, xylenes | PID | 0.0025 | 19 min | — | 160 | |
| Rtx-5MS, Rtx-200 | 50 VOCs | PID | — | 14 min | — | 162 and 163 | |
| Rtx-VMS, Rt Q-BOND | Formaldehyde | PID | 0.0005 | 11 min | — | 155 | |
| Not specified | Acetone | ZnO | 0.1 | 2 min | — | 156 | |
| Separation column | Activated alumina | Isoprene | Pt/SnO2 | 0.005 | 4 s | Acetone, ethanol, methanol, NH3 (all ∞b) | 71 |
| Tenax TA | Methanol | Pd/SnO2 | 1 | 102 s | Acetone, ethanol, H2 (both ∞b) | 68 | |
| Ethanol, methanol | Pd/SnO2 | 0.01 vol% (in liquid) | 10 min | — | 175 | ||
| Formaldehyde | Pd/SnO2 | 0.005 | 2 min | Acetaldehyde, acetone, CH4, CO, ethanol, methanol (all ∞b) | 176 | ||
| Overlayer | Indigo | NO2 | Organic semiconductor | 0.04 | >1 h | Ozone (>20) | 144 |
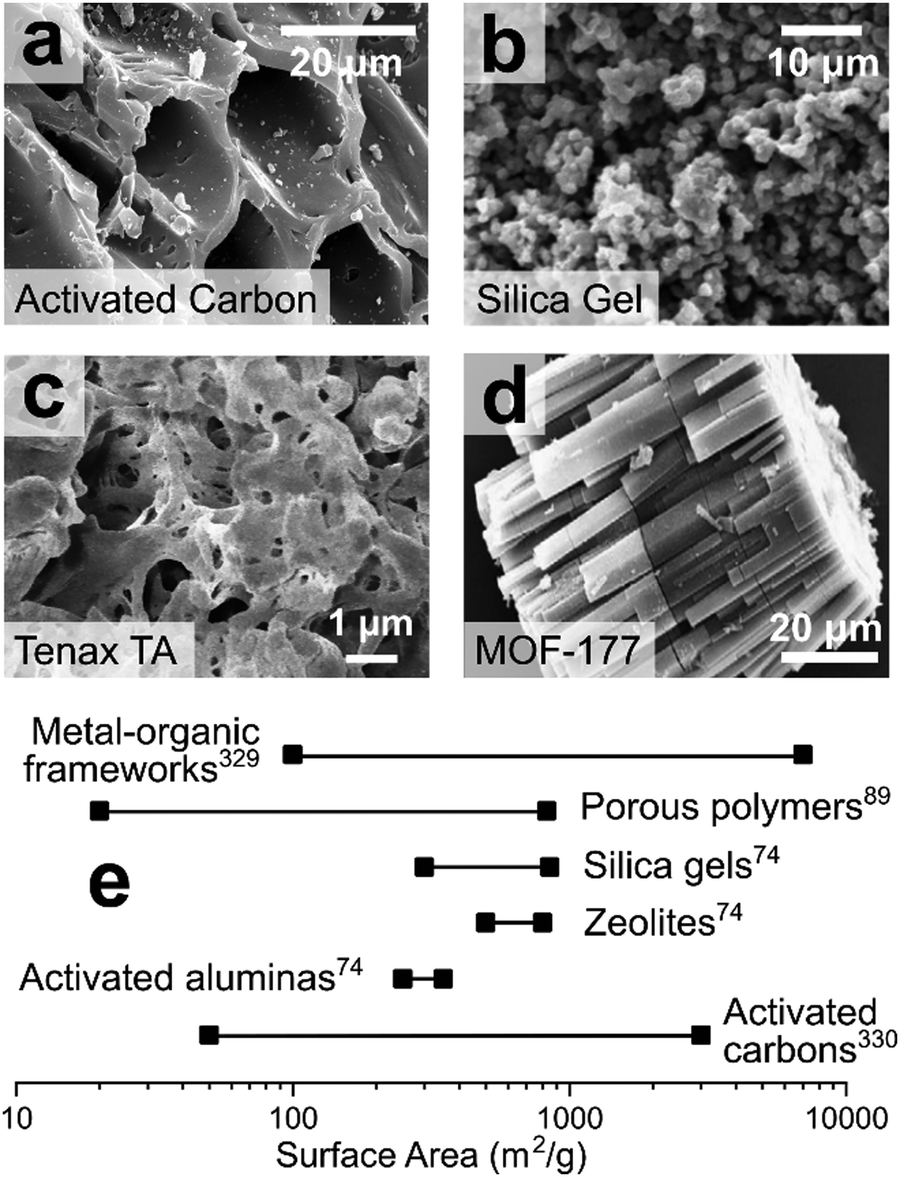 | ||
| Fig. 3 SEM images of commercial adsorbents: (a) activated carbon.118 (b) Silica gel.119 (c) Porous polymer (Tenax TA).68 (d) Metal–organic framework (MOF-177).120 (a–d) Reproduced with permission. Open Access CC BY. (e) Range of surface areas for sorption materials. | ||
Carbon-based adsorbents, silica gels, porous polymers and activated alumina typically feature a mix of meso- (2–50 nm) and micropores (<2 nm) with similar log-normal pore size distributions.106 Zeolites107 and MOFs,108 on the other hand, have a well-defined micropore size in the same order of magnitude as gas molecules (e.g., kinetic diameter of benzene109 is 0.59 nm) that depends on their composition. The accessible surface area, and thus adsorption capacity, depends often on adsorbent's pore size and analyte's molecular size. For instance, p-xylene can access the pores of adsorbent MOF-107, while m- and o-xylene cannot, resulting in enhanced adsorption capacity of p-xylene.110 When applied as dense layers or membranes, such an effect can even be used to create a sharp size cut-off (e.g., dehydration of solvents by zeolite membranes111). Also the adsorbent surface properties are crucial and can be controlled thermally (e.g., higher surface area of activated carbon at higher pyrolysis temperature112) and chemically113 (e.g., alkali treatment of activated carbon to increase adsorption of hydrophobic VOCs,114 plasma/microwave treatment,115 ammonization116 or oxidization117).
Sorption filters of relatively non-polar carbon-based adsorbents (e.g., charcoal, activated carbon) are used to remove VOCs that interfere with the selective detection of relatively inert, non-polar gases such as H2, CO or CH4 (Fig. 4a). On non-polar adsorbents, VOCs are adsorbed mostly by non-specific dispersion forces that are proportional to VOC's molecular weight.121 Such filters have been used in commercial CO sensors to meet national standards.76 For instance, the ethanol response of a SnO2 sensor is reduced by more than an order of magnitude with a charcoal filter (Fig. 4b, open vs. filled squares), in contrast to CO (circles) and H2 (triangles) that are not affected.76 Also other VOCs, such as butane, heptane, ethyl acetate66 and silicones59 are filtered out, resulting in highly selective detection of small, non-polar gases (e.g., CH476).
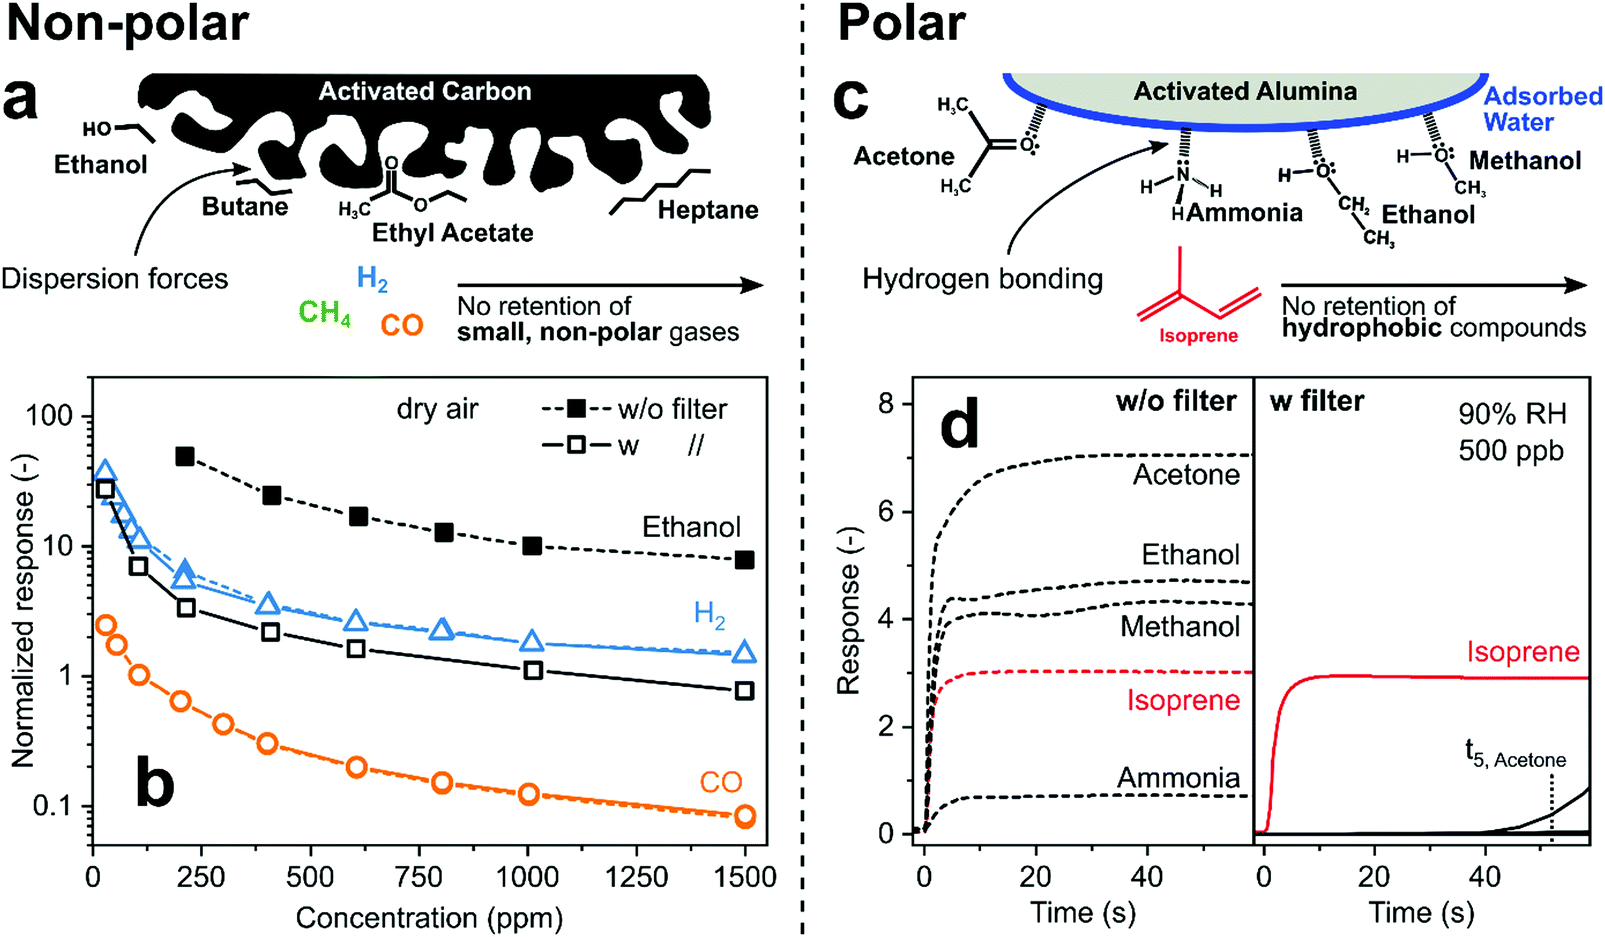 | ||
| Fig. 4 (a) Concept of non-polar activated carbon VOC filter for sensing of low molecular weight gases. (b) Responses of a SnO2 sensor to H2 (triangles), CO (circles) and ethanol (squares) without (filled symbols) and with (open) preceding activated carbon filter.76 Note that symbols for H2 and CO with and without filter are on top of each other indicating that they passed unscathed through the filter that caught most (∼90%) ethanol. (c) Concept of polar activated alumina filter that retains hydrophilic compounds while hydrophobic isoprene passes unhindered. (d) Response of a Pt/SnO2 sensor to breath-relevant analytes at 500 ppb without (left panel) and with that filter (right panel).71 | ||
In contrast, polar adsorbents interact with analytes mostly through dipole–dipole122 and hydrogen bonding,123 resulting in more specific molecule removal (e.g., alcohols, carbonyls, aldehydes). Such polar adsorbents, including activated alumina,124 silica gel,125 P2O5,126 Nafion,127 metal–organic pastes,128 CaCl129 and NaOH,130 also strongly adsorb water. So, they are used as desiccants to minimize the impact of humidity that compromises sensor performance (e.g., SnO2).131 For example, activated alumina is covered by a thin water layer in the presence of humidity132 that adsorbs hydrophilic analytes such as alcohols, ketones and ammonia by hydrogen bonding, while hydrophobic hydrocarbons are not affected (Fig. 4c). This facilitated selective sensing of isoprene, a non-invasive marker for cholesterol and other metabolic conditions,133 by a packed bed filter of commercial activated alumina (1 g only) upstream of a non-selective Pd/SnO2 sensor at 90% RH.71 While that sensor without filter is not selective (Fig. 4d), only isoprene is detected with the filter during 40 s of exposure before hydrophilic analytes break through (e.g., acetone after 52 s). This is much shorter than typically obtained with carbon-based filters (>1 h134) due to their much higher surface area (>1000 vs. 155 m2 g−1, for activated carbon and alumina, respectively), but sufficient for end-tidal breath measurements135 and buffered samplers.136 The resulting isoprene selectivity by using this filter outperforms71 other TiO2,137 Ti/ZnO138 and h-WO3139 sensors for isoprene.
More specific interaction includes silver ions that adsorb ethylene quite selectively due to π–π interactions.140 This was used for selective detection of ethylene for monitoring fruit ripeness using a Ag-doped alumina filter.141 After sampling and trapping of ethylene, it is released by heating the filter to 60 °C, and detected by a non-specific amperometric sensor without interference by NO, NO2, SO2 and acetylene.141 Another example is indigo, whose reactive C![[double bond, length as m-dash]](https://www.rsc.org/images/entities/char_e001.gif) C bond selectively reacts with ozone.142 This is used by NO2 sensors in the form of indigo-impregnated filter paper,143 indigo layers directly deposited on a semiconducting sensor144 or indigo dispersed in a packed bed of carbon nanotubes145 to mitigate interference by ozone. Using differential sensing techniques, such indigo filters were even used for selective ozone detection.143 Such analyte-specific interactions were obtained also during formation of chemical complexes,146 for instance, ammonia with CaCl147 or CuBr34 forming Cu(NH3)2+. The first was used to reduce ammonia concentrations in breath from 10 ppm to only 0.8 ppm while other breath analytes were not influenced.129 The second has been applied for sensing ammonia down to 5 ppb at room temperature and 90% RH,148 but could be used as filter as well. Also quite promising for sorption filters is chemical derivatization, used for instance for selective removal of aldehydes in gas mixtures (e.g., indoor air) by 2,4-dinitrophenylhydrazine.4 Another option is surface acidity/basicity tuning for preferential adsorption of bases/acids (e.g., acetic acid on basic Y/ZnO149).
C bond selectively reacts with ozone.142 This is used by NO2 sensors in the form of indigo-impregnated filter paper,143 indigo layers directly deposited on a semiconducting sensor144 or indigo dispersed in a packed bed of carbon nanotubes145 to mitigate interference by ozone. Using differential sensing techniques, such indigo filters were even used for selective ozone detection.143 Such analyte-specific interactions were obtained also during formation of chemical complexes,146 for instance, ammonia with CaCl147 or CuBr34 forming Cu(NH3)2+. The first was used to reduce ammonia concentrations in breath from 10 ppm to only 0.8 ppm while other breath analytes were not influenced.129 The second has been applied for sensing ammonia down to 5 ppb at room temperature and 90% RH,148 but could be used as filter as well. Also quite promising for sorption filters is chemical derivatization, used for instance for selective removal of aldehydes in gas mixtures (e.g., indoor air) by 2,4-dinitrophenylhydrazine.4 Another option is surface acidity/basicity tuning for preferential adsorption of bases/acids (e.g., acetic acid on basic Y/ZnO149).
Analyte separation in time
Sorption filters can also act as GC columns to separate analytes in time rather than remove them completely.150 For this, the analyte-containing gas sample is carried through the filter by a gas (e.g., helium, nitrogen and rarely air) with a pump or pressurized gas cylinder. Most GC-sensor systems (partition or gas–liquid GC)95 use open tubular columns (coated with a liquid phase on the inside),150 which are heated to control analyte separation.151 If the elution (retention) times of analytes are quite apart, analytes can be detected sequentially by the sensor resulting in very high selectivity and multi-analyte detection capacity (e.g., H2 and CH4 in breath152). An inherent drawback of GC-sensors is their batch nature, preventing continuous monitoring of analytes. However, by miniaturizing GC-systems for low sample and dead volumes and optimizing column heating protocols, analysis time can be reduced to a few seconds.153The first GC-sensor systems were combinations of GC columns with a portable gas sensor.154 They selectively detected a variety of analytes, including formaldehyde,155 breath acetone,156 VOCs from groundwater headspace,157 H2 and CH4,158 alcohols159 and aromatics160 with limits of detection as low as 15 ppt.161 Even highly complex mixtures of up to 50 analytes162 could be separated by 2-dimensional GC techniques (two columns in series) with validated performance for occupational exposure monitoring.163 Such GC-sensor systems are available commercially, for instance the Defiant TOCAM164 or Dräger X-pid165 for broad chemical analysis or the Quintron Breath Tracker152 for breath H2 and CH4 in the diagnosis of lactose malabsorption. However, such systems are expensive (several hundred dollars for the column alone), bulky (coiled column of several meters length), heavy (several kg) and require high power (for heating of the column), making them not suitable for battery-powered and handheld detectors.
Micro GC-sensor systems can be based entirely on microelectromechanical systems (MEMS)166 using planar (i.e., microchip) GC columns,154 resulting in much smaller and portable systems, i.e., mountable on a belt167 (Fig. 5a). Such systems can reach separation performance close to benchtop GCs, as illustrated in Fig. 5b where 21 different VOCs are separated within 200 s by a GC-flame ionization detector (FID, red chromatogram) and the micro GC-sensor system (blue chromatogram).167 They have been tested with a variety of analyte mixtures, including indoor air pollutants,168 lung cancer biomarkers,169 chemical warfare agents,170 aromatics,171 trichloroethylene in indoor air,172 explosive markers173 or VOCs for workplace exposure safety.174 However, GC-sensor devices with proven performance under real conditions validated with a benchtop device (e.g., as shown in Fig. 5c for personal exposure monitoring of trichloroethylene with a GC-FID and the belt-mounted GC-sensor device167) are rare.
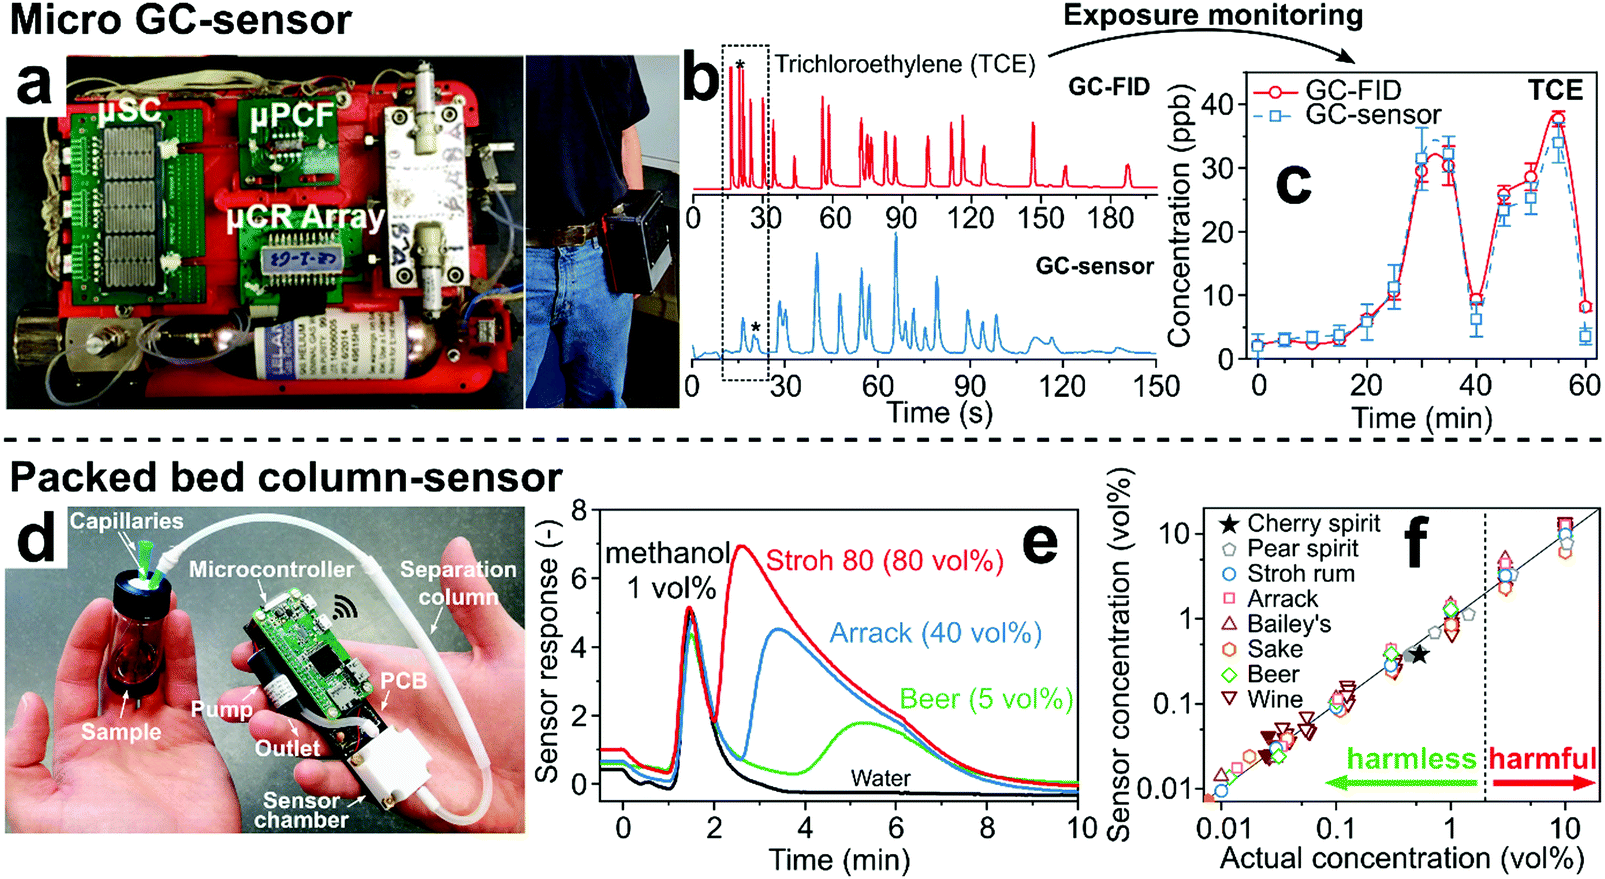 | ||
| Fig. 5 (a) State-of-the-art micro GC-sensor system consisting of micropreconcentrator-focuser (μPCF), microseparation column (μSC) and microchemiresistor array (μCR array) that can be mounted on a belt. Reproduced with permission.167 Copyright 2019 American Chemical Society. (b) Chromatograms of a mixture of 21 VOCs by a benchtop GC-FID and by the micro GC-sensor system showing similar separation performance for both systems.167 (c) Selective monitoring of trichloroethylene over 60 min by a belt-mounted micro GC-sensor system (dashed line) in comparison to measurements by benchtop GC-FID (solid line).167 (d) Handheld analyzer for measurement of methanol in laced beverages. Reproduced with permission.175 Copyright 2020 Springer Nature. (e) Sensor response after sampling of Stroh 80, Arrack, beer and water laced with 1 vol% methanol.175 (f) Scatter plot of the sensor-measured methanol concentrations versus the actual concentration for beverages laced with harmless and harmful methanol concentrations.175 | ||
Simpler implementation is achieved by focusing on single analytes for specific applications. An example is a detector consisting of a non-specific Pd/SnO2 gas sensor and a compact separation column for screening of methanol in alcoholic beverages and exhaled breath to detect liquor adulteration and diagnose methanol poisoning non-invasively.68 The detector is handheld (94 g), fully integrated, inexpensive and can communicate results by Wi-Fi to a smartphone (Fig. 5d).175 It uses a compact packed bed (4.5 cm long, 4 mm diameter) of commercial Tenax TA sorbent with room air as carrier gas instead of a capillary or microchip GC column.68 As a result, methanol is detected selectively in the headspace of alcoholic drinks laced with 1 vol% methanol within 2 min (Fig. 5e).175 After flushing the column with room air for 10 min,68 it is fully regenerated and ready for the next measurement. The device revealed harmless from harmful concentrations of methanol down to 0.01 vol% in different wines, beers and liquors from six continents (Fig. 5f).175
This concept of simple packed bed separation columns can be adapted easily to other applications. For example, using a larger (500 mg) Tenax TA separation column, formaldehyde was measured within 2 min at concentrations as low as 5 ppb at 40% RH without interference by H2, CH4, CO, methanol, acetaldehyde, ethanol, and acetone. As a result, ppb-level formaldehyde concentrations were detected for the first time in wood-product emissions and in indoor air with a low-cost solid-state sensor.176 This is possible by the very high selectivity provided by the simple and modular packed bed sorption column, which cannot be reached typically by sensors alone (e.g., ZnO/ZIF-8 core–shell structures,177 NiO–SnO2 microflowers178) or their arrays (e.g., four SnO2-based sensors138).
3. Size-selective filters
Definitions & principles
Size-selective filters separate analytes by their kinetic diameter. These filters are microporous179 with pore sizes (usually <2 nm) comparable to analyte diameters. If applied as membranes in front of the sensor, analytes larger than the pore size are blocked (i.e., size cut-off) from reaching the sensor (Fig. 6a). This can result in very high selectivity to target analytes over hundreds of interferants typically present in such mixtures (e.g., VOCs in indoor air180 such as terpenes, alkenes, aromatic hydrocarbons). A drawback of such filters is their ineffectiveness for interferants smaller than the target analyte, which can be addressed by combination with other filter types or selective sensing materials. All size-selective filter–sensor systems are tabulated in Table 3 together with various figures of merit for comparison.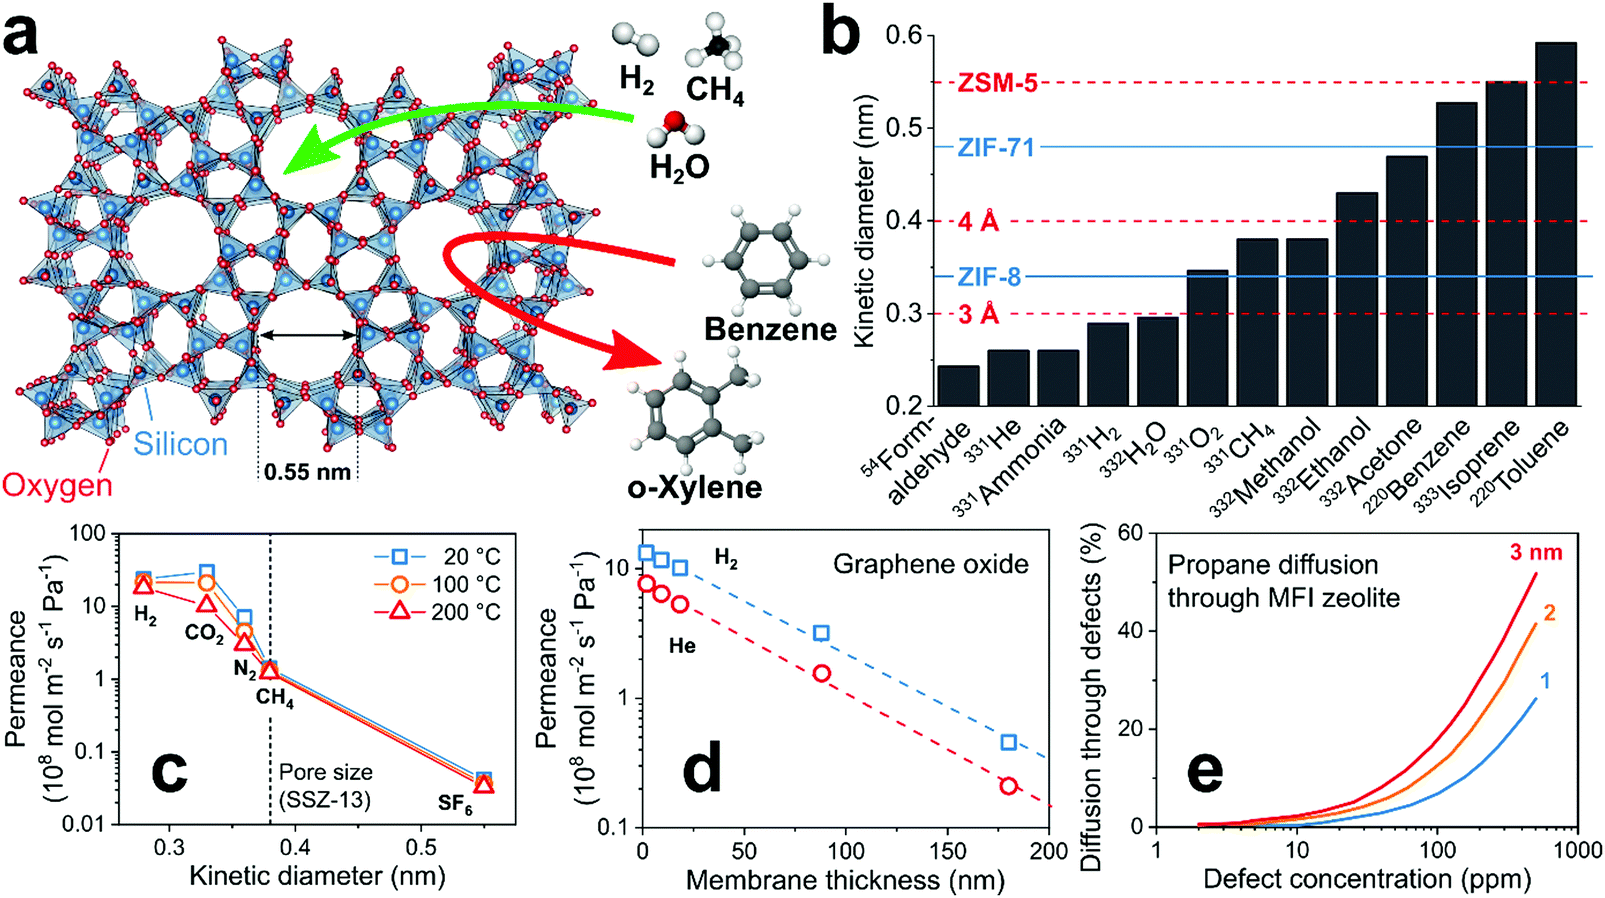 | ||
| Fig. 6 (a) Working principle of a size-selective zeolite filter. Arrows indicate blocked (red) and possible (green) diffusion through the microporous structure. (b) Kinetic diameters of common analytes in gas sensing and pore sizes of commonly used zeolites107 (dashed lines) and MOFs181 (solid lines). (c) Effect of analyte kinetic diameter on membrane permeance at three temperatures.182 (d) Effect of membrane thickness on permeance.183 (e) Effect of membrane defect size and concentration on diffusion of analytes through such defects.184 | ||
| Filter configuration | Filter material | Target analyte | Sensor | LODa (ppm) | Response time | Tested interferants (selectivity) | Ref. |
|---|---|---|---|---|---|---|---|
| a Lowest measured concentration. b Not detectable by the sensor. | |||||||
| Overlayer | PMMA | H2 | Plasmonic | 10 | <1 s | CH4 (63), CO2 (32), CO (2.1), NO2 (0.12) | 69 |
| SiO2 | H2 | SnO2 | 20000 |
— | CH4 (>1000) | 199 | |
| 50 | 60 s | Butane (>500), CH4 (>500), CO (>500), ethanol (18), methanol (11) | 203 | ||||
| 1000 | <1 min | Acetone, benzene, ethanol (all >1000) | 204 | ||||
| 3100 | >1 min | CH4, propane (both >1000) | 208 | ||||
| 0.250 | >1 h | CH4 (>100), ethanol (>100), CO (>50) | 209 | ||||
| Ga2O3 | 500 | <30 s | Acetone, CH4, CO, CO2, ethanol, isobutene, propane, NH3, NO | 200 | |||
| In2O3 | 100 | 5 s | CH4 (>100), isobutane (12), CO (6.8), ethanol (<1) | 202 | |||
| MOF ZIF-8 | Formaldehyde | ZnO | 10 | 21 s | Toluene (>100), acetone (10.6), ethanol (7.4), methanol (6.5), NH3 (5.1) | 177 | |
| H2 | ZnO | 10 | — | Benzene (12), NH3 (4.2), acetone (3.1), ethanol (2) | 181 | ||
| 10 | >5 min | Benzene, toluene (both ∞b) | 220 | ||||
| 5 | >5 min | CO (37) | 227 | ||||
| Pd/ZnO | 10 | >5 min | Acetone, benzene, ethanol, toluene (all ∞b) | 228 | |||
| MOF ZIF-71 | H2S | WO3 | 2 | 2 min | Ethanol (19), acetone (11), NO2 (3.4) | 230 | |
| H2 | ZnO | 20 | — | Acetone (1.9) | 234 | ||
| Ethanol | ZnO | 10 | — | Benzene (27), NH3 (13), H2 (3.7), acetone (1.3) | 181 | ||
| Zeolite FER | CO | La2O3–Au/SnO2 | 50 | — | Isopropanol (20), ethylene (15), ethanol (13), H2 (9) | 237 | |
| Zeolite LTA | NO | Zn1−xCuxO | 0.050 | <1 min | Acetone, CO2, ethanol, H2, NH3 | 239 | |
| Ethanol | Pd/SnO2 | 10 | 1.7 min | CH4 (>1000), propane (>400), CO (>100), H2 (>100) | 236 | ||
| 20 | 16 min | H2O (>4000), CH4 (>200), propane (74), CO (35), H2 (31) | 223 | ||||
| WO3, Cr2TiO5 | 21 | >30 min | CO (>1000) | 238 | |||
| Zeolite MFI | Ethanol | Pd/SnO2 | 20 | 3 min | H2O (>1000), CH4 (>100), propane (83), CO (6.2), H2 (2.2) | 223 | |
| WO3, Cr2TiO5 | 21 | >5 min | CO (>100) | 238 | |||
| Zeolite FAU, BEA, MOR | Acetone, ethanol, NH3, NO2 | ZnO | 1 | — | — | 240 | |
| Mix. (LTA, FAU, MFI) | — | SnO2 | 2.5 | <5 min | Acetone, butane, CO, ethane, ethanol, isopropanol, propane, toluene | 241 | |
| Overlayer (graded thickness) | SiO2 | CO | WO3 | 100 | — | — | 201 |
| Acetone, CO, isopropanol | Pt/SnO2 | 0.5 | — | — | 211 | ||
| H2S, NH3 | WO3 | 0.2 | >1 min | Ethanol, H2O | 212 | ||
| Indoor air contaminants | SnO2, WO3 | <1 | <5 s | — | 213 | ||
| Overlayer (patterned) | SiO2 | Alcohols, aldehydes | SnO2 | — | — | — | 214 |
| Hexane | SnO2 | — | >1 min | 2,2-Dimethylbutane (>82), 2-methylpentane (82) | 215 | ||
| Membrane | Graphene oxide | H2S | PdO/WO3 | 1 | 30 s | Acetone (14), NH3 (14), formaldehyde (13), ethanol (11), toluene (11), methanethiol (4) | 219 |
| Zeolite MFI | Formaldehyde | Pd/SnO2 | 0.03 | 8 min | Ethanol (>1000), isoprene (>1000), methanol (>1000), NH3 (>1000), TIPB (>1000), acetone (>100) | 242 | |
Most promising microporous materials are zeolites,185 MOFs186 and covalent organic frameworks187 (COF) featuring pore sizes that depend on crystal structure and composition. An advantage is the myriad of available frameworks (e.g., 248 zeolites,107 thousands of MOFs and COFs188) offering distinct pore sizes that can be matched flexibly to target analytes. This is illustrated in Fig. 6b, showing the kinetic diameters of common analytes in gas sensing and the pore size of selected zeolites (red) and MOFs (blue). Because of their high internal surface area and intrinsic microporosity, zeolites and MOFs are used frequently for catalysis189 (e.g., production of styrene with zeolite ZSM-5 catalyst190), gas storage191 (e.g., H2 in MOF Cu-EMOF192) and even sensors (e.g., chemoresistive54 or optical193 MOFs and zeolites58).
The selectivity of such filters is characterized by the analyte permeance (molar flux per unit driving force).194 The permeance strongly depends on analyte size as shown in Fig. 6c exemplarily for a zeolite (SSZ-13) membrane with 0.38 nm pore size (dashed line).182 In fact, H2 (0.28 nm) features almost three orders of magnitude higher permeance than SF6 (0.55 nm). However, differences in adsorption strength between analytes can influence the permeance.195 For instance, CO2 preferentially adsorbs on SSZ-13, hindering diffusion of other compounds in gas mixtures through the zeolite.182
A key property of size-selective filters is their thickness that is inversely proportional to analyte permeance, as shown exemplarily for H2 and He on 1.9–180 nm thick microporous graphene oxide (GO) layers (Fig. 6d).183 Thus, thin layers are needed for fast sensor responses. This often comes at the cost of higher defect density (e.g., cracks or pinholes), compromising separation selectivity since analytes can pass through the defects. The relation between defect concentration and diffusion is shown in Fig. 6e for propane and zeolite MFI membranes.184 Even extremely low defect concentrations reduce drastically analyte selectivity.184 Thus, a major challenge for effective size-selective filters is the synthesis of thin and defect-free ones (e.g., MOFs,196 zeolites184 and GO197). Mixed matrix membranes (MMM)198 that consist of a microporous material dispersed in a polymer matrix are promising also. The MMMs can be easily processed to thin membranes with a small number of defects, resulting in high permeance while preserving selectivity.
Pore-size control
First size-selective filters were layers of amorphous SiO2 directly on top of sensing films (e.g., SnO2,199 Ga2O3,200 WO3201 or In2O3202). These were obtained at elevated temperature (>500 °C) under exposure of the sensing film to a silicone source (e.g., hexamethyldisiloxane).203 The resulting microporous SiO2 layer is impenetrable for most analytes except for very small H2, resulting in a more than 100 times higher H2 selectivity204 to VOCs (e.g., ethanol, acetone and benzene). This is remarkable for chemoresistive H2 sensors, which offer low limit of detection (e.g., 10 ppb by CeO2/In2O3205) that is critical for leak detection,206 but typically suffer from poor selectivity207 (e.g., <13 to CO for that sensor205). However, the introduced diffusion barrier also increased response and especially recovery times of sensors from seconds to several minutes208 or even hours209 depending on SiO2 thickness. This is too long for most applications (e.g., seconds for leak detection210).Capitalizing on the effect of filter layer thickness on analyte permeance (Fig. 6d), SiO2 layers with graded thickness211 had also been deposited on chemoresistive microarrays, allowing slight selectivity modulation from sensor to sensor. While individual sensors remain unspecific, different analytes (e.g., formaldehyde, CO, ammonia, acetone, etc.) were distinguished by pattern analysis in offline breath analysis212 and air quality monitoring.213 The pore size and shape of SiO2 can even be adjusted flexibly by molecular imprinting of adsorbed molecules as template during deposition.214 For instance, templating such layers on SnO2 sensors with benzaldehyde resulted in high selectivity to linear hexane over its branched isomers.215 Templating with smaller butanal, however, reduced responses to all analytes.215
Other microporous materials allow even more flexible control over pore size to adjust selectivity. For instance, pristine graphene oxide (GO) membranes have a narrow pore size distribution <0.3 nm216 that is typically adjusted (i.e., size and density) by physical (e.g., ion-bombardment217) and chemical treatments (e.g., oxidative etching218). Such dense and porous GO membranes with small (0.3–0.4 nm) and large (0.5–0.6 nm) pores were placed upstream of PdO/WO3 sensors for selective detection of H2S (Fig. 7a).219 The sensor with dense GO layer (Fig. 7b, squares) showed lower H2S selectivity and sensitivity than the sensor alone (circles), as all analytes cannot pass the small intrinsic GO pores. For GO layers with large (triangles) and small (diamonds) pores, the H2S selectivity is increased to formaldehyde and large analytes (i.e., ethanol, acetone and toluene 0.59 nm220) compared to the sensor alone. For instance, the selectivity to acetone is tripled (from 4.7 to 14) by covering the sensor with a GO layer having small pores, while response and recovery times did not change much. However, analytes smaller than the pore size (i.e., ammonia 0.29, H2S 0.36 and methanethiol 0.45 nm) can pass through the pores more easily, so the H2S selectivity is increased less. The exception is formaldehyde (0.23 nm), probably due to its preferential adsorption221 on GO. Overall, the obtained H2S selectivity is only moderate (<15 over ammonia and ethanol) and surpassed by other chemoresistive H2S sensors (e.g., >700 over ammonia and ethanol by CuO222). However, these modular GO layers could be combined readily also with other, more selective H2S sensors.
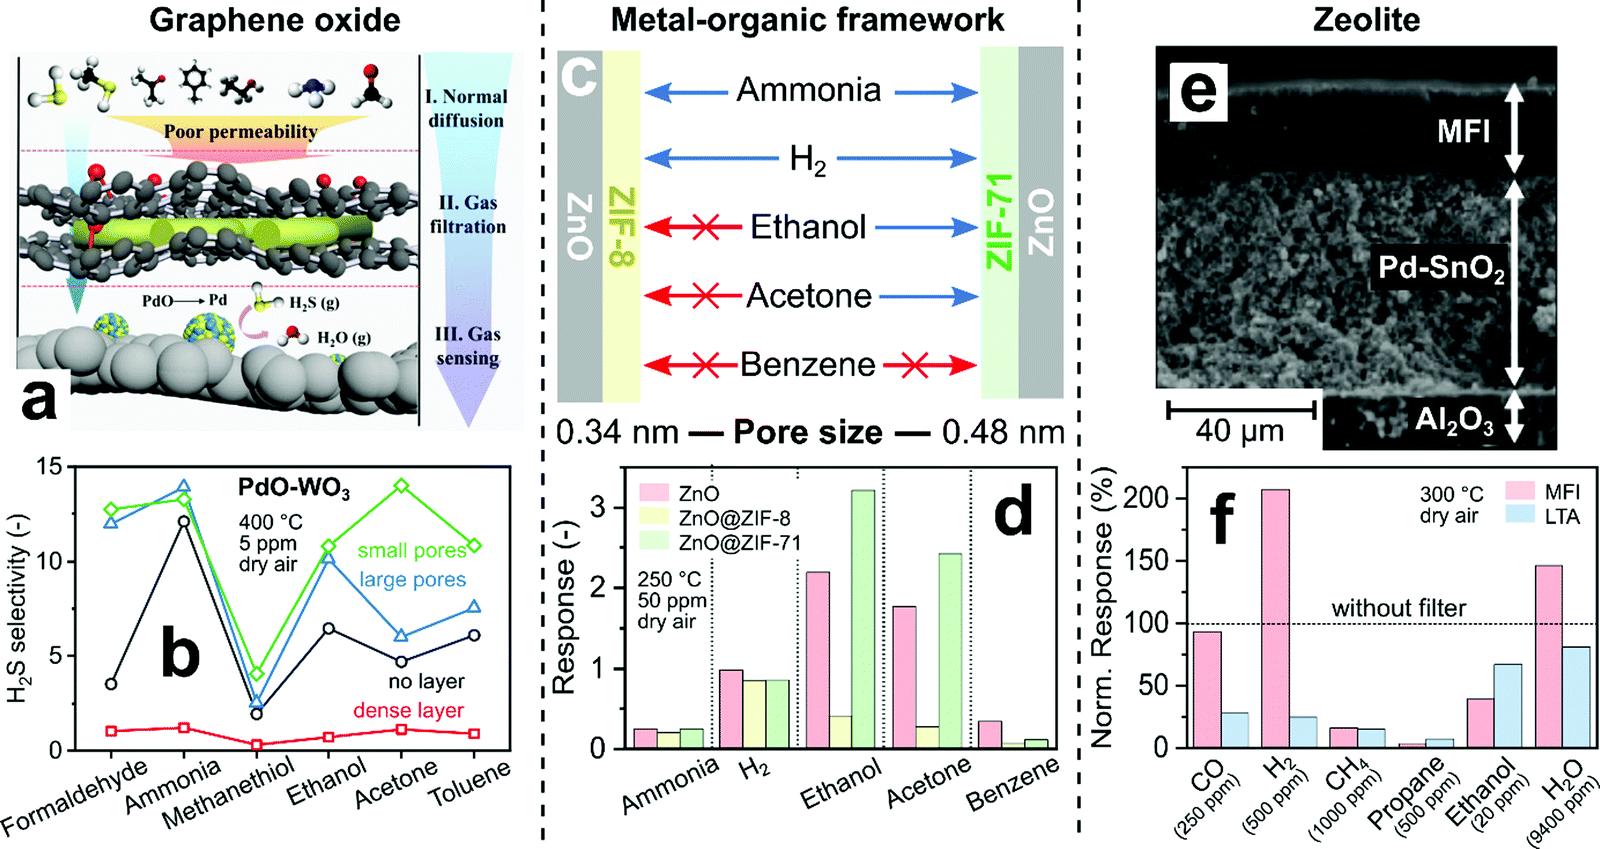 | ||
| Fig. 7 (a) Concept for H2S selective sensor by GO filter membrane. Reproduced with permission.219 Copyright 2020 American Chemical Society. (b) H2S selectivity over various confounders of a PdO-doped WO3 sensor with GO filter membranes.219 (c) Pore size-dependent selectivity of ZnO nanorods covered by metal–organic frameworks ZIF-8 and ZIF-71. Arrows indicate if an analyte's diameter is smaller (blue) or larger (red) than the MOF pores. (d) ZnO sensor response without (red) and with ZIF-8 (yellow) or ZIF-71 (green) MOF overlayers.181 (e) Cross-section image of a Pd-doped SnO2 sensing film on Al2O3 support coated with MFI zeolite. Reproduced with permission.223 Copyright 2007 Elsevier. (f) Pd/SnO2 sensor responses with hydrophobic MFI or hydrophilic LTA overlayers normalized to sensor responses without filter (line).223 | ||
Zeolites and MOFs feature very narrow pore size distributions. While MOFs have been used as selective sensor materials (e.g., interference224- or luminescent225-based), the first implementation as auxiliary size-selective filters were ZIF-8 layers directly grown on ZnO nanowire sensors operated at 300 °C.220 The ZIF-8 membrane features pore openings of 0.34 nm,226 smaller than most analyte diameters (Fig. 6b). While the sensor without filter showed low (<5) H2 selectivity to toluene and benzene, their responses are completely blocked by the ZIF-8 layer irrespective of their concentration, resulting in high H2 selectivity. Using ZIF-8 as filter also blocked CO,227 ethanol228 and acetone.228 These results outperform even SiO2-covered sensors, especially as response and recovery times are unscathed due to the very thin (2–3 nm228) ZIF-8 thicknesses. They are only outperformed by other sensor technologies such as optical nanoplasmonic sensors,229 which however typically suffer from higher detection limits (∼100 ppm229).
By using MOFs with different pore sizes, the selectivity can be changed drastically using the same sensor, as shown exemplary in Fig. 7c and d for MOF-coated ZnO nanorods.181 With ZIF-8 coating (Fig. 7d, yellow bars), most of ammonia and H2 pass through, giving similar responses to bare sensors (red bars, reduced by <20%). The responses for larger analytes (i.e., ethanol, acetone and benzene), however, decreased by a factor of 4–6. In contrast, for ZIF-71 coatings with larger pore opening (0.48 nm, green bars), ethanol and acetone pass through and even show slightly higher sensor response than the uncoated sensor. Such increased responses were also observed for H2S on ZIF-71 covered WO3 sensors230 and were attributed to enhanced analyte adsorption onto the ZIF-71.231
Besides framework composition, the pore size of MOFs232 and zeolites233 can also be adjusted by encapsulation of ions or nanoparticles in their pores. For instance, the selectivity of a ZnO sensor coated with ZIF-71 was tuned by incorporation of silver nanoparticles.234 With increasing nanoparticle size and concentration, the response to acetone decreased by 64%, while that to H2 increased by 83%.234 These results show how size-selective filters enable the control of sensor selectivity based on analyte size – otherwise impossible by sensor materials, arrays or other filter types that interact mostly chemically with the analytes.
Fig. 7e and f shows the effect of different zeolite frameworks on the selectivity of a Pd-doped SnO2 sensor operated at 300 °C in dry air.223 MFI and LTA zeolite layers (∼25 μm thickness with pore sizes 0.47 and 0.42 nm,107 respectively) were grown directly on screen-printed sensors (Fig. 7e) by seeding their surface with zeolite crystals and subsequent solvothermal synthesis.235Fig. 7f shows the response with MFI (red bars) and LTA (blue bars) to different analytes normalized to the response without zeolite layer. While this sensor is non-specific, by adding an MFI layer, it responds selectively to H2, CO and H2O. In contrast, LTA increased primarily the selectivity to ethanol and H2O. Both layers significantly reduced the responses to propane and CH4, but also increased response times from 38 s to 3 and 16 min with LTA and MFI layers, respectively. The selectivity changes were mostly attributed to zeolite adsorption characteristics (LTA is hydrophilic and MFI hydrophobic) and not to size-selective diffusion, as the zeolite layers showed a large number of intra-crystalline voids (i.e., defects leading to unselective diffusion as shown in Fig. 6e). Layers with similar performance were prepared also by simple micro-dropping of zeolite suspensions directly on sensors to preserve their film integrity.236
A variety of zeolites coated on different sensors (e.g., FER on Au–La2O3/SnO2,237 LTA and MFI on WO3,238 Cr2TiO5238 and Zn1−xCuxO,239 array of FAU, BEA and MOR on ZnO240 and mixtures of LTA, FAU and MFI on SnO2241) showed a modulation of sensor response. For instance, ethanol selectivity over isopropanol of SnO2 sensors was improved from 1.0 to 4.2 by covering with ∼26 μm of MFI zeolite.241 However, the achieved selectivities were only moderate (<20), in the range typically observed for different sensor compositions without the need for filters and not yet suitable for low concentration analyte detection in complex mixtures (e.g., breath or indoor air). Furthermore, the selectivity improvements often cannot be attributed to size-selective filtering alone. In fact, they are often a complex interplay between (i) diffusion resistance, (ii) size-selectivity, (iii) preferential adsorption as a result of different filter surface properties (Section 2) and (iv) catalytic effects as a result of the thermal coupling of filter to the (typically) heated sensor (Section 4).
Filter configuration
Size-selective filters can be implemented as direct coatings (i.e., overlayer)237 or as membranes (free-standing219 or on a macroporous support242) placed in front of sensors. Both configurations offer distinct dis/advantages as shown here exemplarily with two filter–sensor systems for selective formaldehyde detection:The first system uses a ZIF-8 MOF overlayer (∼200 nm thick) directly formed on a ZnO sensor (Fig. 8a).177 While such coating of sensors with size-selective materials is attractive to maintain a compact sensor configuration, it leads to elevated filter temperature through its contact with the heated sensor (here 300 °C). This often degrades the size-selectivity as most microporous materials are catalytically active.243 The ZnO sensor without filter is mostly non-selective, giving high responses to a variety of analytes (Fig. 8b). With filter layer (Fig. 8c), responses to formaldehyde and ammonia, that are smaller than the ZIF-8 pores, are reduced only slightly. Also the sensor response times stay similar (14 to 21 s) because of the thin (∼200 nm) filter layer. Large molecules such as toluene are blocked by the filter, resulting in pronounced formaldehyde selectivity >100, even in the presence of high humidity (>90% RH). However, other analytes larger than the pore size (i.e., methanol, ethanol and acetone) are not held back, probably because of catalytic conversion244 to smaller molecules on the heated ZIF-8 layer interacting with the ZnO. As a result, only moderate selectivities (5–11) are achieved that might be insufficient for measurement of formaldehyde in indoor air where interferant concentrations can be orders of magnitude higher.245 However, such size-selective ZIF-8 layers could be combined with other formaldehyde-selective sensors (e.g., In4Sn3O12,30 NiO–SnO2,178 Co/In2O3246 or ZnO quantum dots loaded hollow SnO2 nanospheres247) or sensor arrays138 to further boost their selectivity. Alternatively, size-selective overlayers can be applied on room temperature sensors to avoid catalytic conversion of interferants.
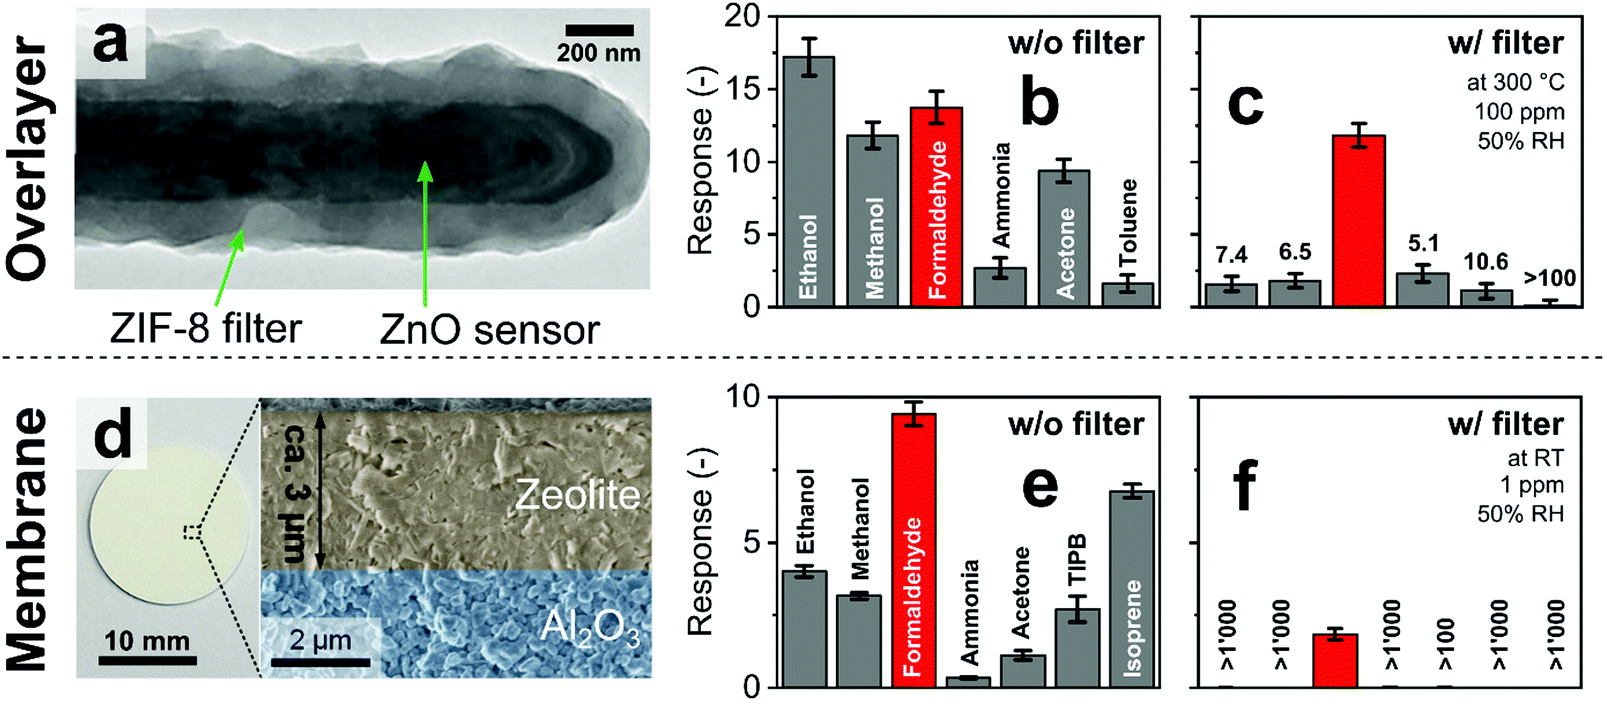 | ||
| Fig. 8 (a) ZnO sensing nanorods covered by a microporous overlayer of ZIF-8 MOF. Reproduced with permission.177 Copyright 2016 American Chemical Society. Sensor response without (b) and with ZIF-8 overlayer (c) to indoor air-relevant analytes with the corresponding formaldehyde selectivities.177 (d) Microporous MFI zeolite membrane grown on a macroporous alumina substrate. Reproduced with permission.242 Copyright 2018 Elsevier. Response of a Pd-doped SnO2 sensor without (e) and in combination with MFI zeolite membrane (f) to indoor air-relevant analytes with corresponding formaldehyde selectivities.242 | ||
In contrast, size-selective membrane filters can be produced individually with good control over morphology (e.g., thickness248) and can be combined as separate units more flexibly with sensors (e.g., electrochemical, optical). Fig. 8d–f shows an example where a size-selective membrane of MFI zeolite was formed on a macroporous Al2O3 support (Fig. 8d) and placed upstream of a Pd-doped SnO2 sensor.242 Similar to uncoated ZnO, the Pd-doped SnO2 sensor (Fig. 8e) alone is not selective. In contrast to the overlayer, however, the membrane features a size-cutoff, as analytes larger than the pore size (i.e., isoprene and TIPB) are barely detected by the sensor (Fig. 8f). Interestingly, also smaller analytes (i.e., methanol, ethanol, acetone and ammonia) are blocked effectively by the membrane, probably as a result of adsorption effects. So, excellent formaldehyde selectivity up to more than 1000 is achieved even at low concentrations down to 30 ppb at 90% RH, unmatched by most chemoresistive sensors. A drawback of this configuration, however, is the larger zeolite thickness (∼3 μm) that introduces a high diffusion resistance. As a result, the formaldehyde response is reduced by a factor of 5 and the response and recovery times increased to 8 and 72 min,242 respectively, significantly higher than those with overlayers (Fig. 8a–c).177
4. Catalytic filters
Definitions & principles
Catalytic filters exploit differences in chemical reactivity between analytes to enhance the selectivity of downstream sensors. Ideally, the target analyte passes the filter intact, while interferants convert fully on the filter (catalyst) to inert species undetected by the sensor, as illustrated in Fig. 9a. Nevertheless, partial analyte conversion and formation of intermediates has been observed.249 As a result, interferants are eliminated or their concentration is reduced substantially, resulting in high sensor selectivity. Most importantly with respect to other filters, catalytic ones operate continuously250 (and do not saturate like sorption filters, Section 2). This is a distinct feature if interferants are present constantly in the background air (e.g., ethanol from cleaning products93 or disinfectants251). However, catalytic filters usually require some heating to optimize selectivity, which can be circumvented if the catalytic filter is deposited directly onto the heated sensing film as an overlayer.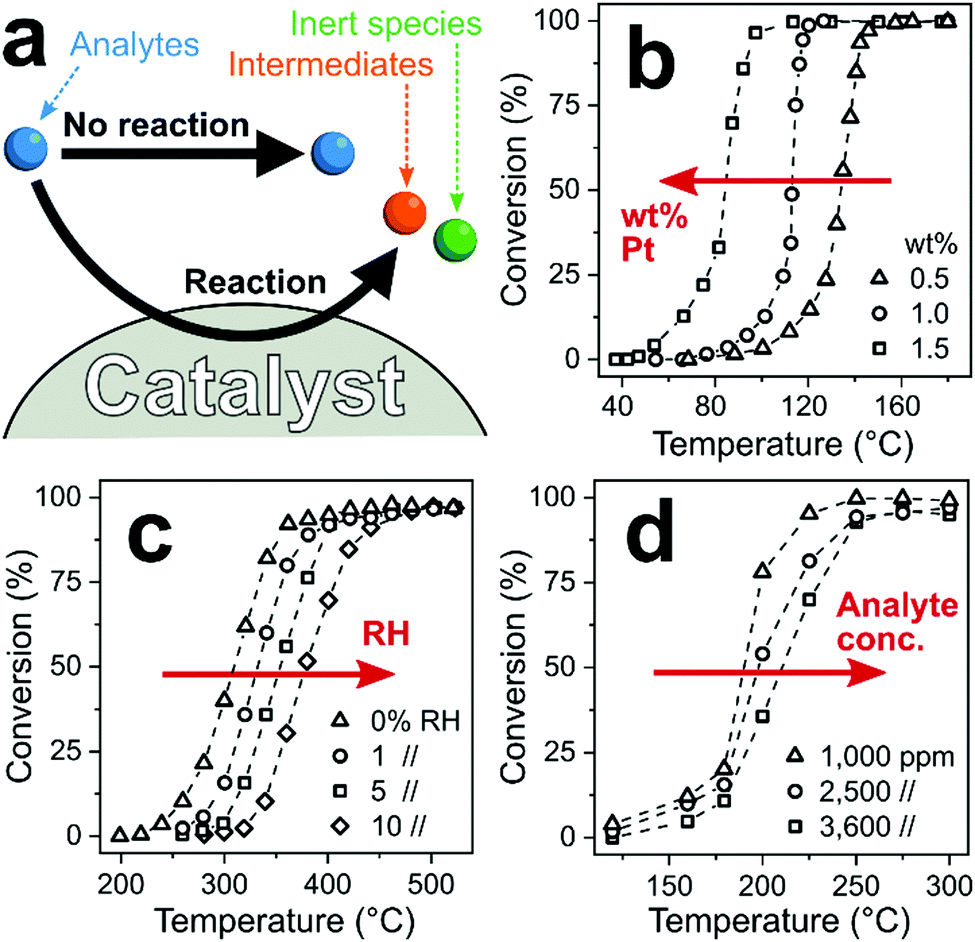 | ||
| Fig. 9 (a) Chemical reaction pathways between analytes and catalytic filter. Analytes thereby pass the catalyst unscathed without reaction (desired for the target analyte) or are converted to intermediate or inert species (desired for interferants). (b) Increased noble metal loading lowers filter temperature for complete conversion.252 (c) Increased RH253 and (d) analyte concentration254 increases that temperature. | ||
A variety of crystalline255 or amorphous256 catalytic materials is available from heterogeneous catalysis, including metal oxides,257 mixed-metal catalysts,258 zeolites,189 mesoporous silica189 and MOFs.259 They typically feature high specific surface areas (e.g., >100 m2 g−1)260 with surface composition, structure and operational temperature determining the overall reactivity, and subsequently, selectivity. These properties make catalytic filters attractive for material engineering at the nanoscale (e.g., surface area,261 acidity262 or surface hydrophobicity263). In particular, noble metals (e.g., Pt,264 Pd,264 Rh,264 Au258 and Ag261) are frequently added to enhance reactivity by tuning their size down to single atoms.265 For example, increasing the loading of Pt on Al2O3 from 0.5 (triangles, Fig. 9b) to 1.5 wt% (squares) reduces the temperature of full propene combustion from 160 to 100 °C.252
In contrast to heterogeneous catalysis, catalytic filters for sensors are typically operated in mixtures with many compounds (e.g., several hundred in human breath266), low analyte concentrations and high or varying humidity. These parameters markedly influence the reactivity and selectivity of catalytic filters. For example, catalyst activity is strongly influenced by humidity as water molecules can competitively interact and block catalyst active sites,267 reducing their reactivity. As an example, the onset of CH4 conversion on Pd/SnO2 shifts from 240 °C in dry air to 320 °C at just 10% RH (Fig. 9c).253 For sensor applications, humidity often varies greatly (e.g., 30–95% RH268 in indoor air) or is present at high levels (e.g., exhaled breath >97% RH96), which needs to be considered in the design of catalytic filters. Furthermore, analyte concentration influences conversion at high concentrations when the reaction kinetics (i.e., diffusion to, adsorption on, conversion at and desorption from the catalyst) become rate-limited.269 For instance, on Pt/Al2O3–CeO2, complete conversion of 1000 ppm toluene is attained at 250 °C, while for 3600 ppm it is 300 °C (Fig. 9d).254 For gas sensors, the catalytic filter needs to convert interferants at high concentrations and leave intact the target analyte often present at orders of magnitude lower concentration (e.g., <10 ppb formaldehyde in indoor air92 with >10 ppm H2, ethanol or acetone245). So, heterogeneous catalysis can inspire the design of catalytic filters, but their performance needs to be tailored systematically to sensor conditions.
Tailored selectivity
Sensors with catalytic filters are tabulated in Table 4, showing their composition, target analytes and various figures of merit. First catalytic filters for gas sensors were developed to remove VOCs (e.g., CO and ethanol) for reliable alkane detection.250 Monitoring alkanes (e.g., CH4, propane and butane) in domestic270 and industrial areas (e.g., from gas leaks271 and coal mines272) is important due to their high flammability273 and regulated exposure limit (e.g., CH4, 1000 ppm274). This is challenging, as chemoresistive sensors respond weakly to alkanes (high energy needed to activate C–H bonds254) and suffer from high cross-sensitivity275 to pollutants, particularly CO (e.g., >7000 ppm in coal mines276 and >100 ppm in industrial areas277) and ethanol (e.g., >100 ppm from hand disinfection251).| Filter configuration | Filter material | Target analyte | Sensor | LODa (ppm) | Response time | Tested interferants (selectivity) | Ref. |
|---|---|---|---|---|---|---|---|
| a Lowest measured concentration. | |||||||
| Overlayer | Al2O3 | CH4 | Pellistor | 25000 |
— | Hexamethyldisiloxane (<1) | 59 |
| Co3O4 | Benzene | Pd/SnO2 | 0.25 | 3 s | Ethanol (5.1), xylene (4.8), toluene (2.6), CO (2.4), formaldehyde (2.4) | 300 | |
| CuO | CO | SnO2 | 900 | — | Ethanol (<1) | 308 | |
| Cr2O3 | Ethylene | SnO2 | 0.1 | 9 s | NH3 (24), dimethylamine (17), formaldehyde (6.3), ethanol (5.7), CO (4.3), trimethylamine (3.4) | 312 | |
| Ga2O3 | CH4 | Ga2O3 | 500 | — | Ethanol (2), acetone (<1) | 286 | |
| Zeolite MFI | CO | Pd/WO3 | 100 | — | Acetone, ethanol, methanol (all <1) | 305 | |
| SnO2, TiO2 | Toluene, xylene | Co3O4 | 5 | <6 min | Formaldehyde (>20), CO (>10), benzene (>8), ethanol (>7.6) | 303 | |
| Pt | CO | SnO2 | 10 | — | NO2 (<1), ozone (<1) | 310 | |
| Propane | In0.1Sb0.005Pd0.1/SnO2 | 500 | — | CO (40), ethanol (<1) | 73 | ||
| Pd | Propane | In0.1Sb0.005Pd0.1/SnO2 | 500 | — | CO (>1000), ethanol (1) | 73 | |
| Pd, Ag | CO, H2 | SnO2 | 1000 | — | Ozone (<1) | 307 | |
| Pt/Al2O3 | CH4, ethane | SnO2 | 100 | <3 min | CO (>1000), ethanol (>20), benzene (>10), acetone (>5) | 250 | |
| Benzene | WO3 | 1 | — | Ethanol (5.8), NH3 (<1), NO2 (<1) | 301 | ||
| Pt & Pd/SiO2 | CH4 | SnO2 | 200 | — | CO (>1000) | 278 | |
| Pt/zeolite MFI | Propane | SrTi0.8Fe0.2O3−δ | 500 | — | CO (>100), NO (>100), H2 (>20), propene (>50) | 285 | |
| Methanol | Pd/WO3 | 2 | — | CO (>1000), ethanol (13), acetone (8) | 305 | ||
| Pd/Al2O3, SiOx, WO3 | CH4, butane, propane | SnOx, InOx | 10000 |
— | CO, ethanol | 51 | |
| Pd/Al2O3 | CH4 | Pd/SnO2 | 50 | — | CO (>1000), ethanol (1) | 283 | |
| SnO2 | 100 | <100 ms | CO (10), H2 (5) | 284 | |||
| Pd/SnO2 | CO, CH4 | SnO2 | 300 | — | Ethanol (1) | 287 | |
| RuO2/SiO2 | Propane | SnO2 | 150 | — | NO2 (5), CO (2.75) | 282 | |
| Mo/zeolite Y | Heptane, octane | Cr1.95Ti0.05O3 | — | — | Nonane (1), decane (2), undecane (3) | 309 | |
| Packed bed | ZnO | Acetone, benzene, H2, CH4, toluene | Si/WO3 | 0.25 | — | Ethanol (81), formaldehyde | 294 |
| Au/Ce0.8Zr0.2O2 | CH4 | Pt/SnO2 | 5000 | 35 s | Acetone, CO, ethanol, formaldehyde, toluene (all >100) | 288 | |
| Au/Fe2O3 | CH4, propane | Pt/SnO2 | 2000 | 10 s | CO, ethanol (both >1000) | 291 | |
| Au/TiO2 | Propane | SnO2 | 100 | — | CO (2.1) | 292 | |
| Au/ZnO | Propane | SnO2 | 100 | — | CO (7.4) | 292 | |
| Pt/Al2O3 | Acetone | Si/WO3 | 0.05 | 55 s | CO (>1000), isoprene (>1000), NH3 (>1000), ethanol (>500), H2 (>250) | 70 | |
| Pt/LaFeO3 | Propane | Pt/SnO2 | 1000 | 30 s | CO (>1), NO (>100) | 306 | |
Typical catalysts consist of noble metals (e.g., Pt, Pd and Au) on ceramic supports (e.g., Al2O3, SiO2 and Fe2O3) that are deposited directly onto sensing films as porous layers. Their working principle is illustrated in Fig. 10a on the example278 of a SnO2 sensor (operated at 350 °C) covered by a layer (100–150 μm) of mesoporous Pt/or Pd/SiO2. Without filter (Fig. 10b), the sensor shows similar resistance changes (i.e., responses) to 20–400 ppm CO (dashed line) and 200–4000 ppm CH4 (solid line), typical for such SnO2-based sensors. With filter, CO is fully converted in the filter layer to non-responsive species (i.e., CO2 and H2O), while chemically stable CH4 passes unscathed. As a result (Fig. 10c), no resistance changes to CO are detected anymore, while they are unchanged for CH4, resulting in selective CH4 detection.278 Such CH4 sensor systems outperform sensors without filter (e.g., methane to CO selectivity of 8 for Pd–Ag activated ZnO279 and ZnO/ZnO2 heterostructures280) and enabled industrial development of selective gas leak sensors to prevent false alarms.281
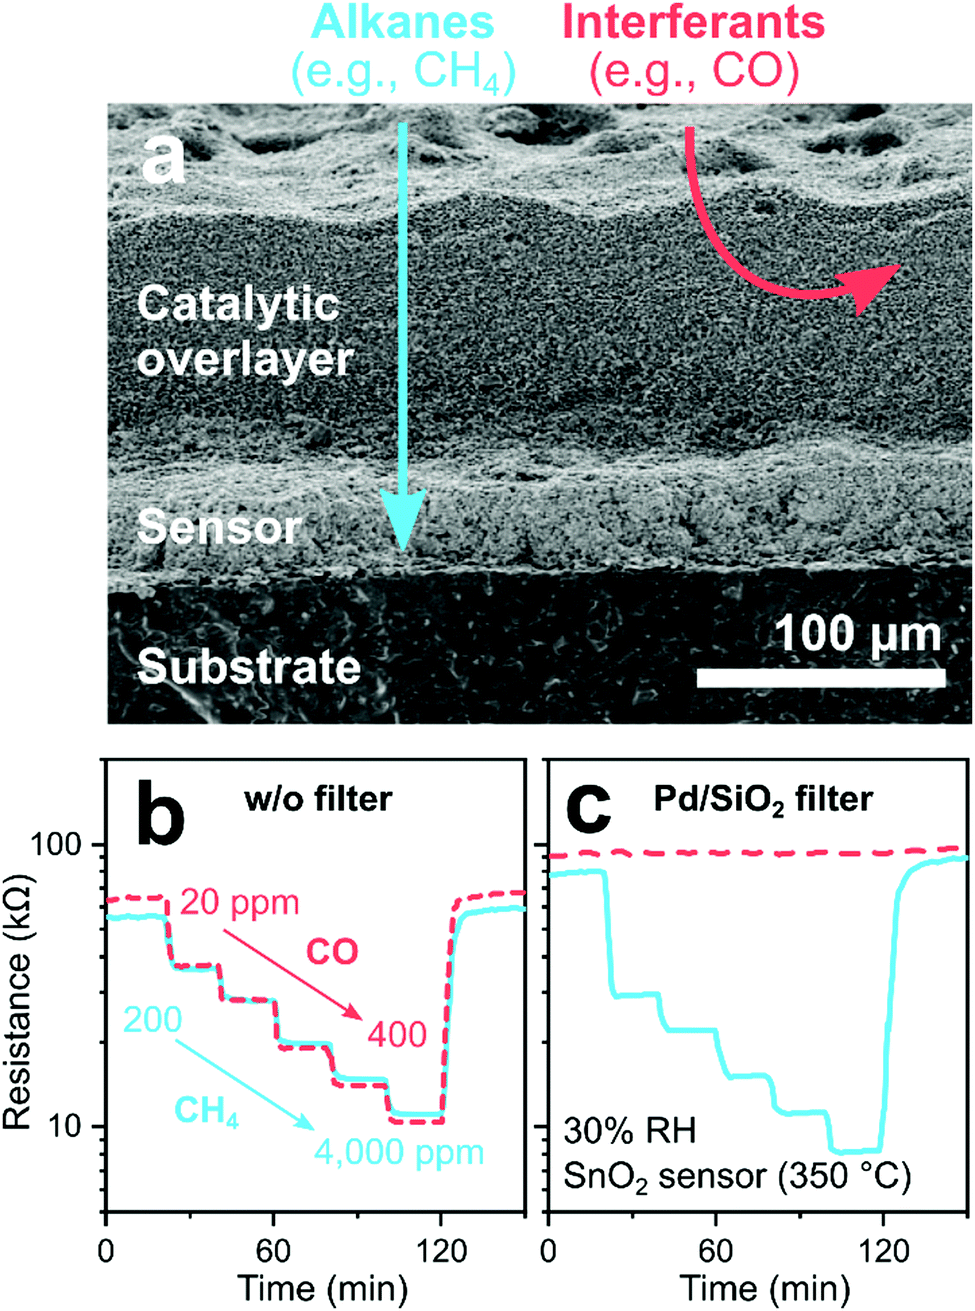 | ||
| Fig. 10 (a) SEM cross-section of a SnO2 sensor with a mesoporous catalytic overlayer (filter). Alkanes (e.g., CH4) pass through the filter unscathed and are detected by the sensor, while interferants (e.g., CO) are converted to non-responsive species (e.g., CO2). Reproduced with permission.278 Copyright 2003 Elsevier. SnO2 sensor response to CO (20–400 ppm, dashed line) and CH4 (200–4000 ppm, solid line) without (b) and with (c) a Pd/SiO2 mesoporous catalyst filter at 30% RH.278 | ||
A variety of catalysts appear suitable for this application, as similar results were obtained with several Al2O3- and SiOx-based catalysts (e.g., thermally evaporated pure Al2O3 and SiOx,51 drop-coated Pt,73 Pd73 and RuO2282 on SiO2,73 flame deposited Pd/Al2O3283 and screen printed Pt/Al2O3,250 Pd/Al2O3284 and Pt/ZSM-5 zeolites285), Ga2O3,286 WO3,51 Pd/SnO2287 and Au/Ce–Zr.288 The preferential conversion of VOCs over alkanes is expected due to the alkane's higher chemical stability.289 Disadvantages of such filters are their limited applicability to alkane detection, as well as typically high operation temperatures (i.e., >350 °C).278 However, the performance of filters can be improved further and their selectivity tuned more flexibly by exploiting specific analyte–catalyst interactions. For instance, gold catalysts are highly reactive to CO already at room temperature.290 In fact, catalytic filters such as Au/Fe2O3,291 Au/ZnO292 and Au/TiO2292 removed CO selectively over alkanes (e.g., propane) even at room temperature, with the highest removal efficiency in the order of Au/Fe2O3 > Au/ZnO > Au/TiO2.
More challenging are filters that distinguish between VOCs with similar stability (e.g., ketones, aldehydes, aromatics), requiring more precise material engineering. For instance, high ethanol background in ambient air or breath (>100 ppm from disinfectants251 and alcohol consumption,293 respectively) is a common issue preventing accurate measurements of target analytes. This was addressed by a catalytic filter that exploits surface acidity and basicity (Fig. 11) for selective measurement of acetone,294 a metabolic breath marker for fat oxidation.295 The acetone carbonyl group coordinates primarily with Lewis acid sites abundantly present on acidic oxides (e.g., WO3296). In contrast, ethanol conversion is favored on basic oxides featuring surface-adsorbed oxygen- and hydroxyl-related species.297 Hence, the highest ethanol over acetone selectivity was found for ZnO featuring highest basicity (Fig. 11a–d),294 in line with literature.296 Sampling breath of an alcohol intoxicated volunteer through such a small (150 mg) packed bed filter of ZnO heated to 260 °C completely eliminates ethanol interference (Fig. 11e). Most importantly, the filter leaves acetone intact as verified by responses of a Si/WO3 sensor without and with filter (Fig. 11f) and confirmed by benchtop mass spectrometry. Ethanol responses are strongly reduced (i.e., by 88% at 20 ppm ethanol, remaining response from the combustion to H2298), resulting in selective acetone detection down to 25 ppb in breath-relevant 90% RH with a selectivity to ethanol of 81. This ZnO filter fully combusts also other interferants (e.g., formaldehyde), while leaving aromatics (e.g., toluene, benzene), CH4 and H2 intact. The selectivity can be further increased by removing the ethanol conversion products (i.e. H2) by other (catalytic) filters or by operating the filter at higher temperature, although this can reduce the sensitivity by partially converting the target analyte (i.e., acetone).
 | ||
| Fig. 11 (a–d) Conversion of 1 ppm ethanol (triangles) and acetone (circles) on metal oxides with increasing basicity, WO3 < SnO2 < Fe2O3 < ZnO, that increases the acetone selectivity over ethanol. (e) Ethanol concentration measured during three consecutive breath exhalations without filter (t ≤ 3 min) and with 150 mg ZnO filter at 260 °C (t > 3 min) that totally eliminated ethanol. (f) Si/WO3 sensor response to 1 ppm acetone and 5, 10 and 20 ppm ethanol without (open bars) and with a ZnO catalyst at 260 °C (filled bars) upstream of the sensor.294 | ||
Catalytic filters can even increase selectivity to analytes from the same chemical group. For instance, the selective detection of carcinogenic92 benzene over toluene and xylene in indoor air is challenging for chemical gas sensors due to the chemical similarity of these analytes (aromatic hydrocarbons with 0–2 methyl groups).299 A promising approach is the use of catalytic Co3O4 overlayers electron-beam evaporated onto Pd/SnO2 sensing films.300 Toluene and p-xylene were partially converted in the filter layer to non-reactive species, reducing their responses by as much as 97%, depending on Co3O4 thickness (0–60 nm). In contrast, the response to benzene increased by 30% at optimal filter thickness (20 nm), attributed to its activation in the catalytic layer through formation of more responsive intermediates, as has been observed for benzene detection already with Pt/Al2O3 filters.301 As a result, benzene selectivity to p-xylene, toluene, ethanol, formaldehyde and CO was doubled from ∼1 to >2 that could be further improved with sensors featuring intrinsic benzene selectivity (e.g., Au/multi-walled carbon nanotubes302 with benzene selectivity towards o-xylene and toluene >30). Most interesting, by switching the filter–sensor arrangement, i.e., Co3O4 was used as sensor with a catalytic filter layer of SnO2, also the selectivity could be reversed.303 Toluene and p-xylene responses increased up to a factor of 5 (possibly through formation of more responsive benzyl alcohol304), while responses of interferants decreased significantly. As a result, toluene and p-xylene selectivity >20 could be achieved towards benzene, ethanol, formaldehyde and CO.
Similarly, increased selectivity through higher sensitivity to target analytes was observed also for other catalytic filters. For instance, a Pd/WO3 sensor covered by undoped zeolite layers (HZSM-5) increased the CO response by a factor of 7 resulting in selectivity of more than 4 over methanol, ethanol and acetone. Covering the same sensor with Pt/HZSM-5 increased methanol responses by a factor of 15 resulting in selectivity >9 over the same analytes.305 Packed bed filters of Pt/LaFeO3 heated to 200 °C upstream of Pt/SnO2 sensors turned them selective to CO with negligible interference from propane.306 However, when operating the filter at 350 °C, sensor responses to propane increased by a factor of 25 while CO was completely removed. Also, nanolayers (5–20 nm) of Pd or Ag deposited by successive ionic layer deposition on SnO2 sensors removed ozone interference and increased responses to reducing gases (e.g., CO and H2).307 While such catalytic filters offer a powerful tool to enhance sensitivity and tailor selectivity, none of these studies investigated the composition of the effluent, to identify the reformed species and characterize their interaction with the sensor, motivating further research.
Filter configuration
Catalytic filters are typically deposited directly283 as overlayers (e.g., as porous layers,283 membranes,308 zeolites309 or metallic nanoclusters310) onto sensor materials. This results in compact filter–sensor systems where sensing film and catalyst temperature are coupled, requiring no additional heating source. However, this also implies that filter and sensor cannot be fabricated and operated individually to achieve maximum selectivity. Additionally, overlayers may act as diffusion barrier, increasing response times (e.g., from 1 to 4 min for 20–70 μm thick zeolite layers on SrTi1−xFexO3−δ sensors).311 While depositing thin312 or highly porous278 catalytic overlayers can address this, filter efficiency could be compromised. Finally, solid-state diffusion of the catalytic layer into the sensing film may alter sensor performance (e.g., catalytic Pd diffusion into SnO2 sensor).287 This can be solved by an additional inert separation layer (e.g., Al2O3308 or SiO273).Such a SnO2 gas sensor (operated at 375 °C) with a Cr2O3 catalytic overlayer deposited by electron-beam evaporation had been tested as ethylene sensor (Fig. 12a–c).312 Ethylene monitoring is used for controlling growth, development and ripening of fruits.313Fig. 12a shows a cross-section SEM image of the Al2O3 substrate, the SnO2 sensing layer (∼21 μm) and a thin Cr2O3 overlayer (300 nm). Without the Cr2O3 overlayer, the SnO2 sensor features high sensitivity to ethylene, but responds also to trimethylamine (TMA), dimethylamine (DMA), ammonia (NH3), ethanol, formaldehyde (HCHO) and CO (Fig. 12b). With this catalytic overlayer, the responses to all interfering analytes are reduced, while the ethylene response remains similar. As a result, ethylene selectivity to the tested analytes increases from 1–3.8 to 3.4–24 with an estimated ethylene limit of detection of only 24 ppb. Increasing the Cr2O3 layer thickness (from 300 to 600 nm) further reduces responses to interferants but also to ethylene, resulting in overall poorer selectivities. The filter–sensor system was further integrated into a hand-held device with wireless communication, which monitored fruit ripening (exemplarily shown for a banana in Fig. 12c) under controlled conditions (i.e., in a closed chamber). While promising, further validation with a high-resolution instrument (e.g., GC-MS) and testing in indoor air is required.
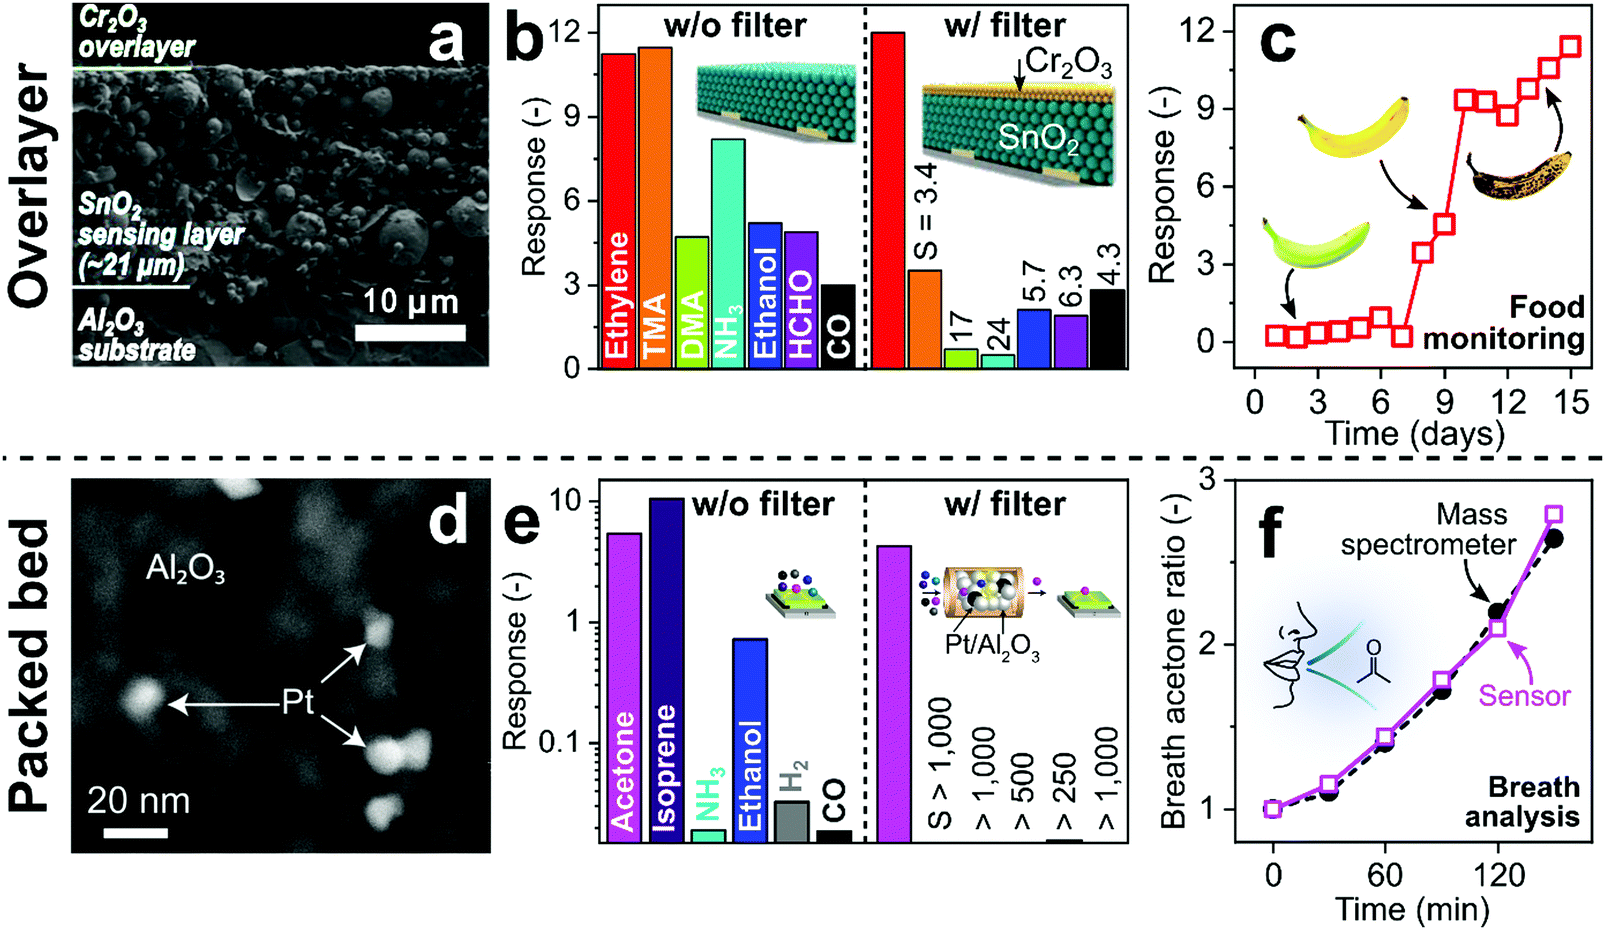 | ||
| Fig. 12 (a) SnO2 sensor (375 °C) with catalytic Cr2O3 overlayer. Reproduced with permission.312 Open Access CC BY. (b) SnO2 sensor response to 2.5 ppm ethylene, trimethylamine (TMA), dimethylamine (DMA), ammonia (NH3), ethanol, formaldehyde (HCHO) and CO without and with the Cr2O3 overlayer with the resulting ethylene selectivties.312 (c) Sensor response with filter layer when exposed to an underripe (t < 7 days), a ripe (t > 7 days) and an overripe banana (t > 10 days).312 (d) Catalytic Pt/Al2O3 filter. Reproduced with permission.70 Open Access CC BY. (e) Si/WO3 sensor (400 °C) response to 1 ppm acetone, isoprene, NH3, ethanol, H2 and CO without and with the packed bed Pt/Al2O3 filter (135 °C, please note the logarithmic y-axis) resulting in superior acetone selectivity.70 (f) Breath acetone concentration ratio (normalized to initial concentration) as measured by the Pt/Al2O3–Si/WO3 detector (open squares) and benchtop mass spectrometer (filled circles) during post-exercise rest.70 Illustrations in (b)312 and (f)70 were reproduced with permission. Open Access CC BY. | ||
Catalytic filters can be implemented also as packed beds upstream of the sensor affording individual optimization and operation, as well as flexible combination with different sensors (e.g., chemoresistive, electrochemical or optical). A drawback is the sometimes necessary additional heating source294 and pressure drop when air is drawn through the filter to the sensor by a pump.314 The former can be addressed by tailoring materials at the nanoscale (e.g., introducing highly reactive noble metals290). Such a compact (30 mg) catalytic packed bed filter of Pt/Al2O3 nanoparticles had been used for a selective breath acetone sensor (Fig. 12d–f).70 Acetone is a breath marker for fat metabolism295 with applications in personalized exercise315 and diet monitoring,316 as well as search and rescue.317 While Pt/Al2O3 is used already to remove VOCs over alkanes, tailoring the Pt-loading is necessary to allow for selective combustion of breath-relevant interferants over acetone. For example, 0.2 mol% Pt/Al2O3 removed selectively isoprene, alcohols, aldehydes, aromatics, CO, H2 and NH3 over acetone with high robustness to humidity (30–90% RH) at 135 °C. Fig. 12d shows the crystalline Al2O3 particles decorated with 0.2 mol% Pt clusters (average size 9 nm).70 When coupled to a Si/WO3 sensor, this results in unprecedented acetone selectivity (>250, Fig. 12e), which cannot be achieved by sensors alone (e.g., selectivity to ethanol <10 by Si/WO3 and isoprene <4 by Al/ZnO318) or orthogonal sensor arrays.48
Most importantly, the sensor exhibits sufficiently low limit of detection (i.e., 5.5 ppb that is superior even to 30 ppb by more bulky GC-IMS319), and the response time is not affected by the filter (i.e., 1.3 min at 100 ppb). For validation, breath samples after exercise were analyzed by the filter–sensor system and simultaneously with benchtop mass spectrometry (Fig. 12f). The sensor correctly detects the increase of breath acetone indicating fat burning, in excellent agreement with the benchtop method and is applicable also in extreme scenarios (i.e., in presence of alcohol disinfectants as well as >50 ppm H2 and CH4 in exhaled breath320). Such filter–sensor systems can be implemented readily in commercial and portable breath analyzers.321
5. Conclusions and outlook
Today, many commercial sensors already use filters in specific applications (e.g., catalytic and sorption filters in CO66 and CH467 alarm sensors or GC columns for detection of H2 and CH4 in breath152). Furthermore, a plethora of next generation sensor technologies and advanced sensing materials are available with impressive performance in the laboratory. To fully assess their potential, they need to be validated under realistic conditions (e.g., detection of pollutants in indoor air322 or markers in exhaled breath11). In fact, today most commercial chemical sensors fail in such emerging applications as they lack the required selectivity.Filters help single sensors and sensor arrays to overcome selectivity limitations as had been shown already for selective detection of CO66 and a variety of VOCs (e.g., methanol,68 isoprene,71 formaldehyde,176 trichloroethylene,167etc.) by sorption filters, H269 and formaldehyde242 by size-selective filters, and alkanes (e.g., CH467 and propane292) and acetone70 by catalytic filters. Selectivity tuning with filters can be achieved by exploiting a variety of molecular properties of analytes, including molecular size, surface affinity, diffusion properties and chemical reactivity. These are typically not accessible by the sensor alone, which is focused on reactivity (i.e., chemoresistive sensors), electromagnetic absorption (i.e., optical sensors), or molecular mass (i.e., quartz microbalances). By tuning filter selectivity by material design and combination of filters with suitable sensors, an array of new and promising applications is unlocked.
For instance, a handheld methanol detector enabled by a sorption filter can detect methanol-adulteration in drinks,175 responsible for thousands of victims every year. Such detectors can also be used to monitor naturally323 occurring methanol during liquor distillation (e.g., fruit spirit or whisky), detect methanol in the breath of methanol poisoning victims to initiate immediate and appropriate treatment with better chance of recovery,324 and detect the presence of methanol in sanitizers, responsible for >700 deaths in Iran325 and USA326 during the recent COVID-19 pandemic. Even screening for COVID-19 by a quick breath test might be possible after recent research327 suggested methanol as one of the tentative breath markers of the disease. Or, a sensor enabled by a catalytic filter can selectively detect acetone in the breath.70 Integrated into a simple-in-use, portable detector, it enables for the first time longitudinal clinical studies with volunteers monitoring their breath acetone independently at home for metabolic profiling. Soon, tracking the effectiveness of different diets (e.g., ketogenic or intermittent fasting) and exercise protocols on fat burn rate or even the non-invasive detection of metabolic diseases might become reality, more important than ever given today's obesity epidemic.328
These examples demonstrate how filters drastically increase the selectivity of sensors to meet demanding requirements in emerging applications. This results in useful devices with immediate societal impact. Other examples include sensors for food quality control (e.g., monitoring ethylene during fruit ripening312) and air quality monitoring (e.g., fast measurement of formaldehyde in indoor air176). Given the immense potential of filters, they will almost certainly play a pivotal role in the future development of advanced sensor systems with unprecedented selectivity as they have done already for CO and CH4.
Conflicts of interest
The authors report no declarations of interest.Acknowledgements
This project was supported by the ETH Zurich (Particle Technology Laboratory and Research Grant ETH-05 19-2) and in part the Swiss National Science Foundation (grant 175754 and 170729). Authors are grateful to D. Bischof and F. M. Schenk for helping to design the figures.References
- M. Mayer and A. J. Baeumner, Chem. Rev., 2019, 119, 7996–8027 CrossRef CAS.
- A. Schütze and T. Sauerwald, in Advanced Nanomaterials for Inexpensive Gas Microsensors, ed. E. Llobet, Elsevier, 2020, pp. 209–234 Search PubMed.
- A. C. Rai, P. Kumar, F. Pilla, A. N. Skouloudis, S. Di Sabatino, C. Ratti, A. Yasar and D. Rickerby, Sci. Total Environ., 2017, 607–608, 691–705 CrossRef CAS.
- T. Salthammer, S. Mentese and R. Marutzky, Chem. Rev., 2010, 110, 2536–2572 CrossRef CAS.
- R. Beelen, G. Hoek, D. Vienneau, M. Eeftens, K. Dimakopoulou, X. Pedeli, M.-Y. Tsai, N. Künzli, T. Schikowski and A. Marcon, Atmos. Environ., 2013, 72, 10–23 CrossRef CAS.
- M. Rigby, S. Park, T. Saito, L. Western, A. Redington, X. Fang, S. Henne, A. Manning, R. Prinn and G. Dutton, Nature, 2019, 569, 546–550 CrossRef CAS.
- H. Yousefi, H.-M. Su, S. M. Imani, K. Alkhaldi, C. D. M. Filipe and T. F. Didar, ACS Sens., 2019, 4, 808–821 CrossRef CAS.
- O. L. Gamborg and T. A. LaRue, Nature, 1968, 220, 604–605 CrossRef CAS.
- C. Lindinger, D. Labbe, P. Pollien, A. Rytz, M. A. Juillerat, C. Yeretzian and I. Blank, Anal. Chem., 2008, 80, 1574–1581 CrossRef CAS.
- A. R. Shalaby, Food Res. Int., 1996, 29, 675–690 CrossRef CAS.
- A. T. Güntner, S. Abegg, K. Königstein, P. A. Gerber, A. Schmidt-Trucksäss and S. E. Pratsinis, ACS Sens., 2019, 4, 268–280 CrossRef.
- S. M. Gordon, J. P. Szidon, B. K. Krotoszynski, R. D. Gibbons and H. J. O'Neill, Clin. Chem., 1985, 31, 1278–1282 CrossRef CAS.
- M. J. Henderson, B. Karger and G. Wrenshall, Diabetes, 1952, 1, 188–200 CrossRef CAS.
- C. N. Tassopoulos, D. Barnett and T. Russell Fraser, Lancet, 1969, 293, 1282–1286 CrossRef.
- S. T. Senthilmohan, D. B. Milligan, M. J. McEwan, C. G. Freeman and P. F. Wilson, Redox Rep., 2000, 5, 151–153 CrossRef CAS.
- S. Giannoukos, A. Agapiou and S. Taylor, J. Breath Res., 2018, 12, 027106 CrossRef CAS.
- A. M. Curran, S. I. Rabin, P. A. Prada and K. G. Furton, J. Chem. Ecol., 2005, 31, 1607–1619 CrossRef CAS.
- K. E. Jones, K. Dashfield, A. B. Downend and C. M. Otto, J. Am. Vet. Med. Assoc., 2004, 225, 854–860 CrossRef.
- B. de Lacy Costello, A. Amann, H. Al-Kateb, C. Flynn, W. Filipiak, T. Khalid, D. Osborne and N. M. Ratcliffe, J. Breath Res., 2014, 8, 014001 CrossRef CAS.
- O. O. Hänninen, S. Alm, K. Katsouyanni, N. Künzli, M. Maroni, M. J. Nieuwenhuijsen, K. Saarela, R. J. Srám, D. Zmirou and M. J. Jantunen, J. Exposure Sci. Environ. Epidemiol., 2004, 14, 440–456 CrossRef.
- T. Seiyama, A. Kato, K. Fujiishi and M. Nagatani, Anal. Chem., 1962, 34, 1502–1503 CrossRef CAS.
- C. Nylander, B. Liedberg and T. Lind, Sens. Actuators, 1982, 3, 79–88 CrossRef CAS.
- N. J. Pineau, S. D. Keller, A. T. Güntner and S. E. Pratsinis, Microchim. Acta, 2020, 187, 96 CrossRef CAS.
- M. E. Prévôt, A. Nemati, T. R. Cull, E. Hegmann and T. Hegmann, Adv. Mater. Technol., 2020, 5, 2000058 CrossRef.
- L. Wang, A. Teleki, S. E. Pratsinis and P. I. Gouma, Chem. Mater., 2008, 20, 4794–4796 CrossRef CAS.
- V. Jayaraman, G. Mangamma, T. Gnanasekaran and G. Periaswami, Solid State Ionics, 1996, 86, 1111–1114 CrossRef.
- T. Ishihara, K. Shiokawa, K. Eguchi and H. Arai, Chem. Lett., 1988, 997–1000 CrossRef CAS.
- H.-J. Cho, Y. H. Kim, S. Park and I.-D. Kim, ChemNanoMat, 2020, 6, 1014–1027 CrossRef CAS.
- Z. Dai, T. Liang and J.-H. Lee, Nanoscale Adv., 2019, 1, 1626–1639 RSC.
- J. A. Kemmler, S. Pokhrel, J. Birkenstock, M. Schowalter, A. Rosenauer, N. Barsan, U. Weimar and L. Mädler, Sens. Actuators, B, 2012, 161, 740–747 CrossRef CAS.
- A. T. Güntner, N. J. Pineau, D. Chie, F. Krumeich and S. E. Pratsinis, J. Mater. Chem. B, 2016, 4, 5358–5366 RSC.
- A. T. Güntner, M. Righettoni and S. E. Pratsinis, Sens. Actuators, B, 2016, 223, 266–273 CrossRef.
- R. Qian, Z. Yumin, L. Tianping, S. Kaiyuan, Z. Baoye, Z. Zhongqi, Z. Jin and L. Qingju, Nanotechnology, 2018, 29, 145503 CrossRef.
- M. Bendahan, C. Jacolin, P. Lauque, J.-L. Seguin and P. Knauth, J. Phys. Chem. B, 2001, 105, 8327–8333 CrossRef CAS.
- M. Akiyama, J. Tamaki, N. Miura and N. Yamazoe, Chem. Lett., 1991, 1611–1614 CrossRef CAS.
- M. Hauptmann, P. A. Stewart, J. H. Lubin, L. E. Beane Freeman, R. W. Hornung, R. F. Herrick, R. N. Hoover, J. F. Fraumeni Jr, A. Blair and R. B. Hayes, J. Natl. Cancer Inst., 2009, 101, 1696–1708 CrossRef CAS.
- C. J. Weschler, Indoor Air, 2000, 10, 269–288 CrossRef CAS.
- K. Persaud and G. Dodd, Nature, 1982, 299, 352–355 CrossRef CAS.
- W. Hu, L. Wan, Y. Jian, C. Ren, K. Jin, X. Su, X. Bai, H. Haick, M. Yao and W. Wu, Adv. Mater. Technol., 2019, 4, 1800488 Search PubMed.
- A. Hierlemann and R. Gutierrez-Osuna, Chem. Rev., 2008, 108, 563–613 CrossRef CAS.
- S. Matindoust, M. Baghaei-Nejad, M. H. S. Abadi, Z. Zou and L.-R. Zheng, Sens. Rev., 2016, 36, 169–183 CrossRef.
- R. E. Amor, M. K. Nakhleh, O. Barash and H. Haick, Eur. Respir. Rev., 2019, 28, 190002 CrossRef.
- S. Haykin and K. R. Liu, Handbook on array processing and sensor networks, John Wiley & Sons, 2010 Search PubMed.
- Z. Chen, Z. Chen, Z. Song, W. Ye and Z. Fan, J. Semicond., 2019, 40, 111601 CrossRef CAS.
- G. Peng, U. Tisch, O. Adams, M. Hakim, N. Shehada, Y. Y. Broza, S. Billan, R. Abdah-Bortnyak, A. Kuten and H. Haick, Nat. Nanotechnol., 2009, 4, 669–673 CrossRef CAS.
- M. B. Banerjee, R. B. Roy, B. Tudu, R. Bandyopadhyay and N. Bhattacharyya, J. Food Eng., 2019, 244, 55–63 CrossRef CAS.
- F. Röck, N. Barsan and U. Weimar, Chem. Rev., 2008, 108, 705–725 CrossRef.
- N. J. Pineau, J. F. Kompalla, A. T. Güntner and S. E. Pratsinis, Microchim. Acta, 2018, 185, 563 CrossRef.
- S. R. Morrison, Sens. Actuators, 1987, 12, 425–440 CrossRef CAS.
- G. Korotcenkov, Handbook of Gas Sensor Materials: Properties, Advantages and Shortcomings for Applications Volume 1: Conventional Approaches, Springer New York, New York, NY, 2013, pp. 293–303 Search PubMed.
- C. A. Papadopoulos, D. S. Vlachos, J. N. Avaritsiotis, D. S. Vlaehos, J. N. Avaritsiotis, D. S. Vlachos and J. N. Avaritsiotis, Sens. Actuators, B, 1996, 32, 61–69 CrossRef CAS.
- F. Röck, N. Barsan and U. Weimar, Chem. Rev., 2008, 108, 705–725 CrossRef.
- K. Sahner, G. Hagen, D. Schonauer, S. Reiss and R. Moos, Solid State Ionics, 2008, 179, 2416–2423 CrossRef CAS.
- W.-T. Koo, J.-S. Jang and I.-D. Kim, Chem, 2019, 5, 1938–1963 CAS.
- T. Wagner, S. Haffer, C. Weinberger, D. Klaus and M. Tiemann, Chem. Soc. Rev., 2013, 42, 4036–4053 RSC.
- C. Allman and G. Khilnani, Adv. Instrum., 1983, 38, 399–406 CAS.
- A. Ryzhikov, M. Labeau and A. Gaskov, Selectivity Improvement of Semiconductor Gas Sensors by Filters, presented in part at the Sensors for Environment, Health and Security, Dordrecht, 2009.
- D. J. Wales, J. Grand, V. P. Ting, R. D. Burke, K. J. Edler, C. R. Bowen, S. Mintova and A. D. Burrows, Chem. Soc. Rev., 2015, 44, 4290–4321 RSC.
- J. B. Miller, IEEE Sens. J., 2001, 1, 88–93 CAS.
- C. Pijolat, B. Riviere, M. Kamionka, J. P. Viricelle and P. Breuil, J. Mater. Sci., 2003, 38, 4333–4346 CrossRef CAS.
- J.-W. Yoon and J.-H. Lee, Lab Chip, 2017, 17, 3537–3557 RSC.
- G. N. Advani and A. G. Jordan, J. Electron. Mater., 1980, 9, 29–49 CrossRef.
- K. Fukui and K. Komatsu, Proceedings of the International Meeting on Chemical Sensors, Analytical Chemistry Symposia Series, Fukuoka, Japan, 1983, vol. 17, pp. 52–36.
- S. J. Gentry and S. R. Howarth, Sens. Actuators, 1984, 5, 265–273 CrossRef CAS.
- K. Nagashima and S. Suzuki, Anal. Chim. Acta, 1984, 162, 153–159 CrossRef CAS.
- M. Schweizer-Berberich, S. Strathmann, W. Göpel, R. Sharma and A. Peyre-Lavigne, Sens. Actuators, B, 2000, 66, 34–36 CrossRef CAS.
- H. Debéda, P. Massok, C. Lucat, F. Ménil and J.-L. Aucouturier, Meas. Sci. Technol., 1997, 8, 99–110 CrossRef.
- J. van den Broek, S. Abegg, S. E. Pratsinis and A. T. Güntner, Nat. Commun., 2019, 10, 4220 CrossRef CAS.
- F. A. A. Nugroho, I. Darmadi, L. Cusinato, A. Susarrey-Arce, H. Schreuders, L. J. Bannenberg, A. B. da Silva Fanta, S. Kadkhodazadeh, J. B. Wagner, T. J. Antosiewicz, A. Hellman, V. P. Zhdanov, B. Dam and C. Langhammer, Nat. Mater., 2019, 18, 489–495 CrossRef CAS.
- I. C. Weber, H. P. Braun, F. Krumeich, A. T. Güntner and S. E. Pratsinis, Adv. Sci., 2020, 7, 2001503 CrossRef CAS.
- J. van den Broek, A. T. Güntner and S. E. Pratsinis, ACS Sens., 2018, 3, 677–683 CrossRef CAS.
- Y. Li, J. Liu, M. Liu, F. Yu, L. Zhang, H. Tang, B.-C. Ye and L. Lai, Electrochem. Commun., 2016, 64, 42–45 CrossRef CAS.
- C. H. Kwon, D. H. Yun, H.-K. Hong, S.-R. Kim, K. Lee, H. Y. Lim and K. H. Yoon, Sens. Actuators, B, 2000, 65, 327–330 CrossRef CAS.
- R. T. Yang, Gas separation by adsorption processes, Butterworth-Heinemann, 2013 Search PubMed.
- O. Hugon, M. Sauvan, P. Benech, C. Pijolat and F. Lefebvre, Sens. Actuators, B, 2000, 67, 235–243 CrossRef CAS.
- T. Oyabu, Y. Matuura and R. Murai, Sens. Actuators, B, 1990, 1, 218–221 CrossRef CAS.
- X. Zhang, B. Gao, A. E. Creamer, C. Cao and Y. Li, J. Hazard. Mater., 2017, 338, 102–123 CrossRef CAS.
- S. Brunauer, L. S. Deming, W. E. Deming and E. Teller, J. Am. Chem. Soc., 1940, 62, 1723–1732 CrossRef CAS.
- S. J. Gregg, K. S. W. Sing and H. Salzberg, J. Electrochem. Soc., 1967, 114, 279C CrossRef.
- Scientific Instrument Services (SIS), Tenax® TA breakthrough volume data, https://www.sisweb.com/index/referenc/tenaxta.htm, (accessed 2019/08/20).
- M. Harper, J. Chromatogr. A, 2000, 885, 129–151 CrossRef CAS.
- J. Rouquerol, F. Rouquerol, P. Llewellyn, G. Maurin and K. S. Sing, Adsorption by powders and porous solids: principles, methodology and applications, Academic Press, 2013 Search PubMed.
- I. M. Klotz, Chem. Rev., 1946, 39, 241–268 CrossRef CAS.
- N. Mohan, G. K. Kannan, S. Upendra, R. Subha and N. S. Kumar, J. Hazard. Mater., 2009, 168, 777–781 CrossRef CAS.
- M. Harper, Ann. Occup. Hyg., 1993, 37, 65–88 CAS.
- Z.-H. Huang, F. Kang, K.-M. Liang and J. Hao, J. Hazard. Mater., 2003, 98, 107–115 CrossRef CAS.
- K. Frank, H. Kohler and U. Guth, Sens. Actuators, B, 2009, 141, 361–369 CrossRef CAS.
- K. Allen, T. Von Backström and D. Kröger, Powder Technol., 2013, 246, 590–600 CrossRef CAS.
- K. Dettmer and W. Engewald, Anal. Bioanal. Chem., 2002, 373, 490–500 CrossRef CAS.
- R. J. Peters and H. A. Bakkeren, Analyst, 1994, 119, 71–74 RSC.
- C. Turner, P. Španěl and D. Smith, Physiol. Meas., 2006, 27, 321–337 CrossRef.
- World Health Organization, WHO guidelines for indoor air quality: selected pollutants, 2010.
- K.-D. Kwon, W.-K. Jo, H.-J. Lim and W.-S. Jeong, J. Hazard. Mater., 2007, 148, 192–198 CrossRef CAS.
- F. Gritti and G. Guiochon, Anal. Chem., 2006, 78, 4642–4653 CrossRef CAS.
- D. S. Hage, Principles and Applications of Clinical Mass Spectrometry, Elsevier, 2018 Search PubMed.
- L. Ferrus, H. Guenard, G. Vardon and P. Varene, Respir. Physiol., 1980, 39, 367–381 CrossRef CAS.
- I. Maier and M. Fieber, J. High Resolut. Chromatogr., 1988, 11, 566–576 CrossRef CAS.
- G. Odell Wood, Carbon, 1992, 30, 593–599 CrossRef.
- A. A. Pesaran and A. F. Mills, Int. J. Heat Mass Transfer, 1987, 30, 1037–1049 CrossRef CAS.
- X. Zhao, Q. Ma and G. Lu, Energy Fuels, 1998, 12, 1051–1054 CrossRef CAS.
- K. Sakodynskii, L. Panina and N. Klinskaya, Chromatographia, 1974, 7, 339–344 CrossRef CAS.
- A. Khaleel, P. N. Kapoor and K. J. Klabunde, Nanostruct. Mater., 1999, 11, 459–468 CrossRef CAS.
- S. Brosillon, M.-H. Manero and J.-N. Foussard, Environ. Sci. Technol., 2001, 35, 3571–3575 CrossRef CAS.
- N. M. Padial, E. Quartapelle Procopio, C. Montoro, E. López, J. E. Oltra, V. Colombo, A. Maspero, N. Masciocchi, S. Galli and I. Senkovska, Angew. Chem., Int. Ed., 2013, 52, 8290–8294 CrossRef CAS.
- O. K. Farha, I. Eryazici, N. C. Jeong, B. G. Hauser, C. E. Wilmer, A. A. Sarjeant, R. Q. Snurr, S. T. Nguyen, A. Ö. Yazaydın and J. T. Hupp, J. Am. Chem. Soc., 2012, 134, 15016–15021 CrossRef CAS.
- J. Rouquerol, D. Avnir, C. Fairbridge, D. Everett, J. Haynes, N. Pernicone, J. Ramsay, K. Sing and K. Unger, Pure Appl. Chem., 1994, 66, 1739–1758 CAS.
- C. Baerlocher, L. B. McCusker and D. H. Olson, Atlas of zeolite framework types, Elsevier, 2007 Search PubMed.
- T. G. Glover and B. Mu, Gas Adsorption in Metal-Organic Frameworks: Fundamentals and Applications, CRC Press, 2018 Search PubMed.
- J.-M. Li and O. Talu, in Studies in Surface Science and Catalysis, ed. M. Suzuki, Elsevier, 1993, vol. 80, pp. 373–380 Search PubMed.
- K. Yang, Q. Sun, F. Xue and D. Lin, J. Hazard. Mater., 2011, 195, 124–131 CrossRef CAS.
- Y. Morigami, M. Kondo, J. Abe, H. Kita and K. Okamoto, Sep. Purif. Technol., 2001, 25, 251–260 CrossRef CAS.
- Y. Sun, B. Gao, Y. Yao, J. Fang, M. Zhang, Y. Zhou, H. Chen and L. Yang, Chem. Eng. J., 2014, 240, 574–578 CrossRef CAS.
- W. Shen, Z. Li and Y. Liu, Recent Pat. Chem. Eng., 2008, 1, 27–40 CrossRef CAS.
- L. Li, S. Liu and J. Liu, J. Hazard. Mater., 2011, 192, 683–690 CrossRef CAS.
- J. Boudou, A. Martinez-Alonzo and J. Tascon, Carbon, 2000, 38, 1021–1029 CrossRef CAS.
- C. L. Mangun, K. R. Benak, J. Economy and K. L. Foster, Carbon, 2001, 39, 1809–1820 CrossRef CAS.
- J. L. Figueiredo, M. Pereira, M. Freitas and J. Orfao, Carbon, 1999, 37, 1379–1389 CrossRef CAS.
- L. Lalhmunsiama, S. M. Lee, S. S. Choi and D. Tiwari, Metals, 2017, 7, 248 CrossRef.
- Y. Li, J. He, Z. Kaisheng, T. Liu, Y. Hu, X. Chen, X. Huang, L. Kong and J. Liu, RSC Adv., 2019, 9, 397–407 RSC.
- S. Dipendu and D. Shuguang, Tsinghua Sci. Technol., 2010, 15, 363–376 Search PubMed.
- A. Stone, The theory of intermolecular forces, Oxford University Press, 2013 Search PubMed.
- H.-J. Butt and M. Kappl, Surface and interfacial forces, Wiley Online Library, 2010 Search PubMed.
- G. A. Jeffrey, An introduction to hydrogen bonding, Oxford University Press, 1997 Search PubMed.
- S. Sircar, M. B. Rao and T. C. Golden, in Studies in Surface Science and Catalysis, ed. A. Dąbrowski and V. A. Tertykh, Elsevier, 1996, vol. 99, pp. 629–646 Search PubMed.
- M. Nishibori, W. Shin, N. Izu, T. Itoh and I. Matsubara, Sens. Actuators, B, 2009, 137, 524–528 CrossRef CAS.
- H. Suto and G. Inoue, J. Atmos. Ocean. Technol., 2010, 27, 1175–1184 CrossRef.
- Ł. Guz, G. Łagód, K. Jaromin-Gleń, Z. Suchorab, H. Sobczuk and A. Bieganowski, Sensors, 2015, 15, 1–21 CrossRef.
- D. Vlachos, P. Skafidas and J. Avaritsiotis, Sens. Actuators, B, 1995, 25, 491–494 CrossRef CAS.
- A. Prabhakar, R. A. Iglesias, X. Shan, X. Xian, L. Zhang, F. Tsow, E. S. Forzani and N. Tao, Anal. Chem., 2012, 84, 7172–7178 CrossRef CAS.
- L.-Y. Chang, M.-Y. Chuang, H.-W. Zan, H.-F. Meng, C.-J. Lu, P.-H. Yeh and J.-N. Chen, ACS Sens., 2017, 2, 531–539 CrossRef CAS.
- N. Yamazoe, J. Fuchigami, M. Kishikawa and T. Seiyama, Surf. Sci., 1979, 86, 335–344 CrossRef CAS.
- R. H. Castro and D. V. Quach, J. Phys. Chem. C, 2012, 116, 24726–24733 CrossRef CAS.
- R. Salerno-Kennedy and K. D. Cashman, Wien. Klin. Wochenschr., 2005, 117, 180–186 CrossRef CAS.
- M. Schweizer-Berberich, S. Strathmann, U. Weimar, R. Sharma, A. Seube, A. Peyre-Lavigne and W. Göpel, Sens. Actuators, B, 1999, 58, 318–324 CrossRef CAS.
- M. Righettoni, A. Tricoli, S. Gass, A. Schmid, A. Amann and S. E. Pratsinis, Anal. Chim. Acta, 2012, 738, 69–75 CrossRef CAS.
- S. Schon, S. J. Theodore and A. T. Güntner, Sens. Actuators, B, 2018, 273, 1780–1785 CrossRef CAS.
- A. Teleki, S. E. Pratsinis, K. Kalyanasundaram and P. I. Gouma, Sens. Actuators, B, 2006, 119, 683–690 CrossRef CAS.
- A. T. Güntner, V. Koren, K. Chikkadi, M. Righettoni and S. E. Pratsinis, ACS Sens., 2016, 1, 528–535 CrossRef.
- P.-I. Gouma, L. Wang, S. R. Simon and M. Stanacevic, Sensors, 2017, 17, 199 CrossRef.
- L. Cisneros, F. Gao and A. Corma, Microporous Mesoporous Mater., 2019, 283, 25–30 CrossRef CAS.
- R. L. Jordan, C. P. Hauser and A. G. Dawson, Analyst, 1997, 122, 811–814 RSC.
- G. Bergshoeff, R. W. Lanting, J. van Ham, J. M. Prop and H. F. Reijnders, Analyst, 1984, 109, 1165–1169 RSC.
- W. R. Penrose, L. Pan, J. R. Stetter and W. M. Ollison, Anal. Chim. Acta, 1995, 313, 209–219 CrossRef CAS.
- J. Brunet, L. Spinelle, A. Pauly, M. Dubois, K. Guerin, M. Bouvet, C. Varenne, B. Lauron and A. Hamwi, Org. Electron., 2010, 11, 1223–1229 CrossRef CAS.
- J. Brunet, A. Pauly, M. Dubois, M. L. Rodriguez-Mendez, A. L. Ndiaye, C. Varenne and K. Guérin, Talanta, 2014, 127, 100–107 CrossRef CAS.
- G. A. Lawrance, Introduction to coordination chemistry, John Wiley & Sons, 2013 Search PubMed.
- A. I. Popov and W. W. Wendlandt, J. Am. Chem. Soc., 1955, 77, 857–859 CrossRef CAS.
- A. T. Güntner, M. Wied, N. J. Pineau and S. E. Pratsinis, Adv. Sci., 2020, 7, 1903390 CrossRef.
- N. J. Pineau, F. Krumeich, A. T. Güntner and S. E. Pratsinis, Sens. Actuators, B, 2021, 327, 128843 CrossRef CAS.
- H. M. McNair, J. M. Miller and N. H. Snow, Basic gas chromatography, John Wiley & Sons, 2019 Search PubMed.
- B. P. Regmi and M. Agah, Anal. Chem., 2018, 90, 13133–13150 CrossRef CAS.
- Quintron, BreathTracker Analyzer, https://www.breathtests.com/instrumentation, (accessed 2020/06/02).
- M. Li, E. B. Myers, H. X. Tang, S. J. Aldridge, H. C. McCaig, J. J. Whiting, R. J. Simonson, N. S. Lewis and M. L. Roukes, Nano Lett., 2010, 10, 3899–3903 CrossRef CAS.
- S. C. Terry, J. H. Jerman and J. B. Angell, IEEE Trans. Electron Devices, 1979, 26, 1880–1886 Search PubMed.
- H. Zhu, J. She, M. Zhou and X. Fan, Sens. Actuators, B, 2019, 283, 182–187 CrossRef CAS.
- H. Jung, W. Cho, R. Yoo, H.-S. Lee, Y.-S. Choe, J. Y. Jeon and W. Lee, Sens. Actuators, B, 2018, 274, 527–532 CrossRef CAS.
- M. Zhou, J. Lee, H. Zhu, R. Nidetz, K. Kurabayashi and X. Fan, RSC Adv., 2016, 6, 49416–49424 RSC.
- F. Gao, M. Wang, X. Zhang, J. Zhang, Y. Xue, H. Wan and P. Wang, Anal. Methods, 2018, 10, 4329–4338 RSC.
- H. Meng, W. Yang, X. Yan, Y. Zhang, L. Feng and Y. Guan, Sens. Actuators, B, 2015, 216, 511–517 CrossRef CAS.
- I. Lara-lbeas, A. Rodríguez-Cuevas, C. Andrikopoulou, V. Person, L. Baldas, S. Colin and S. Le Calvé, Micromachines, 2019, 10, 187 CrossRef.
- K. M. Skog, F. Xiong, H. Kawashima, E. Doyle, R. Soto and D. R. Gentner, Anal. Chem., 2019, 91, 1318–1327 CrossRef CAS.
- J. Lee, M. Zhou, H. Zhu, R. Nidetz, K. Kurabayashi and X. Fan, Anal. Chem., 2016, 88, 10266–10274 CrossRef CAS.
- J. Lee, S. K. Sayler, M. Zhou, H. Zhu, R. J. Richardson, R. L. Neitzel, K. Kurabayashi and X. Fan, Anal. Methods, 2018, 10, 237–244 RSC.
- Defiant Technologies, TOCAM, https://www.defiant-tech.com/tocam-portable-gas-chromatograph-gc/, (accessed 2020/06/03).
- Dräger, X-pid 9000/9500, https://www.draeger.com/en_seeur/Applications/Products/Portable-Gas-Detection/Multi-Gas-Detectors/X-pid-9000-9500, (accessed 2020/06/03).
- S. Zampolli, I. Elmi, G. C. Cardinali, L. Masini, F. Bonafè and F. Zardi, Sens. Actuators, B, 2020, 305, 127444 CrossRef CAS.
- J. Wang, N. Nuñovero, R. Nidetz, S. J. Peterson, B. M. Brookover, W. H. Steinecker and E. T. Zellers, Anal. Chem., 2019, 91, 4747–4754 CrossRef CAS.
- Y. Qin and Y. B. Gianchandani, Microsyst. Nanoeng., 2016, 2, 15049 CrossRef CAS.
- T. Tzeng, C. Kuo, S. Wang, P. Huang, Y. Huang, W. Hsieh, Y. Huang, P. Kuo, S. Yu, S. Lee, Y. J. Tseng, W. Tian and S. Lu, IEEE J. Solid-State Circuits, 2016, 51, 259–272 Search PubMed.
- P. R. Lewis, P. Manginell, D. R. Adkins, R. J. Kottenstette, D. R. Wheeler, S. S. Sokolowski, D. E. Trudell, J. E. Byrnes, M. Okandan, J. M. Bauer, R. G. Manley and C. Frye-Mason, IEEE Sens. J., 2006, 6, 784–795 Search PubMed.
- S. Zampolli, I. Elmi, F. Mancarella, P. Betti, E. Dalcanale, G. C. Cardinali and M. Severi, Sens. Actuators, B, 2009, 141, 322–328 CrossRef CAS.
- S. K. Kim, H. Chang and E. T. Zellers, Anal. Chem., 2011, 83, 7198–7206 CrossRef CAS.
- W. R. Collin, G. Serrano, L. K. Wright, H. Chang, N. Nuñovero and E. T. Zellers, Anal. Chem., 2014, 86, 655–663 CrossRef CAS.
- J. Wang, J. Bryant-Genevier, N. Nuñovero, C. Zhang, B. Kraay, C. Zhan, K. Scholten, R. Nidetz, S. Buggaveeti and E. T. Zellers, Microsyst. Nanoeng., 2018, 4, 17101 CrossRef CAS.
- S. Abegg, L. Magro, J. van den Broek, S. E. Pratsinis and A. T. Güntner, Nat. Food, 2020, 1, 351–354 CrossRef.
- J. van den Broek, D. K. Cerrejon, S. E. Pratsinis and A. T. Güntner, J. Hazard. Mater., 2020, 399, 123052 CrossRef CAS.
- H. L. Tian, H. Q. Fan, M. M. Li and L. T. Ma, ACS Sens., 2016, 1, 243–250 CrossRef CAS.
- D. Meng, D. Liu, G. Wang, Y. Shen, X. San, M. Li and F. Meng, Sens. Actuators, B, 2018, 273, 418–428 CrossRef CAS.
- IUPAC, Compendium of Chemical Terminology, Blackwell Scientific Publications, 2019 Search PubMed.
- R. Barro, J. Regueiro, M. Llompart and C. Garcia-Jares, J. Chromatogr. A, 2009, 1216, 540–566 CrossRef CAS.
- T. T. Zhou, Y. T. Sang, X. X. Wang, C. Y. Wu, D. W. Zeng and C. S. Xie, Sens. Actuators, B, 2018, 258, 1099–1106 CrossRef CAS.
- N. Kosinov, C. Auffret, C. Gücüyener, B. M. Szyja, J. Gascon, F. Kapteijn and E. J. M. Hensen, J. Mater. Chem. A, 2014, 2, 13083–13092 RSC.
- H. Li, Z. Song, X. Zhang, Y. Huang, S. Li, Y. Mao, H. J. Ploehn, Y. Bao and M. Yu, Science, 2013, 342, 95–98 CrossRef CAS.
- N. Kosinov, J. Gascon, F. Kapteijn and E. J. M. Hensen, J. Membr. Sci., 2016, 499, 65–79 CrossRef CAS.
- S. M. Auerbach, K. A. Carrado and P. K. Dutta, Handbook of zeolite science and technology, CRC Press, 2003 Search PubMed.
- S. Qiu, M. Xue and G. Zhu, Chem. Soc. Rev., 2014, 43, 6116–6140 RSC.
- S.-Y. Ding and W. Wang, Chem. Soc. Rev., 2013, 42, 548–568 RSC.
- M. A. Ruiz, A. Sua and F. Tian, in Encyclopedia of Interfacial Chemistry, ed. K. Wandelt, Elsevier, Oxford, 2018, pp. 646–671 Search PubMed.
- J. Liang, Z. Liang, R. Zou and Y. Zhao, Adv. Mater., 2017, 29, 1701139 CrossRef.
- T. F. Degnan Jr, C. M. Smith and C. R. Venkat, Appl. Catal., A, 2001, 221, 283–294 CrossRef.
- R. E. Morris and P. S. Wheatley, Angew. Chem., Int. Ed., 2008, 47, 4966–4981 CrossRef CAS.
- S. S.-Y. Chui, S. M.-F. Lo, J. P. H. Charmant, A. G. Orpen and I. D. Williams, Science, 1999, 283, 1148–1150 CrossRef CAS.
- J. Zhang, Y. Tan and W.-J. Song, Microchim. Acta, 2020, 187, 234 CrossRef CAS.
- A. F. Ismail, K. C. Khulbe and T. Matsuura, Gas separation membranes, Springer, 2015 Search PubMed.
- R. Krishna and J. Wesselingh, Chem. Eng. Sci., 1997, 52, 861–911 CrossRef CAS.
- Z. Kang, L. Fan and D. Sun, J. Mater. Chem. A, 2017, 5, 10073–10091 RSC.
- C. Chi, X. Wang, Y. Peng, Y. Qian, Z. Hu, J. Dong and D. Zhao, Chem. Mater., 2016, 28, 2921–2927 CrossRef CAS.
- P. S. Goh, A. F. Ismail, S. M. Sanip, B. C. Ng and M. Aziz, Sep. Purif. Technol., 2011, 81, 243–264 CrossRef CAS.
- C. D. Feng, J. Electrochem. Soc., 1994, 141, 220–225 CrossRef CAS.
- M. Fleischer, M. Seth, C. D. Kohl and H. Meixner, Sens. Actuators, B, 1996, 36, 297–302 CrossRef CAS.
- J. Goschnick, M. Frietsch and T. Schneider, Surf. Coat. Technol., 1998, 108–109, 292–296 CrossRef CAS.
- Z. L. Zhan, D. G. Jiang and J. Q. Xu, Mater. Chem. Phys., 2005, 90, 250–254 CrossRef CAS.
- A. Katsuki and K. Fukui, Sens. Actuators, B, 1998, 52, 30–37 CrossRef CAS.
- X. Meng, Q. Zhang, S. Zhang and Z. He, Sensors, 2019, 19, 2478 CrossRef CAS.
- J. Hu, Y. Sun, Y. Xue, M. Zhang, P. Li, K. Lian, S. Zhuiykov, W. Zhang and Y. Chen, Sens. Actuators, B, 2018, 257, 124–135 CrossRef CAS.
- W. J. Buttner, M. B. Post, R. Burgess and C. Rivkin, Int. J. Hydrogen Energy, 2011, 36, 2462–2470 CrossRef CAS.
- Y. Luo, C. Zhang, B. Zheng, X. Geng and M. Debliquy, Int. J. Hydrogen Energy, 2017, 42, 20386–20397 CrossRef CAS.
- K. Wada and M. Egashira, Sens. Actuators, B, 2000, 62, 211–219 CrossRef CAS.
- G. Tournier and C. Pijolat, Sens. Actuators, B, 2005, 106, 553–562 CrossRef CAS.
- US Department of Energy, Hydrogen, Fuel Cells and Infrastructure Technologies Program: Multi-Year Research, Development and Demonstration Plan, 2007.
- V. V. Sysoev, I. Kiselev, V. Trouillet and M. Bruns, Sens. Actuators, B, 2013, 185, 59–69 CrossRef CAS.
- S. Ehrmann, J. Jüngst, J. Goschnick and D. Everhard, Sens. Actuators, B, 2000, 65, 247–249 CrossRef CAS.
- C. Arnold, M. Harms and J. Goschnick, IEEE Sens. J., 2002, 2, 179–188 CrossRef CAS.
- N. Kodakari, T. Sakamoto, K. Shinkawa, H. Funabiki, N. Katada and M. Niwa, Bull. Chem. Soc. Jpn., 1998, 71, 513–519 CrossRef CAS.
- M. Sekiyama, N. Katada and M. Niwa, Sens. Actuators, B, 2007, 124, 398–406 CrossRef CAS.
- L. Huang, M. Zhang, C. Li and G. Shi, J. Phys. Chem. Lett., 2015, 6, 2806–2815 CrossRef CAS.
- S. C. O’Hern, M. S. Boutilier, J.-C. Idrobo, Y. Song, J. Kong, T. Laoui, M. Atieh and R. Karnik, Nano Lett., 2014, 14, 1234–1241 CrossRef.
- J. Zhao, G. He, S. Huang, L. F. Villalobos, M. Dakhchoune, H. Bassas and K. V. Agrawal, Sci. Adv., 2019, 5, eaav1851 CrossRef CAS.
- J. S. Jarig, J. Lee, W. T. Koo, D. H. Kim, H. J. Cho, H. Shin and I. D. Kim, Anal. Chem., 2020, 92, 957–965 CrossRef.
- M. Drobek, J. H. Kim, M. Bechelany, C. Vallicari, A. Julbe and S. S. Kim, ACS Appl. Mater. Interfaces, 2016, 8, 8323–8328 CrossRef CAS.
- M. Chi and Y.-P. Zhao, Comput. Mater. Sci., 2009, 46, 1085–1090 CrossRef CAS.
- Z. Li, N. Wang, Z. Lin, J. Wang, W. Liu, K. Sun, Y. Q. Fu and Z. Wang, ACS Appl. Mater. Interfaces, 2016, 8, 20962–20968 CrossRef CAS.
- M. Vilaseca, J. Coronas, A. Cirera, A. Cornet, J. R. Morante and J. Santamaria, Sens. Actuators, B, 2007, 124, 99–110 CrossRef CAS.
- G. Lu and J. T. Hupp, J. Am. Chem. Soc., 2010, 132, 7832–7833 CrossRef CAS.
- A. Lan, K. Li, H. Wu, D. H. Olson, T. J. Emge, W. Ki, M. Hong and J. Li, Angew. Chem., Int. Ed., 2009, 48, 2334–2338 CrossRef CAS.
- H. Bux, F. Liang, Y. Li, J. Cravillon, M. Wiebcke and J. Caro, J. Am. Chem. Soc., 2009, 131, 16000–16001 CrossRef CAS.
- X. N. Wu, S. S. Xiong, Z. H. Mao, S. Hu and X. G. Long, Chem. – Eur. J., 2017, 23, 7969–7975 CrossRef CAS.
- M. Weber, J. H. Kim, J. H. Lee, J. Y. Kim, I. Iatsunskyi, E. Coy, M. Drobek, A. Julbe, M. Bechelany and S. S. Kim, ACS Appl. Mater. Interfaces, 2018, 10, 34765–34773 CrossRef CAS.
- C. Wadell, S. Syrenova and C. Langhammer, ACS Nano, 2014, 8, 11925–11940 CrossRef CAS.
- Y. Zhou, T. Zhou, Y. Zhang, L. Tang, Q. Guo, M. Wang, C. Xie and D. Zeng, Solid State Ionics, 2020, 350, 115278 CrossRef CAS.
- Z. Qiao, Q. Xu and J. Jiang, J. Mater. Chem. A, 2018, 6, 18898–18905 RSC.
- K. B. Sezginel, S. Keskin and A. Uzun, Langmuir, 2016, 32, 1139–1147 CrossRef CAS.
- K. S. Walton, M. B. Abney and M. D. LeVan, Microporous Mesoporous Mater., 2006, 91, 78–84 CrossRef CAS.
- T. Zhou, Z. Qin, X. Wang, C. Wu, X. Tang, T. Zhang, H. Wang, C. Xie and D. Zeng, Chem. Commun., 2019, 55, 11045–11048 RSC.
- M. Vilaseca, J. Coronas, A. Cirera, A. Cornet, J. R. Morante and J. Santamaría, Catal. Today, 2003, 82, 179–185 CrossRef CAS.
- M. Vilaseca, J. Coronas, A. Cirera, A. Cornet, J. Morante and J. Santamaria, Sens. Actuators, B, 2008, 133, 435–441 CrossRef CAS.
- K. Fukui and S. Nishida, Sens. Actuators, B, 1997, 45, 101–106 CrossRef CAS.
- R. Binions, H. Davies, A. Afonja, S. Dungey, D. Lewis, D. E. Williams and I. P. Parkin, J. Electrochem. Soc., 2009, 156, J46–J51 CrossRef CAS.
- S. Galioglu, I. Karaduman, T. Çorlu, B. Akata, M. A. Yıldırım, A. Ateş and S. Acar, J. Mater. Sci.: Mater. Electron., 2018, 29, 1356–1368 CrossRef CAS.
- D. C. Pugh, E. J. Newton, A. J. T. Naik, S. M. V. Hailes and I. P. Parkin, J. Mater. Chem. A, 2014, 2, 4758–4764 RSC.
- P. Tarttelin Hernández, S. M. V. Hailes and I. P. Parkin, Sens. Actuators, B, 2017, 242, 1281–1295 CrossRef.
- A. T. Güntner, S. Abegg, K. Wegner and S. E. Pratsinis, Sens. Actuators, B, 2018, 257, 916–923 CrossRef.
- E. G. Derouane and S. M. Roberts, Microporous and mesoporous solid catalysts, John Wiley & Sons, 2006 Search PubMed.
- U. P. Tran, K. K. Le and N. T. Phan, ACS Catal., 2011, 1, 120–127 CrossRef CAS.
- S. K. Brown, M. R. Sim, M. J. Abramson and C. N. Gray, Indoor Air, 1994, 4, 123–134 CrossRef CAS.
- Z. Wang, C. Hou, Q. De, F. Gu and D. Han, ACS Sens., 2018, 3, 468–475 CrossRef CAS.
- Y. Sun, H. Yang, Z. Zhao, K. Suematsu, P. Li, Z. Yu, W. Zhang and J. Hu, Sens. Actuators, B, 2020, 318, 128222 CrossRef CAS.
- F. Krumeich, S. Abegg and A. T. Güntner, Z. Anorg. Allg. Chem., 2020, 646, 412–418 CrossRef CAS.
- A. Y. Volkov, Platinum Met. Rev., 2004, 48, 3–11 CAS.
- M. A. Portnoff, R. Grace, A. M. Guzman, P. D. Runco and L. N. Yannopoulos, Sens. Actuators, B, 1991, 5, 231–235 CrossRef CAS.
- V. Bessonneau and O. Thomas, Int. J. Environ. Res. Public Health, 2012, 9, 868–879 CrossRef CAS.
- L. F. Liotta, Appl. Catal., B, 2010, 100, 403–412 CrossRef CAS.
- R. Kikuchi, S. Maeda, K. Sasaki, S. Wennerström and K. Eguchi, Appl. Catal., A, 2002, 232, 23–28 CrossRef CAS.
- Z. Abbasi, M. Haghighi, E. Fatehifar and S. Saedy, J. Hazard. Mater., 2011, 186, 1445–1454 CrossRef CAS.
- R. Strobel, A. Baiker and S. E. Pratsinis, Adv. Powder Technol., 2006, 17, 457–480 CrossRef CAS.
- L. Machala, R. Zboril and A. Gedanken, J. Phys. Chem. B, 2007, 111, 4003–4018 CrossRef CAS.
- J. C. Védrine, Catalysts, 2017, 7, 314 CrossRef.
- M. S. Kamal, S. A. Razzak and M. M. Hossain, Atmos. Environ., 2016, 140, 117–134 CrossRef CAS.
- J. W. Maina, C. Pozo-Gonzalo, L. Kong, J. Schütz, M. Hill and L. F. Dumée, Mater. Horiz., 2017, 4, 345 RSC.
- M. A. Sidheswaran, H. Destaillats, D. P. Sullivan, J. Larsen and W. J. Fisk, Appl. Catal., B, 2011, 107, 34–41 CrossRef CAS.
- H. Huang, Y. Xu, Q. Feng and D. Y. C. Leung, Catal. Sci. Technol., 2015, 5, 2649–2669 RSC.
- H. A. Benesi, J. Catal., 1967, 8, 368–374 CrossRef CAS.
- R. K. Sharma, B. Zhou, S. Tong and K. T. Chuang, Ind. Eng. Chem. Res., 1995, 34, 4310–4317 CrossRef CAS.
- R. J. Farrauto, M. Deeba and S. Alerasool, Nat. Catal., 2021, 2, 603–613 CrossRef.
- Z. Li, D. Wang, Y. Wu and Y. Li, Natl. Sci. Rev., 2018, 5, 673–689 CrossRef CAS.
- M. Phillips, Anal. Biochem., 1997, 247, 272–278 CrossRef CAS.
- A. G. Panov and J. J. Fripiat, J. Catal., 1998, 178, 188–197 CrossRef CAS.
- M. Frankel, G. Bekö, M. Timm, S. Gustavsen, E. W. Hansen and A. M. Madsen, Appl. Environ. Microbiol., 2012, 78, 8289–8297 CrossRef CAS.
- J. A. Moulijn, O. W. N. M. van Leeuwen and R. A. Santen, Stud. Surf. Sci. Catal., 1993, 79, 69–86 CrossRef.
- F. A. Smith, S. Elliott, D. R. Blake and F. S. Rowland, Environ. Sci. Policy, 2002, 5, 449–461 CrossRef CAS.
- T. G. Leighton and P. R. White, Proc. R. Soc. A, 2012, 468, 485–510 CrossRef CAS.
- S. Basu and P. K. Basu, J. Sens., 2009, 2009, 861968 Search PubMed.
- B. Vanderstraeten, J. Berghmans, D. Tuerlinckx, B. Smit, E. Van't Oost and S. Vliegen, J. Hazard. Mater., 1997, 56, 237–246 CrossRef CAS.
- S. Prasad, L. Zhao and J. Gomes, Epidemiology, 2011, 22, 251 CrossRef.
- T. Sahm, W. Rong, N. Bârsan, L. Mädler, S. K. Friedlander and U. Weimar, J. Mater. Res., 2007, 22, 850–857 CrossRef CAS.
- P. Reimann and A. Schütze, Sens. Rev., 2012, 32, 47–58 CrossRef.
- V. Weli and J. O. Adegoke, J. Pollut. Control, 2016, 4, 1000171 Search PubMed.
- A. Cabot, J. Arbiol, A. Cornet, J. R. Morante, F. Chen and M. Liu, Thin Solid Films, 2003, 436, 64–69 CrossRef CAS.
- S. Ghosh, C. Roychaudhuri, R. Bhattacharya, H. Saha and N. Mukherjee, ACS Appl. Mater. Interfaces, 2014, 6, 3879–3887 CrossRef CAS.
- S. Ghosh, R. Bhattacharyya, H. Saha, C. R. Chaudhuri and N. Mukherjee, Phys. Chem. Chem. Phys., 2015, 17, 27777–27788 RSC.
- N. Ikoma, M. Takeya and N. Satoshi, Combustible gas sensor and method for detecting deterioration of catalyst, EP0751390A3, 1995 Search PubMed.
- S. Jansat, K. Pelzer, J. Garcia-Anton, R. Raucoules, K. Philippot, A. Maisonnat, B. Chaudret, Y. Guari, A. Mehdi, C. Reye and R. J. R. Corriu, Adv. Funct. Mater., 2007, 17, 3339–3347 CrossRef CAS.
- T. Sahm, W. Rong, N. Bârsan, L. Mädler and U. Weimar, Sens. Actuators, B, 2007, 127, 63–68 CrossRef CAS.
- T. Suzuki, K. Kunihara, M. Kobayashi, S. Tabata, K. Higaki and H. Ohnishi, Sens. Actuators, B, 2005, 109, 185–189 CrossRef CAS.
- K. Sahner, R. Moos, M. Matam, J. J. Tunney and M. Post, Sens. Actuators, B, 2005, 108, 102–112 CrossRef CAS.
- M. Fleischer, S. Kornely, T. Weh, J. Frank and H. Meixner, Sens. Actuators, B, 2000, 69, 205–210 CrossRef CAS.
- G. G. Mandayo, E. Castaño, F. J. Gracia, A. Cirera, A. Cornet and J. R. Morante, Sens. Actuators, B, 2002, 87, 88–94 CrossRef CAS.
- F. S. Fateminia, Y. Mortazavi and A. A. Khodadadi, Mater. Sci. Semicond. Process., 2019, 90, 182–189 CrossRef CAS.
- B. A. Tichenor and M. A. Palazzolo, Environ. Prog., 1987, 6, 172–176 CrossRef CAS.
- H. H. Kung, M. Kung and C. Costello, J. Catal., 2003, 216, 425–432 CrossRef CAS.
- S. N. Oliaee, A. Khodadadi, Y. Mortazavi and S. Alipour, Sens. Actuators, B, 2010, 147, 400–405 CrossRef CAS.
- J. Jońca, J. Harmel, L. Joanny, A. Ryzhikov, M. L. Kahn, P. Fau, B. Chaudret and K. Fajerwerg, Sens. Actuators, B, 2017, 249, 357–363 CrossRef.
- J. Vuković, D. Modun, D. Marković and D. Sutlović, J. Subst. Abuse Alcohol., 2015, 3, 1029 Search PubMed.
- A. T. Güntner, I. C. Weber and S. E. Pratsinis, ACS Sens., 2020, 5, 1058–1067 CrossRef.
- M. P. Kalapos, Biochim. Biophys. Acta, 2003, 1621, 122–139 CrossRef CAS.
- N. C. Jeong, J. S. Lee, E. L. Tae, Y. J. Lee and K. B. Yoon, Angew. Chem., Int. Ed., 2008, 47, 10128–10132 CrossRef CAS.
- T. Mallat and A. Baiker, Chem. Rev., 2004, 104, 3037–3058 CrossRef CAS.
- J. Llorca, N. Homs and P. Ramirez de la Piscina, J. Catal., 2004, 227, 556–560 CrossRef CAS.
- A. Mirzaei, J.-H. Kim, H. W. Kim and S. S. Kim, J. Mater. Chem. C, 2018, 6, 4342–4370 RSC.
- S.-Y. Jeong, J.-W. Yoon, T.-H. Kim, H.-M. Jeong, C.-S. Lee, Y. Chan Kang and J.-H. Lee, J. Mater. Chem. A, 2017, 5, 1446–1454 RSC.
- J. Hubálek, K. Malysz, J. Prášek, X. Vilanova, P. Ivanov, E. Llobet, J. Brezmes, X. Correig and Z. Svěrák, Sens. Actuators, B, 2004, 101, 277–283 CrossRef.
- P. Clément, S. Korom, C. Struzzi, E. J. Parra, C. Bittencourt, P. Ballester and E. Llobet, Adv. Funct. Mater., 2015, 25, 4011–4020 CrossRef.
- H.-M. Jeong, S.-Y. Jeong, J.-H. Kim, B.-Y. Kim, J.-S. Kim, F. Abdel-Hady, A. A. Wazzan, H. A. Al-Turaif, H. W. Jang and J.-H. Lee, ACS Appl. Mater. Interfaces, 2017, 9, 41397–41404 CrossRef CAS.
- L. Cao, Z. Gao, S. L. Suib, T. N. Obee, S. O. Hay and J. D. Freihaut, J. Catal., 2000, 196, 253–261 CrossRef CAS.
- Y. Zeng, Z. Hua, X. Tian, X. Li, Z. Qiu, C. Zhang, M. Wang and E.-P. Li, Sens. Actuators, B, 2018, 273, 1291–1299 CrossRef CAS.
- M. H. Saberi, Y. Mortazavi and A. A. Khodadadi, Sens. Actuators, B, 2015, 206, 617–623 CrossRef CAS.
- G. Korotcenkov, B. K. Cho, V. Brinzari, L. B. Gulina and V. P. Tolstoy, Ferroelectrics, 2014, 459, 46–51 CrossRef CAS.
- M. Frietsch, F. Zudock, J. Goschnick and M. Bruns, Sens. Actuators, B, 2000, 65, 379–381 CrossRef CAS.
- D. P. Mann, K. F. E. Pratt, T. Paraskeva, I. P. Parkin and D. E. Williams, IEEE Sens. J., 2007, 7, 551–556 CAS.
- J. Wöllenstein, H. Böttner, M. Jaegle, W. J. Becker and E. Wagner, Sens. Actuators, B, 2000, 70, 196–202 CrossRef.
- K. Sahner, D. Schönauer, P. Kuchinke and R. Moos, Sens. Actuators, B, 2008, 133, 502–508 CrossRef CAS.
- S.-Y. Jeong, Y. K. Moon, T.-H. Kim, S.-W. Park, K. B. Kim, Y. C. Kang and J.-H. Lee, Adv. Sci., 2020, 7, 1903093 CrossRef CAS.
- V. Paul, R. Pandey and G. C. Srivastava, J. Food Sci. Technol., 2012, 49, 1–21 CrossRef CAS.
- H. P. Hofmann, Catal. Rev.: Sci. Eng., 1978, 17, 71–117 CrossRef CAS.
- A. T. Güntner, N. A. Sievi, S. J. Theodore, T. Gulich, M. Kohler and S. E. Pratsinis, Anal. Chem., 2017, 89, 10578–10584 CrossRef.
- A. T. Güntner, J. F. Kompalla, H. Landis, S. J. Theodore, B. Geidl, N. A. Sievi, M. Kohler, S. E. Pratsinis and P. A. Gerber, Sensors, 2018, 18, 3655 CrossRef.
- A. T. Güntner, N. J. Pineau, P. Mochalski, H. Wiesenhofer, A. Agapiou, C. A. Mayhew and S. E. Pratsinis, Anal. Chem., 2018, 90, 4940–4945 CrossRef.
- R. Yoo, A. T. Güntner, Y. Park, H. J. Rim, H. S. Lee and W. Lee, Sens. Actuators, B, 2019, 283, 107–115 CrossRef CAS.
- P. Mochalski, V. Ruzsanyi, H. Wiesenhofer and C. A. Mayhew, J. Breath Res., 2018, 12, 027107 CrossRef.
- K. Tadesse, D. Smith and M. A. Eastwod, Q. J. Exp. Physiol. Cogn. Med. Sci., 1980, 65, 85–97 CAS.
- M. Righettoni, A. Ragnoni, A. T. Güntner, C. Loccioni, S. E. Pratsinis and T. H. Risby, J. Breath Res., 2015, 9, 047101 CrossRef.
- A. Lewis and P. Edwards, Nature, 2016, 535, 29–31 CrossRef CAS.
- F. Bindler, E. Voges and P. Laugel, Food Addit. Contam., 1988, 5, 343–351 CrossRef CAS.
- J. A. Kraut, Am. J. Kidney Dis., 2016, 68, 161–167 CrossRef CAS.
- C. Wambua-Soi, Iran: Over 700 dead after drinking alcohol to cure coronavirus, https://www.aljazeera.com/news/2020/04/iran-700-dead-drinking-alcohol-cure-coronavirus-200427163529629.html, Al-Jazeera, 2020/04/27.
- M. Fazio, 3 Die in New Mexico After Drinking Hand Sanitizer, Officials Say, https://www.nytimes.com/2020/06/26/us/3-dead-drinking-hand-sanitizer.html, The New York Times, 2020/06/26.
- D. M. Ruszkiewicz, D. Sanders, R. O'Brien, F. Hempel, M. J. Reed, A. C. Riepe, K. Bailie, E. Brodrick, K. Darnley, R. Ellerkmann, O. Mueller, A. Skarysz, M. Truss, T. Wortelmann, S. Yordanov, C. L. P. Thomas, B. Schaaf and M. Eddleston, EClinicalMedicine, 2020, https://doi.org/10.1016/j.eclinm.2020.100609.
- A. C. Skinner, S. N. Ravanbakht, J. A. Skelton, E. M. Perrin and S. C. Armstrong, Pediatrics, 2018, 141(3), e20173459 CrossRef.
- S. Kaskel, The Chemistry of Metal–Organic Frameworks, Wiley, 2016, pp. 271–307 Search PubMed.
- M. L. Terranova, S. Orlanducci and M. Rossi, Carbon nanomaterials for gas adsorption, CRC Press, 2012 Search PubMed.
- D. W. Breck, Zeolite molecular sieves: structure, chemistry and use, Krieger, 1984 Search PubMed.
- M. Van-Leeuwen, Fluid Phase Equilib., 1994, 99, 1–18 CrossRef CAS.
- M. Arruebo, J. L. Falconer and R. D. Noble, J. Membr. Sci., 2006, 269, 171–176 CrossRef CAS.
| This journal is © The Royal Society of Chemistry 2021 |