Pt/Ru/C nanocomposites for methanol electrooxidation: how Ru nanocrystals’ surface structure affects catalytic performance of deposited Pt particles†
Jun
Gu
,
Wen-Chi
Liu
,
Ze-Qiong
Zhao
,
Guang-Xu
Lan
,
Wei
Zhu
and
Ya-Wen
Zhang
*
Beijing National Laboratory for Molecular Science, State Key Laboratory of Rare Earth Materials Chemistry and Applications, PKU-HKU Joint Laboratory in Rare Earth Materials and Bioinorganic Chemistry, College of Chemistry and Molecular Engineering, Peking University, Beijing 100871, China. E-mail: ywzhang@pku.edu.cn; Fax: +86 10 62756787; Tel: +86 10 62756787
First published on 6th January 2014
Abstract
The surface structure of supporting materials has great effect on the catalytic performance of supported catalysts. In this work, three kinds of Ru nanocrystals with different morphologies and surface structures, namely triangular plates (TPs), capped columns (CCs) and nanospheres (NSs), were used as substrates for the deposition of Pt particles through an aqueous adsorption–reduction approach. By testing the catalytic activity and stability of these composite catalysts towards methanol electrooxidation, the relationship between the surface structure of Ru nanocrystals and the catalytic performances of Pt particles was built up. Pt/Ru TPs/C exhibited higher catalytic activity and stability than Pt/Ru CCs/C, indicating that the closest packed facet of Ru serves as better substrate for the deposition of Pt particles than the high index facets of Ru for methanol electrooxidation. Pt particles and Ru NSs formed a self-supported network structure in Pt/Ru NSs/C, which increased the level of dispersion of Pt particles and guaranteed higher catalytic activity and stability compared with Pt/Ru CCs/C. This work demonstrated how to use shape controlled metal nanocrystals to study the surface structure effect of supports in catalytic reactions.
Introduction
It has been widely accepted that metal-catalyzed reaction are remarkably sensitive to the surface structure of the metal.1,2 Besides, the metal surface can also serve as substrate for the deposition of other catalysts.3–10 The surface structure of a metallic substrate can influence the performance of catalysts deposited on it by changing the electron structure of the catalysts, which is known as electron effect, or introducing another kind of site involved in the reaction, which is known as synergetic effect. For instance, Adzic and co-workers deposited a certain number of layers of Pt on the surface of another metal with electrochemical methods11 and investigated the influence of the substrate metal on the electrocatalytic activity of Pt.5,6 Markovic and co-workers deposited hydr(oxy)oxides of transition metals on the (111) facet of Pt and explored the synergetic effect between the hydr(oxy)oxide and the Pt surface in some electrocatalytic reactions.4 Bao and co-workers used the Pt (111) facet to stabilize very active coordinatively unsaturated ferrous sites, which exhibited high efficiency for CO oxidation at low temperatures.7,10 The influence of the metal substrate on the catalysts supported on it may be also sensitive to the surface structure of the metal substrate,8i.e. exposing facet and surface defects. The surface structure of the metal substrate substantially influences the structure of the interface between metal substrate and deposited catalysts. On one hand, the mechanism of activity enhancement or suppression is based on the interface structure of the catalysts and the metal substrate. On the other hand, how firmly the catalysts are deposited on the metal substrate is also determined by the interface structure, and this will decide the stability of the catalysts.Pt particles deposited on Ru surface as catalyst for electrochemical methanol oxidation reaction (MOR) is a good object to study how the surface structure of the metal substrate influences the performance of the deposited catalysts. Pt is the most active mono-metallic catalyst toward MOR, but the activity at relatively low potential (0.6 V vs. reversible hydrogen electrode (RHE), for instance) is seriously suppressed by adsorbed CO species as poisoning intermediates.12 The synergetic effect between Pt and Ru can be utilized to enhance the MOR activity of Pt.13–18 Adsorbed OH species form on Ru sites at a lower potential than on Pt sites. When a Ru site appears on an adjacent site to a Pt atom, the OH species on the Ru site can help the oxidative removal of CO species on the Pt site.19–22 When Pt particles are deposited on Ru surfaces, how the structure of Ru surface influences the synergetic effect between Pt and Ru is an open question worthy of detailed studies.
Very recently, shape and phase controlled syntheses of Ru nanocrystals (NCs) were realized.23–25 In our previous work, we synthesized Ru triangular plates (TPs), capped columns (CCs, as shown in the left bottom corner of Scheme 1) and nanospheres (NSs).23 In this work, these three kinds of Ru NCs were introduced as substrates for the deposition of Pt particles. An aqueous adsorption–reduction method was used to prepare Pt/Ru NCs nanocomposites, as shown in Scheme 1. The surface structures of these three kinds of Ru NCs are quite different. Ru TPs mainly expose the closest packed facets as the top and bottom surface of the plates. The closest packed facets are also exposed as the two basal surfaces of Ru CCs, while their side surfaces comprise a series of high index facets of hexagonal closest packed (hcp) Ru. Ru NSs are comparatively poorly crystallized and the surface exhibits a high level of disorder. When Pt particles were deposited on these Ru NCs with different surface structures, they exhibited dramatically different MOR catalytic activity and stability. Pt/Ru TPs/C exhibited higher MOR catalytic activity and stability than Pt/Ru CCs/C because of the higher degree of matching at the interface between the Pt particles and the closest packed facets of Ru NCs than between the Pt particles and the high index facets of Ru NCs. Pt/Ru NSs/C also displayed better MOR catalytic performance than Pt/Ru CCs/C because Pt particles and Ru NSs formed a self-supported network structure, which improved the dispersion of Pt particles and the stability of the nanocomposites. This work reveals how the structure, especially the surface structure, of the metal substrate influences the catalytic performance of catalysts deposited on it, and this method can be used as a reference to investigate other catalytic processes sensitive to the surface structure of substrates.
 | ||
| Scheme 1 Illustration of the procedure to deposit Pt particles on Ru NCs with different morphologies. Orange particles represent Ru NCs and blue balls represent Pt particles. | ||
Experimental section
Materials
RuCl3·xH2O (A.R., Sinopharm Chemical Reagent Co. Ltd.), sodium oxalate (Na2C2O4, A.R., Beijing Chemical Works), sodium malonate hydrate (Na2C3H2O4·H2O, C.P., Sinopharm Chemical Reagent Co. Ltd.), poly(vinylpyrrolidone) (PVP; Mw ∼29![[thin space (1/6-em)]](https://www.rsc.org/images/entities/char_2009.gif) 000, Sigma-Aldrich), formaldehyde solution (HCHO, 40 wt%, A.R., Beijing Yili Fine Chemical Reagent Corp.), K2PtCl4 (A.R., Shengyang Institute of Nonferrous Metal), NaBH4 (A.R., Tianjing Xuanang Division Industry and Trade Co. Ltd.), carbon black (Vulcan XC-72R, Cabot, U.S.), perchloric acid (HClO4, A.R., Beijing Chemical Reagent Corp.), methanol (MeOH, HPLC, Xilong Chemical Industry Co. Ltd.), Pt/C catalyst (20 wt% Pt, Shanghai Hesen Electric Co. Ltd.), Nafion (Alfa Aesar), hydrochloric acid (HCl, A.R.), acetone (A.R.) and methanol (A.R.) were used as received. The water used in all experiments was ultrapure (Millipore, 18.2 MΩ).
000, Sigma-Aldrich), formaldehyde solution (HCHO, 40 wt%, A.R., Beijing Yili Fine Chemical Reagent Corp.), K2PtCl4 (A.R., Shengyang Institute of Nonferrous Metal), NaBH4 (A.R., Tianjing Xuanang Division Industry and Trade Co. Ltd.), carbon black (Vulcan XC-72R, Cabot, U.S.), perchloric acid (HClO4, A.R., Beijing Chemical Reagent Corp.), methanol (MeOH, HPLC, Xilong Chemical Industry Co. Ltd.), Pt/C catalyst (20 wt% Pt, Shanghai Hesen Electric Co. Ltd.), Nafion (Alfa Aesar), hydrochloric acid (HCl, A.R.), acetone (A.R.) and methanol (A.R.) were used as received. The water used in all experiments was ultrapure (Millipore, 18.2 MΩ).
Depositing Pt particles on Ru NCs with different morphologies
In this work, Ru TPs with an edge length of (24 ± 5) nm, CCs with an edge length of (53 ± 8) nm and height of (20 ± 4) nm and NSs with diameter of (3.0 ± 0.3) nm, which were first synthesized according to ref. 23, were used as substrates for the deposition of Pt particles (TEM images of these Ru NCs are shown in Fig. S1†). In a typical preparation procedure, 1 mL water dispersion containing 1.52 mg Ru NCs and 625 μL of 0.024 M K2PtCl4 solution were mixed in a vial. The mixture was then treated with ultrasound for 4 h to promote the adsorption of Pt precursor on the surface of Ru NCs. Next, 1 mL of 0.15 M NaBH4 water solution was added dropwise to the vial under vigorous stirring at 0–2 °C. The reaction mixture was kept under stirring overnight, followed by the addition of 6 mL acetone and centrifugation at 7800 rpm for 5 min. Unsupported Pt particles were washed out from the crude product by water–acetone mixed solvent for 2 times, and the final product was re-dispersed in ethanol for further use.Preparation of Pt/Ru NCs/C catalysts for electrocatalysis
Carbon black with a mass of 4 times the metallic nanocomposites was added to the as-mentioned ethanol dispersion. The mixture was treated under ultrasound for 2 h, followed by centrifugation. The precipitate was then re-dispersed in ethanol to form the catalyst ink with a concentration of 1 mg mL−1.Electrochemical measurements
Electrochemical measurements were carried out on a CHI 850C electrochemical analyser (CH Instrument, TX, U.S.). A three-electrode cell was used with a glassy carbon electrode (GCE, 5 mm in diameter) as the work electrode, an AgCl/Ag/saturated KCl electrode as the reference electrode and a Pt wire as the counter electrode. All potentials in this work were converted to values versus reversible hydrogen electrode (RHE) references. 10 μL of as-prepared ink or ethanol dispersion of commercial Pt/C (1 mg mL−1) were dropped on the GCE. After the catalyst dried, 5 μL of Nafion (0.2 wt% ethanol solution) was dropped on the GCE and dried. Cyclic voltammetry (CV) tests were carried out in HClO4 solution (0.1 mol L−1 (M)), and a mix solution of HClO4 (0.1 M) and MeOH (0.1 M) with a scanning rate of 50 mV s−1. CO stripping tests were used to measure the electrochemical active surface area (ECSA) of the catalysts and test the tolerance to CO as poisonous species.22,26–28 Firstly, the potential of work electrode was fixed at 0.3 V versus RHE and the electrolyte was bubbled with CO for 10 min, then with N2 for 30 min. Next, two cycles of CV test with a scanning rate of 50 mV s−1 were carried out. 420 μC cm−2 was used as the conversion coefficient between the quantity of electricity of CO stripping and the ECSA of the catalysts.Instrumentation
Samples for transmission electron microscopy (TEM) observation were prepared by drying a drop of ethanol dispersion of the samples on copper grids coated with amorphous carbon membranes. TEM, high-resolution TEM (HRTEM), high angle annular dark field scanning transmission electron microscopy (HAADF-STEM) images and energy dispersive X-ray spectroscopy (EDS) were taken on a FEG-TEM (JEM2100F, JEOL, Japan) operated at 200 kV. X-ray diffraction (XRD) patterns were obtained on a D/MAX-2000 diffractometer (Rigaku, Japan) with a slit of 1/2° at a scanning rate of 2° min−1 using Cu Kα radiation. The contributions of Kα2 line in the XRD patterns were subtracted. The X-ray photoelectron spectroscopy (XPS) characterizations were performed on an Axis Ultra (Kratos, Japan) imaging photoelectron spectrometer. Inductively coupled plasma–atomic spectroscopy (ICP-AES) analysis was performed on a Profile Spec ICP-AES spectrometer (Leeman, USA).Results and discussion
Structure and composition characterization of Pt/Ru NCs nanocomposites
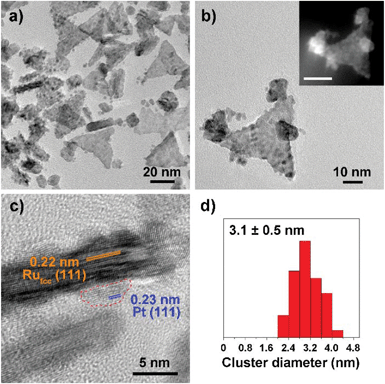
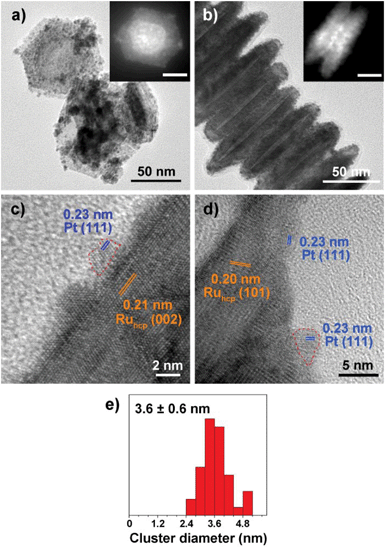
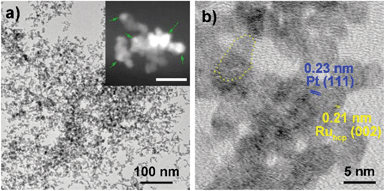
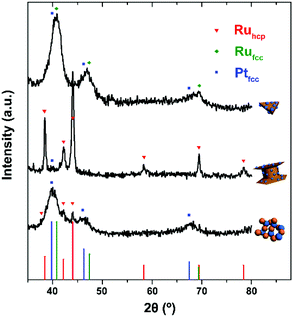
Fig. 1–3 shows the TEM characterization results of Pt/Ru TPs, Pt/Ru CCs and Pt/Ru NSs, respectively. Fig. 4 shows the corresponding XRD patterns and Table 1 lists the atomic ratio of Pt![[thin space (1/6-em)]](https://www.rsc.org/images/entities/char_2009.gif) :
:![[thin space (1/6-em)]](https://www.rsc.org/images/entities/char_2009.gif) Ru of these samples obtained from EDS, ICP-AES and XPS analyses. The surfaces of Ru TPs and Ru CCs are quite smooth, as shown in Fig. S1;† while the surfaces of Pt/Ru TPs and Pt/Ru CCs are rough and small particles can be seen on the surface of Ru TPs and Ru CCs (as revealed by the TEM, HRTEM and HAADF-STEM images shown in Fig. 1 and 2), indicating that Pt particles were successfully deposited on the surfaces of Ru TPs and Ru CCs. Seldom unsupported particles are observed in these images. Ru NSs and Pt particles are difficult to distinguish in the TEM image of Pt/Ru NSs (Fig. 3a). However, in the Z-contrast HAADF-STEM image (inset of Fig. 3a), some spots with high brightness can be observed on the surface of a particle agglomerate, and the lattice fringes of both face-centered-cubic (fcc) Pt and hcp Ru can be seen in the HRTEM image (Fig. 3b), indicating that Pt particles and Ru NSs formed an aggregate structure together. XPS analyses (Fig. S2 and S3†) gave a higher Pt ratio than EDS and ICP-AES in the cases of Pt/Ru TPs and Pt/Ru CCs, verifying that Pt particles were dispersed on the surface of these Ru NCs, since only few photoelectrons coming from the outermost atomic layers could be detected under experimental conditions. Table S1† lists the ratios of Ru and Pt elements in different valent states calculated from the XPS results. The outmost few layers of Pt and Ru atoms in Pt/Ru NCs are partially oxidized according to Table S1.† Higher levels of oxidation were detected on the surface of Pt particles and Ru NSs, in accordance with the fact that Pt particles and Ru NSs possess a larger specific surface area and a higher concentration of surface defects.29–31
Ru of these samples obtained from EDS, ICP-AES and XPS analyses. The surfaces of Ru TPs and Ru CCs are quite smooth, as shown in Fig. S1;† while the surfaces of Pt/Ru TPs and Pt/Ru CCs are rough and small particles can be seen on the surface of Ru TPs and Ru CCs (as revealed by the TEM, HRTEM and HAADF-STEM images shown in Fig. 1 and 2), indicating that Pt particles were successfully deposited on the surfaces of Ru TPs and Ru CCs. Seldom unsupported particles are observed in these images. Ru NSs and Pt particles are difficult to distinguish in the TEM image of Pt/Ru NSs (Fig. 3a). However, in the Z-contrast HAADF-STEM image (inset of Fig. 3a), some spots with high brightness can be observed on the surface of a particle agglomerate, and the lattice fringes of both face-centered-cubic (fcc) Pt and hcp Ru can be seen in the HRTEM image (Fig. 3b), indicating that Pt particles and Ru NSs formed an aggregate structure together. XPS analyses (Fig. S2 and S3†) gave a higher Pt ratio than EDS and ICP-AES in the cases of Pt/Ru TPs and Pt/Ru CCs, verifying that Pt particles were dispersed on the surface of these Ru NCs, since only few photoelectrons coming from the outermost atomic layers could be detected under experimental conditions. Table S1† lists the ratios of Ru and Pt elements in different valent states calculated from the XPS results. The outmost few layers of Pt and Ru atoms in Pt/Ru NCs are partially oxidized according to Table S1.† Higher levels of oxidation were detected on the surface of Pt particles and Ru NSs, in accordance with the fact that Pt particles and Ru NSs possess a larger specific surface area and a higher concentration of surface defects.29–31
![[thin space (1/6-em)]](https://www.rsc.org/images/entities/char_2009.gif) :
:![[thin space (1/6-em)]](https://www.rsc.org/images/entities/char_2009.gif) Ru obtained from EDS, ICP-AES and XPS analyses for different catalysts
Ru obtained from EDS, ICP-AES and XPS analyses for different catalysts
For the bulk material of Ru, hcp is the thermodynamically stable phase. However, the main diffraction peaks of Ru TPs could be attributed to the fcc phase. The anisotropic morphology of Ru TPs resulted from a large amount of stacking faults.23 The upper and lower surfaces of Ru TPs are (111) facets, the hexagonal closest packed plane. As shown in Fig. 1, most Pt particles are distributed on the upper and lower surfaces of Ru TPs. The smaller plates around Ru TPs in Fig. 1a and b are Ru plates, which came from the Ru TPs sample before Pt deposition (Fig. S1a†). As shown in Fig. 1c, (111) facets of Pt particles, the closest packed plane, are parallel to the (111) facets of Ru TPs, indicating that these Pt particles were deposited epitaxially on the surface of Ru TPs. Furthermore, the lattice mismatch between fcc Pt and fcc Ru is only 2.4%, which means that Pt particles could match the atomic arrangement of Ru TPs at their interface, leading to a strong attachment of Pt particles on Ru TPs. Fig. 1d shows the diameter diagram of Pt particles. The average diameter of Pt particles is 3.1 ± 0.5 nm. Since Ru TPs are well-crystallized and much larger than Pt particles, the main diffraction peaks in the XRD pattern of Pt/Ru TPs come from fcc Ru and the diffraction peaks of fcc Pt are hard to identify (Fig. 4).
Ru CCs are well-crystallized hcp phase NCs. The upper and lower basal surfaces of the CCs are the closest packed (002) facets of hcp Ru and the side surfaces are composed of a series of high index facets. As shown in Fig. 2, Pt particles were deposited on both the basal surface and side surface of Ru CCs. The Pt![[thin space (1/6-em)]](https://www.rsc.org/images/entities/char_2009.gif) :
:![[thin space (1/6-em)]](https://www.rsc.org/images/entities/char_2009.gif) Ru atomic ratios of Pt/Ru TPs and Pt/Ru CCs are similar according to EDS and ICP-AES results, while XPS analysis of Pt/Ru CCs gave a higher Pt ratio, suggesting that Pt particles supported on Ru CCs were more crowded than those supported on Ru TPs. A portion of Pt/Ru CCs nanocomposites tended to assemble spontaneously in a bottom-to-bottom manner (Fig. 2b). Hence, some Pt particles were not accessible to MeOH molecules in MOR tests. The closest packed (111) facets of Pt particles deposited on the basal surface of Ru CCs are parallel to the closest packed (002) facets of Ru CCs, as shown in Fig. 2c, indicating that Pt particles were deposited epitaxially on the basal surface. However, since none of the facets of fcc Pt can match the high index facets of hcp Ru, the crystal directions of Pt particles deposited on the side surface of Ru CCs did not show a definite relationship with that of the Ru substrate, as shown in Fig. 2d. These Pt particles were attached on the side surfaces of Ru CCs with random directions. Therefore, the binding between Pt particles and Ru CCs was weak and these Pt particles were very likely to fall off from the surface of Ru CCs during long-range MOR tests. As shown in Fig. 2e, the average size of Pt particles deposited on Ru CCs is 3.6 ± 0.6 nm, which is larger than for the Pt particles on Ru TPs. Similar to Pt/Ru TPs, the diffraction peaks of Pt particles are too weak to identify compared with those of hcp Ru CCs in the XRD pattern, as shown in Fig. 4.
Ru atomic ratios of Pt/Ru TPs and Pt/Ru CCs are similar according to EDS and ICP-AES results, while XPS analysis of Pt/Ru CCs gave a higher Pt ratio, suggesting that Pt particles supported on Ru CCs were more crowded than those supported on Ru TPs. A portion of Pt/Ru CCs nanocomposites tended to assemble spontaneously in a bottom-to-bottom manner (Fig. 2b). Hence, some Pt particles were not accessible to MeOH molecules in MOR tests. The closest packed (111) facets of Pt particles deposited on the basal surface of Ru CCs are parallel to the closest packed (002) facets of Ru CCs, as shown in Fig. 2c, indicating that Pt particles were deposited epitaxially on the basal surface. However, since none of the facets of fcc Pt can match the high index facets of hcp Ru, the crystal directions of Pt particles deposited on the side surface of Ru CCs did not show a definite relationship with that of the Ru substrate, as shown in Fig. 2d. These Pt particles were attached on the side surfaces of Ru CCs with random directions. Therefore, the binding between Pt particles and Ru CCs was weak and these Pt particles were very likely to fall off from the surface of Ru CCs during long-range MOR tests. As shown in Fig. 2e, the average size of Pt particles deposited on Ru CCs is 3.6 ± 0.6 nm, which is larger than for the Pt particles on Ru TPs. Similar to Pt/Ru TPs, the diffraction peaks of Pt particles are too weak to identify compared with those of hcp Ru CCs in the XRD pattern, as shown in Fig. 4.
Since Ru NSs are much smaller than TPs and CCs, they possess a larger specific surface area, and consequently more Pt particles could be deposited on the same amount of Ru, as indicated by the EDS and ICP-AES results. Interestingly, Ru NSs and Pt particles formed a self-supported network structure in Pt/Ru NSs composites. Plenty of open space exists in this network structure. This structure possesses a high specific surface area, and simultaneously, may increase the stability of the nanocomposites during long range MOR tests. The diffraction peaks of both fcc Pt and hcp Ru can be seen in the XRD pattern of Pt/Ru NSs, as shown in Fig. 4. Since most Ru NSs are poorly-crystallized, as shown in Fig. 3b, the diffraction peaks of hcp Ru are weaker than those of fcc Pt.
Electrocatalytic activity towards MOR
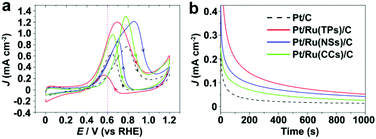
Before electrocatalytic tests, as-prepared Pt/Ru NCs composites were supported on carbon black through ultrasonic treatment. Fig. S5† shows the TEM images of Pt/Ru NCs/C and commercial Pt/C. The average diameter of Pt particles in commercial Pt/C is 3.4 ± 0.9 nm. Stripping of under potential deposited (UPD) hydrogen atoms on Pt surface in 0 to 0.4 V vs. RHE region is usually used to measure the ECSA of Pt based NCs.32–34 However, reduction of the oxide layer of the Ru surface also takes place in this potential region (Fig. S6†). Instead, CO stripping curves were used to measure the ECSA of Pt particles in this work.22,26–28,34 Since in this work monometallic Ru NCs showed no CO stripping signals under the experimental conditions, as shown in Fig. S7,† the ECSA of Pt particles in Pt/Ru NCs/C could be deduced with this method. The specific surface area of Pt particles in Pt/C, Pt/Ru TPs/C, Pt/Ru NSs/C and Pt/Ru CCs/C is 0.645, 0.384, 0.593 and 0.224 cm2·μgPt−1, respectively (calculated from CO stripping and ICP-AES data). Pt/Ru NSs with network structures possess a specific surface area comparable with that of commercial Pt/C. Since Pt/Ru CCs suffer seriously from bottom-to-bottom aggregation, the specific surface area of this kind of composites is the lowest.Fig. 5 shows the CV curves and current–time (i–t) curves (at 0.4 V vs. RHE) of Pt/C and Pt/Ru NCs/C in the electrolyte of 0.1 M HClO4 and 0.1 M MeOH. Since Ru NCs/C exhibited no MOR activity below 1.0 V vs. RHE under experimental conditions (Fig. S8†), MOR only happened on the surface of Pt particle in Pt/Ru NCs/C composites in the region between 0.4 and 1.0 V vs. RHE in this work. As shown in Fig. 5, the MOR activity of Pt particles was enhanced at different levels by introducing Ru TPs, Ru NSs and Ru CCs in Pt/Ru NCs/C composites. The rapid current decays in the i–t curves are caused by the poisoning of Pt-sites on Pt particles by stable intermediates, especially CO. The order of the rate of current decay in the i–t curves is Pt/C > Pt/Ru CCs/C > Pt/Ru NSs/C ≈ Pt/Ru TPs/C.
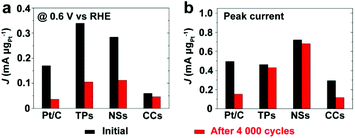
Fig. 6 compares the area specific activity and mass specific activity of Pt/C and Pt/Ru NCs/C composites at 0.6 V vs. RHE and the peak in the forward scan, and Table 2 compares the MOR onset potential and peak potential in the forward scan and the ratio of the peak current of forward and reverse scans (Jp,f/Jp,r) in the CV curves shown in Fig. 5a. Pt/Ru TPs/C possesses the most negative onset potential and highest activity at 0.6 V vs. RHE, followed by Pt/Ru NSs/C. The area specific activity of Pt/Ru CCs/C is similar to that of Pt/C at this potential, but the mass specific activity of Pt/Ru CCs/C is quite low due to the smallest specific surface area. The area specific peak currents of three kinds of Pt/Ru NCs/C are similar and higher than for Pt/C, while Pt/Ru NSs/C possesses higher mass specific activity than the other two kinds of composites due to its larger specific surface area. In addition, the peak in reverse scan of the CV curve is primarily ascribed to the oxidation of residual carbon species, especially adsorbed CO molecules, generated in the forward scan.35–37 Hence, the value of Jp,f/Jp,r can be viewed as an index of the tolerance of a catalyst to poisoning species, i.e. adsorbed CO molecules.38 The order of Jp,f/Jp,r values of different catalysts is Pt/Ru TPs/C > Pt/Ru NSs/C > Pt/Ru CCs/C > Pt/C, suggesting that Ru NCs improved the tolerance to CO of Pt particles, and Pt/Ru TPs/C exhibits the strongest tolerance to CO.
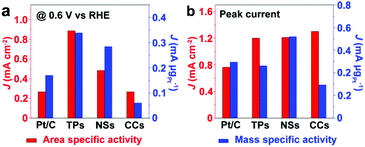 | ||
| Fig. 6 Comparison of the area specific activity and mass specific activity of Pt/C and Pt/Ru NCs/C composites at 0.6 V vs. RHE and at the peak in the forward scan of corresponding CV curves in Fig. 5a. TPs, NSs and CCs in this figure stand for Pt/Ru TPs/C, Pt/Ru NSs/C and Pt/Ru CCs/C, respectively. | ||
| E o,f (V) | E p,f (V) | J p,f/Jp,r | |
|---|---|---|---|
| Pt/C | 0.515 | 0.787 | 1.20 |
| Pt/Ru TPs/C | 0.455 | 0.693 | 4.61 |
| Pt/Ru NSs/C | 0.490 | 0.855 | 1.42 |
| Pt/Ru CCs/C | 0.546 | 0.777 | 1.33 |
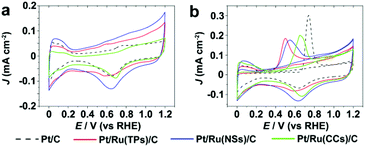
Fig. 7 shows the CV curves in 0.1 M HClO4 and CO stripping curves of Pt/C and Pt/Ru NCs/C composites. As shown in Fig. 7b, the CO stripping peaks of Pt/Ru NCs/C composites shift to negative potential with different levels compared to Pt/C, indicating that Ru NCs weakens CO binding on Pt particles in Pt/Ru NCs/C composites. In particular, Pt/Ru TPs/C possesses a slightly stronger tolerance to CO than Pt/Ru NSs/C and much stronger than Pt/Ru CCs/C. This result agrees with the sequence of current decay rate in the i–t curves in Fig. 5b and Jp,f/Jp,r values in Table 2. To demonstrate that the Pt–Ru interface in Pt/Ru NCs/C was indispensable for the MOR activity enhancement, we conducted CO stripping tests in HClO4 solution and CV tests in HClO4–MeOH solution of the mixed samples of commercial Pt/C and Ru NCs (see ESI† for preparing procedure), as shown in Fig. S9 and S10,† respectively. The CO stripping peaks of the mixture of Pt/C and Ru NCs did not shift to lower potential compared with that of Pt/C. The mixture of Pt/C and Ru NSs exhibited higher MOR activity at 0.6 V vs. RHE compared with Pt/C, but lower than for Pt/Ru NSs/C. This can be attributed to the possibility that Pt particles in Pt/C entered into contact with Ru NSs in the mixing process, leading to the MOR activity enhancement of some Pt particles. The mixture of Pt/C–Ru TPs and Pt/C–Ru CCs did not show a significant MOR activity enhancement at 0.6 V vs. RHE.
In much of the literature, adsorbed CO is considered as a poisoning intermediate for MOR on pure Pt surface. To remove CO from the Pt surface, adsorbed OH species generated from water activation are indispensable. However, a high potential is needed to activate water on the Pt surface. In Pt–Ru catalysts, water activation can occur at lower potential on Ru-sites. Therefore, MOR activity on Pt–Ru catalysts can be enhanced through the bi-functional mechanism summarized as follows19–22:
| Pt* + CH3OH → ⋯ → PtCOads + 4H+ + 4e− | (1) |
| Ru* + H2O → RuOHads + H+ + e− | (2) |
| PtCOads + RuOHads → CO2 + Pt* + Ru* + H+ + e− | (3) |
The third step of this mechanism can only happen on adjacent Pt–Ru sites, called ‘hot spots’ here. Hence, CO species adsorbed on Pt and OH species adsorbed on Ru need to slide to these sites first before the third step. Structures with a high proportion of adjacent Pt–Ru sites with short Pt–Ru distance should display high MOR activity.
Pt/Ru NSs/C can outperform Pt/Ru CCs/C with a higher MOR specific activity at 0.6 V vs. RHE and stronger tolerance to CO. This can be ascribed to the higher level of dispersion of Pt particles in the self-supported network structure of Pt/Ru NSs/C composites, which produces a higher density of ‘hot spots’. However, Pt/Ru TPs/C exhibits highest MOR activity at 0.6 V vs. RHE and strongest tolerance to CO, suggesting that epitaxially deposited Pt particles on the closest packed Ru facets are a structure that significantly benefits removal of adsorbed CO. The distance between the Pt atom and the adjacent Ru atom at the interface of the Pt particles and Ru TPs is approximately equal to the nearest distance between the same atoms in each part (Scheme 2a). Thus, all sites at the boundary of the interface can serve as ‘hot spots’ for CO removal. A portion of Pt particles in Pt/Ru CCs/C composites were also deposited on the closest packed facets of Ru CCs, i.e. two basal surfaces, but a lot of these Pt particles are inaccessible because of the bottom-to-bottom aggregation of Pt/Ru CCs composites. When Pt particles are deposited with random crystal direction on the side surface of Ru CCs, the interfaces between the two domains are not matched in the level of atomic arrangement. Consequently, for a large amount of Pt–Ru sites at the boundary of this kind of interface, the Pt–Ru distance is significantly larger than the nearest distance between the same atoms in each domain (Scheme 2b). These Pt–Ru sites may not be active enough to serve as ‘hot spots’ due to the large Pt–Ru distance. Therefore, Pt/Ru CCs/C exhibit weaker tolerance to CO and lower specific MOR activity at 0.6 V vs. RHE compared with Pt/Ru TPs/C.
 | ||
| Scheme 2 Schematic structures of Pt particles deposited on (a) matched closest packed surface and (b) unmatched high-index surface of Ru. | ||
Stability of Pt/Ru NCs/C as catalysts for MOR
To test the stability of Pt/Ru NCs/C composites, the catalysts were submitted to 4000 cycles of voltage scan between 0 and 1.2 V vs. RHE in the electrolyte of 0.1 M HClO4 and 0.1 M MeOH. Table 3 lists the Pt![[thin space (1/6-em)]](https://www.rsc.org/images/entities/char_2009.gif) :
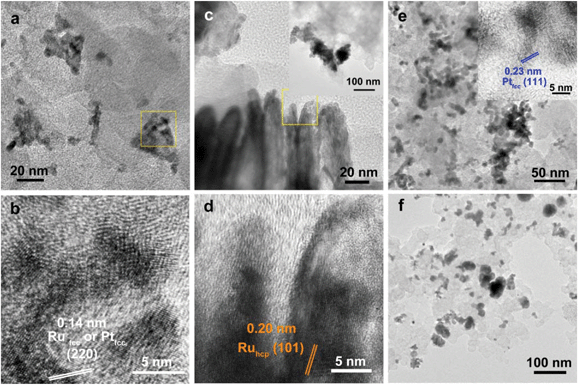
:![[thin space (1/6-em)]](https://www.rsc.org/images/entities/char_2009.gif) Ru molar ratio and the loss of ECSA of Pt of Pt/Ru NCs and Pt/C after the voltage scan. As indicated by the EDS data in Table 3, part of Ru was dissolved during the voltage scan. As expected, the proportion of dissolved Ru was highest in the case of Pt/Ru NSs/C and lowest in the case of Pt/Ru CCs/C, since the specific surface areas of Ru NCs are in the order of Ru NSs > Ru TPs > Ru CCs. Fig. 8a and b show the TEM and HRTEM images of Pt/Ru TPs/C after the voltage scan. Although part of Ru was dissolved, most Pt particles were still attached on the surfaces of the Ru TPs. Dark regions on the TPs can be attributed to Pt islands generated from the merge of Pt particles deposited on the Ru TPs. These Pt islands are larger than the Pt particles in the initial Pt/Ru TPs/C catalyst, but much smaller than the Pt agglomerates in commercial Pt/C after voltage scan, as shown in Fig. 8f, indicating that, compared with carbon black, the upper and lower surface of Ru TPs can stabilize Pt particles against agglomeration. Lattice fringes of fcc Pt and Ru can be clearly seen in Fig. 8b, despite the fact that the existence of carbon black would blur the image of Pt/Ru TPs composites, suggesting the crystallinity of the composites increased after the voltage scan. Fig. 8c and d show the TEM and HRTEM images of Pt/Ru CCs/C after the voltage scan. Dark and light regions can also be seen on the side surfaces of Ru CCs. However, the lattice fringes in the HRTEM image are in good accordance with the structure of hcp Ru and cannot match the structure of fcc Pt, suggesting that most Pt particles fell off the side surface of Ru CCs during the voltage scan. The contrast changes in the TEM and HRTEM images may be caused by the irregular morphology Ru CCs after the dissolution and recrystallization process during the voltage scan. Fig. 8e and the inset show the TEM and HRTEM image of Pt/Ru NSs/C after voltage scan. The self-supported network structure OF Pt/Ru NSs composites was retained, and simultaneously the crystallinity was increased. The loss ratios of ECSA of different catalysts are in the order Pt/Ru NSs/C < Pt/Ru TPs/C < Pt/Ru CCs/C < Pt/C, as listed in Table 3. Ru NSs and TPs could stabilize the Pt particles deposited on them during the voltage scan compared with Ru CCs and carbon black. The adhesion between Pt and graphite-type carbon black is much smaller than that between Pt and metal.39 Similarly, Pt particles cannot be deposited firmly on the side surface of Ru CCs due to the atomic arrangement mismatch at their interface. Therefore, Pt particles are likely to aggregate or fall off carbon black or the side surface of Ru CCs during the voltage scan. On the contrary, Pt/Ru TPs/C lost less ECSA, suggesting that Pt particles are deposited more firmly on the closest packed surface of Ru than on high-index facets. Most ECSA was retained in the case of Pt/Ru NSs/C, indicating that the self-supported network structure of Pt/Ru NSs is quite stable during the voltage scan cycles.
Ru molar ratio and the loss of ECSA of Pt of Pt/Ru NCs and Pt/C after the voltage scan. As indicated by the EDS data in Table 3, part of Ru was dissolved during the voltage scan. As expected, the proportion of dissolved Ru was highest in the case of Pt/Ru NSs/C and lowest in the case of Pt/Ru CCs/C, since the specific surface areas of Ru NCs are in the order of Ru NSs > Ru TPs > Ru CCs. Fig. 8a and b show the TEM and HRTEM images of Pt/Ru TPs/C after the voltage scan. Although part of Ru was dissolved, most Pt particles were still attached on the surfaces of the Ru TPs. Dark regions on the TPs can be attributed to Pt islands generated from the merge of Pt particles deposited on the Ru TPs. These Pt islands are larger than the Pt particles in the initial Pt/Ru TPs/C catalyst, but much smaller than the Pt agglomerates in commercial Pt/C after voltage scan, as shown in Fig. 8f, indicating that, compared with carbon black, the upper and lower surface of Ru TPs can stabilize Pt particles against agglomeration. Lattice fringes of fcc Pt and Ru can be clearly seen in Fig. 8b, despite the fact that the existence of carbon black would blur the image of Pt/Ru TPs composites, suggesting the crystallinity of the composites increased after the voltage scan. Fig. 8c and d show the TEM and HRTEM images of Pt/Ru CCs/C after the voltage scan. Dark and light regions can also be seen on the side surfaces of Ru CCs. However, the lattice fringes in the HRTEM image are in good accordance with the structure of hcp Ru and cannot match the structure of fcc Pt, suggesting that most Pt particles fell off the side surface of Ru CCs during the voltage scan. The contrast changes in the TEM and HRTEM images may be caused by the irregular morphology Ru CCs after the dissolution and recrystallization process during the voltage scan. Fig. 8e and the inset show the TEM and HRTEM image of Pt/Ru NSs/C after voltage scan. The self-supported network structure OF Pt/Ru NSs composites was retained, and simultaneously the crystallinity was increased. The loss ratios of ECSA of different catalysts are in the order Pt/Ru NSs/C < Pt/Ru TPs/C < Pt/Ru CCs/C < Pt/C, as listed in Table 3. Ru NSs and TPs could stabilize the Pt particles deposited on them during the voltage scan compared with Ru CCs and carbon black. The adhesion between Pt and graphite-type carbon black is much smaller than that between Pt and metal.39 Similarly, Pt particles cannot be deposited firmly on the side surface of Ru CCs due to the atomic arrangement mismatch at their interface. Therefore, Pt particles are likely to aggregate or fall off carbon black or the side surface of Ru CCs during the voltage scan. On the contrary, Pt/Ru TPs/C lost less ECSA, suggesting that Pt particles are deposited more firmly on the closest packed surface of Ru than on high-index facets. Most ECSA was retained in the case of Pt/Ru NSs/C, indicating that the self-supported network structure of Pt/Ru NSs is quite stable during the voltage scan cycles.
![[thin space (1/6-em)]](https://www.rsc.org/images/entities/char_2009.gif) :
:![[thin space (1/6-em)]](https://www.rsc.org/images/entities/char_2009.gif) Ru and ECSA of Pt of different catalysts after 4000 cycles of voltage scan in HClO4–MeOH mixed solution
Ru and ECSA of Pt of different catalysts after 4000 cycles of voltage scan in HClO4–MeOH mixed solution
Fig. 9 and S13† compare the mass specific activity of different catalysts before and after 4000 cycles of voltage scan. MOR activity dropped dramatically on Pt/C and Pt/Ru CCs/C because of their substantial loss in ECSA. Pt/Ru TPs/C and Pt/Ru NSs/C kept most MOR activity at the peak of the forward scan. However, for these two kinds of catalysts, the peaks of MOR in the forward scan shifted to significantly higher potential, accompanied by dramatic loss of MOR activity at 0.6 V vs. RHE, a decrease in Jp,f/Jp,r value and positive shift of CO stripping peaks (Fig. S12†), indicating that the tolerance to CO of Pt particles deposited on Ru TPs and Ru NSs weakened during the 4000 cycles of voltage scan. On one hand, Ru NCs were gradually dissolved during the voltage scans. On the other hand, Pt particles may spread and merge with nearby Pt particles on the surface of Ru TPs and NSs, although Pt particles were comparatively firmly anchored on the surface of these Ru NCs. This would not lead to a serious loss in surface area of Pt, but would decrease the proportion of ‘hot spots’ among total Pt-sites on the surface, since only Pt sites on the boundaries of Pt islands could serve as ‘hot spots’. It is noteworthy that Pt/Ru TPs and Pt/Ru NSs still retained most of the peak current in the forward scan in spite of the decreased tolerance to CO. We attribute this observation to the increasing of crystallization level of Pt particles of Pt/Ru TPs and Pt/Ru NSs during the 4000 cycles of potential scans. Better crystallized Pt based NCs exhibit higher electrocatalytic activity in many cases.34,40 This may compensate part of the activity loss caused by the decreased tolerance to CO.
Conclusion
Pt particles were deposited on a series of Ru NCs with different surface structures, including TPs, CCs and NSs, through an aqueous adsorption–reduction approach. All kinds of Ru NCs enhanced the catalytic activity of Pt particles towards MOR, but these nanocomposites still exhibited dramatically different catalytic activity and stability. For Pt/Ru TPs/C composites, Pt particles were deposited epitaxially on the closest packed facet of Ru, forming a well matched interface between Pt and Ru. For Pt/Ru CCs/C composites, part of the Pt particles were deposited on the closest packed basal surface of Ru CCs, but a large portion of these Pt particles were inaccessible because of segregation. Other Pt particles were on a series of high index facets of hcp Ru, which could not form matched interface with fcc Pt. Pt/Ru TPs/C exhibited much higher MOR activity and stability than Pt/Ru CCs/C, indicating that matched interface between Pt particles and closest packed Ru facet was crucial for the improvement of MOR activity and stability. Pt particles and Ru NSs formed self-supported network structures in Pt/Ru NSs/C composites, which could also significantly improve the MOR activity and stability of Pt particles. Considering that growing attention in the field of catalytic chemistry and nanocatalysis is being given to the effect of supports, we believe that this work not only demonstrates how the surface structure of the metal substrate influences the catalytic performance of the catalysts supported on the metal surface by using metal NCs with specific morphologies as substrates, but this kind of methodology can also be introduced to study the support effect in other kinds of supported catalysts.Acknowledgements
This work was supported by the NSFC (grant no. 21025101, 21271011, and 21321001). Y.W.Z. particularly appreciates the financial aid of China National Funds for Distinguished Young Scientists from the NSFC.Notes and references
- K. M. Bratlie, H. Lee, K. Komvopoulos, P. Yang and G. A. Somorjai, Nano Lett., 2007, 7, 3097 CrossRef CAS PubMed.
- J. Gu, Y.-W. Zhang and F. Tao, Chem. Soc. Rev., 2012, 41, 8050 RSC.
- R. Subbaraman, D. Tripkovic, D. Strmcnik, K.-C. Chang, M. Uchimura, A. P. Paulikas, V. Stamenkovic and N. M. Markovic, Science, 2011, 334, 1256 CrossRef CAS PubMed.
- R. Subbaraman, D. Tripkovic, K.-C. Chang, D. Strmcnik, A. P. Paulikas, P. Hirunsit, M. Chan, J. Greeley, V. Stamenkovic and N. M. Markovic, Nat. Mater., 2012, 11, 550 CrossRef CAS PubMed.
- R. R. Adzic, J. Zhang, K. Sasaki, M. B. Vukmirovic, M. Shao, J. X. Wang, A. U. Nilekar, M. Mavrikakis, J. A. Valerio and F. Uribe, Top. Catal., 2007, 46, 249 CrossRef CAS.
- L. Yang, M. B. Vukmirovic, D. Su, K. Sasaki, J. A. Herron, M. Mavrikakis, S. Liao and R. R. Adzic, J. Phys. Chem. C, 2012, 117, 1748 Search PubMed.
- Q. Fu, W.-X. Li, Y. Yao, H. Liu, H.-Y. Su, D. Ma, X.-K. Gu, L. Chen, Z. Wang, H. Zhang, B. Wang and X. Bao, Science, 2010, 328, 1141 CrossRef CAS PubMed.
- M. Chen, D. Kumar, C.-W. Yi and D. W. Goodman, Science, 2005, 310, 291 CrossRef CAS PubMed.
- X. Guo, Q. Fu, Y. Ning, M. Wei, M. Li, S. Zhang, Z. Jiang and X. Bao, J. Am. Chem. Soc., 2012, 134, 12350 CrossRef CAS PubMed.
- Y. Yao, Q. Fu, Z. Wang, D. Tan and X. Bao, J. Phys. Chem. C, 2010, 114, 17069 CAS.
- J. Zhang, Y. Mo, M. B. Vukmirovic, R. Klie, K. Sasaki and R. R. Adzic, J. Phys. Chem. B, 2004, 108, 10955 CrossRef CAS.
- P. Ferrin and M. Mavrikakis, J. Am. Chem. Soc., 2009, 131, 14381 CrossRef CAS PubMed.
- S. Jones, K. Tedsree, M. Sawangphruk, J. S. Foord, J. Fisher, D. Thompsett and S. C. E. Tsang, ChemCatChem, 2010, 2, 1089 CrossRef CAS.
- Z. Liu, E. T. Ada, M. Shamsuzzoha, G. B. Thompson and D. E. Nikles, Chem. Mater., 2006, 18, 4946 CrossRef CAS.
- H. Ataee-Esfahani, Y. Nemoto, M. Imura and Y. Yamauchi, Chem.–Asian J., 2012, 7, 876 CrossRef CAS PubMed.
- H. Ataee-Esfahani, J. Liu, M. Hu, N. Niyamoto, S. Tominaka, K. C. W. Wu and Y. Yamauchi, Small, 2013, 9, 1047 CrossRef CAS PubMed.
- H. Zhang, M. Imura, Y. Nemoto, L. Wang, H. Y. Jeong, T. Yokoshima, O. Terasaki and Y. Yamauchi, Chem.–Eur. J., 2012, 18, 13142 CrossRef PubMed.
- P. Karthika, H. Ataee-Esfahani, H. Wang, M. A. Francis, H. Abe, N. Rayalakshmi, K. S. Dhathathreyan, D. Arivuoli and Y. Yamauchi, Chem.–Asian J., 2013, 8, 902 CrossRef CAS PubMed.
- O. Petrii, J. Solid State Electrochem., 2008, 12, 609 CrossRef CAS PubMed.
- H. Liu, C. Song, L. Zhang, J. Zhang, H. Wang and D. P. Wilkinson, J. Power Sources, 2006, 155, 95 CrossRef CAS PubMed.
- Z. Jusys, J. Kaiser and R. J. Behm, Electrochim. Acta, 2002, 47, 3693 CrossRef CAS.
- H. N. Dinh, X. Ren, F. H. Garzon, Z. Piotr and S. Gottesfeld, J. Electroanal. Chem., 2000, 491, 222 CrossRef CAS.
- A.-X. Yin, W.-C. Liu, J. Ke, W. Zhu, J. Gu, Y.-W. Zhang and C.-H. Yan, J. Am. Chem. Soc., 2012, 134, 20479 CrossRef CAS PubMed.
- J. Watt, C. Yu, S. L. Y. Chang, S. Cheong and R. D. Tilley, J. Am. Chem. Soc., 2012, 135, 606 CrossRef PubMed.
- K. Kusada, H. Kobayashi, T. Yamamoto, S. Matsumura, N. Sumi, K. Sato, K. Nagaoka, Y. Kubota and H. Kitagawa, J. Am. Chem. Soc., 2013, 135, 5493 CrossRef CAS PubMed.
- H. A. Gasteiger, N. Markovic, P. N. Ross and E. J. Cairns, J. Phys. Chem., 1994, 98, 617 CrossRef CAS.
- M. Arenz, K. J. J. Mayrhofer, V. Stamenkovic, B. B. Blizanac, T. Tomoyuki, P. N. Ross and N. M. Markovic, J. Am. Chem. Soc., 2005, 127, 6819 CrossRef CAS PubMed.
- F. Maillard, M. Eikerling, O. V. Cherstiouk, S. Schreier, E. Savinova and U. Stimming, Faraday Discuss., 2004, 125, 357 RSC.
- R. Kötz, H. J. Lewerenz and S. Stucki, J. Electrochem. Soc., 1983, 130, 825 CrossRef PubMed.
- A. K. Shukla, M. K. Ravikumar, A. Roy, S. R. Barman, D. D. Sarma, A. S. Aricò, V. Antonucci, L. Pino and N. Giordano, J. Electrochem. Soc., 1994, 141, 1517 CrossRef PubMed.
- Z. Liu, J. Y. Lee, M. Han, W. Chen and L. M. Gan, J. Mater. Chem., 2002, 12, 2453 RSC.
- A.-X. Yin, X.-Q. Min, W. Zhu, W.-C. Liu, Y.-W. Zhang and C.-H. Yan, Chem.–Eur. J., 2012, 18, 777 CrossRef CAS PubMed.
- A.-X. Yin, X.-Q. Min, Y.-W. Zhang and C.-H. Yan, J. Am. Chem. Soc., 2011, 133, 3816 CrossRef CAS PubMed.
- C. Wang, M. Chi, D. Li, D. Strmcnik, D. van der Vliet, G. Wang, V. Komanicky, K.-C. Chang, A. P. Paulikas, D. Tripkovic, J. Pearson, K. L. More, N. M. Markovic and V. R. Stamenkovic, J. Am. Chem. Soc., 2011, 133, 14396 CrossRef CAS PubMed.
- Z. Liu, X. Y. Ling, X. Su and J. Y. Lee, J. Phys. Chem. B, 2004, 108, 8234 CrossRef CAS.
- T. Yajima, H. Uchida and M. Watanabe, J. Phys. Chem. B, 2004, 108, 2654 CrossRef CAS.
- Y. Zhu, H. Uchida, T. Yajima and M. Watanabe, Langmuir, 2000, 17, 146 CrossRef.
- Y. Mu, H. Liang, J. Hu, L. Jiang and L. Wan, J. Phys. Chem. B, 2005, 109, 22212 CrossRef CAS PubMed.
- M. Shafiei, A. R. Riahi, F. G. Sen and A. T. Alpas, Surf. Coat. Technol., 2010, 205, 306 CrossRef CAS PubMed.
- C. Wang, G. Wang, D. v. d. Wliet, K.-C. Chang, N. M. Markovic and V. R. Stamenkovic, Phys. Chem. Chem. Phys., 2010, 12, 6933 RSC.
Footnote |
| † Electronic supplementary information (ESI) available: TEM images of Ru NCs and carbon supported catalysts, spectra of EDS and XPS, electrochemical tests of Ru NCs/C and CO stripping curves of catalysts after stability test. See DOI: 10.1039/c3qi00053b |
| This journal is © the Partner Organisations 2014 |

