 Open Access Article
 This Open Access Article is licensed under a Creative Commons Attribution-Non Commercial 3.0 Unported Licence
Halogen⋯halogen contra C–H⋯halogen interactions†
Marcin
Podsiadło
,
Anna
Olejniczak
and
Andrzej
Katrusiak
*
Faculty of Chemistry, Adam Mickiewicz University, Umultowska 89b, 61-614 Poznań, Poland. E-mail: katran@amu.edu.pl; Fax: +48 61 8291555; Tel: +48 61 8291590
First published on 9th June 2014
Abstract
Pressure affects the competition between C–H⋯X hydrogen bonds and X⋯X halogen⋯halogen interactions. In bromomethane, CH3Br, pressure changes the molecular arrangement of the two solid-state phases of this compound: low-pressure phase α is dominated by halogen⋯halogen interactions, whereas above 1.5 GPa the β phase is governed by C–H⋯halogen bonds. The CH3Br phase α is isostructural with solid CH3I of orthorhombic space group Pnma, while CH3Br phase β is polar, isostructural with CH3Cl and CH3CN crystals, of orthorhombic space group Cmc21. The crystal structures of CH3Cl (b.p. = 249.1 K) and CH3Br (b.p. = 276.7 K) have been determined by high pressure single-crystal X-ray diffraction up to 4.38 GPa and 2.85 GPa, respectively. In CH3Br, pressure of 1.5 GPa enforces the close packing and opposite electrostatic-potential matching between molecular surfaces in contact. The interweaved C–H⋯X bonded diamondoid networks of β-CH3X are similar to those of acetonitrile, H2O ice VII and solidified X2 halogens. The phase diagrams of CH3Br and CH3Cl have been constructed.
Introduction
The molecular arrangement in crystals is most often associated either with Kitaigorodski's close packing rule or with specific intermolecular interactions, such as OH⋯O hydrogen bonds in H2O ice. Even weak specific interactions, such as halogen⋯halogen,1,2 halogen⋯O3–5 and CH⋯O contacts,6 can compete between themselves7,8 and with the close packing rule.9 Members of the group of halomethanes (CH3X, X = Cl, Br, I) are the simplest organic polar compounds and ideal models for studying weak halogen⋯halogen and C–H⋯halogen interactions. In many molecular crystals without strong hydrogen bonds the X⋯X and C–H⋯X interactions dominate the molecular arrangement and are the shortest intermolecular contacts in the crystal structure.10 Pressure can considerably modify the intermolecular interactions in crystals. It was evidenced that weak hydrogen bonds CH⋯O11–13 and CH⋯N14 significantly increase their role in high-pressure structures. For example, formamide15 and (+)-sucrose16 transform at high pressure as a result of the increased role of CH⋯O interactions, in sucrose competing with OH⋯O bonds. The competition between halogen⋯halogen and C–H⋯halogen interactions was studied for a series of six dihalomethanes CH2XY (X, Y = Cl, Br, I). They crystallize in several structural types of space group Pbcn (CH2Cl2, CH2BrCl phase II), C2/c (CH2Br2, CH2I2 phase I, CH2BrCl phase I, CH2BrI), Pnma (CH2ClI phase III), Pna21 (CH2ClI phase IV) and Fmm2 (CH2I2 phase II).17–22 In all of these compounds and their polymorphs, halogen⋯halogen interactions persist despite considerable structural differences. However, the persistence of halogen⋯halogen contacts in dihalomethanes can be due to the geometric effect of at least two-thirds of the molecular surface (for CH2Cl2) belonging to the halogen atoms. In these structures, even if other contacts are preferred and formed, the halogen⋯halogen contacts would be formed simply for there is no other molecular surface available. In methyl halides, of general formula CH3X, there is one halogen atom per molecule (hence its molecular surface is smaller than those of CH2X2 and CHCl3) and the competition between C–H⋯X and X⋯X interactions is more apparent. Therefore we have studied the structures of methyl halides in order to determine the effect of pressure on X⋯X and H⋯X interactions. CH3Cl and CH3Br are gases under normal conditions, which required that a special technique be developed and employed for loading these gases into the diamond-anvil cell (DAC).The low-temperature/ambient-pressure CH3Br and CH3I crystals are isostructural, of the orthorhombic space group Pnma,23,24 while the CH3Cl crystal has a different structure, of the orthorhombic space group Cmc21.25 At room temperature the Pnma-symmetric CH3I structure is stable up to at least 2.5 GPa.26 No polymorphs or phase transitions were detected in CH3Cl and CH3I at low temperature, while calorimetric measurements indicated that CH3Br undergoes a first-order phase transition at 173.75 K.27 The Raman and far infrared spectra showed that the deuterated analogue, CD3Br, transforms at 158 K, about 16 K below the transition of CH3Br.28 The crystal structures of CD3Br in both its phases were determined by neutron powder diffraction at 175 K and 146 K.29 We have presently established that in that study the high- and low-temperature phases were confused. Initially, the sample had been kinetically flash-frozen and cryo-ground in the temperature and atmosphere of liquid nitrogen. In accordance with Ostwald's rule the sample crystallized in the high-temperature phase α and at 146 K it was metastable throughout data collection. This α-phase determined at 146 K was of the orthorhombic space group Pnma. Then the sample had transformed to the low-temperature β phase before it was warmed to 175 K, i.e. 17 K above the transition temperature of CD3Br at 158 K. Again, the β phase remained metastable under these conditions for the duration of powder data collection at least. Thus incidently at higher temperature the crystal structure of low-temperature phase β was determined. This β-phase is of the orthorhombic space group Cmc21. Consequently, in that previous study the persistence of crystal phases in their metastable regions caused the reversed assignment of high- and low -temperature phases α and β, respectively.29
The phase diagrams of CH3Br and CH3Cl presently outlined in our study are shown in Fig. 1. These phase diagrams of CH3Cl and CH3Br have similar melting and boiling boundaries, shifting slightly toward lower temperature and higher pressure for CH3Cl. In this respect, the transition of CH3Br between solid phase α, isostructural with the crystal of CH3I, and phase β, isostructural with CH3Cl, is particularly intriguing. The crystal structure of perdeutered methyl fluoride, CD3F, determined by neutron powder diffraction at 5 K, is of the monoclinic space group P21/n and is distinctly different from other methyl halides.30 Presently, we have extended the structural relationship and phase diagrams of CH3Cl and CH3Br into the high-pressure region (Fig. 1) and investigated the role of X⋯X and C–H⋯X interactions in the CH3X structures and CH3Br transformations.
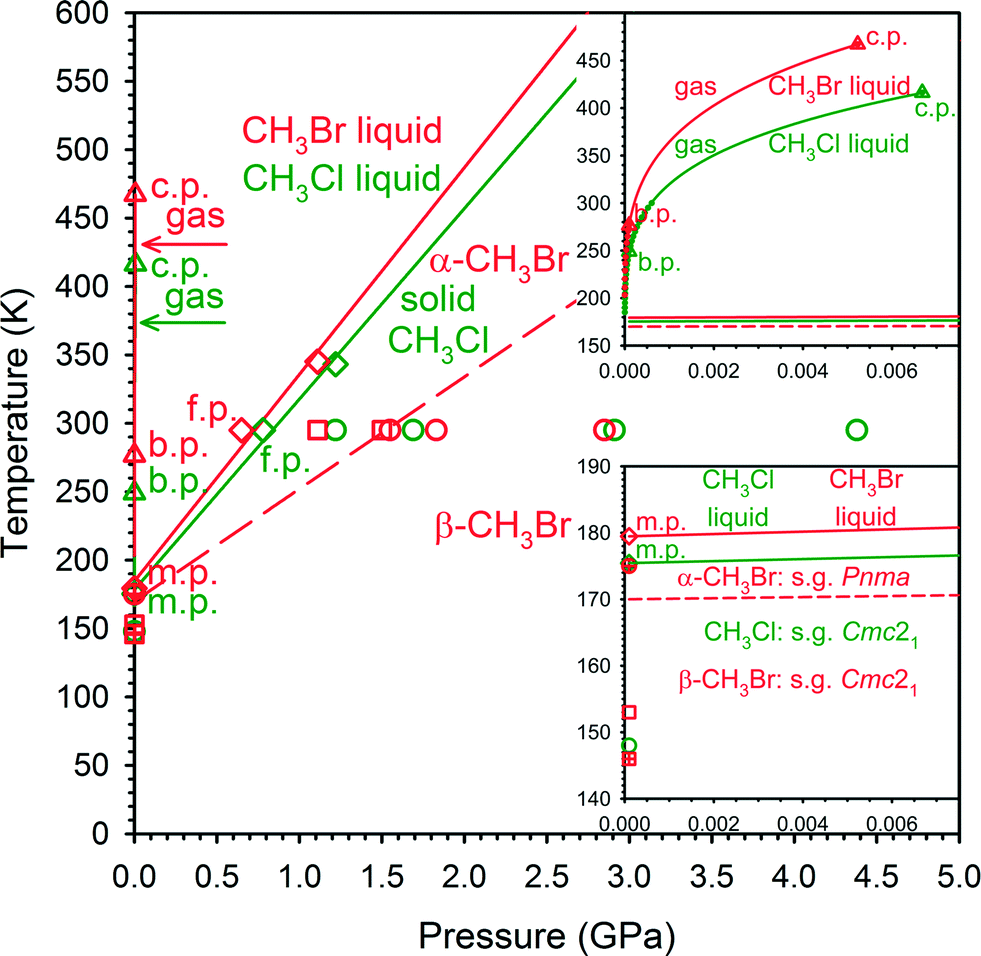 | ||
| Fig. 1 Phase diagrams of CH3Cl (green) and CH3Br (red) superimposed for convenient comparison (they are shown separately in Fig. S10 of the ESI†). The boiling points at 0.1 MPa (249.1 and 276.7 K; b.p.), melting points at 0.1 MPa (175.5 and 179.5 K; m.p.) and the critical points (c.p. 6.68 MPa/416.3 K and 5.23 MPa/467.2 K) from ref. 27 and 48; the freezing points (f.p.) at 295 K from our DAC experiment; the freezing lines obtained from the m.p. at 0.1 MPa, f.p. at 0.78 GPa/295 K and 0.65 GPa/295 K and from melting points at 1.22 GPa and 1.11 GPa (our optical observations of CH3Cl and CH3Br melting in the DAC – spectroscopic pressure calibration and temperature measured by a thermocouple attached to one diamond anvil); diffractometric determinations of CH3Cl (green circles), CH3Br phase α (red squares), CH3Br phase β (red circles), CD3Br phase α (red square crossed) and CD3Br phase β (red circle crossed). The red dashed line shows the solid–solid boundary between phases α-CH3Br and β-CH3Br. The magnified gas–liquid region is shown in the upper inset: the experimental vapour–pressure data (green and red circles after ref. 27 and 48) and the gas–liquid boundary extrapolation (green and red lines); the enhanced liquid–solid region is shown in the lower inset. Note that the boiling point lines were determined below 0.1 MPa, however, short of reaching the triple points. | ||
Experimental
Chloromethane, CH3Cl (m.p. 175.5 K, b.p. 249.1 K), and bromomethane, CH3Br (m.p. 179.5 K, b.p. 276.7 K), of 99.5% purity from Sigma-Aldrich were used. For high-pressure studies they were loaded into a modified Merrill–Bassett31 diamond-anvil cell (DAC) by combining compression and cryogenic conditions and in situ crystallized. At 295 K, CH3Cl froze at 0.78 GPa and CH3Br at 0.65 GPa in the form of a polycrystalline mass, filling the whole volume of the high-pressure chamber. The single crystals of CH3Cl and CH3Br (Fig. 2) were obtained under isochoric conditions: the DAC with the polycrystalline mass was heated with a hot-air gun till all but one grain melted. Then the DAC was slowly cooled to room temperature and the single crystal grew and eventually filled the entire volume of the chamber. The experimental details and progress of growing the single crystals of CH3Cl are shown in Fig. S1–S4† and of CH3Br in S5–S9 in the ESI.†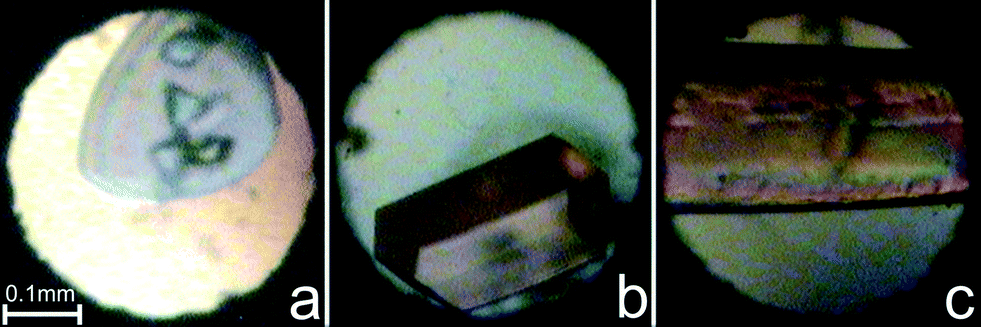 | ||
| Fig. 2 Single-crystal samples in the diamond-anvil cell: (a) CH3Cl at 4.38 GPa/483 K; (b) CH3Br phase α at 1.11 GPa/345 K; and (c) CH3Br phase β at 1.55 GPa/379 K. | ||
Diffraction data were collected at 295 K using a KUMA KM4-CCD diffractometer with graphite-monochromated MoKα radiation.32 The CrysAlisCCD and CrysAlisRED programs33 were used for the data collection and determination of the UB matrix and for the initial data reduction and Lp corrections for both compounds. The intensity of reflections has been accounted for by the absorption of X-rays by the DAC, sample shadowing by the gasket, and absorption of the sample crystal itself.34,35 The crystal structures of CH3Cl and CH3Br were solved by direct methods. H atoms were located from molecular geometry, in α-CH3Br the disordered model was applied (Shelxl instruction AFIX 137),36 and the structures were refined with anisotropic C and X atoms. Details of the experiments, structure refinements and crystal data are given in the ESI.†
The program GAUSSIAN0337 and a PC were used with the B3LYP/3-21G** level of theory for DFT calculations of the electrostatic potential on the surface of CH3X molecules. Electrostatic potential was mapped onto the molecular surfaces defined as 0.001 a.u. electron-density envelope.38
Discussion
Isobaric and isothermal freezing of halomethanes CH3X leads to the same crystalline phases.23–25 At 295 K, CH3Cl and CH3I crystallize at 0.78 and 0.41 GPa, respectively, in their low-temperature/0.1 MPa phases of CH3Cl and CH3I and they are stable within the investigated pressure range. At 295 K, CH3Br freezes at 0.65 GPa in phase α (space group Pnma) and at 1.50 GPa it transforms to phase β (space group Cmc21). At this transition the unit-cell volume decreases by −4.7 Å3 (−1.9%) (Fig. 3).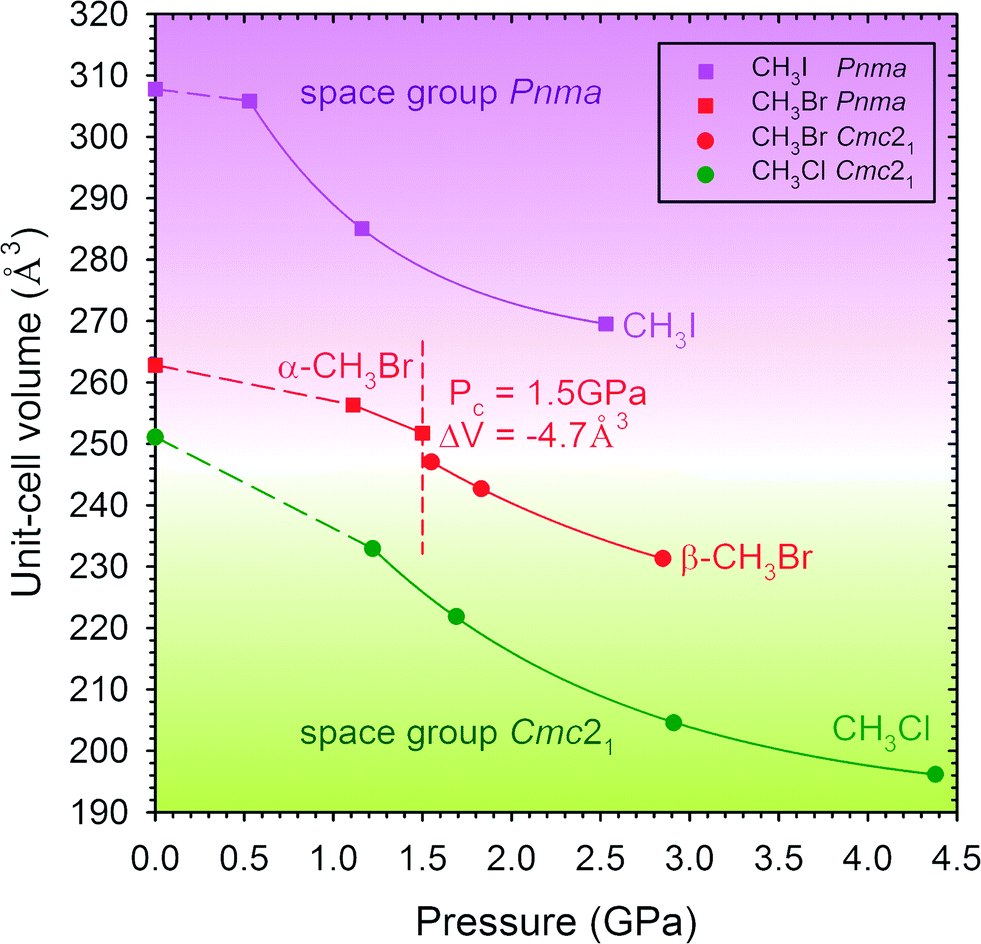 | ||
| Fig. 3 The molecular volume (unit cell V) as a function of pressure of CH3Cl (green), CH3Br (red) and CH3I (purple). Symmetry Cmc21 is indicated by circles and Pnma by squares. The red dashed vertical line marks the transition between CH3Br phases α and β. Low temperature/0.1 MPa data from ref. 23–25; 295 K/high pressure data of CH3I from ref. 26. The dashed lines between the low-temperature/0.1 MPa and 295 K/high-pressure points are for guiding the eye only. | ||
Two main molecular-association types conform to the opposite electrostatic-potential matching principle.22 In CH3X molecules the negative electrostatic potential (Fig. 4) is on the rim about the C–X bond, the more positive potential region is on the “caps” of the X atom at the extension of the C–X bond and the highest potential is around the H-atoms. The electrostatic potential magnitude and the area at the extension of C–X bonds increase from F to I (Fig. 4). Based on the electrostatic-potential magnitudes (Fig. 4), the halogen⋯halogen interactions in CH3I are stronger than those in CH3Br and those in CH3Cl are still weaker. Indeed, the CH3I structure is governed by I⋯I contacts,26 and no Cl⋯Cl but C–H⋯Cl contacts are formed in CH3Cl.
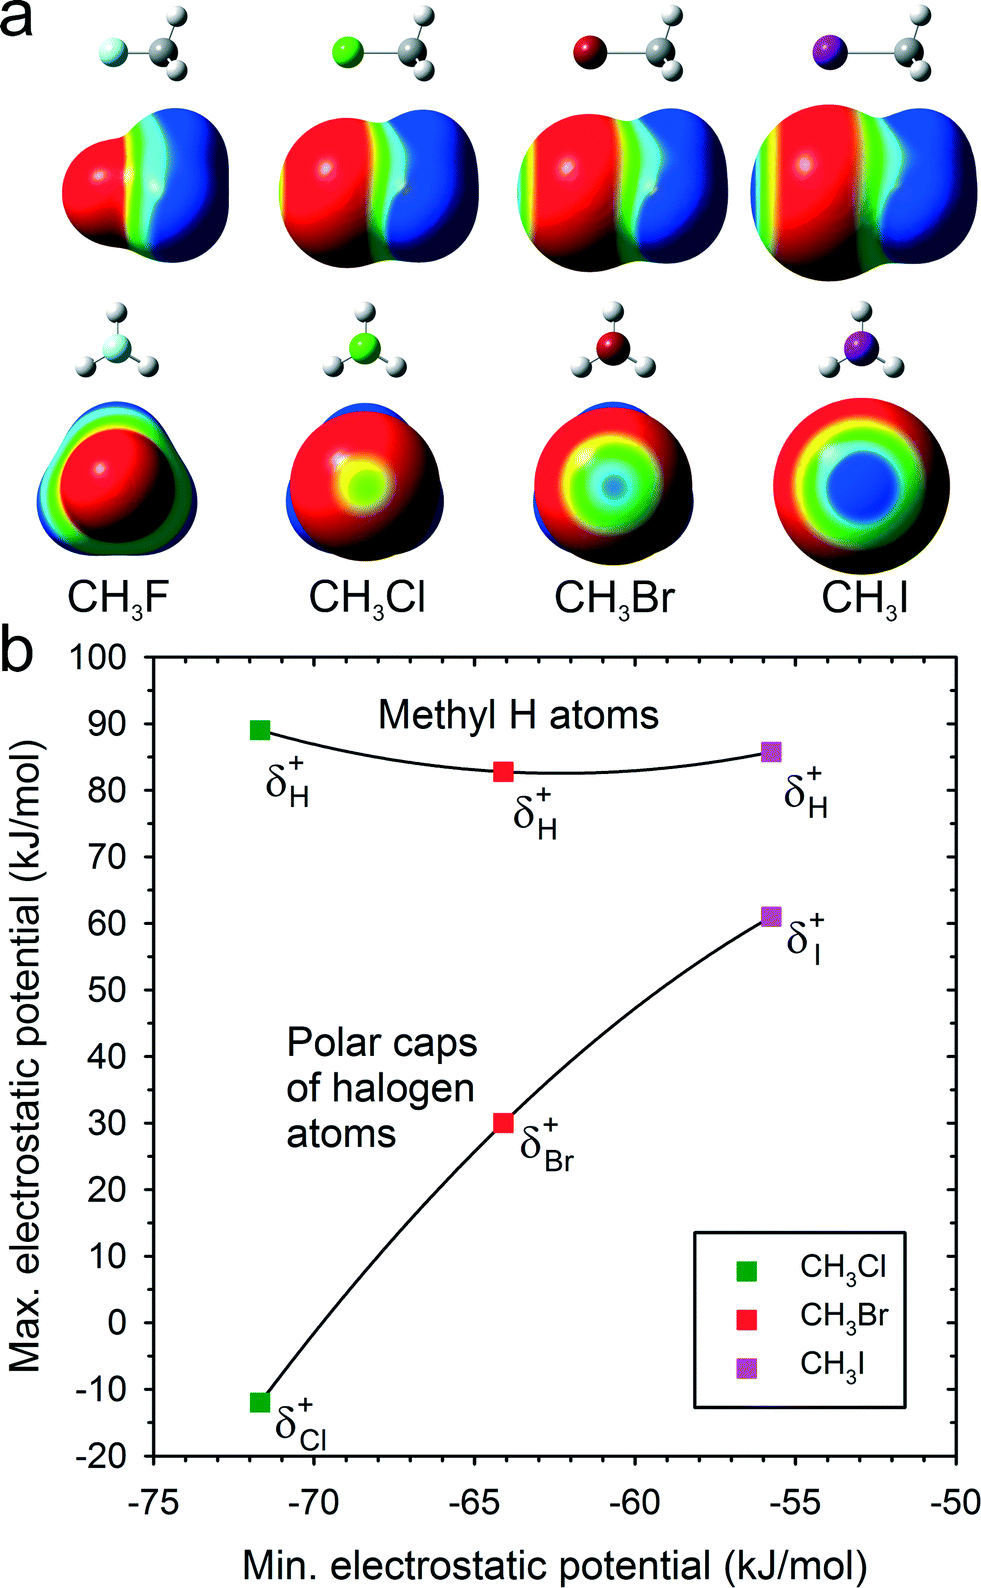 | ||
| Fig. 4 (a) Molecules CH3F, CH3Cl, CH3Br and CH3I as well as their surfaces with electrostatic potential colour scale, common for all drawings and ranging from −0.015 (red) to 0.015 a.u. (blue); (b) the electrostatic potential magnitude on the surface of the methyl H-atoms and at the polar caps of the halogens plotted against the minimum potential in all CH3X surfaces located on the rim of halogen atoms. Symbols δ+H and δ+X denote the maximum electrostatic potential magnitudes on the surface of H and X atoms, respectively. | ||
The positive electrostatic potential on the halogen atom polar region of the molecular surface can act like H-donors in hydrogen bonds. Fig. 4 shows that the magnitude of polar electrostatic potential of the iodine atom is approximately twice as high as that of bromine and that no positive polar potential exists in CH3Cl. This is consistent with the strongest preference for the X⋯X bonds in CH3I and in CH3Br. The electrostatic potential of the H atoms is higher than that of the I atoms and approximately equal for all CH3Cl, CH3Br and CH3I. A large contribution to the X⋯X interactions arises from the polarizability of halogen atoms. This contribution to dispersion forces between Cl⋯Cl, Br⋯Br and I⋯I atoms is equal to −2.5, −3.2 and −4.9 kJ mol−1, respectively. Thus the high positive potential at the polar region of the iodine atom and the strongest dispersion forces of I⋯I interactions favour the halogen⋯halogen bonds in CH3I. The lower positive potential of Br and the weaker dispersion interactions make the Br⋯Br bonds less competitive. Pressure reverses the balance between the two polymorphs of CH3Br and it can be argued that it enforces the most efficient involvement of all H-donors in the compressed structure. This pressure effect was observed in sucrose,16 acetonitrile14 and formamide.15
Halomethanes CH3X crystallize either in space group Cmc21 or in space group Pnma. Although the space-group symmetries are different, the CH3X structures have much in common (Fig. 5): the unit cells are roughly similar (after exchanging axes [x] and [y]; cf.Tables 1 and S1 and S2 in the ESI†), four molecules in the unit cells are located on the mirror planes, and the molecular arrangements in both these symmetries approximate the prototypical orthorhombic symmetry Cmca of isostructural Cl2, Br2 and I2 crystals.39,40 This subgroup–group relationship results from the symmetry of halomethane molecules, C3v, lower than that of the dihalogen molecules, D∞h. Fig. 5 shows that the prototypic Cmca symmetry is broken due to the antiparallel arrangement of molecules in α-CH3Br and the parallel arrangement of molecules in β-CH3Br. The encircled molecules in the plane perpendicular to [z] are all antiparallel in α-CH3Br (Fig. 5a) and parallel in β-CH3Br (Fig. 5b). Both these phases correspond to the prototypic Br2 structure of higher space group symmetry Cmca, where the molecules are located on the inversion centres.
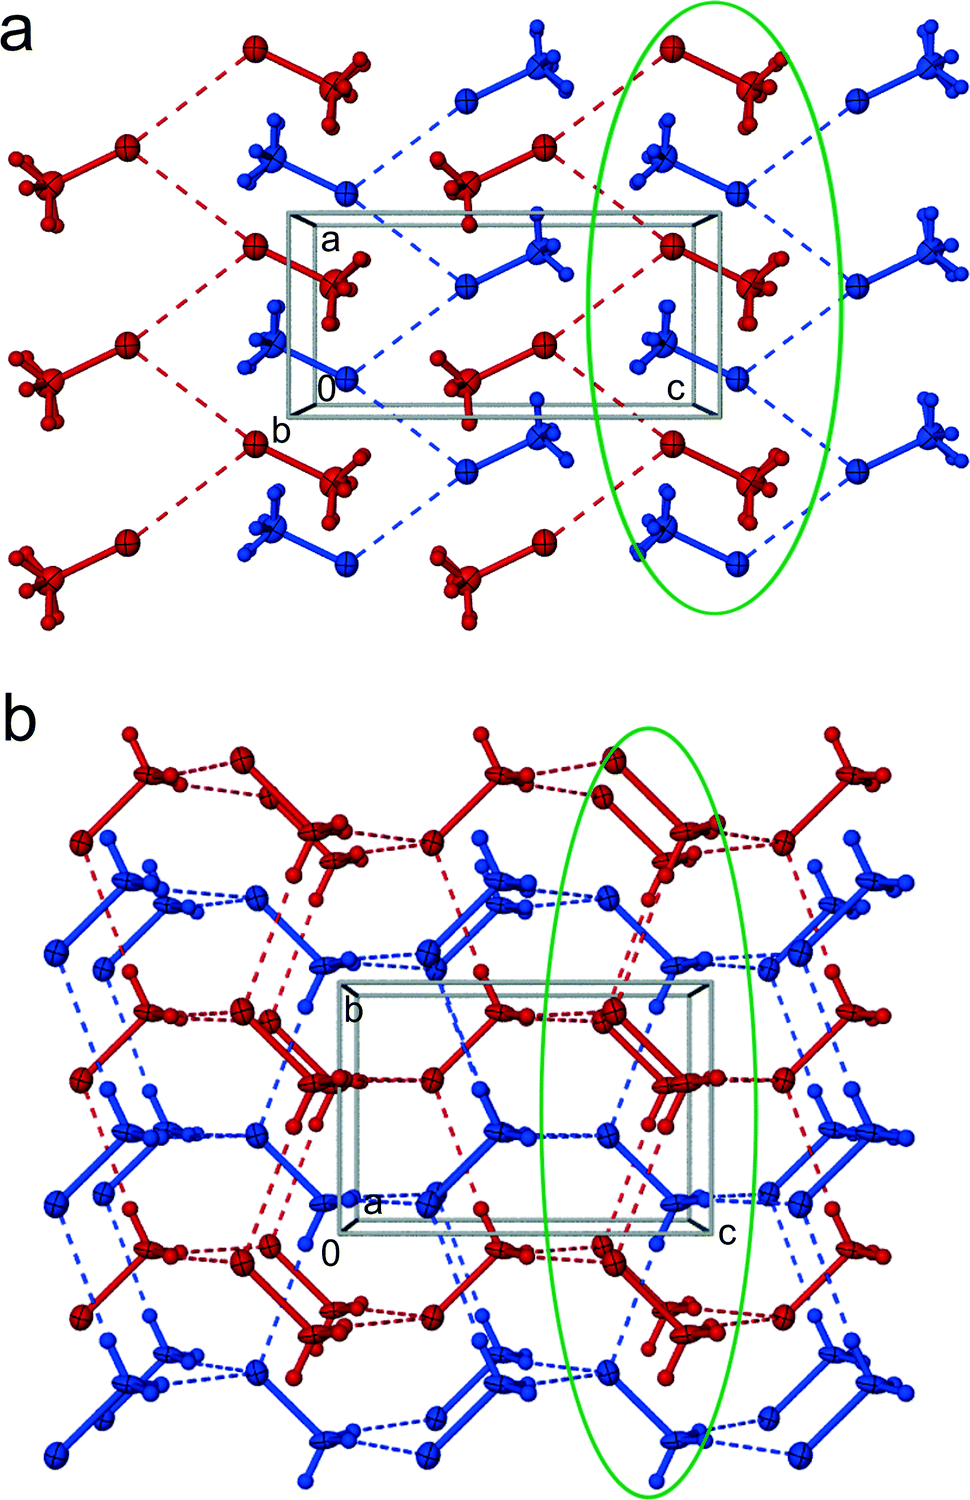 | ||
| Fig. 5 Two layers of Br⋯Br bonded CH3Br molecules in phase α (a) and two interweaved diamondoid C–H⋯Br bonded networks of phase β (b), shown in autostereographic projections.49 Dashed lines indicate the shortest intermolecular contacts (cf.Table 2). The layers in α-CH3Br (a) are coloured red (y = 0.75) and blue (y = 0.25); the interpenetrating 3-dimensional networks in β-CH3Br (b) are discriminated by colours, too. The encircled groups of molecules correspond to the same part of the prototypic Br2 structure, as explained in the text. The displacement ellipsoids are drawn at the 40% probability level. | ||
| CH3Ia | α-CH3Brb | β-CH3Brb | CH3Clb | |
|---|---|---|---|---|
| a Ref. 26. b This work. | ||||
| Pressure (GPa) | 0.53 | 1.11 | 1.55 | 1.22 |
| Space group | Pnma | Pnma | Cmc21 | Cmc21 |
| Unit cell (Å) | ||||
| a | 4.4968(9) | 4.372(5) | 6.387(9) | 6.314(10) |
| b | 6.8417(14) | 6.375(5) | 5.163(5) | 5.031(9) |
| c | 9.941(2) | 9.196(9) | 7.492(5) | 7.334(9) |
| Volume (Å3) | 305.83(11) | 256.3(4) | 247.1(5) | 232.9(6) |
| Z | 4 | 4 | 4 | 4 |
In phase α-CH3Br, of space group symmetry Pnma, the molecular layers are linked by Br⋯Br interactions of type II.41–43 The positive and negative regions of each bromine atom are electrostatically matched with its two Br neighbours in a zigzag chain (Fig. 5a). The C–Br⋯Bri–Ci contacts are asymmetric, with the C–Br⋯Br angles close to 120° and 170° (see Table 2). Within the layers the electro-positive methyl groups are also arranged in a zigzag motif between the negative rims of the Br atoms in the neighbouring layers (Fig. 5).
| CH3Br at: | Phase α | Phase α | Phase α |
|---|---|---|---|
| 0.1 MPa/153 Ka | 1.11 GPa/295 Kb | 1.50 GPa/295 Kb | |
| Molecular dimensions | |||
| C1–Br1 (Å) | 1.863 | 1.912(10) | 1.898(9) |
| Intermolecular dimensions | |||
| Br1⋯Br1i (Å) | 3.587 | 3.571(3) | 3.546(3) |
| ∠C1–Br1⋯Br1i (°) | 116.0 | 118.5(4) | 116.5(2) |
| ∠Br1⋯Br1i–C1i (°) | 166.8 | 166.0(4) | 168.2(2) |
| C1⋯Br1j (Å) | 3.882 | 3.825(8) | 3.844(4) |
| H12⋯Br1k (Å) | 3.124 | 3.242 | 3.058 |
| H11⋯Br1l (Å) | 3.170 | 3.315 | 3.084 |
| CH3Br at: | Phase β | Phase β | Phase β |
|---|---|---|---|
| 1.55 GPa/295 Kb | 1.83 GPa/295 Kb | 2.85 GPa/295 Kb | |
| a Ref. 24. b This work. Symmetry codes: (i) 0.5 + x, 0.5 − y, 0.5 − z; −0.5 + x, 0.5 − y, 0.5 − z; (j) −x, −0.5 + y, −z; −x, 0.5 + y, −z; (k) 1 − x, 0.5 + y, −z; (l) 1 − x, −0.5 + y, −z; (m) −x, −y, 0.5 + z; −x, −y, −0.5 + z; (n) −x, 1 − y, 0.5 + z; (o) −x, −y, 0.5 + z; (p) −0.5 + x, 0.5 + y, z; 0.5 + x, 0.5 + y, z; (q) x, 1 + y, z; (r) −0.5 − x, 0.5 − y, 0.5 + z; 0.5 − x, 0.5 − y, 0.5 + z. | |||
| Molecular dimensions | |||
| C1–Br1 (Å) | 1.919(16) | 1.892(14) | 2.024(25) |
| Intermolecular dimensions | |||
| Br1⋯Br1m (Å) | 3.948(3) | 3.908(4) | 3.878(9) |
| ∠C1–Br1⋯Br1m (°) | 63.9(5) | 62.6(5) | 62.4(7) |
| ∠Br1⋯Br1m–C1m (°) | 152.9(5) | 154.3(5) | 152.7(7) |
| C1⋯Br1n (Å) | 3.501(16) | 3.487(15) | 3.313(24) |
| C1⋯Br1o (Å) | 3.551(17) | 3.471(18) | 3.444(24) |
| C1⋯Br1p (Å) | 3.671(9) | 3.684(9) | 3.599(14) |
| H1⋯Br1q (Å) | 3.073 | 3.094 | 2.909 |
| H3⋯Br1r (Å) | 3.041 | 3.009 | 2.897 |
In β-CH3Br the halogen bonds Br⋯Br are broken and replaced by bonds C–H⋯Br (Fig. 5b, Table 2). Each CH3Br molecule forms three C–H⋯Br bonds on the H-donor side and accepts three C–H⋯Br bonds around the Br atom. The molecules are arranged head-to-tail into two 3-dimensional interpenetrating (CH⋯Br)-bonded networks (Fig. 5b). Between these two networks the molecular parts of opposite electrostatic potential are closer than those of the same sign. The difference between phases α and β is most apparent in the ratio of Br⋯Br contacts contributing 5.5% to the overall Hirschfeld surface at low pressure and this contribution is reduced five-fold at high pressure to about 1%. This rearrangement causes a massive effect for the H⋯Br Hirschfeld-surface contributions, increasing from 49.6% at 1.11 GPa to 62.1% at 1.55 GPa. These changes in contributing Hirschfeld areas are compensated for in the reduced surface of H⋯H contacts of 44.9% and 36.9%, respectively.
Isobaric,25 isothermal and isochoric crystallization of CH3Cl all lead to the same phase isostructural with β-CH3Br. It is apparent that weaker Cl⋯Cl interactions are overcome by C–H⋯Cl bonds (see Table 3) and no Pnma-symmetric polymorph is formed. The CH3Cl structure is consistent with the chlorophobic rule.44,45
| CH3Cl at: | 0.1 MPa/148 Ka | 1.22 GPa/295 Kb | 1.69 GPa/295 Kb | 2.91 GPa/295 Kb | 4.38 GPa/295 Kb |
|---|---|---|---|---|---|
| a Ref. 25. b This work. Symmetry codes: (i) −x, −y, 0.5 + z; −x, −y, −0.5 + z; (j) −x, 1 − y, 0.5 + z; (k) −x, −y, 0.5 + z; (l) −0.5 + x, 0.5 + y, z; 0.5 + x, 0.5 + y, z; (m) x, 1 + y, z; (n) −0.5 − x, 0.5 − y, 0.5 + z; 0.5 − x, 0.5 − y, 0.5 + z. | |||||
| Molecular dimensions | |||||
| C1–Cl1 (Å) | 1.805 | 1.746(7) | 1.792(4) | 1.750(5) | 1.716(7) |
| Intermolecular dimensions | |||||
| Cl1⋯Cl1i (Å) | 4.010 | 3.906(5) | 3.871(8) | 3.712(5) | 3.670(7) |
| ∠C1–Cl1⋯Cl1i (°) | 64.4 | 63.4(3) | 61.7(2) | 66.3(2) | 64.7(3) |
| ∠Cl1⋯Cl1i–C1i (°) | 156.1 | 156.9(3) | 156.5(1) | 151.0(2) | 151.1(2) |
| C1⋯Cl1j (Å) | 3.507 | 3.454(8) | 3.371(5) | 3.316(6) | 3.285(8) |
| C1⋯Cl1k (Å) | 3.618 | 3.493(9) | 3.407(5) | 3.409(7) | 3.322(8) |
| C1⋯Cl1l (Å) | 3.734 | 3.650(6) | 3.582(5) | 3.421(3) | 3.391(8) |
| H1⋯Cl1m (Å) | 3.138 | 3.085 | 2.962 | 2.788 | 2.706 |
| H3⋯Cl1n (Å) | 3.125 | 3.011 | 2.926 | 2.855 | 2.823 |
It is remarkable that CH3Br phase β is isostructural with the high-pressure acetonitrile phase β.14 The CH3Br and CH3CN molecules are similar in shape and in the electrostatic potential distribution on the molecular surface (except the polar Br-atom positive region, which is not involved in the C–H⋯Br bonds). Also, the favoured directions of C–H⋯X bonds are similar. Consequently, a similar aggregation of three molecules around each –Br and ![[triple bond, length as m-dash]](https://www.rsc.org/images/entities/char_e002.gif) N atoms takes place (Fig. 6). The difference, that in acetonitrile the transition is induced by the transformation between 2-fold C–H⋯N (α-CH3CN) to 3-fold C–H⋯N (β-CH3CN) bonding whereas methyl bromide transforms between 2-fold Br⋯Br (α-CH3Br) to 3-fold C–H⋯Br (β-CH3Br) bonding, is meaningful. It indicates that, apart from other factors, the steric hindrance between large halogen atoms can be disadvantageous for their close association.
N atoms takes place (Fig. 6). The difference, that in acetonitrile the transition is induced by the transformation between 2-fold C–H⋯N (α-CH3CN) to 3-fold C–H⋯N (β-CH3CN) bonding whereas methyl bromide transforms between 2-fold Br⋯Br (α-CH3Br) to 3-fold C–H⋯Br (β-CH3Br) bonding, is meaningful. It indicates that, apart from other factors, the steric hindrance between large halogen atoms can be disadvantageous for their close association.
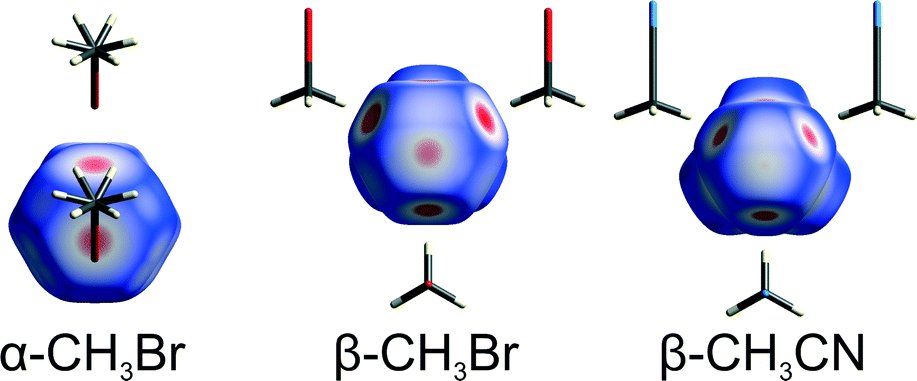 | ||
| Fig. 6 Hirschfeld surfaces50,51 of α-CH3Br, β-CH3Br and β-CH3CN14 viewed along the molecular axis from the Br/N-top of molecules and decorated with colour maps of intermolecular distances relative to the van der Waals radii. Other interacting molecules are shown as stick models. Distances longer than van der Waals radii are shown in shades of navy blue, the equal ones are white and the shorter red. The colour scale ranges from −0.15 to 0.65. | ||
Conclusions
Phase α-CH3Br, isostructural with CH3I and dominated by halogen⋯halogen bonds, is destabilized by pressure and transforms into phase β-CH3Br governed by C–H⋯halogen interactions. Phase β of CH3Br and the CH3Cl crystal are isostructural. It can be envisaged that CH3I may also transform into a C–H⋯I bonded phase at pressure considerably higher than 2.5 GPa as obtained in our previous study.26 Due to halogen⋯halogen and C–H⋯halogen forces systematically increasing in the CH3Cl < CH3Br < CH3I sequence, only CH3Cl up to 1.2 GPa and CD3Br phase β determined at ambient pressure and 175 K29 are the loose crystals.46,47 This indicates that CH3X molecules are more evenly accommodated in space group Cmc21 and that C–H⋯X interactions are favoured by the close-packing effect. This effect can significantly contribute to the stability of CH3X at high pressure. However, detailed measurements of the CH3Br crystal volume as a function of temperature are still needed to evaluate the contribution of close packing to the C–H⋯X versus X⋯X competition.Acknowledgements
This study was supported by the TEAM grant no. 2009-4/6 from the Foundation for Polish Science.Notes and references
- F. F. Awwadi, R. D. Willett, K. A. Peterson and B. Twamley, Chem. – Eur. J., 2006, 12, 8952–8960 CrossRef CAS PubMed.
- C. M. Reddy, M. T. Kirchner, R. V. Gundakaram, K. A. Padmanabhan and G. R. Desiraju, Chem. – Eur. J., 2006, 12, 2222–2234 CrossRef CAS PubMed.
- P. Metrangolo, F. Meyer, T. Pilati, G. Resnati and G. Terraneo, Angew. Chem., Int. Ed., 2008, 47, 6114–6127 CrossRef CAS PubMed.
- A. Mukherjee and G. R. Desiraju, IUCrJ, 2014, 1, 49–60 CAS.
- P. Politzer, J. S. Murray and T. Clark, Phys. Chem. Chem. Phys., 2013, 15, 11178–11189 RSC.
- A. R. Jagarlapudi, P. Sarma and G. R. Desiraju, Acc. Chem. Res., 1986, 19, 222–228 CrossRef.
- P. Metrangolo and G. Resnati, Science, 2008, 321, 918–919 CrossRef CAS PubMed.
- T. J. Mooibroek and P. Gamez, CrystEngComm, 2013, 15, 4565–4570 RSC.
- S. L. Price, A. J. Stone, J. Lucas, R. S. Rowland and A. E. Thornley, J. Am. Chem. Soc., 1994, 116, 4910–4918 CrossRef CAS.
- M. Kaźmierczak and A. Katrusiak, Cryst. Growth Des., 2014, 14, 2223–2229 Search PubMed.
- H.-C. Chang, J.-C. Jiang, C.-W. Chuang and S. H. Lin, Chem. Phys. Lett., 2004, 397, 205–210 CrossRef CAS PubMed.
- K. F. Dziubek, D. Jęczmiński and A. Katrusiak, J. Phys. Chem. Lett., 2010, 1, 844–849 CrossRef CAS.
- K. M. Lee, H.-C. Chang, J.-C. Jiang, J. C. C. Chen, H.-E. Kao, S. H. Lin and I. J. B. Lin, J. Am. Chem. Soc., 2003, 125, 12358–12364 CrossRef CAS PubMed.
- A. Olejniczak and A. Katrusiak, J. Phys. Chem. B, 2008, 112, 7183–7190 CrossRef CAS PubMed.
- R. Gajda and A. Katrusiak, Cryst. Growth Des., 2011, 11, 4768–4774 CAS.
- E. Patyk, J. Skumiel, M. Podsiadło and A. Katrusiak, Angew. Chem., Int. Ed., 2012, 51, 2146–2150 CrossRef CAS PubMed.
- M. Podsiadło, K. Dziubek and A. Katrusiak, Acta Crystallogr., Sect. B: Struct. Sci., 2005, 61, 595–600 Search PubMed.
- M. Podsiadło, K. Dziubek, M. Szafrański and A. Katrusiak, Acta Crystallogr., Sect. B: Struct. Sci., 2006, 62, 1090–1098 Search PubMed.
- M. Podsiadło and A. Katrusiak, Acta Crystallogr., Sect. B: Struct. Sci., 2007, 63, 903–911 Search PubMed.
- M. Podsiadło and A. Katrusiak, J. Phys. Chem. B, 2008, 112, 5355–5362 CrossRef PubMed.
- M. Podsiadło and A. Katrusiak, CrystEngComm, 2008, 10, 1436–1442 RSC.
- M. Podsiadło and A. Katrusiak, CrystEngComm, 2009, 11, 1391–1395 RSC.
- R. M. Ibberson and M. Prager, Z. Kristallogr., 2007, 222, 416–419 CrossRef CAS.
- T. Kawaguchi, M. Hijikigawa, Y. Hayafuji, M. Ikeda, R. Fukushima and Y. Tomiie, Bull. Chem. Soc. Jpn., 1973, 46, 53–56 CrossRef CAS.
- R. D. Burbank, J. Am. Chem. Soc., 1953, 75, 1211–1214 CrossRef CAS.
- M. Podsiadło and A. Katrusiak, CrystEngComm, 2009, 11, 1951–1957 RSC.
- C. J. Egan and J. D. Kemp, J. Am. Chem. Soc., 1938, 60, 2097–2101 CrossRef CAS.
- O. S. Binbrek, A. Anderson and B. H. Torrie, J. Chem. Phys., 1985, 82, 1468–1475 CrossRef CAS PubMed.
- P. N. Gerlach, B. H. Torrie and B. M. Powell, Mol. Phys., 1986, 57, 919–930 CrossRef CAS.
- R. M. Ibberson and M. Prager, Acta Crystallogr., Sect. B: Struct. Sci., 1996, 52, 892–895 CrossRef.
- W. A. Bassett, High Pressure Res., 2009, 29, 163–186 CrossRef CAS.
- A. Budzianowski and A. Katrusiak, High-Pressure Crystallography, ed. A. Katrusiak and P. F. McMillan, Kluwer Academic Publisher, Dordrecht, 2004, pp. 101–112 Search PubMed.
- Oxford Diffraction Ltd., Xcalibur CCD system, CrysAlis Software system, Version 1.171, 2004 Search PubMed.
- A. Katrusiak, REDSHABS − Program for Correcting Reflections Intensities for DAC Absorption, Gasket Shadowing and Sample Crystal Absorption, Adam Mickiewicz University, Poznań, Poland, 2003 Search PubMed.
- A. Katrusiak, Z. Kristallogr., 2004, 219, 461–467 CrossRef CAS.
- G. M. Sheldrick, Acta Crystallogr., Sect. A: Found. Crystallogr., 2008, 64, 112–122 CrossRef CAS PubMed.
- M. J. Frisch, et al., GAUSSIAN03, Revision B.04., Gaussian, Inc., Pittsburgh, PA, USA, 2003 Search PubMed.
- R. F. W. Bader, M. T. Carroll, J. R. Cheeseman and C. Chang, J. Am. Chem. Soc., 1987, 109, 7968–7979 CrossRef CAS.
- R. M. Ibberson, O. Moze and C. Petrillo, Mol. Phys., 1992, 76, 395–403 CrossRef CAS.
- B. M. Powell, K. M. Heal and B. H. Torrie, Mol. Phys., 1984, 53, 929–939 CrossRef CAS.
- G. R. Desiraju and R. Parthasarathy, J. Am. Chem. Soc., 1989, 111, 8725–8726 CrossRef CAS.
- P. Metrangolo and G. Resnati, IUCrJ, 2014, 1, 5–7 CrossRef CAS.
- T. Sakurai, M. Sundaralingam and G. A. Jeffrey, Acta Crystallogr., 1963, 16, 354–363 CrossRef CAS.
- O. V. Grineva and P. M. Zorky, Zh. Fiz. Khim., 1998, 72, 714–720 CAS (In Russian).
- O. V. Grineva and P. M. Zorky, Kristallografiya, 2000, 45, 692–698 CrossRef CAS (In Russian).
- M. Bujak, M. Podsiadło and A. Katrusiak, CrystEngComm, 2011, 13, 396–398 RSC.
- M. Kaźmierczak and A. Katrusiak, J. Phys. Chem. C, 2013, 117, 1441–1446 Search PubMed.
- D. R. Lide, CRC Handbook of Chemistry and Physics, CRC Press Inc., Boca Raton, FL, 90th edn, 2010 Search PubMed.
- A. Katrusiak, J. Mol. Graphics Modell., 2001, 19, 363–367 CrossRef CAS.
- J. J. McKinnon, M. A. Spackman and A. S. Mitchell, Acta Crystallogr., Sect. B: Struct. Sci., 2004, 60, 627–668 CrossRef PubMed.
- S. K. Wolff, D. J. Grimwood, J. J. McKinnon, D. Jayatilaka and N. A. Spackman, CrystalExplorer 2.0, University of Western Australia, Perth, Australia, 2007 Search PubMed.
- A. Bondi, J. Phys. Chem., 1964, 68, 441–451 CrossRef CAS.
Footnote |
| † Electronic supplementary information (ESI) available: Detailed experiment and structure description. CCDC 957707–957715. For ESI and crystallographic data in CIF or other electronic format see DOI: 10.1039/c4ce00241e |
| This journal is © The Royal Society of Chemistry 2014 |