
 Open Access Article
 This Open Access Article is licensed under a Creative Commons Attribution-Non Commercial 3.0 Unported Licence
Quantitative analysis of charge transfer plasmons in silver nanocluster dimers using semiempirical methods†
Qiwei Sun a,
Yavuz S. Ceylanab and
Rebecca L. M. Gieseking*a
a,
Yavuz S. Ceylanab and
Rebecca L. M. Gieseking*a
aDepartment of Chemistry, Brandeis University, 415 South Street, Waltham, Massachusetts 02453, USA. E-mail: gieseking@brandeis.edu; Tel: +1(781)-736-2511
bDepartment of Chemistry, Massachusetts College of Liberal Arts, 375 Church Street, North Adams, Massachusetts 01247, USA
First published on 24th June 2024
Abstract
Plasmonic metal nanoclusters are widely used in chemistry, nanotechnology, and biomedicine. In metal nanocluster dimers, coupling of the plasmons leads to the emergence of two distinct types of modes: (1) bonding dipole plasmons (BDP), which occurs when charge oscillates synchronously within each nanocluster, and (2) charge transfer plasmons (CTP), which occurs when charge oscillates between two conductively linked nanoclusters. Although TDDFT-based modeling has uncovered some trends in these modes, it is computationally expensive for large dimers, and quantitative analysis is challenging. Here, we demonstrate that the semiempirical quantum mechanical method INDO/CIS enables us to quantify the CTP character of each excited state efficiently. In end-to-end Ag nanowire dimers, the longitudinal states have CTP character that decreases with increasing gap distance and nanowire length. In side-by-side dimers, the transverse states have CTP character and generally larger than in the end-to-end dimers, particularly for the longer nanowires. In side-by-side dimers where one nanowire is shifted along the length of the other, the CTP character of the longitudinal states peaks when the dimer is shifted by two Ag–Ag bond lengths, while the transverse states show decreasing CTP character as displacement increases. In the larger Ag31+ nanorod dimers, CTP character follow a similar distance dependence to that seen in the small nanowire but have smaller overall CTP character than the nanowires. Our study demonstrates that INDO/CIS is capable of modeling metal nanocluster dimers at a low computational cost, making it possible to study larger dimers that are difficult to analyze using TDDFT.
1. Introduction
Nanogaps between plasmonic metal nanostructures play a pivotal role in the strong interactions between these structures and light.1–6 Noble metal nanostructures support plasmons, which are collective oscillations of their conduction electrons that can be excited by incident light.7 When two plasmonic nanostructures are coupled through a nanogap, the coupling results in a strong electric field enhancement within the gap and increased sensitivity to the local environment,3 which substantially affects their function in various applications. For example, in tip-enhanced Raman spectroscopy (TERS), localization of the electromagnetic field in the gap between a plasmonic tip and surface at the nanoscale leads to strong enhancement of the Raman signals of molecules positioned within the gap.1,4 Similarly, in photocatalysis, intense electric fields within nanogaps facilitate the absorption of incident photons and enhance the efficiency of photocatalytic reactions.2,5A nanogap between two closely spaced plasmonic nanoparticles affects the electric field distribution by giving rise to new coupled plasmon resonance modes. One such mode is the bond dipole plasmon (BDP), which emerges when charge oscillations within each nanoparticle are coupled (Fig. 1a).8 This mode generates a hot spot within the nanogap with a large local electromagnetic field enhancement.9 As the gap approaches sub-nanometer distances, a conductive pathway can be established between the nanoparticles, leading to the emergence of charge transfer plasmons (CTP).10 In the CTP mode, electrons oscillate between the two nanoparticles at the CTP resonance frequency, such that one nanoparticle instantaneously gains a partial positive charge while the other gains a partial negative charge (Fig. 1b).11 Unlike the BDP modes, CTP modes can cause a reduction in the local electric field within the nanogap.12 Previous research suggests that the exceptional tunability of the CTP mode makes it ideal for use in sensing and active nanodevices.11,12 Additionally, the CTP mode can tune the photocatalytic rate in plasmon-enhanced catalysis, offering control over molecular dissociation processes.13 In large metal nanoparticles, a transition from BDP to CTP modes can be observed experimentally as the gap distance decreases.11,14
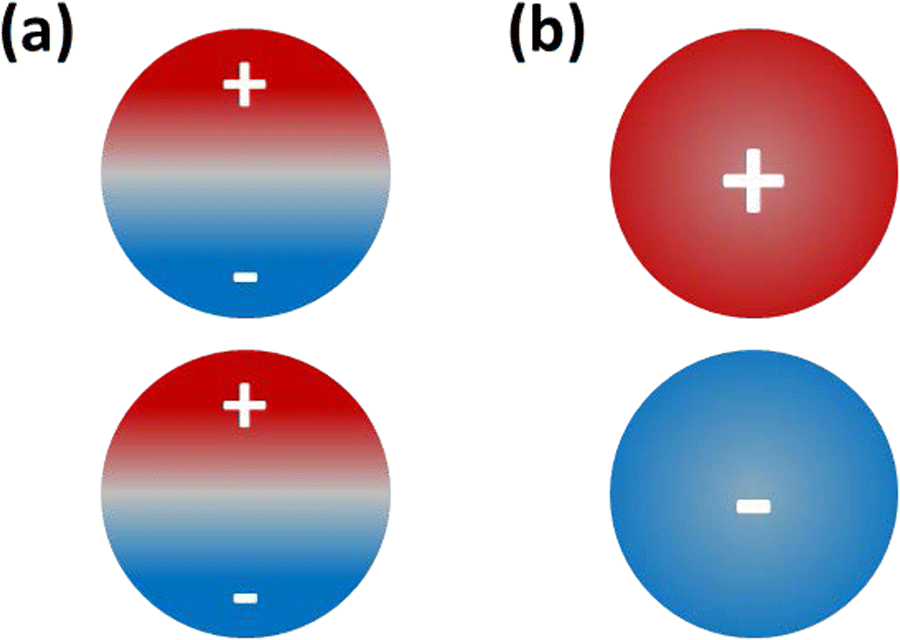 | ||
| Fig. 1 Schematic of instantaneous charges for the (a) pure BDP mode (50% positive and 50% negative on each nanoparticle) and (b) pure CTP mode (100% positive on one nanoparticle and 100% negative on the other). | ||
Theoretical modeling of plasmonic dimers can give insight into the BDP and CTP modes, paving the way for the design of plasmonic dimers optimized for specific applications.15–23 While the BDP mode can be modeled accurately using classical electromagnetic methods,24–26 the CTP mode can only be studied in classical models using bridged metal nanoparticle dimers.12,24–26 The CTP mode in closely-spaced nanoparticles is inherently quantum mechanical in nature because it requires electrons to tunnel between two nanoparticles,14,17 and thus requires quantum mechanical methods to accurately model its behavior. Methods such as linear response (LR)18–21,23 and real time (RT)27,28 time-dependent density functional theory (TDDFT) that have been previously used to study metal nanoclusters are applicable for systems up to a few hundred atoms due to their computational cost.
Previous LR-TDDFT studies of Ag and Au nanocluster dimers have revealed trends in the BDP and CTP modes, highlighting the strong dependence of the CTP mode on factors such as separation distance and symmetry.17–23 Several studies used visualization of the transition density as a qualitative indicator to identify the CTP excitations, but did not quantify the CTP character.19–22 For Ag nanowire or nanorod dimers in end-to-end and side-to-side orientations, CTP absorption peaks emerge when the separation distance between the two nanoclusters is smaller than 0.7 nm (7.0 Å). As the separation distance decreases below this limit, the CTP states decrease in energy. At distances larger than 0.7 nm, only BDP states were identified.19,20 The end-to-end dimers have CTP states from longitudinal transitions (along the nanowire's long axis),19,21 whereas the side-by-side dimers have CTP states from transverse transitions (along the short axis).20,21 When the symmetry is broken by placing the nanowire dimer in a bent “V-shape”, the energy spacing and relative intensities of the CTP and BDP modes are similar to those of the linear end-to-end dimer.21
Other studies have employed different criteria to characterize the CTP modes for the tip-to-tip dimers of tetrahedral Ag and Au nanoclusters.18,22 In addition to transition densities, recent work using a TDDFT+TB model identified CTP excitations by analyzing the orbital contributions and the effect of scaling the Coulomb kernel. They found that the energies of the CTP states are very sensitive to separation distance but are less sensitive than the BDP states to the scaling parameter, and that CTP states are largely single-particle excitations, in contrast with the collective character of the BDP states.22 Another study on tetrahedral dimers used Hirshfeld partitioning of the excited-states charges and polarizabilities into atomic contributions to distinguish between CTP and BDP states.18 In this scheme, CTP states show large net charges on the dimer with opposing signs and large charge-transfer polarizabilities, leading to strong charge-transfer absorption. Both studies identify two main CTP states in the tip-to-tip tetrahedral dimers,18,22 in contrast with the single CTP peak observed in end-to-end linear dimers. Another study proposed a charge transfer ratio index to quantify CTP character by comparing the dipole moment assuming the charge of each cluster was located at its center to the actual dipole moment.23 Their results showed that the optical response of the dimers is influenced by the separation distance and the width of the linking channel, with CTP peaks appearing at low energies for dimers with electron cloud overlap. However, a major limitation of this study is that they used a jellium model that does not include atomistic details. Overall, new approaches are needed to avoid the limitations of DFT and the jellium approximation, so that fully quantitative analysis of CTP can be done on the atomistic level in larger systems.
Obtaining the CTP and BDP states in metal cluster dimers requires computing tens or hundreds of excited states even for relatively small clusters, and the computational cost increases as the cluster size and the number of relevant excited states increases. Particularly for larger systems, the computational cost of typical DFT approaches can become a limiting factor. Lower-cost methods can enable understanding of chemical trends in larger dimers. One lower-cost approach that has been used is TDDFT+TB, a parameter-free approximation to DFT,29 which has been shown to generate qualitatively correct absorption spectra compared to TDDFT for tetrahedral cluster dimers.22 Another class of low-cost of computational methods are semiempirical quantum mechanical methods (SEQMs)30,31 that use empirical parameters to approximate costly integrals. Recently, several SEQMs have been parametrized for both the ground state32–34 and excited states35,36 of the coinage metals. The time-dependent density functional tight binding (TD-DFTB) method, which is a semiempirical approximation to DFT, has been used to study the absorption spectra of Ag nanowires and nanorods.37–40 However, to our knowledge, DFTB has not been used to characterize the BDP and CTP modes of dimers. Our group has previously parametrized the Hartree–Fock-based intermediate neglect of differential overlap (INDO) method for Ag nanoclusters.35,36 Combined with configuration interactions with single excitations (CIS), INDO/CIS can calculate hundreds of excited states several orders of magnitude faster than TDDFT. Our parametrized INDO method yields qualitatively correct absorption spectra for Ag nanoclusters compared to TDDFT.41 Since INDO uses the zero differential overlap approximation and minimal Slater-type basis set, it is relatively straightforward to perform mathematical analysis using the atomic orbital basis. Hence, we believe that using the INDO/CIS method will help us quantitatively study the CTP modes of metal dimers.
In this study, we use INDO/CIS to investigate the CTP and BDP modes of Ag nanocluster dimers from a quantum mechanical perspective. We formulate a numerical approach to quantify the CTP character within the INDO/CIS framework. We apply this approach to dimers with varying gap (interparticle) distances in several relative orientations to investigate the effect of these factors on the CTP modes. Our results show that INDO/CIS is capable of predicting the absorption spectra of Ag nanocluster dimers and the emergence of the CTP peaks in agreement with previous TDDFT studies that analyzed these trends qualitatively.21,23,38 In the end-to-end dimers, the highest CTP character occurs when the nanowire length and gap distance are small. In side-by-side dimers, the highest CTP character occurs when the gap distance is small, but the nanowire length is large. Additionally, we have found interesting trends in shifted side-by-side Ag8 dimer systems, which have not been studied before. In the shifted dimers, longitudinal states with CTP character start to appear at the smallest non-zero shift distance, and their CTP character is highest when the shift distance is equivalent to two Ag–Ag bond lengths. In contrast, the transverse states show decreasing CTP character as the shift distance increases. We also extend our methodology to larger pentagonal Ag31+ nanorod dimers. We show that INDO/CIS is a computationally efficient method to capture the distance and geometry dependence in the larger nanorod dimers. Our study provides a semiempirical framework for quantitative analysis of CTP characters in plasmonic dimer systems, and demonstrate the potential to apply INDO/CIS to future quantitative studies of larger plasmonic dimers.
2. Computational methods
2.1. Computations using standard software
The geometries of the silver nanowire monomers (Ag2, Ag4 and Ag8) were optimized using DFT at the B3LYP/cc-pVDZ-PP level42–46 in the Gaussian 16 software package.47 The optimized geometries are similar to those previously computed using other functionals.19,20,41 Although the linear structures longer than two Ag atoms are not local minima, they have been widely studied previously as prototypical systems.19–21,48,49 The geometry of the pentagonal Ag31+ nanorod is taken from our group's previous work, which was optimized at the BP86/DZ level.50 The dimer geometries were constructed by placing two optimized monomers in different geometric arrangements and were not further optimized.Excited-state calculations were performed for the Ag nanocluster monomers and dimers using the semiempirical Intermediate Neglect of Differential Overlap (INDO) Hamiltonian51 with configuration interaction singles (CIS) in MOPAC201652,53 using our previously developed Ag parameters.35,36 The linear nanowires in this study (Ag2–Ag8) are small enough that all possible single excitations within the INDO/CIS basis were included in the CI matrix. For the Ag31+ nanorods, the 6000 lowest-energy single excitations were included in the CI matrix for the dimers, and 3000 excitations were used for the monomer to make the active space as equivalent as possible. For each excited state, all configurations with coefficients larger than 0.05 are used for calculating CTP characters. The absorption spectra were generated by applying a Lorentzian broadening factor (γ = 0.1088 eV = 0.04 hartree) to the excited states.54
2.2. CTP analysis
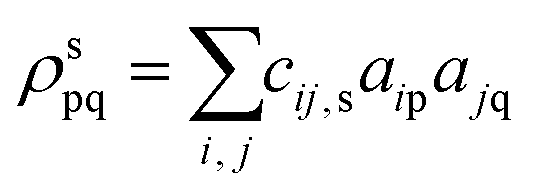
As shown in the Introduction, CTP occurs when the system has an instantaneous excess of positive charge on one nanocluster and excess of negative charge on the other nanocluster, which oscillate at optical frequencies. In contrast, BDP occurs when each nanocluster has equal amounts of instantaneous positive and negative charge (Fig. 1). Thus, the CTP character can be quantified by computing the imbalance between positive and negative transition density within each nanocluster. An excited state with pure CTP character will have 100% positive transition density on one nanowire and 100% negative transition density on the other, whereas an excited state with pure BDP character will have 50% positive and 50% negative transition density on each nanowire.The transition density matrix between excited state s and the ground state in an atomic orbital basis is:
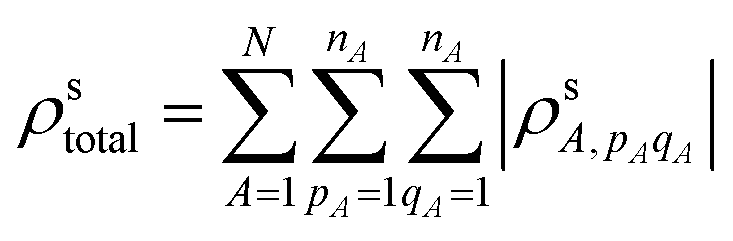
where A is an atom in the first nanowire within the dimer and indices pA and qA are atomic orbitals centered on atom A. To obtain the total transition density, we summed over all n atomic orbital pairs centered on atom A (nA) for all atoms (N) on that nanowire.
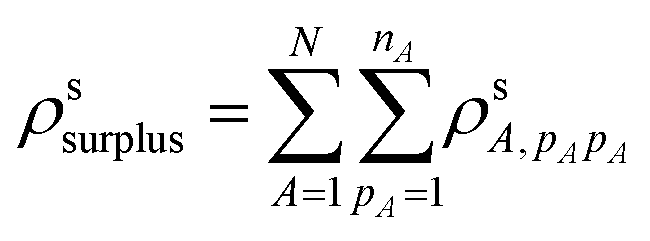
The CTP character also depends on the surplus of positive (or negative) transition density on a single nanowire in the dimer. Only the transition density elements where pA = qA contribute to the surplus of transition density of one sign on the nanowire; for elements where pA ≠ qA, the orthogonality of the different atomic orbitals means that their overlap has regions of both positive and negative sign that cancel perfectly. Thus, the surplus transition density is:
The final CTP character of excited state s is the ratio of these two values:
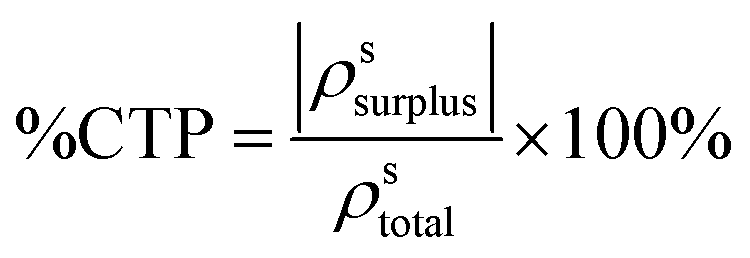
The CTP character ranges from 0 when ρssurplus = 0, indicating that the excited state has equal amounts of positive and negative transition density on both nanowires, to 100% when |ρssurplus| = ρstotal, indicating that one nanowire has only positive transition density and the other has only negative transition density. The CTP contribution to the intensity of each absorption peak fCTP is computed as:
| fCTP = %CTP × fs |
3. Results and discussion
3.1. Ag nanowire monomers
To understand the excited-state properties of the nanowire dimers, we must first examine the individual nanowires. Fig. 2 shows the absorption spectra of the Ag nanowire monomers calculated at the INDO/CIS level. These absorption spectra follow the same trends as the previously reported spectra computed using TDDFT (PBE/DZ20 and SAOP/TZP41). The INDO/CIS spectra show similar spectra shape and evolution of peak positions compared to the TDDFT spectra.20,41 The INDO/CIS spectra has higher absorption intensity than TDDFT for the transverse states because INDO/CIS yields lower d → sp character than TDDFT due to its lower d orbital energies; further parametrization of INDO is currently under investigation. The Ag nanowires have two main absorption peaks: one longitudinal peak with its transition dipole moment aligned with the long axis of the nanowire, and one transverse peak with its transition dipole moment perpendicular to the long axis of the nanowire. The longitudinal absorption peak is relatively low in energy; as the nanowire length increases from Ag2 to Ag8, this peak decreases in energy from 2.95 eV to 1.34 eV and increases in oscillator strength. The transverse absorption peak is higher in energy (5.13–5.39 eV) and increases in oscillator strength and slightly increases energy with increasing length.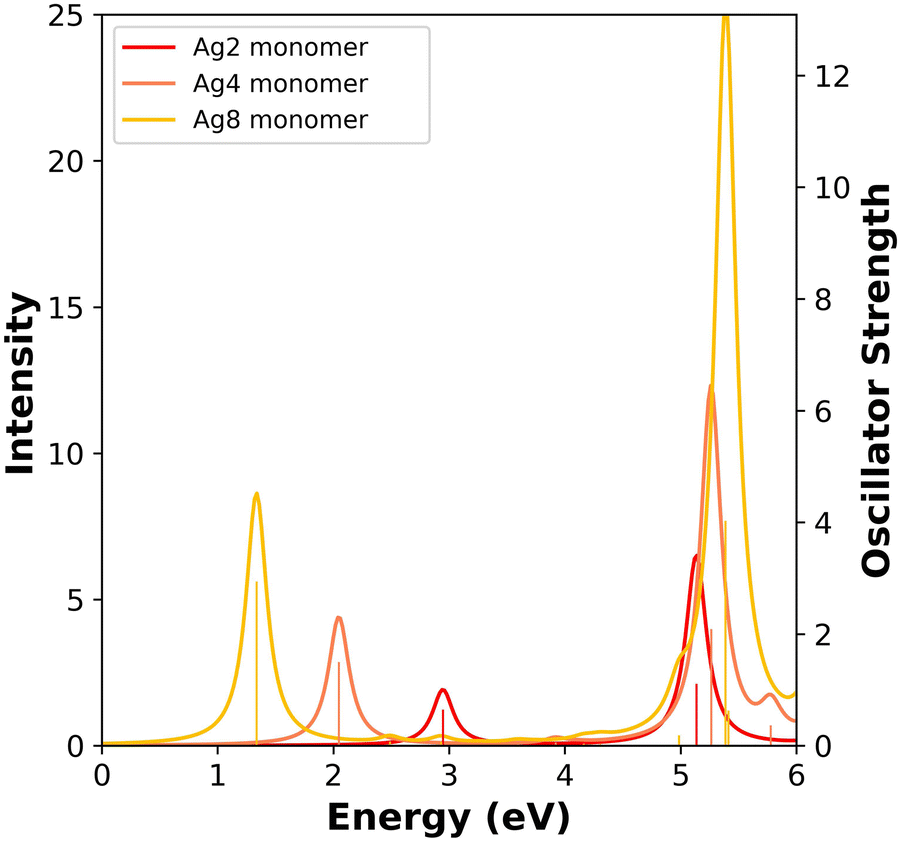 | ||
| Fig. 2 Absorption spectra of the Ag nanowire monomers calculated at INDO/CIS level. The sticks indicate the oscillator strength of each excited state. | ||
3.2. Ag nanowire dimers
To understand the emergence of CTP and BDP states in Ag nanowire dimers, we examine three sets of dimer geometries (Fig. 3):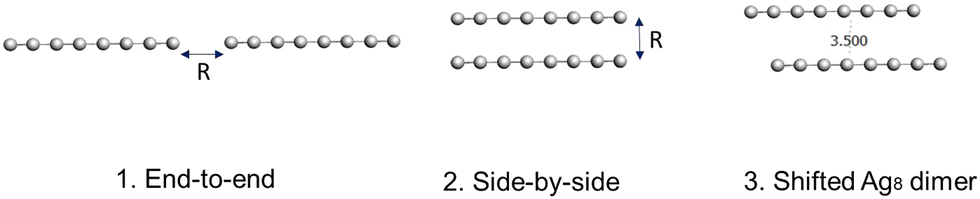 | ||
| Fig. 3 Geometries of the Ag nanowire dimers studied in this paper. The dimers are constructed by placing the monomers of Ag2, Ag4 and Ag8 (lengths of 2.6 Å, 7.9 Å, and 18.5 Å, respectively) in the (1) end-to-end, (2) side-by-side, and (3) shifted Ag8 geometric configurations. | ||
(1) End-to-end dimers, with distances between the nanowires varying from 3.5 to 6.0 Å in 0.5 Å steps.
(2) Side-by-side dimers, with distances between the nanowires varying from 3.5 to 6.0 Å in 0.5 Å steps.
(3) Shifted side-by-side dimers, with the distance between the nanowires fixed at 3.5 Å and one nanowire shifted longitudinally by 0.0 to 15.96 Å in steps corresponding to the Ag–Ag bond lengths, which are 2.6–2.7 Å. These structures were studied only for the Ag8 dimer.
As discussed in the Introduction, CTP states typically arise at short separation distances where electronic coupling between the nanoclusters is significant, and involve transient electron transfer between the nanoclusters. Therefore, quantum mechanical studies are required to understand CTP states. Although the systems in this study are relatively small, typical LR-TDDFT methods quickly become impractical for dimers of larger nanoclusters. Thus, establishing the accuracy of lower-cost methods like INDO/CIS is valuable to extend the study of CTP states to larger nanoclusters in the future. Another major advantage of the INDO Hamiltonian is that because of the mathematical simplicity of the method, it is straightforward to quantify the CTP character of each excited state, as detailed in the Computational methods section. In our formulation, the CTP character is the imbalance of positive and negative transition density within a single nanowire in the dimer, and we assume that the CTP and BDP characters sum to 100%.
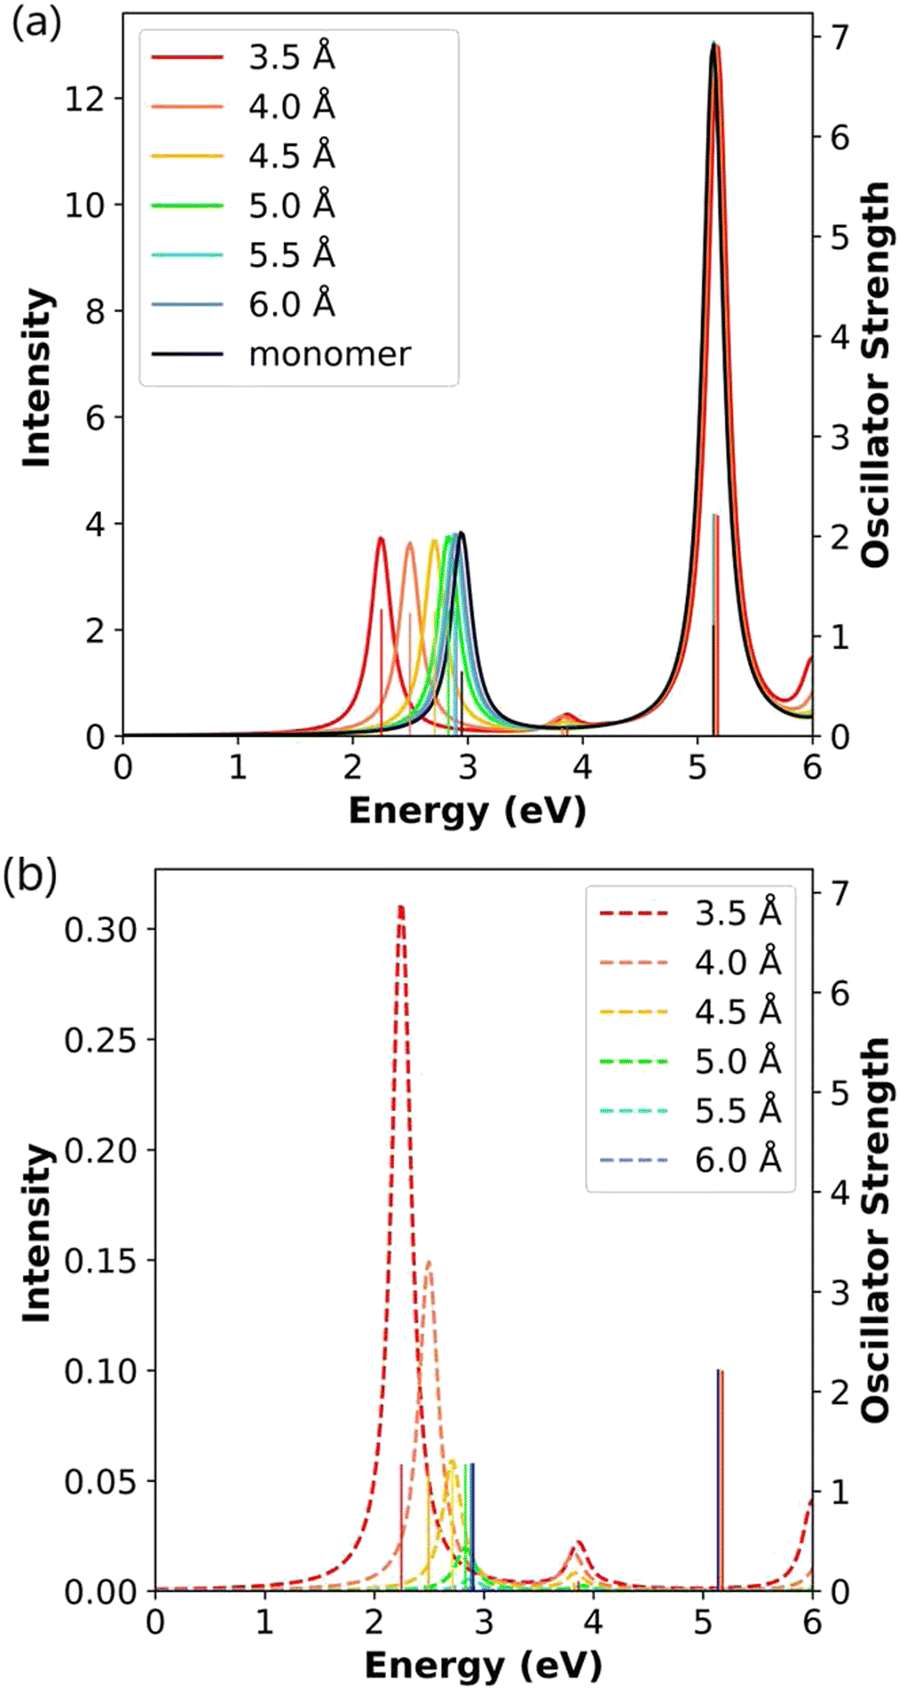 | ||
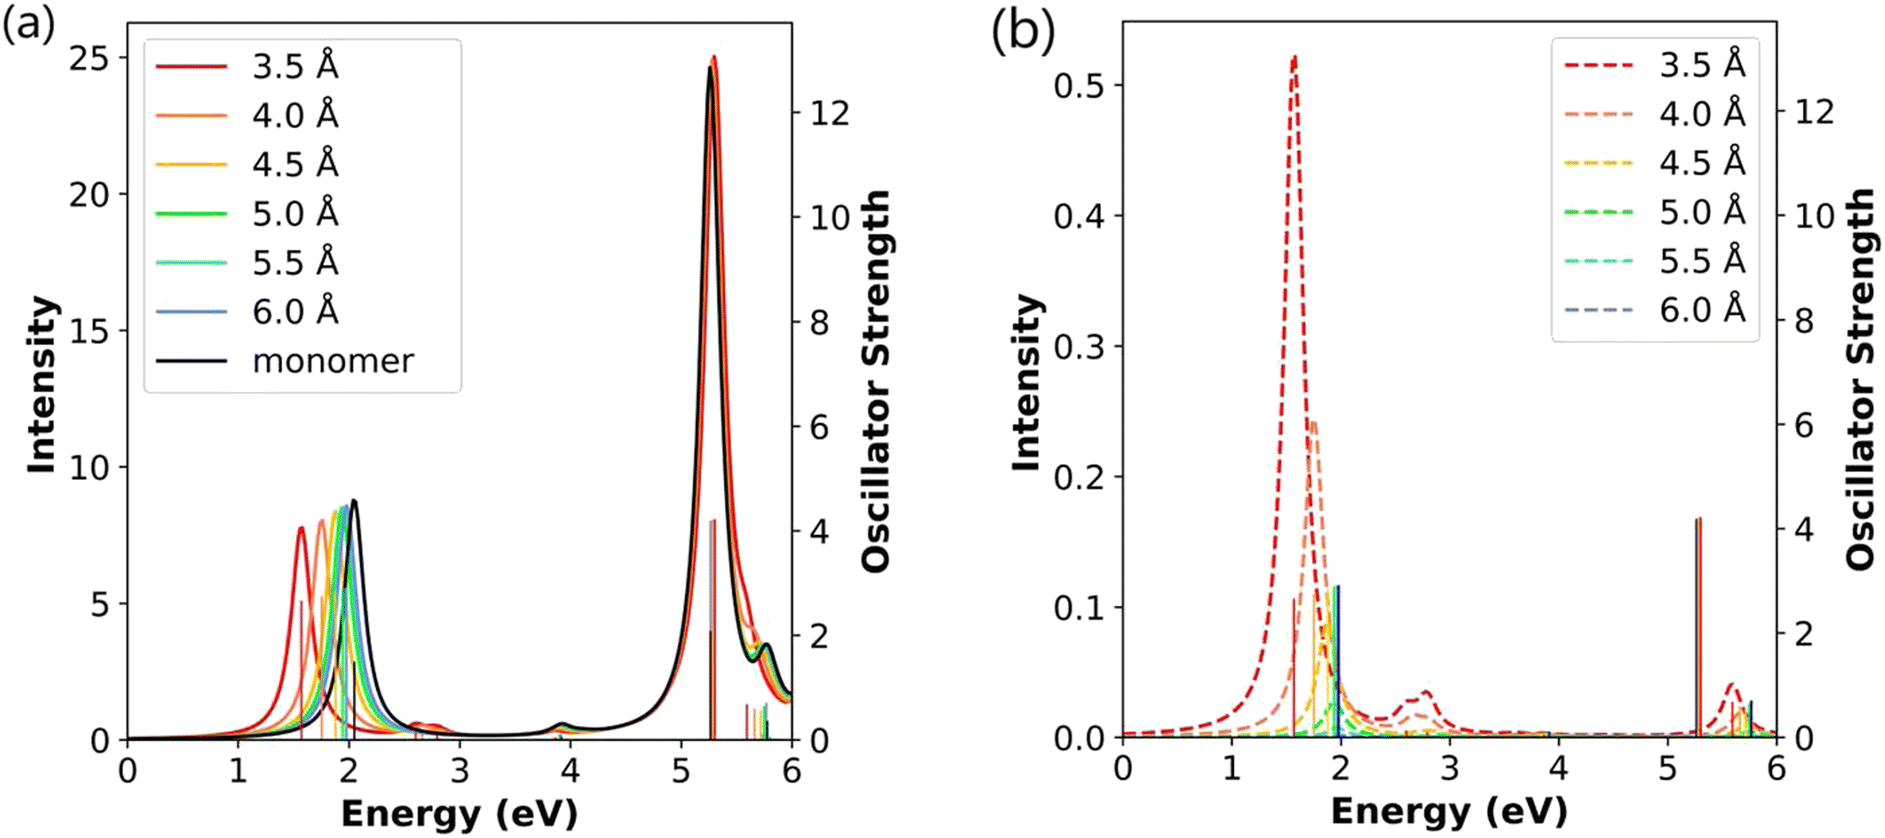
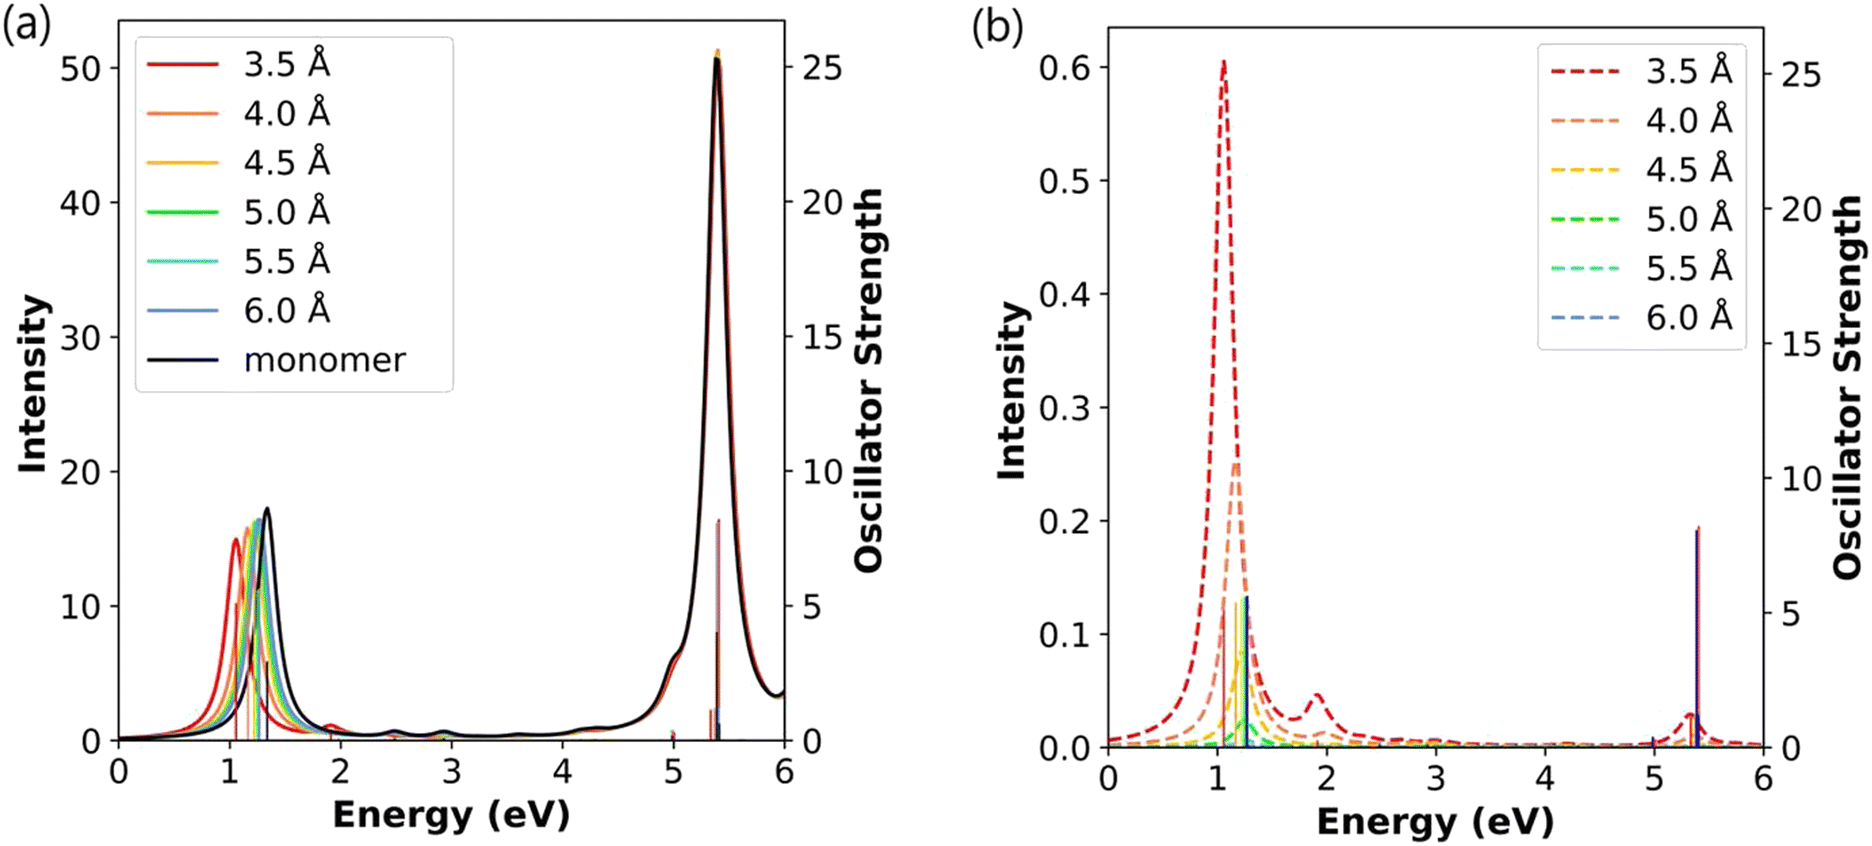
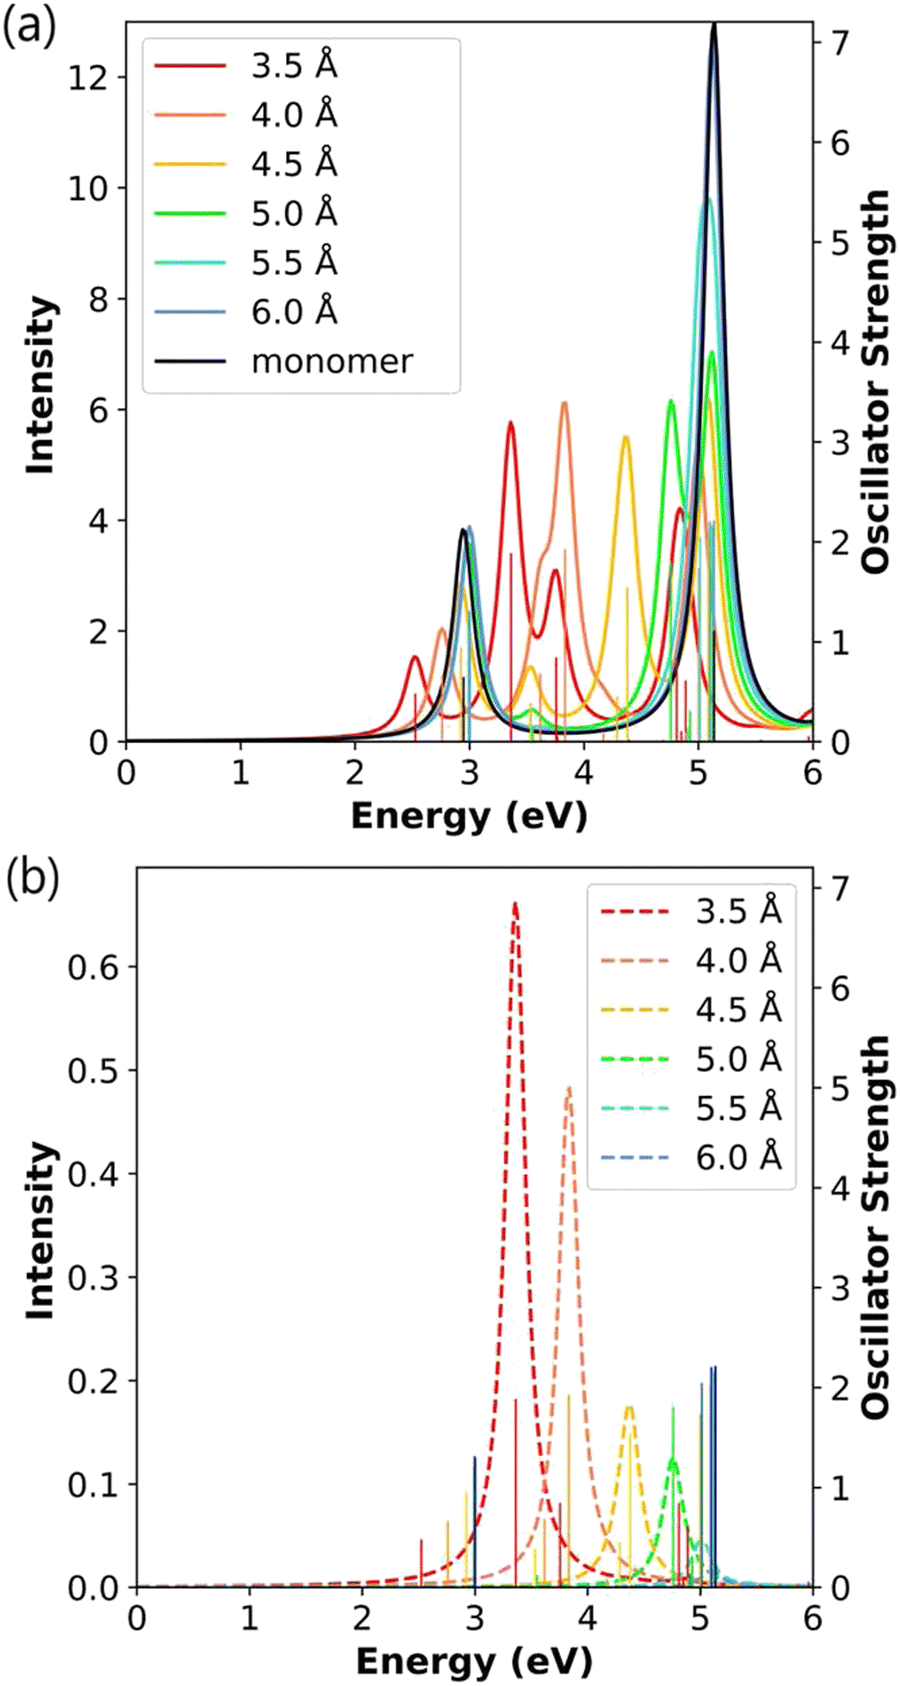
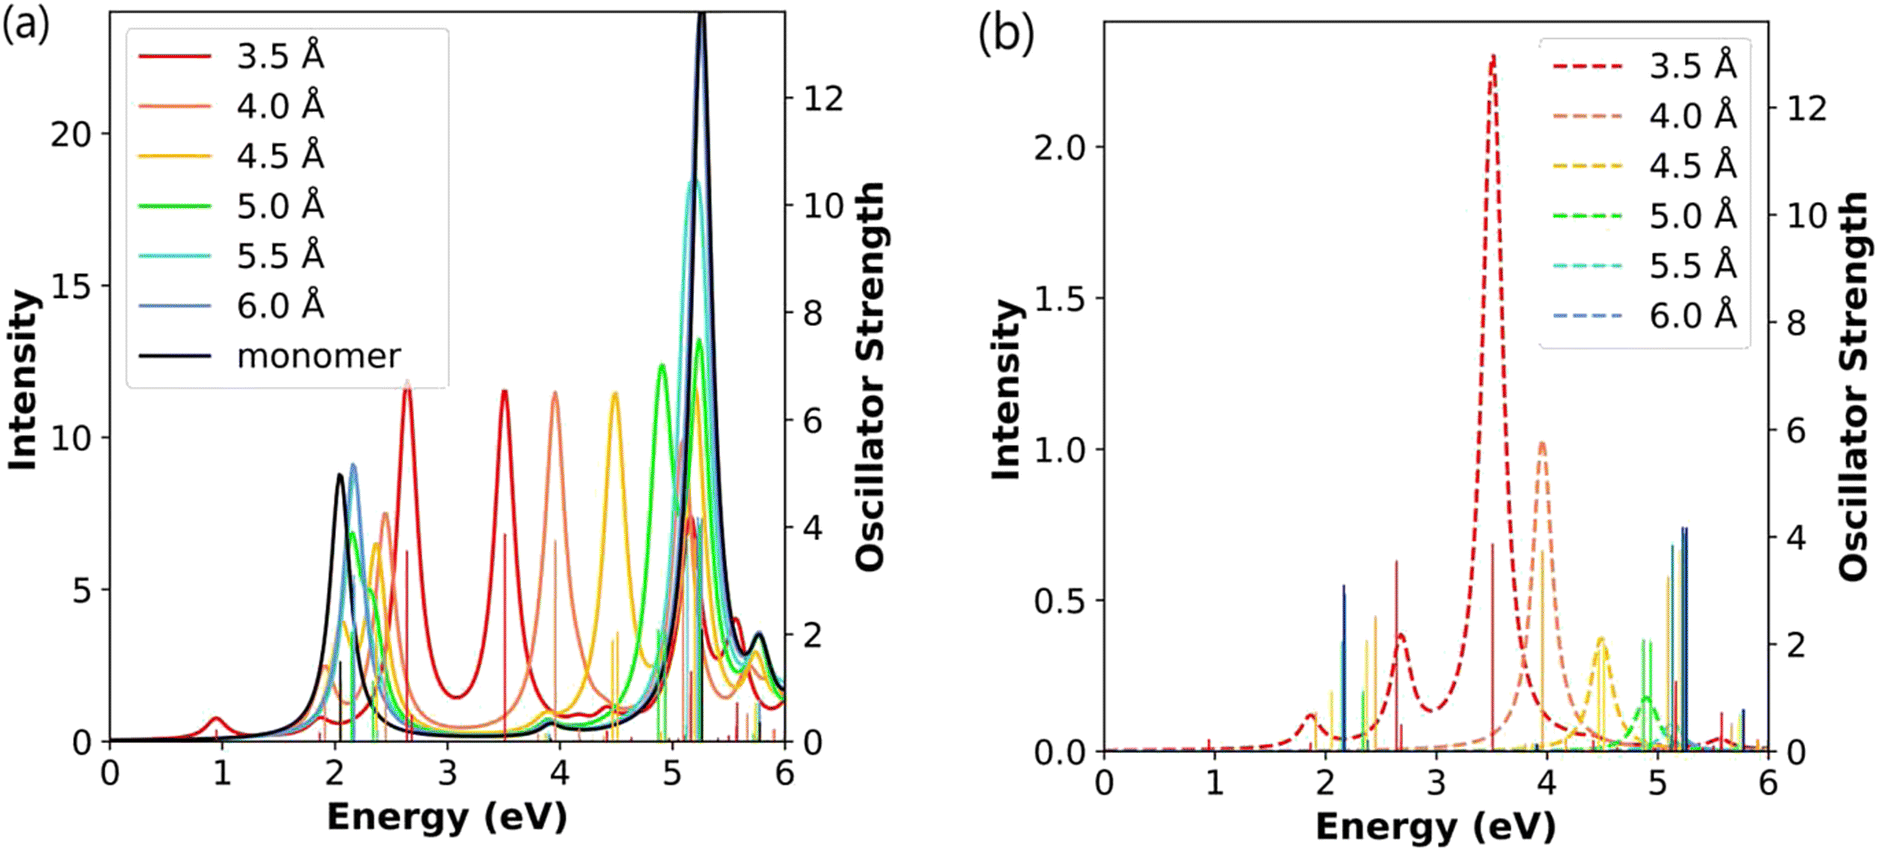
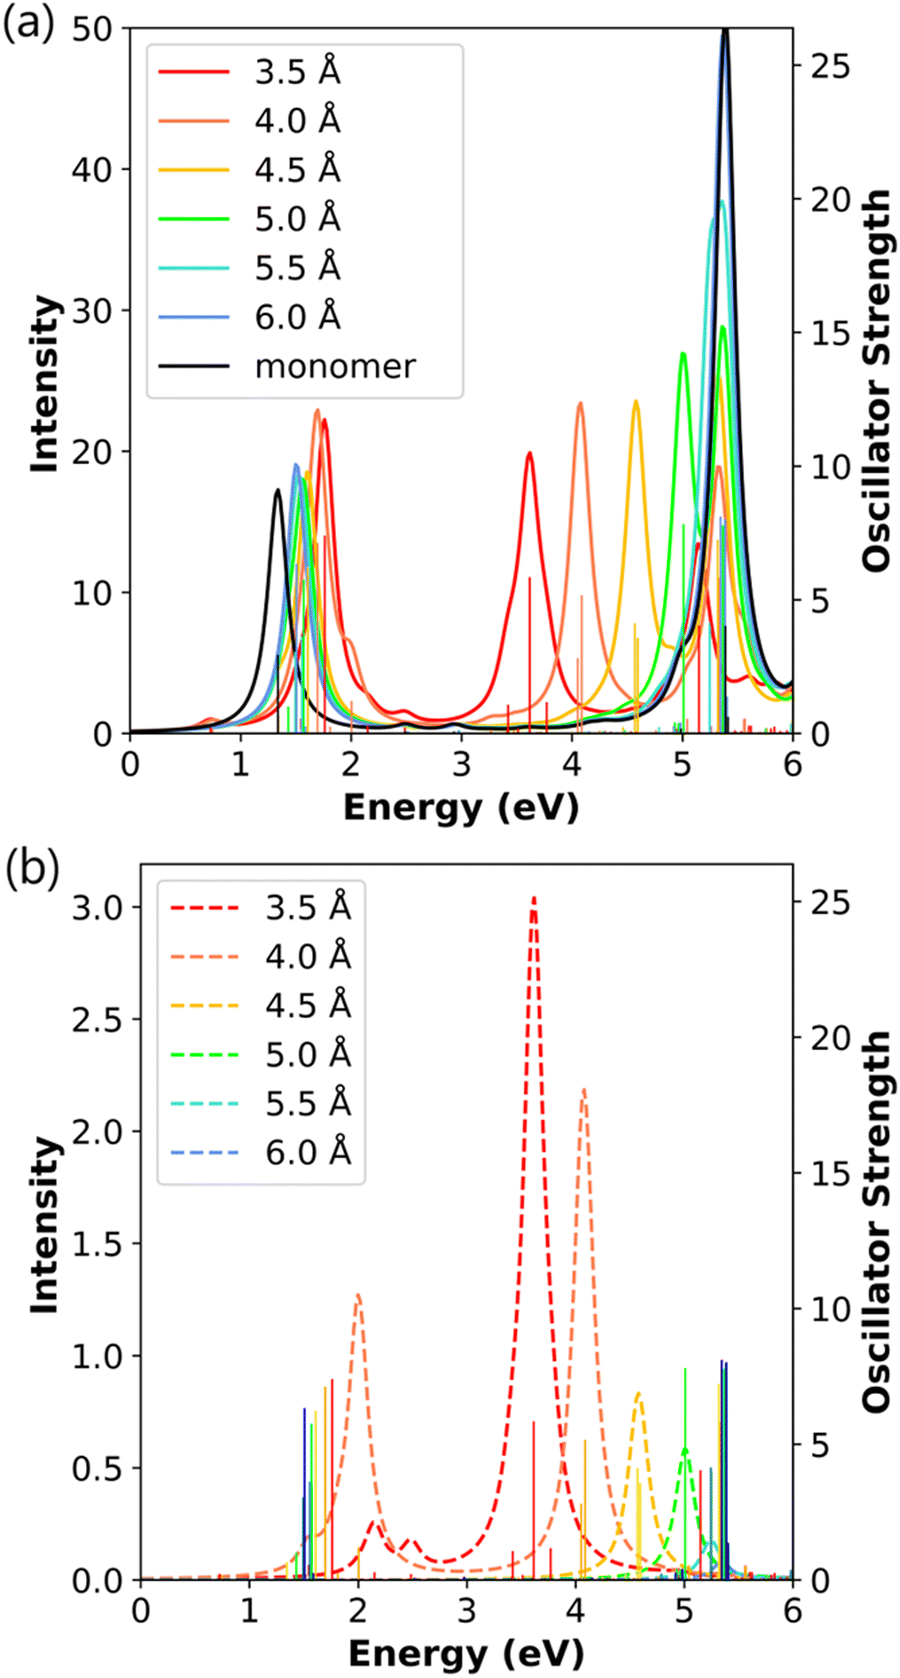
| Fig. 4 (a) Absorption spectra and (b) CTP absorption spectra of the end-to-end Ag2 nanowire dimers at the INDO/CIS level. The absorption intensity of the monomer is doubled to represent the intensity for two isolated monomers. In both panels, the sticks indicate the oscillator strength of each excited state. | ||
The CTP absorption spectra (Fig. 4b) are computed as the product of oscillator strength and CTP character to provide an overview of the contribution of the CTP states to the total absorption spectrum. To enable comparison between the total and CTP absorption intensities within the same panel, the sticks representing the oscillator strengths are not scaled based on their CTP character. In these spectra, the longitudinal states between 2.25 eV and 2.90 eV have the largest CTP absorption intensities, and the states at 3.86–4.06 eV also have some CTP character. As the distance between the monomers increases, the CTP absorption intensity approaches zero, which likewise suggests that the 6.0 Å-separated dimer behaves like two independent nanowires. Because of symmetry constraints, only the excited states with longitudinal transition dipole moments can have non-zero CTP character; thus, the transverse states have no CTP absorption.
To evaluate the detailed evolution of the CTP character, we examine the longitudinal excited states and their transition densities (Table 1). At the shortest interparticle distance of 3.5 Å, the main (lower energy) longitudinal state has 8.43% CTP character, and the weakly absorbing state has 7.11% CTP character. This shows that the stronger CTP absorption for the lower-energy state in Fig. 4b is primarily due to the large difference in oscillator strength, not CTP character. For the main longitudinal state, the CTP character decreases by more than 50% for each 0.5 Å increase in separation distance, and the CTP character approaches zero at large separation distances (Table 1). These values can also be seen in the decreasing CTP absorption intensity with increasing separation distance (Fig. 4b). The transition densities in Table 1 show the same trend. At the shortest distance, the transition density of the main absorbing state has an unbalanced distribution on each nanowire indicating partial CTP character, with the lobe on the outer atom larger than the lobe on the inner atom. As the distance increases, the transition density becomes more symmetrically distributed on each nanowire, indicating a transition from partial CTP character to nearly pure BDP character. Interestingly, the CTP character of the higher-energy weakly absorbing state decays much more slowly than that of the main absorbing state. The slower decay is due to a combination of two factors: the transition density maintains more visible asymmetry, which means that ρsurplus is staying reasonably large, and the overall transition density becomes smaller, meaning that ρtotal is becoming smaller.
| Distance (Å) | Energy (eV) | Oscillator strength (f) | CTP character (%) | Transition density |
|---|---|---|---|---|
| 3.5 | 2.25 | 1.269 | 8.43 | 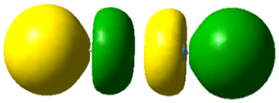 |
| 3.86 | 0.099 | 7.11 | 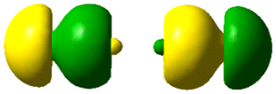 |
|
| 4.0 | 2.50 | 1.232 | 4.14 | 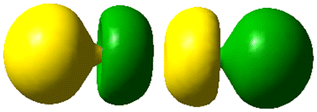 |
| 3.82 | 0.086 | 6.42 | 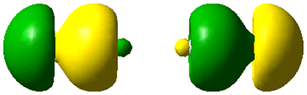 |
|
| 4.5 | 2.71 | 1.251 | 1.62 | 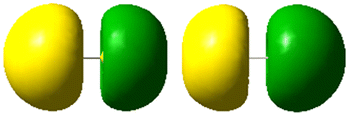 |
| 3.84 | 0.045 | 5.75 | 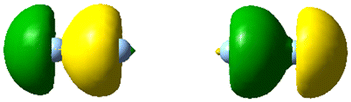 |
|
| 5.0 | 2.83 | 1.274 | 0.52 |  |
| 3.90 | 0.014 | 5.19 |  |
|
| 5.5 | 2.88 | 1.282 | 0.15 |  |
| 3.99 | 0.003 | 4.52 |  |
|
| 6.0 | 2.90 | 1.285 | 0.03 |  |
| 4.06 | 0.001 | 3.88 |  |
We can understand these changes by examining the molecular orbital contributions to each excited state. The frontier MOs of the nanowire dimers are composed primarily of the Ag 5s atomic orbitals; the HOMO and HOMO−1 of the combined system have bonding character within each nanowire, whereas the LUMO and LUMO+1 have antibonding character within each nanowire. HOMO and LUMO have larger density on the terminal Ag atoms, whereas the HOMO−1 and LUMO+1 have larger density on the central Ag atoms. As the distance between the nanowires increases, the MOs become more evenly distributed between the atoms.
For each excited state, the CTP character is based on the CTP character of the component single-particle transitions. The strongly absorbing excited state has primarily HOMO → LUMO character, plus a smaller HOMO−1 → LUMO+1 contribution that becomes more significant for larger separation distances (Table 2). Since the HOMO and LUMO are both localized primarily on the outer Ag atoms, the transition density on the outer Ag atoms is much larger than on the central Ag atoms, leading to a relatively large CTP character at small separation distances. In contrast, the HOMO−1 → LUMO+1 transition has larger transition densities on the central Ag atoms than on the outer atoms. As the separation distance increases, the transition density within each nanowire becomes more symmetric and the CTP character decreases because of two factors: (1) the MOs become more symmetric, and (2) the increasing HOMO−1 → LUMO+1 contribution leads to cancellation of the residual asymmetry in the transition density.
| Distance (Å) | Energy (eV) | Transition | Weight (%) | CTP character (%) |
|---|---|---|---|---|
| 3.5 | 2.25 | HOMO → LUMO | 94.1 | 13.68 |
| HOMO−1 → LUMO+1 | 3.0 | 9.64 | ||
| 3.86 | HOMO−1 → LUMO+1 | 76.2 | 9.64 | |
| HOMO → LUMO+2 | 16.9 | 4.57 | ||
| 4.0 | 2.50 | HOMO → LUMO | 89.6 | 8.20 |
| HOMO−1 → LUMO+1 | 6.8 | 6.47 | ||
| 3.82 | HOMO−1 → LUMO+1 | 79.3 | 6.47 | |
| HOMO → LUMO+2 | 10.6 | 3.50 | ||
| HOMO → LUMO | 6.0 | 8.20 | ||
| 4.5 | 2.71 | HOMO → LUMO | 80.2 | 4.54 |
| HOMO−1 → LUMO+1 | 15.5 | 3.90 | ||
| 3.84 | HOMO−1 → LUMO+1 | 75.6 | 3.90 | |
| HOMO → LUMO | 15.3 | 4.56 | ||
| HOMO → LUMO+2 | 6.2 | 2.39 | ||
| 5.0 | 2.83 | HOMO → LUMO | 68.3 | 2.44 |
| HOMO−1 → LUMO+1 | 26.9 | 2.22 | ||
| 3.90 | HOMO−1 → LUMO+1 | 67.3 | 2.22 | |
| HOMO → LUMO | 27.7 | 2.44 | ||
| 5.5 | 2.88 | HOMO → LUMO | 58.7 | 2.33 |
| HOMO−1 → LUMO+1 | 36.2 | 2.28 | ||
| 3.99 | HOMO−1 → LUMO+1 | 59.8 | 2.28 | |
| HOMO → LUMO | 37.8 | 2.33 | ||
| 6.0 | 2.90 | HOMO → LUMO | 53.0 | 2.51 |
| HOMO−1 → LUMO+1 | 41.8 | 2.49 | ||
| 4.06 | HOMO−1 → LUMO+1 | 55.0 | 2.49 | |
| HOMO → LUMO | 44.0 | 2.51 |
We now examine the Ag4 end-to-end dimer to understand the evolution of the CTP character with nanowire length. Similar to the Ag2 dimers, the absorption spectra of the Ag4 dimers all have one strong longitudinal absorption peak and one strong transverse absorption peak (Fig. 5a). The longitudinal peaks are shifted to lower energies at short separation distances, whereas the transverse peak position is nearly unaffected by the formation of the Ag4 dimer. The longitudinal peaks in the Ag4 dimers have lower energies than the corresponding the Ag2 dimers by nearly 1.00 eV, whereas the transverse peaks are quite similar in energy. The oscillator strengths for both the longitudinal and transverse peaks in the Ag4 dimers are approximately twice as large as those in the Ag2 dimers. Formation of the dimer also introduces a very weakly absorbing broad longitudinal peak around 2.60–3.00 eV and a higher energy weak longitudinal peak between 5.50–5.90 eV.
 | ||
| Fig. 5 (a) Absorption spectra and (b) CTP absorption spectra of the end-to-end Ag4 nanowire dimers at the INDO/CIS level. The absorption intensity of the monomer is doubled to represent the intensity for two isolated monomers. In both panels, the sticks indicate the oscillator strength of each excited state. | ||
Examining these excited states in more detail, the broad peak around 2.60–3.00 eV is composed of two weakly absorbing states; these states have oscillator strengths of zero at a gap distance of 6.0 Å, so are excluded from Table 3 for the 6.0 Å system. The longitudinal peak around 5.50–5.90 eV is visible in the CTP absorption spectrum in Fig. 5b; however, since its CTP character is below 3% for all interparticle distances, this state is not included in Table 3. At the shortest separation distance of 3.5 Å, the main absorbing state has a CTP character of 6.76%, which is smaller than the CTP character for the equivalent state (8.43%) in the corresponding Ag2 dimer. For all distances, the CTP character of the main longitudinal state in the Ag4 dimer systems is smaller than that of the corresponding Ag2 dimer. Similar to the Ag2 dimers, the CTP character of all longitudinal states decreases with increasing gap distance, and the CTP character of the strongly absorbing state decays more quickly than those of the higher-energy states. This can be seen by the drastic decrease in CTP absorption intensity with length in Fig. 5b. This trend is also visible in the transition densities, which show significant asymmetry within each nanowire at short separation distances but become more symmetric as the nanowires are moved farther apart (Table 3).
| Distance (Å) | Energy (eV) | Oscillator strength (f) | CTP character (%) | Transition density |
|---|---|---|---|---|
| 3.5 | 1.57 | 2.660 | 6.76 |  |
| 2.60 | 0.133 | 3.91 |  |
|
| 2.79 | 0.106 | 8.64 |  |
|
| 4.0 | 1.75 | 2.742 | 3.05 | 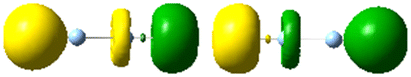 |
| 2.66 | 0.107 | 3.41 | 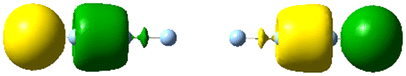 |
|
| 2.81 | 0.044 | 6.68 | 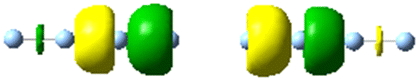 |
|
| 4.5 | 1.88 | 2.845 | 1.07 | 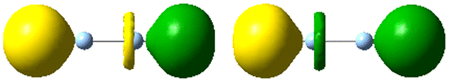 |
| 2.72 | 0.035 | 1.77 | 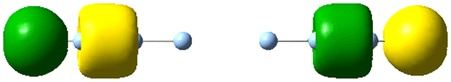 |
|
| 2.84 | 0.020 | 5.82 | 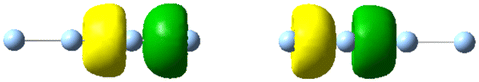 |
|
| 5.0 | 1.94 | 2.891 | 0.32 | 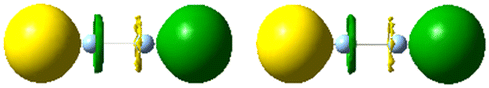 |
| 2.76 | 0.007 | 0.52 | 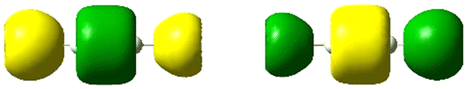 |
|
| 2.89 | 0.007 | 6.71 |  |
|
| 5.5 | 1.97 | 2.908 | 0.09 |  |
| 2.78 | 0.002 | 0.11 | 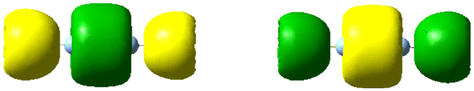 |
|
| 2.95 | 0.001 | 6.78 | 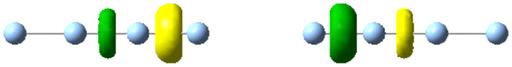 |
|
| 6.0 | 1.98 | 2.918 | 0.02 | 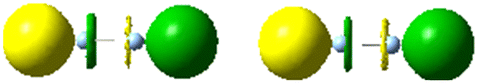 |
The breakdown of longitudinal excited states into pure transitions for the Ag4 end-to-end dimers is listed in Table S1 in the ESI.† The strongly absorbing state has predominantly HOMO → LUMO character and a smaller contribution from the HOMO−1 → LUMO+1 excitation that increases in weight with increasing separation distance. Similar to the Ag2 dimers, as the separation distance increases, all of the MOs become more symmetrically distributed within each nanowire, leading to the decay in the CTP character of both excited states. For the strongly absorbing state, cancellation in the CTP character between the two main excitations causes the CTP character of the excited state to decay more quickly than the CTP character of the two major component excitations, consistent with the Ag2 dimer results.
Increasing the nanowire length further, the Ag8 end-to-end dimers show similar trends to the dimers of shorter nanowires (Fig. 6a). At short separation distances, the longitudinal absorption peak is shifted to lower energy; however, this shift is smaller than that seen in the shorter nanowires. Even at the shortest separation distance of 3.5 Å, the longitudinal peak is only shifted by 0.28 eV relative to the Ag8 monomer. Previous TDDFT studies showed a similar decrease in energy for the main longitudinal peak with increasing separation distance.19 Similar to the other dimers, the Ag8 dimer also has a much weaker longitudinal absorption peak around 1.91–2.10 eV. The transverse peak is again nearly unaffected by the formation of the dimer.
 | ||
| Fig. 6 (a) Absorption spectra and (b) CTP absorption spectra of the end-to-end Ag8 nanowire dimers at the INDO/CIS level. The absorption intensity of the monomer is doubled to represent the intensity for two isolated monomers. In both panels, the sticks indicate the oscillator strength of each excited state. | ||
As in the end-to-end dimers of the shorter nanowires, the CTP characters of both longitudinal excited states decay as the distance between the two Ag8 nanowires increases (Table 4). At the shortest distance of 3.5 Å, the CTP character of the main absorbing state for the Ag8 dimer (4.05%) is smaller than for the shorter nanowire dimers (8.43% for Ag2 and 6.76% for Ag4); in contrast, the weakly absorbing state has a slightly larger CTP character in the Ag8 dimer than in the Ag4 dimer. As in the shorter nanowires, the CTP character of the strongly absorbing state decays more quickly with increasing distance than that of the weakly absorbing state. As a result, the general trend of the CTP absorption peaks of the Ag8 dimers (Fig. 6b) very much resembles those of the shorter dimers. Previous TDDFT work also found that this longitudinal state has CTP character at separations below 7.0 Å for Ag8 dimers19 and for Ag10 dimers,21 which is a slightly longer distance than where the CTP character disappears at the INDO/CIS level. This difference may be because the minimal basis set in INDO/CIS means that the orbital overlaps approach zero at shorter distances than the DZ basis set used in the TDDFT studies. However, these studies did not attempt to quantify the CTP character for the longitudinal state or examine how CTP character changes with separation distance.
| Distance (Å) | Energy (eV) | Oscillator strength (f) | CTP character (%) | Transition density |
|---|---|---|---|---|
| 3.5 | 1.06 | 5.096 | 4.05 |  |
| 1.91 | 0.266 | 4.50 |  |
|
| 4.0 | 1.16 | 5.383 | 1.61 |  |
| 1.98 | 0.106 | 2.56 |  |
|
| 4.5 | 1.22 | 5.525 | 0.52 |  |
| 2.04 | 0.031 | 0.91 |  |
|
| 5.0 | 1.25 | 5.579 | 0.15 |  |
| 2.06 | 0.013 | 0.24 | 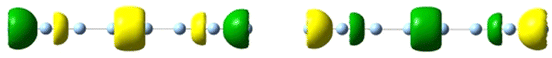 |
|
| 5.5 | 1.26 | 5.609 | 0.04 |  |
| 6.0 | 1.27 | 5.632 | 0.01 |  |
The composition of the two main longitudinal excited states in the Ag8 dimers is similar to that of the shorter nanowire dimers (Table S2, ESI†). The main absorbing state has primarily HOMO → LUMO character, with a smaller HOMO−1 → LUMO+1 contribution that increases in weight with increasing separation distance. The weakly absorbing state has primarily HOMO−2 → LUMO character, with smaller contributions from several other excitations within the sp band. The CTP characters of the pure transitions continue to decrease with increasing nanowire length. Since the contact area of the end-to-end dimer remains the same regardless of the nanowire length, the contact area is a smaller proportion of the total nanowire surface area for the longer nanowires. Thus, it is unsurprising that dimer formation causes a smaller asymmetry within each nanowire for the MOs as the length increases, leading to smaller CTP character for the pure transitions. For the main absorbing state, cancellation of the CTP characters of the component excitations further decreases the CTP character of the excited state. In contrast, the weakly absorbing state has weaker cancellation among the excitations and a CTP character more comparable to that of its component excitations.
 | ||
| Fig. 7 (a) Absorption spectra and (b) CTP absorption spectra of the side-by-side Ag2 nanowire dimers at the INDO/CIS level. The absorption intensity of the monomer is doubled to represent the intensity for two isolated monomers. In both panels, the sticks indicate the oscillator strength of each excited state. | ||
Although the absorption spectra are somewhat more complex, only one transverse state at each separation distance has appreciable CTP character (Fig. 7b). That state corresponds to the nanowire-to-nanowire transition. At the shortest separation distance of 3.5 Å, this state is at 3.36 eV and has a CTP character of 12.01% (Table 5). Like the end-to-end dimers, the transition density within each nanowire in the side-by-side dimer is visibly asymmetric at the shortest separation distance, which corresponds to large CTP character; as the distance increases, the transition density becomes more symmetric, corresponding to a decrease in CTP character. As the separation distance increases from 3.5 to 6.0 Å, the energy of this state increases, and its CTP character decreases from 12.01% to 0.25%. The decline in CTP character with increasing distance is less abrupt and somewhat less consistent than in the end-to-end dimers, with decreases of 30–70% for each distance step. The side-by-side geometry generally has larger CTP character than the corresponding end-to-end geometry, which is unsurprising since the side-by-side nanowires have a larger surface area where they interact.
| Distance (Å) | Energy (eV) | Oscillator strength (f) | CTP character (%) | Transition density |
|---|---|---|---|---|
| 3.5 | 3.36 | 1.887 | 12.01 |  |
| 4.0 | 3.83 | 1.929 | 8.58 |  |
| 4.5 | 4.38 | 1.543 | 3.61 | 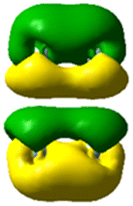 |
| 5.0 | 4.76 | 1.804 | 2.34 | 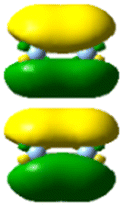 |
| 5.5 | 5.01 | 2.046 | 0.76 | 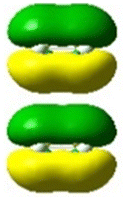 |
| 6.0 | 5.10 | 2.204 | 0.25 | 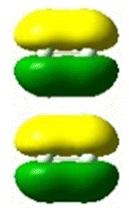 |
Similar to the end-to-end case, we can decompose the main transverse states into pure transitions. In isolated Ag nanowires, the transverse excited states correspond primarily to transitions from σ-type to π-type MOs. In the side-by-side dimers, the MOs are linear combinations of the isolated nanowire MOs. The main transverse excited state corresponds primarily to a transition from the HOMO, which has σ-type character within each nanowire and an antibonding interaction between the two nanowires, into an MO with π-type character within each nanowire and bonding character between the two nanowires (Table 6). Although the π-type MO shifts from LUMO+2 to LUMO+4 with increasing separation distance, the orbital character is largely consistent. At large separation distances, other transitions from σ-type to π-type MOs or from the d band into the sp band also have non-negligible contributions. The coupling of these transitions leads to partial cancellation of their CTP characters, such that the total CTP character of the excited state is lower than that of the major component transitions.
| Distance (Å) | Energy (eV) | Transition | Weight (%) | CTP character (%) |
|---|---|---|---|---|
| 3.5 | 3.36 | HOMO → LUMO+2 | 96.8 | 17.74 |
| 4.0 | 3.83 | HOMO → LUMO+2 | 95.0 | 11.39 |
| 4.5 | 4.38 | HOMO → LUMO+2 | 68.0 | 10.25 |
| HOMO−2 → LUMO | 9.5 | 1.33 | ||
| HOMO → LUMO+3 | 8.5 | 0.39 | ||
| HOMO−3 → LUMO+1 | 7.0 | 1.11 | ||
| 5.0 | 4.76 | HOMO → LUMO+2 | 78.1 | 6.26 |
| HOMO−1 → LUMO+7 | 11.7 | 6.90 | ||
| HOMO−3 → LUMO+1 | 10.9 | 0.56 | ||
| 5.5 | 5.01 | HOMO → LUMO+4 | 63.1 | 3.89 |
| HOMO−1 → LUMO+7 | 19.6 | 4.07 | ||
| HOMO−4 → LUMO | 8.2 | 0.28 | ||
| HOMO−7 → LUMO+1 | 7.5 | 0.26 | ||
| 6.0 | 5.10 | HOMO → LUMO+4 | 61.0 | 2.19 |
| HOMO−1 → LUMO+7 | 33.0 | 2.21 |
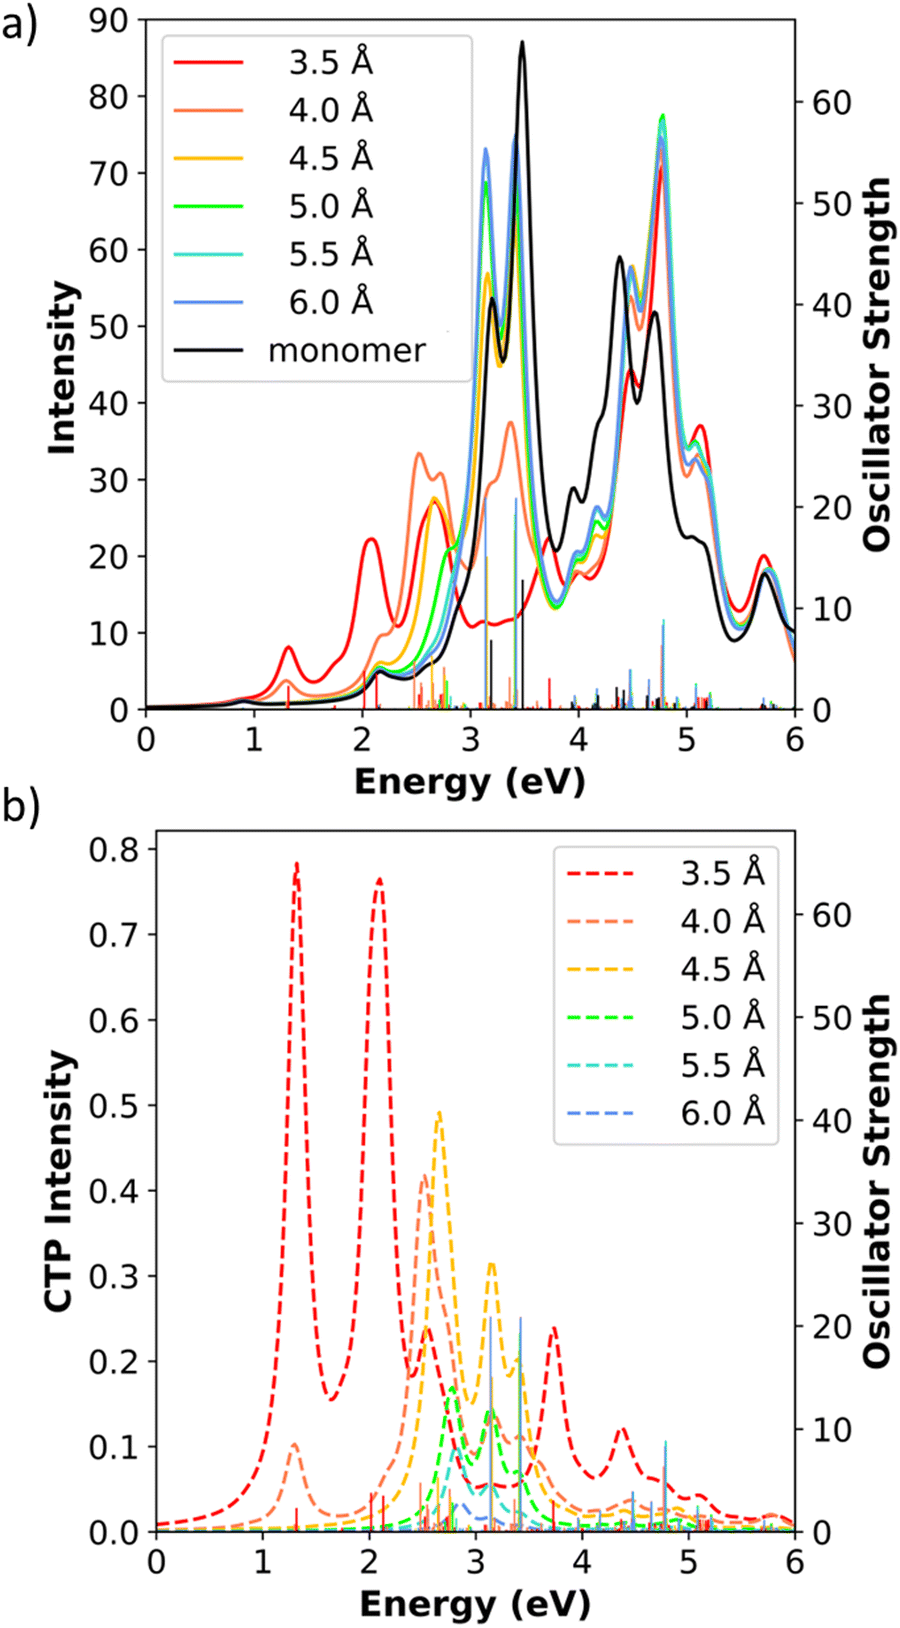
For the Ag4 side-by-side dimers, the absorption spectra similarly have multiple longitudinal and transverse peaks (Fig. 8a). As in the Ag2 dimers, there are two main transverse absorption peaks: the lower-energy peak transverse state ranging in energy from 3.51 eV to 5.22 eV has its transition dipole moment oriented along the nanowire-to-nanowire axis, whereas the higher-energy state has its transition dipole moment oriented out of plane. Both peaks shift to higher energy as the separation distance increases, converging to an energy comparable to that of the isolated Ag4 nanowire. At a separation distance of 3.5 Å, there are also lower-energy transverse states with weak absorption at 1.86 eV and 2.68 eV. Similar to the Ag2 side-by-side dimer, the longitudinal absorption peak is split between two excited states, which are at 0.94 eV and 2.64 eV at a separation distance of 3.5 Å. At this distance, the higher-energy peak is strongly absorbing, and the lower-energy peak has very weak absorption. As the distance between the nanowires increases, the energy gap between the two absorption peaks decreases, and the absorption intensity shifts from the higher-energy state into the lower-energy state. Previous TDDFT results for the side-by-side Ag4 nanowire dimers found CTP states between 4.0 eV and 5.0 eV that decrease in both energy and absorption intensity as the separation distance increases.20 Our INDO/CIS spectra have CTP peaks in a slightly larger energy range (3.51–5.22 eV) that similarly decrease in energy with increasing separation distance, though the change in intensity is somewhat smaller for INDO/CIS. Our INDO/CIS results also agree with TDDFT that the higher energy out-of-plane transverse peaks appear in the 5–6 eV range with intensities that increase as the separation distance increases.20
 | ||
| Fig. 8 (a) Absorption spectra and (b) CTP absorption spectra of the side-by-side Ag4 nanowire dimers at the INDO/CIS level. The absorption intensity of the monomer is doubled to represent the intensity for two isolated monomers. In both panels, the sticks indicate the oscillator strength of each excited state. | ||
At the shortest separation of 3.5 Å, the side-by-side Ag4 dimer has three excited states with >20% CTP character, which are main transverse absorbing state and two lower-energy states with weak absorption (Table 7); this leads to three peaks in the CTP absorption spectrum (Fig. 8b). This large CTP character results from significant mixing of p orbitals with their nodes perpendicular to the nanowire-to-nanowire axis into the frontier molecular orbitals. The large CTP character is also visible in the transition densities, which show that one nanowire has primarily positive transition density and the other nanowire has primarily negative transition density. Although the transition density plots may seem to imply that the CTP characters should be much larger than 20%, this is a result of several simplifications. First, the CTP character is computed using the ZDO, whereas the transition density plots have substantial cancellation of the overlapping atomic orbital lobes between the nanowires. The TDDFT transition densities are less visibly asymmetric,20 which suggests that the ZDO has a significant effect on the visual appearance of our transition densities. In addition, since the transition densities are plotted using a single isovalue, the smaller lobes with opposite sign are not always visible. For these reasons, we expect the computed CTP character yield more reliable trends than visual analysis of the transition densities. Since previous TDDFT work only examined the main in-plane transverse peak for CTP character,20 a direct comparison of the weaker transverse states is not feasible.
| Distance (Å) | Energy (eV) | Oscillator strength (f) | CTP character (%) | Transition density |
|---|---|---|---|---|
| 3.5 | 1.86 | 0.166 | 21.32 |  |
| 2.68 | 0.503 | 23.45 | 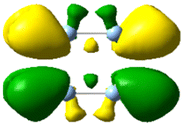 |
|
| 3.51 | 3.874 | 20.39 |  |
|
| 4.42 | 0.208 | 3.04 |  |
|
| 5.57 | 0.294 | 3.88 |  |
|
| 4.0 | 3.96 | 3.747 | 9.39 | 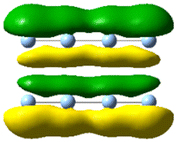 |
| 4.17 | 0.251 | 2.11 | 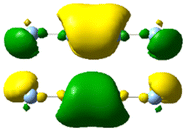 |
|
| 4.5 | 4.47 | 1.893 | 3.28 | 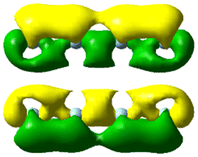 |
| 4.51 | 2.042 | 3.48 | 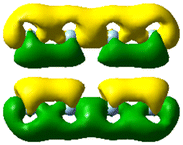 |
|
| 5.0 | 4.87 | 2.092 | 1.79 | 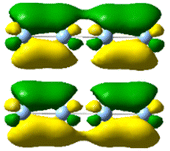 |
| 4.94 | 2.037 | 1.36 | 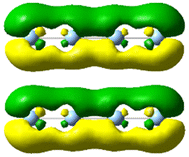 |
|
| 5.5 | 5.13 | 3.850 | 0.82 | 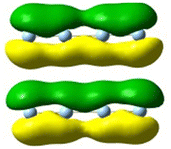 |
| 6.0 | 5.22 | 4.185 | 0.30 | 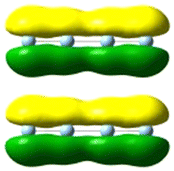 |
When the separation distance increases from 3.5 Å to 4.0 Å, the two low-energy weakly absorbing states have negligible CTP character, and the CTP character of the strongly absorbing state decreases by more than 50%. The CTP character of the main transverse state continues to decrease with increasing separation distance, similar to the Ag2 side-by-side dimer. In the side-by-side dimers, extending the nanowire length not only increases the number of excited states with significant CTP character at the shortest separation distances but also increases the CTP character of each excited state. This is a different pattern than was seen in the end-to-end dimers, where the CTP character decreased with increasing nanowire length. The difference is likely because of the differences in the contact area between the two nanowires: whereas the end-to-end dimers interact through one atom pair regardless of nanowire length, the side-by-side dimers interact through all atoms.
The decomposition of MO contributions to the CTP excited states is more complex for this system because the energetic ordering of the MOs changes significantly with separation distance and each state contains contributions from multiple different transitions (Table S3, ESI†). However, all of the excited states with significant CTP character primarily involve contributions from MOs with σ-type character within each nanowire to MOs with π-type character within each nanowire. At the shortest separation distance, all three of the excited states with large CTP character have contributions of >74% from one excitation and minor contributions from other excitations. As the separation distance increases, the excited states acquire more mixed character among several excitations. In the main absorbing state, similar to the end-to-end cases, the cancellation among the CTP character of the component excitations becomes more pronounced as the separation distance increases, contributing to the decay of its CTP character with increasing separation distance.
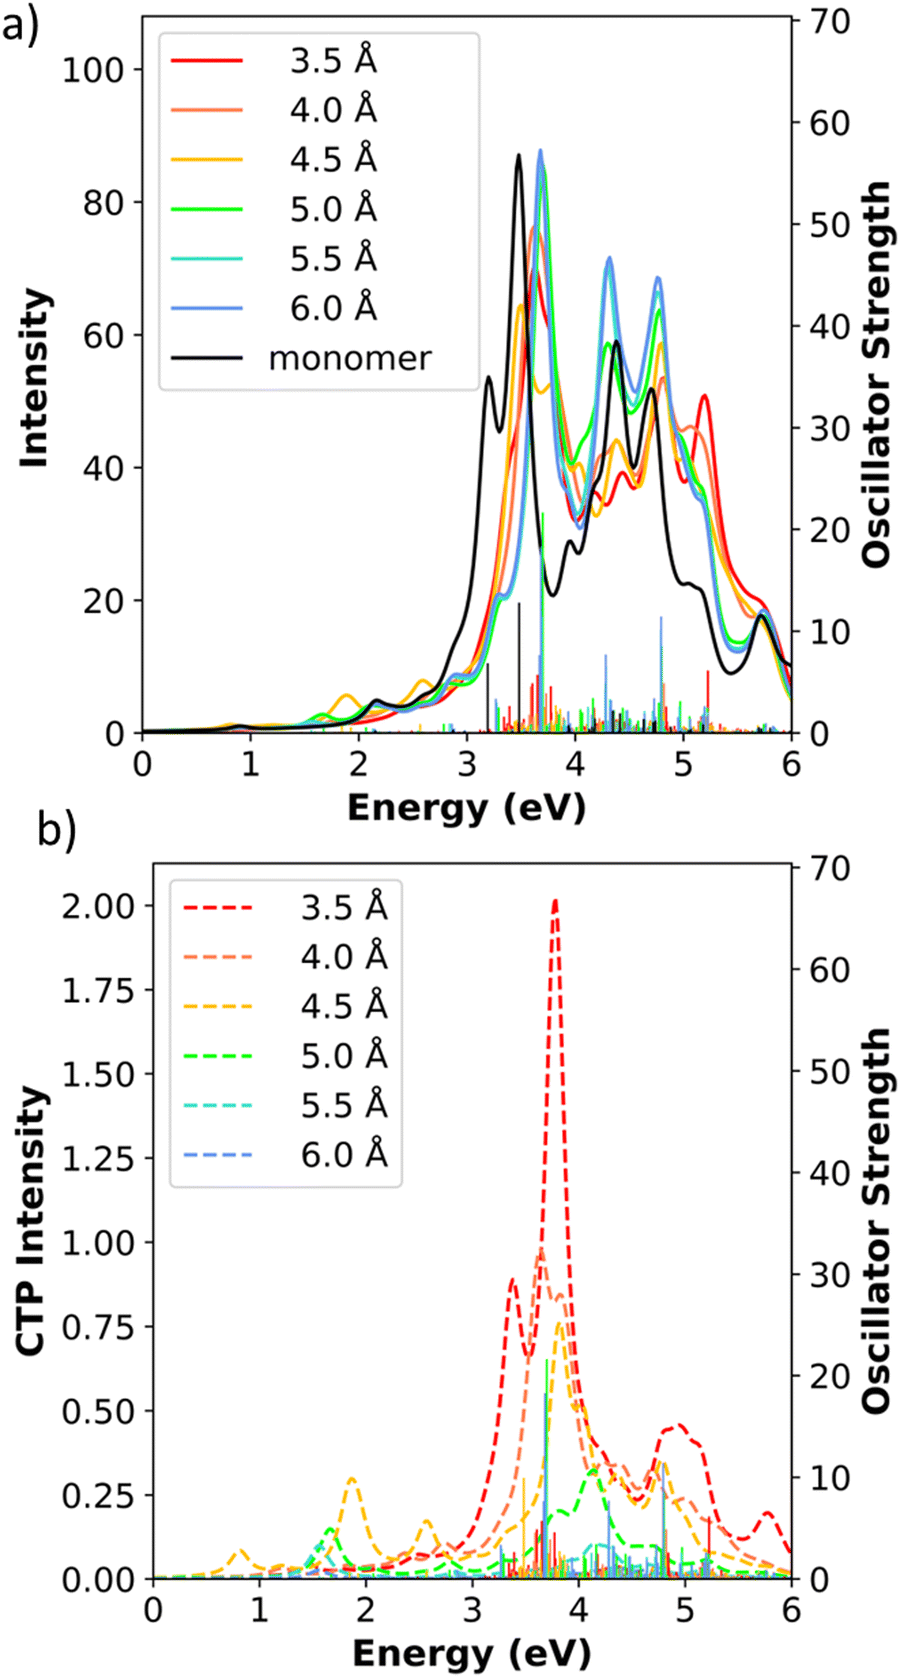
The absorption spectra of the side-by-side Ag8 dimers follow the same major trends as the shorter side-by-side dimers for both the transverse and longitudinal states (Fig. 9). At a distance of 3.5 Å, there are a total of five transverse states aligned along the nanowire-to-nanowire axis: two weakly absorbing states at 2.15 eV and 2.49 eV, and a grouping of three states between 3.40–3.80 eV that all contribute to one absorption peak. The longitudinal peak shifts lower in energy with increasing nanowire length, whereas the transverse peaks exhibit smaller changes; these trends are consistent with previously observed trends from TDDFT for the side-by-side dimers.20 Within this grouping of three states, the central state has both strong absorption and a large CTP character, and the two other states have weaker absorption and smaller CTP character (Table 8). As the distance increases to 4.0 Å, the CTP character in the main transverse absorption peak decreases as seen previously, but two low-energy CTP states have CTP characters over 20%. Interestingly, the state at 2.00 eV in the 4.0 Å system has CTP character of 34.64%, which is the largest value of any excited state seen to this point. When the separation distance increases beyond 4.0 Å, the low-energy transverse states lose nearly all of their CTP character, and the CTP character of the main transverse absorption peak continues to decrease similarly to the shorter side-by-side dimers. Similar to the Ag4 side-by-side dimer, the excited states with CTP character are composed of linear combinations of σ → π transitions (Table S4, ESI†). Since the longer nanowires have more possible σ → π transitions available, the excited states contain significant contributions from a larger number of component transitions. Previous TDDFT work revealed a similar increase in the energy of the CTP peak as the separation distance increases,20 although that work did not quantitatively analyze the CTP character.
 | ||
| Fig. 9 (a) Absorption spectra and (b) CTP absorption spectra of the side-by-side Ag8 nanowire dimers at the INDO/CIS level. The absorption intensity of the monomer is doubled to represent the intensity for two isolated monomers. In both panels, the sticks indicate the oscillator strength of each excited state. | ||
| Distance (Å) | Energy (eV) | Oscillator strength (f) | CTP character (%) | Transition density |
|---|---|---|---|---|
| 3.5 | 2.15 | 0.293 | 25.98 | 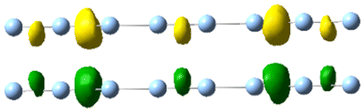 |
| 2.49 | 0.224 | 19.59 | 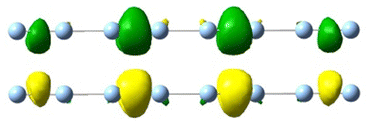 |
|
| 3.42 | 1.08 | 6.77 | 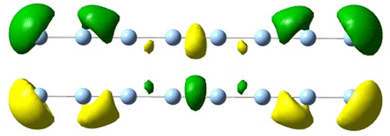 |
|
| 3.62 | 5.853 | 16.84 | 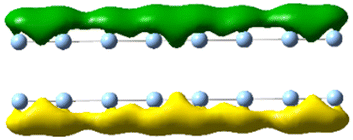 |
|
| 3.77 | 1.183 | 8.19 | 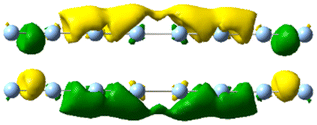 |
|
| 1.54 | 0.168 | 22.64 | 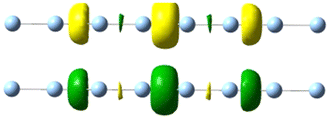 |
|
| 1.81 | 0.260 | 14.59 | 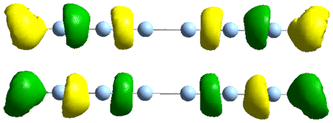 |
|
| 4.0 | 2.00 | 1.216 | 34.64 | 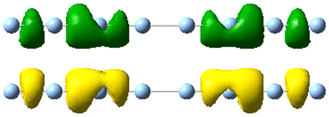 |
| 4.05 | 2.82 | 7.83 | 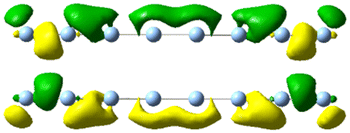 |
|
| 4.09 | 5.168 | 10.45 | 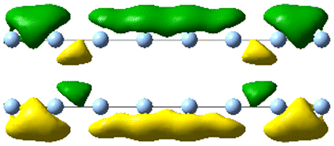 |
|
| 4.5 | 4.47 | 0.241 | 1.42 | 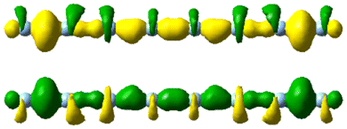 |
| 4.57 | 4.127 | 4.57 | 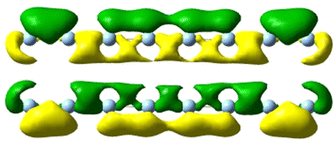 |
|
| 5.0 | 5.01 | 7.829 | 2.77 | 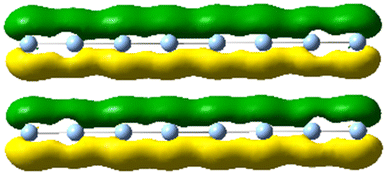 |
| 5.5 | 5.24 | 4.156 | 0.73 | 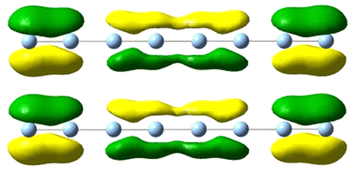 |
| 5.25 | 4.022 | 0.76 | 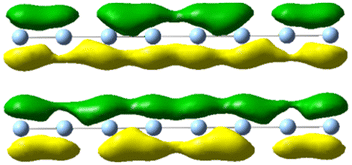 |
|
| 6.0 | 5.35 | 8.118 | 0.33 | 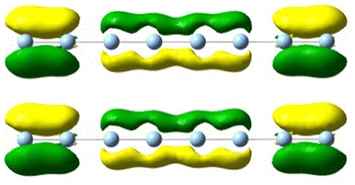 |
The computed absorption spectra of the shifted Ag8 dimers consistently have three main absorption peaks (Fig. 10a and b). The main longitudinal absorption peaks are between 1.00 eV and 1.76 eV for all shifted distances, in a similar range as the longitudinal peak in the isolated Ag8 monomer at 1.34 eV (see Fig. 2). The energy of the main longitudinal peak is highest for the unshifted dimer (1.76 eV) and decreases in energy to 1.00 eV as the shift increases from 1.31 Å to 13.22 Å, but increases to 1.08 eV at the largest shift distance of 15.96 Å. This pattern is related to the transition from side-by-side-like to end-to-end-like behavior. As we saw previously, the side-by-side dimers have higher longitudinal peak energies than the isolated nanowire, whereas the end-to-end dimers have lower energies than the isolated nanowire; in both cases, as distance increases, the energy approaches that of the isolated nanowire. As the shift distance increases from 0 to 13.22 Å, the longitudinal peak decreases in energy as expected for a system transitioning from side-to-side to short-distance end-to-end behavior; as the distance increases further to 15.96 Å, the longitudinal peak increases in energy following the trend of an end-to-end system with increasing separation distance.
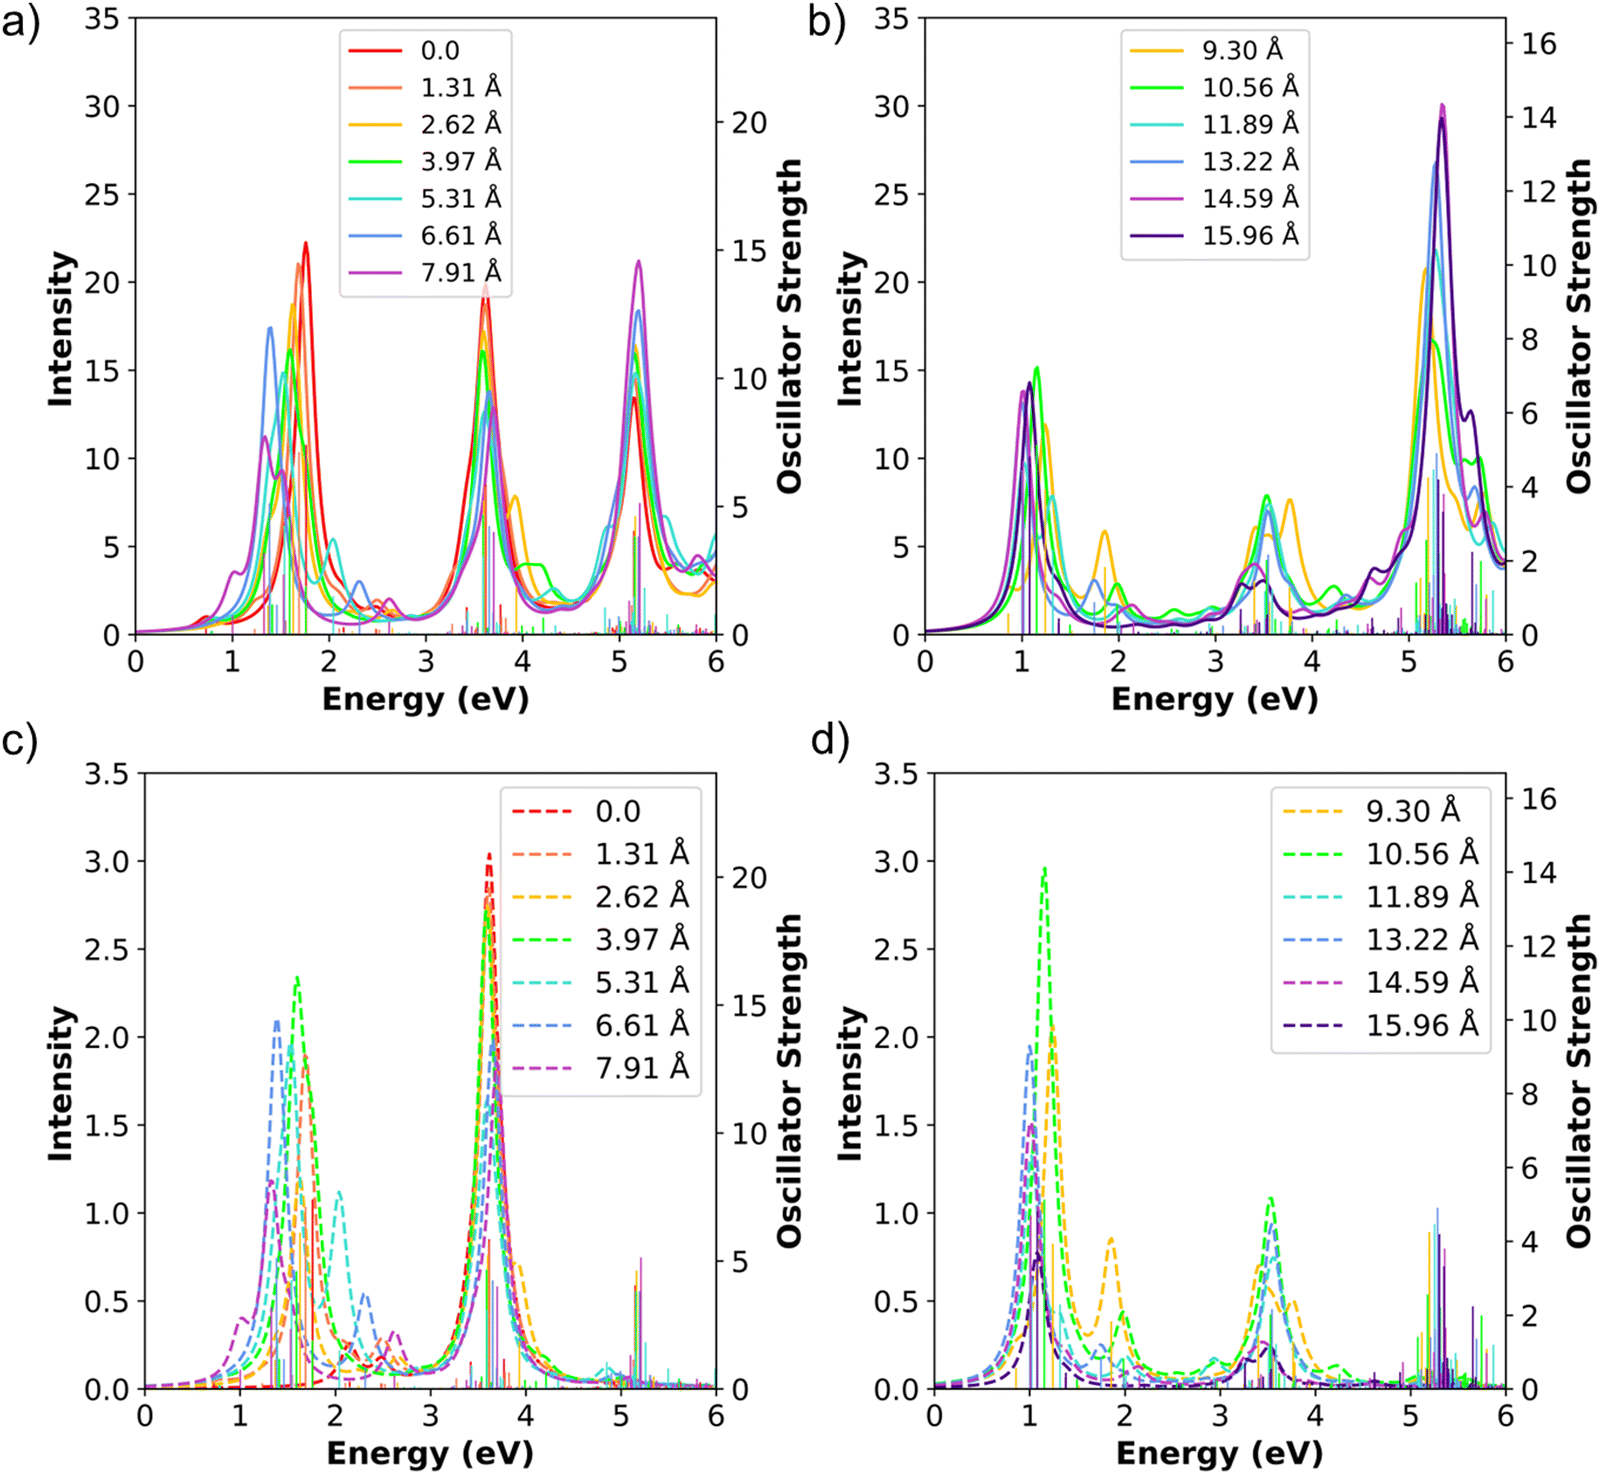 | ||
| Fig. 10 (a) and (b) Absorption spectra, (c) and (d) CTP absorption spectra of the shifted Ag8 nanowire dimers at the INDO/CIS level. The spectra series are split at 7.91 Å for clarity. In all panels, the sticks indicate the oscillator strength of each excited state. | ||
Similar to the side-by-side Ag8 dimers, the shifted dimers also have two main transverse absorption peaks: a peak at 3–4 eV with its transition dipole moment aligned along the nanowire-to-nanowire axis, and a peak at 5–6 eV with its transition dipole moment aligned out-of-plane. Although the longitudinal states can in principle mix with the nanowire-to-nanowire transverse peaks due to the lower symmetry, in practice the strongly absorbing states have their transition dipoles aligned essentially along either the longitudinal or the transverse axis. The intensity of the lower energy transverse peaks tends to decrease as the shift distance increases, whereas the intensity of the higher energy peaks tends to increase as the shift distance increases. However, the two groups of peaks in shifted dimers do not converge towards the higher energy end near the transverse peak (around 5.40 eV) of an isolated monomer as in the side-by-side dimers. We expect that larger displacements would be required to achieve this convergence.
We now examine the CTP character in the shifted dimers. Even though these systems contain many longitudinal and transverse states, only few strong peaks appear in the CTP absorption spectra (Fig. 10c and d). Because of the large total number of states, we focus only on the CTP states that satisfy two criteria: (1) oscillator strength larger than 1.0 and (2) CTP character larger than 3% (Table 9). Since we have already established that the INDO/CIS transition densities correspond with CTP, the transition densities are not shown for these systems to simplify the data table. As shown in the previous section, the unshifted side-by-side Ag8 dimer has one transverse state around 3.50 eV with significant CTP absorption, while the longitudinal state lacks CTP character due to symmetry. In contrast, the shifted dimers have two groups of CTP states, one between 1.00 eV and 2.04 eV corresponding to the longitudinal states and a second between 3.40 eV and 3.93 eV corresponding to the transverse states (Fig. 10c, d and Table 9). This is attributed to the emergence of significant CTP character in the longitudinal state, even for the shortest shift distance of half an Ag–Ag bond length. As expected by symmetry, the out-of-plane transverse states do not have CTP character.
| Shift distance (Å) | No. of Ag–Ag bonds | Longitudinal states | Transverse states | ||||
|---|---|---|---|---|---|---|---|
| Energy (eV) | Oscillator strength (f) | CTP character (%) | Energy (eV) | Oscillator strength (f) | CTP character (%) | ||
| 0 | — | 3.42 | 1.078 | 6.77 | |||
| 3.62 | 5.853 | 16.84 | |||||
| 3.77 | 1.183 | 8.19 | |||||
| 1.31 | 0.5 | 1.69 | 7.128 | 9.02 | 3.61 | 5.791 | 16.35 |
| 2.62 | 1.0 | 1.37 | 1.149 | 3.07 | 3.60 | 5.233 | 17.32 |
| 1.63 | 6.112 | 6.39 | 3.93 | 1.868 | 7.92 | ||
| 3.97 | 1.5 | 1.41 | 1.183 | 3.66 | 3.59 | 4.674 | 18.65 |
| 1.59 | 4.613 | 14.76 | |||||
| 1.76 | 1.900 | 17.86 | |||||
| 5.31 | 2.0 | 1.39 | 2.010 | 8.93 | 3.59 | 3.102 | 15.27 |
| 1.54 | 4.261 | 13.95 | |||||
| 2.04 | 1.513 | 22.71 | |||||
| 6.61 | 2.5 | 1.38 | 5.135 | 13.08 | 3.65 | 4.250 | 15.59 |
| 1.46 | 1.171 | 5.91 | |||||
| 7.91 | 3.0 | 1.33 | 3.196 | 11.73 | 3.70 | 4.014 | 15.32 |
| 1.53 | 2.354 | 3.75 | |||||
| 9.30 | 3.5 | 1.24 | 3.937 | 17.62 | 3.40 | 1.455 | 13.32 |
| 1.86 | 1.833 | 14.65 | 3.76 | 1.287 | 7.05 | ||
| 10.56 | 4.0 | 1.15 | 5.133 | 19.69 | 3.53 | 2.027 | 16.27 |
| 11.89 | 4.5 | 1.02 | 3.042 | 14.47 | 3.51 | 1.177 | 9.35 |
| 1.32 | 2.300 | 4.08 | 3.58 | 1.219 | 12.67 | ||
| 13.22 | 5.0 | 1.00 | 4.455 | 14.89 | 3.54 | 2.168 | 14.43 |
| 14.59 | 5.5 | 1.01 | 4.700 | 11.02 | — | — | — |
| 15.96 | 6.0 | 1.08 | 4.815 | 5.46 | — | — | — |
When considering all of the shifted dimers, the CTP states generally transition from being primarily transverse to primarily longitudinal as the shift distance increases. However, fluctuations are observed between adjacent shift distances. For the shortest shift distance of 1.31 Å (0.5 Ag–Ag bond), the main longitudinal absorption peak acquires 9.02% CTP character, which is a large increase from no CTP character in the unshifted system. However, when the shift distance is further increased to 2.62 Å (one Ag–Ag bond), the CTP character of the main longitudinal state decreases slightly to 6.39%. Continuing to larger displacements, the CTP intensities of the main absorbing longitudinal states show an alternating increasing/decreasing pattern up to a displacement of 9.30 Å (3.5 Ag–Ag bonds; Fig. 10c and Table 9). In general, for the longitudinal states with the highest oscillator strength, the CTP characters are higher for half bond length shifts than for whole bond length shifts for distances up to 9.30 Å (3.5 bond lengths). The higher CTP characters for half-bond displacements may be because at these displacements, an Ag atom in one nanowire can interact with two Ag atoms in the other nanowire instead of one when the atoms are directly aligned. However, this pattern somewhat reverses at shift distances of 9.30 Å to 14.59 Å (3.5–5.5 Ag–Ag bonds; Fig. 10d). At the largest shift distance of 15.96 Å (6 Ag–Ag bonds), the CTP character of the longitudinal state substantially decreases to 5.46%, which is not surprising since the end-to-end-like geometry has significantly less orbital overlap between the two nanowires. The main transverse states in 3.50–3.62 eV energy range have relatively consistent CTP character for the shorter displacements, with an alternating pattern emerging at intermediate displacements. At the largest displacement, no transverse states have large enough CTP character to appear in Table 9.
We now focus on the states with highest CTP character across the series. At a shift distance of 5.31 Å, one longitudinal state has a CTP character of 22.71%, which is the highest CTP character seen in any excited state in the shifted systems. However, this system has multiple longitudinal absorption peaks, and the state with the largest CTP character is not the one with the largest oscillator strength. Among the main absorbing longitudinal states, the highest CTP character is 19.69% at 10.56 Å (4.0 Ag–Ag bonds) due to competition between orbital overlap and extent of symmetry breaking. At shift distances up to 10.56 Å, the CTP characters of longitudinal states generally increase with increasing shift distance except for the alternations discussed earlier, but at larger displacements the CTP characters tend to decline. The main absorbing longitudinal state similarly has a large CTP character of 14–20% for all shifted systems with displacements from 3.97 Å to 13.22 Å. In contrast, the highest CTP character of the main absorbing transverse state occurs at a shift distance of 3.97 Å (1.5 Ag–Ag bonds). The CTP characters of the main absorbing transverse states are all reasonably large (12–18%) for all shift distances from 0 to 13.22 Å. However, the transverse absorption intensity decreases at displacements of 9.30 Å and larger. Hence, at intermediate displacements of 3.97 Å and 10.56 Å (1.5–4.0 Ag–Ag bonds), both longitudinal and transverse states have strong CTP character. These observations suggest that introducing symmetry breaking is a potential route to promote strong CTP character.
3.3. Nanorod dimers
Since we have shown in the previous sections that our INDO/CIS based method works well in the small linear Ag nanowire dimers, we now turn to larger Ag nanorod dimers. The pentagonal Ag31+ nanorod has been previously studied to understand the emergence of plasmon-like excitations.38,50,55 This system enables us to assess the transferability of our CTP analysis to larger structures that are computationally expensive to model using TDDFT. The dimers were constructed in end-to-end and side-by-side configurations (Fig. 11). Because the pentagonal nanorod is faceted, we studied two versions of the side-by-side dimer: one with two flat facets directly facing each other (denoted as side-by-side) and one with two of the edges between the facets directly facing each other (denoted as edge-to-edge).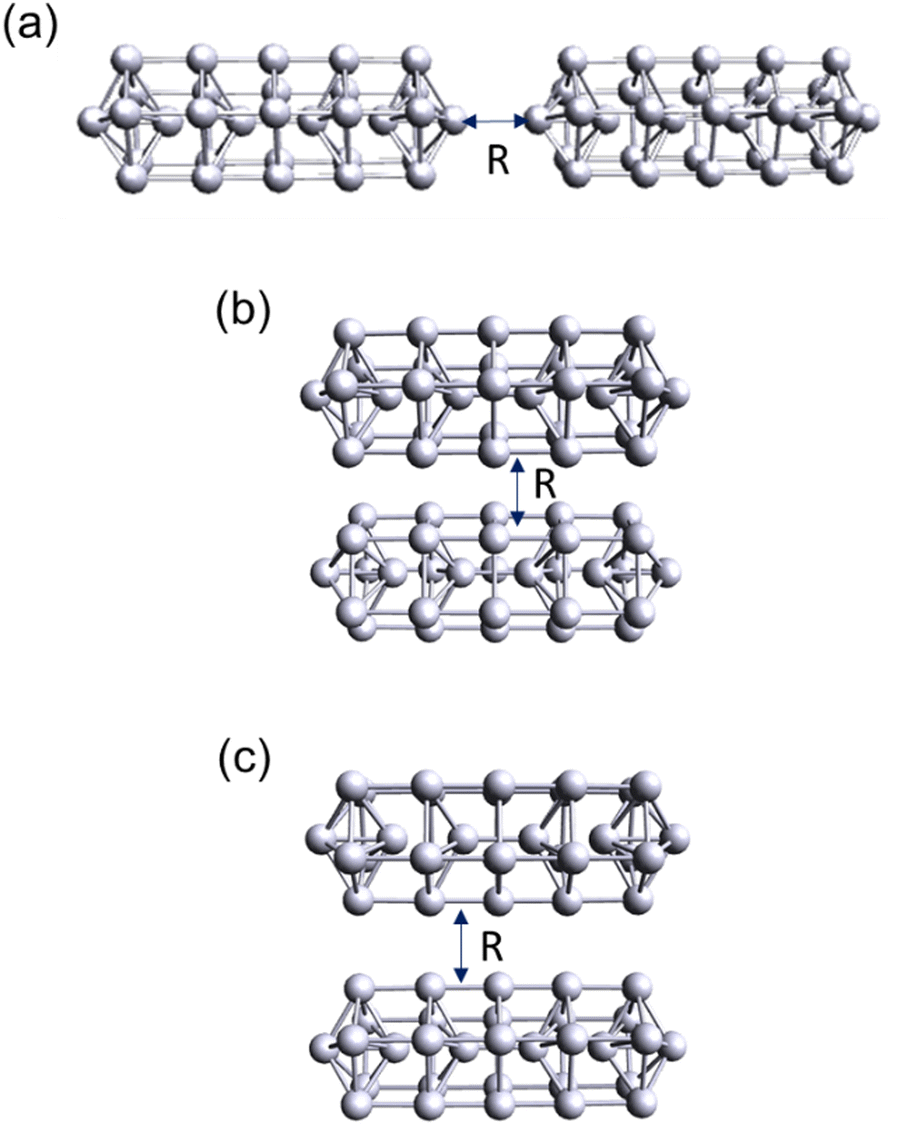 | ||
| Fig. 11 Geometries of the Ag31+ nanorod dimers: (a) end-to-end, (b) side-by-side, and (c) edge-to-edge. | ||
The INDO/CIS absorption spectrum for the Ag31+ nanorod monomer, illustrated in Fig. 12, is consistent with previous computational results. When comparing the INDO/CIS spectrum to the one obtained using TDDFT at the BP86/DZ level, a notable agreement is observed in the spectral features.50 The INDO/CIS and TDDFT calculations both generate two strongly absorbing longitudinal states between 3.2 eV and 3.5 eV, and weaker absorbing transverse states between 4.0 eV and 5.0 eV. The agreement between the two computational methods indicates the reliability of the INDO/CIS predicted absorption features in larger systems.
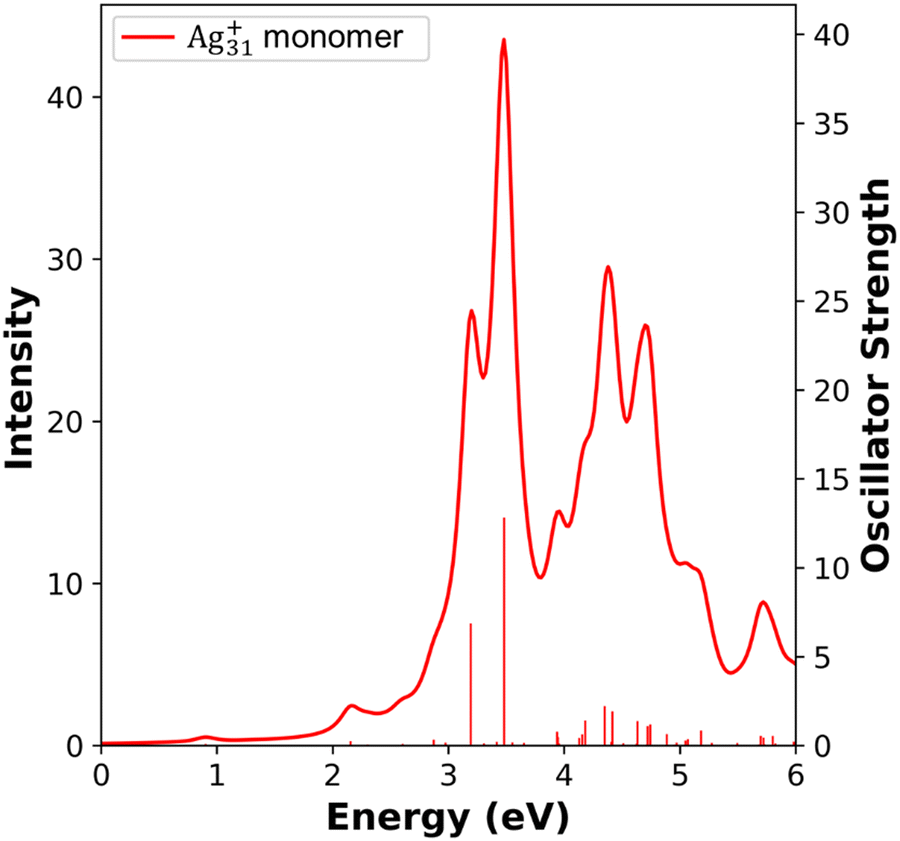 | ||
| Fig. 12 Absorption spectra of the Ag31+ nanorod monomer calculated at INDO/CIS level. The sticks indicate the oscillator strength of each excited state. | ||
In the end-to-end Ag31+ dimers, all dimers have two relatively strong longitudinal absorption peaks, similar to the Ag31+ monomer. The first strong longitudinal absorption peak increases in energy from 2.0 eV to 3.1 eV and the second peak increases from 2.1 eV to 3.4 eV as the separation distance increases (Fig. 13). The transverse peaks are located in the range of 4–5 eV and have weak oscillator strengths, similar to the monomer. As before, the longitudinal states have CTP character in the end-to-end dimers. For an Ag31+ dimer, which has the overall formula Ag622+, the number of excited states needed to reach the 6-eV energy cutoff is around 1500 states. Hence, we only examine the longitudinal states that meet two criteria: (1) oscillator strength larger than 1.0 and (2) CTP character larger than 1% (Table 10). At the shortest separation distance of 3.5 Å, both the first strong longitudinal absorption peak and a lower-energy state at 1.31 eV with weaker absorption have substantial CTP character. The state at 1.31 eV possesses the highest CTP character (11.05%) of any end-to-end system we have studied. At larger separation distances, the longitudinal states close in energy to the first strong longitudinal absorption peak dominate the CTP absorption spectrum (see Fig. 13b and Table 10). The CTP character decreases rapidly as we increase the separation distance from 3.5 Å to 6.0 Å, similar to what was seen in the end-to-end nanowire dimers. At the largest distance of 6.0 Å, the CTP characters become too weak to meet the criteria to be included in Table 10.
 | ||
| Fig. 13 (a) Absorption spectra and (b) CTP absorption spectra of the end-to-end Ag31+ nanowire dimers at the INDO/CIS level. The absorption intensity of the monomer is doubled to represent the intensity for two isolated monomers. In both panels, the sticks indicate the oscillator strength of each excited state. | ||
| Distance (Å) | Energy (eV) | Oscillator strength (f) | CTP character (%) |
|---|---|---|---|
| 3.5 | 1.31 | 2.347 | 11.05 |
| 2.02 | 3.815 | 3.62 | |
| 2.13 | 3.534 | 4.85 | |
| 2.55 | 2.245 | 1.45 | |
| 3.73 | 3.085 | 1.93 | |
| 4.0 | 2.48 | 4.808 | 1.57 |
| 2.54 | 2.691 | 1.79 | |
| 4.5 | 2.64 | 5.310 | 2.62 |
| 2.76 | 3.423 | 1.36 | |
| 5.0 | 2.78 | 2.881 | 1.64 |
| 5.5 | 2.81 | 1.340 | 2.42 |
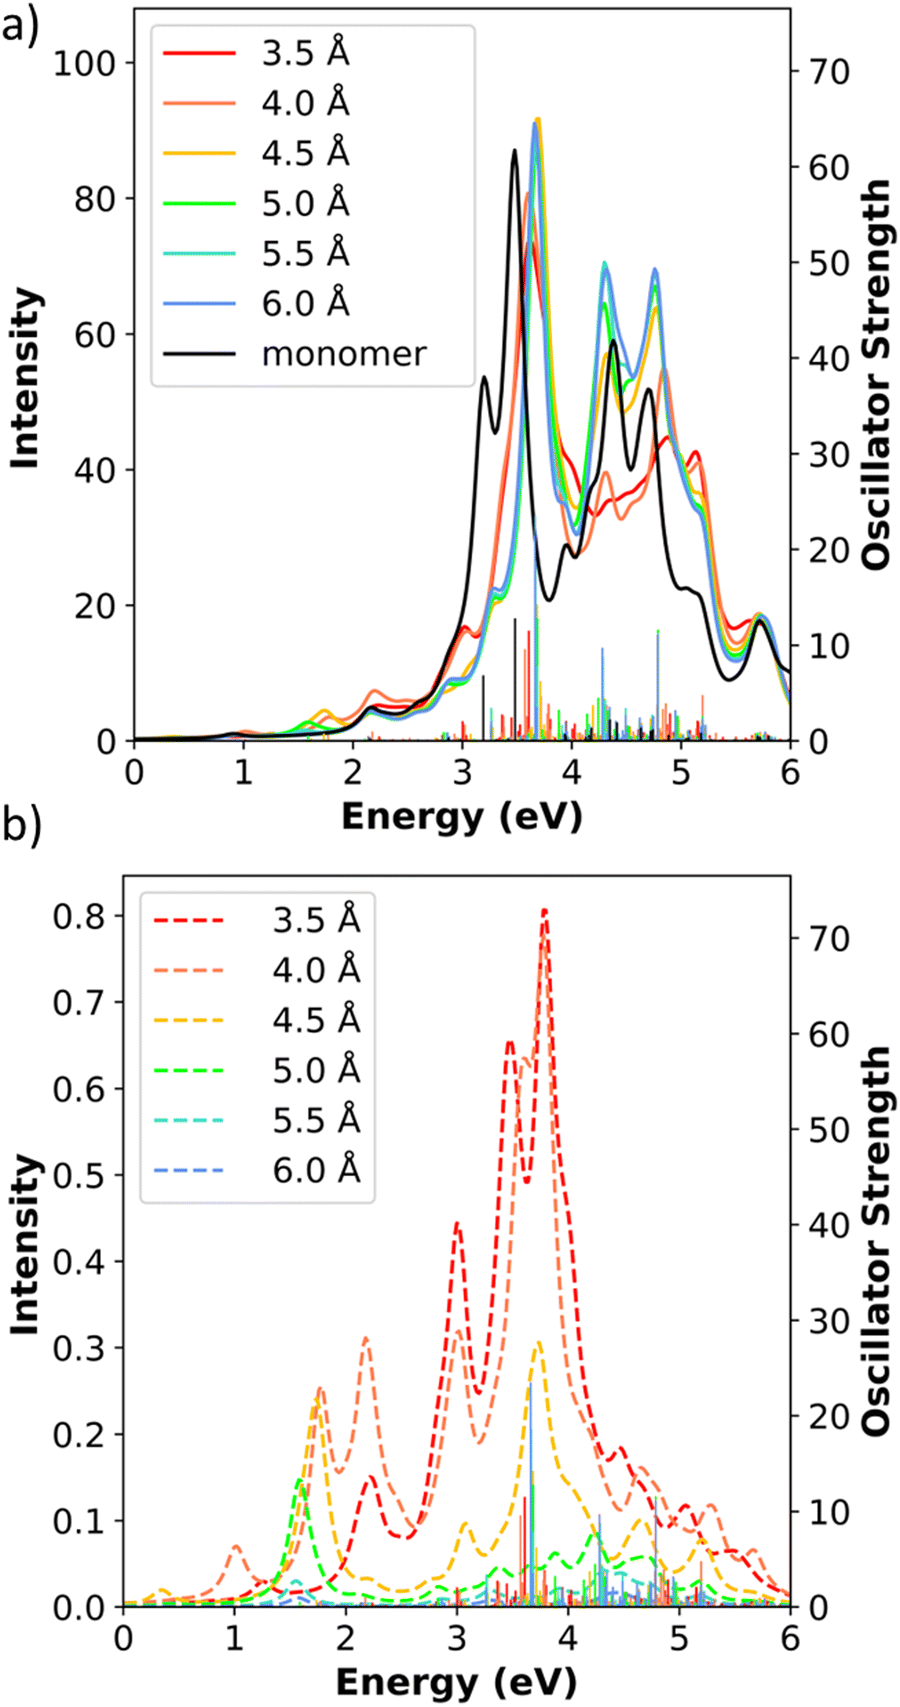
In the side-by-side system with two facets of the nanorods directly facing each other, the absorption spectra do not have the obvious three groups of peaks seen in the small linear systems (Fig. 14a). In this system, the longitudinal and the in-plane transverse peaks significantly overlap in energy. The details of the absorbing excited states are in Table S5 (ESI†). At all separation distances, the first strong absorption peak around 3.5–3.7 eV consists primarily of longitudinal states. The main in-plane transverse peaks overlap with the longitudinal peaks, but have lower absorption intensity and span a wider range of 3.3–4.8 eV, generally shifting toward the higher end of that range as the separation distance increases. At each separation distance, there are two main out-of-plane transverse absorption peaks. As the separation distance increases, the lower energy peak decreases in energy from 4.84 eV to 4.28 eV and the higher energy state decreases from 5.23 eV to 4.79 eV.
 | ||
| Fig. 14 (a) Absorption spectra and (b) CTP absorption spectra of the side-by-side Ag31+ nanowire dimers at the INDO/CIS level. The absorption intensity of the monomer is doubled to represent the intensity for two isolated monomers. In both panels, the sticks indicate the oscillator strength of each excited state. | ||
For the side-by-side dimer, CTP character only occurs in the in-plane transverse states. The strongest CTP absorption peak occurs between 3.77 eV and 4.12 eV, and shifts to higher energy as the separation distance increases (Fig. 14b and Table 11). At the shortest separation distance of 3.5 Å, the higher-energy weakly absorbing states also have small CTP character. As the separation distance increases, the CTP character decreases steadily and gradually approaching zero. The CTP characters in the side-by-side Ag31+ nanorod dimers are significantly lower than for the small nanowire side-by-side dimers. This suggests that increasing the size of the system may not be a fruitful route toward increasing CTP character. In a larger system, a smaller percentage of the atoms are able to interact directly with the other nanorod, and the CTP states may be diluted by mixing with a larger number of local excited states at similar energies.
| Distance (Å) | Energy (eV) | Oscillator strength (f) | CTP character (%) |
|---|---|---|---|
| 3.5 | 3.77 | 4.613 | 9.38 |
| 4.0 | 3.60 | 1.609 | 6.17 |
| 4.5 | 3.82 | 2.751 | 5.67 |
| 5.0 | 4.16 | 3.453 | 1.96 |
| 5.5 | 4.12 | 2.577 | 0.80 |
| 6.0 | 4.32 | 1.939 | 0.26 |
The Ag31+ edge-to-edge dimers (side-by-side with edges of the pentagonal rods directly facing each other) have absorption spectra that are unsurprisingly very similar to the side-by-side dimers (Fig. 15). The main absorbing excited states of the edge-to-edge dimers are likewise very similar to those in the side-by-side dimers (Table S6, ESI†). The strongly absorbing in-plane transverse states in the edge-to-edge dimers have similar energies (3.4–4.8 eV) to the corresponding states in the side-by-side systems, but the CTP character of these states in the edge-to-edge dimers are lower than in the side-by-side case. For example, the CTP character in the 3.5 Å dimer decreases from 9.38% to 5.54% after changing the alignment. At 6.0 Å, the in-plane transverse states have CTP character close to 0 such that this distance is excluded from Table 12. These results are most likely because the edge-to-edge dimers have a smaller surface area for interaction than the side-by-side dimers. The edge-to-edge dimers have only a single line of five atoms on each nanorod in close enough proximity to have strong orbital overlap, whereas the side-by-side dimer has a full face (two lines of five atoms) on each nanorod directly interacting. Interestingly, the edge-to-edge dimers have slightly more CTP character than the side-by-side dimers in the very weakly absorbing states below 3 eV. Overall, these results demonstrate that the semiempirical INDO/CIS method is capable of revealing trends in the CTP character of larger metal nanostructures with geometries that are more complex than the nanorods. Our method is able to quantify the CTP character in each excited state and capture the distance dependence or geometry dependence in these systems.
 | ||
| Fig. 15 (a) Absorption spectra and (b) CTP absorption spectra of the edge-to-edge Ag31+ nanowire dimers at the INDO/CIS level. The absorption intensity of the monomer is doubled to represent the intensity for two isolated monomers. In both panels, the sticks indicate the oscillator strength of each excited state. | ||
| Distance (Å) | Energy (eV) | Oscillator strength (f) | CTP character (%) |
|---|---|---|---|
| 3.5 | 3.79 | 3.882 | 5.54 |
| 4.0 | 3.79 | 3.843 | 3.90 |
| 4.5 | 3.75 | 1.729 | 3.85 |
| 5.0 | 3.88 | 3.255 | 0.44 |
| 5.5 | 3.91 | 1.669 | 0.12 |
4. Conclusion
The unique properties of charge transfer plasmons, such as their tunability and strong coupling to light, make them a promising platform for the development of new types of optoelectronic devices. Theoretical modeling of the CTP modes in metal nanocluster dimers allow us to identify and characterize how CTP states behave when the size, symmetry, and interaction distance change, providing better understanding of how to tune the CTP states for applications.In this study, we have shown that the semiempirical INDO/CIS method can accurately predict trends in CTP states at low computational cost and enables quantitative analysis of the CTP character of each state. For the end-to-end nanowire dimers, only the longitudinal states have non-zero CTP character. Because the surface area for interactions between the nanowires is only a single atom in size, our quantitative analysis shows that the CTP character somewhat decreases as the nanowire length increases, and the CTP character decreases quickly with increasing gap distance. The trends in the energies of the absorption peaks with nanowire length and gap distance are similar to previous TDDFT-based studies.19,21,38
In the side-by-side nanowire dimers, only the transverse states have CTP character. For these dimers, the CTP character tends to decrease with increasing gap distance but increase with increasing nanowire length. Our observed trends in the absorption spectra and CTP states are generally in good agreement with previous TDDFT-based studies.20,21 The CTP character in the side-by-side dimers is generally larger than for the end-to-end dimers because of the larger surface area of interaction between the nanowires. The side-by-side dimers also retain large CTP character to slightly larger gap distances, in contrast to the dramatic decreases in CTP character with distance seen in the end-to-end systems. This suggests that constructing systems with a reasonably large contact area between two nanostructures may be beneficial in designing systems with large CTP character; further modeling of larger systems will be needed to confirm that these trends hold in these systems.
We also applied our approach to side-by-side Ag8 dimers where we shifted one nanowire along the length of the other at a constant gap distance, which have not been previously studied. In these systems, the transverse states show a general decrease in CTP character as the shift distance increases, which supports our conclusion that more orbital overlap increases the CTP character. In contrast, for the longitudinal states the CTP character is highest when one nanowire is shifted about half the length of the other (10.56 Å) due to competition between orbital overlap and extent of symmetry breaking. The CTP character is also sensitive to the detailed interactions between the atoms, shown by the appearance of an alternating pattern in the CTP character with each half-Ag–Ag-bond step. These results give new insight into the role that symmetry breaking can play in enhancing and tuning CTP character.
To demonstrate the ability of our method to model larger systems that are computationally expensive to model with TDDFT, we extended our analysis to dimers of the Ag31+ nanorod. The results showed that CTP character in the larger nanorod dimers follow a similar distance dependence to that seen in the small nanowire. Due to the increase in size, the nanorod dimers tend to have smaller overall CTP character than the nanowires. The larger nanorod also allows us to test a new edge-to-edge geometric configuration, which tends to produce less CTP character than the side-by-side counterpart due to less orbital overlap between monomers.
Our novel INDO-based analysis framework enables us to quantitatively analyze the evolution of the CTP states in Ag nanocluster dimers with low computational cost. This method accurately models the absorption spectra of nanocluster dimers and the dependence of CTP character on geometric parameters. We expect this approach to be broadly useful to study nanocluster dimers with new geometries, particularly in size ranges that are challenging with DFT-based approaches, and reveal trends that will enable tuning of the CTP and BDP modes for new functional nanomaterials.
Data availability
The data supporting this article have been included as part of the ESI.†Conflicts of interest
There are no conflicts to declare.Acknowledgements
The authors would like to thank Alva Dillon and Zhuangyu Han for assistance with coding. This work was supported by an NSF CAREER award (CHE-2046099). Computational work was performed on the Brandeis HPCC, which is partially supported by the NSF through DMR-MRSEC 2011846 and OAC-1920147.References
- P. Verma, Tip-Enhanced Raman Spectroscopy: Technique and Recent Advances, Chem. Rev., 2017, 117(9), 6447–6466, DOI:10.1021/acs.chemrev.6b00821.
- S. Linic, U. Aslam, C. Boerigter and M. Morabito, Photochemical Transformations on Plasmonic Metal Nanoparticles, Nat. Mater., 2015, 14(6), 567–576, DOI:10.1038/nmat4281.
- P. Pavaskar, J. Theiss and S. B. Cronin, Plasmonic Hot Spots: Nanogap Enhancement vs. Focusing Effects from Surrounding Nanoparticles, Opt. Express, 2012, 20(13), 14656–14662, DOI:10.1364/OE.20.014656.
- P. Liu, D. V. Chulhai and L. Jensen, Single-Molecule Imaging Using Atomistic Near-Field Tip-Enhanced Raman Spectroscopy, ACS Nano, 2017, 11(5), 5094–5102, DOI:10.1021/acsnano.7b02058.
- G. Joshi, A. Q. Mir, A. Layek, A. Ali, Sk. T. Aziz, S. Khatua and A. Dutta, Plasmon-Based Small-Molecule Activation: A New Dawn in the Field of Solar-Driven Chemical Transformation, ACS Catal., 2022, 12(2), 1052–1067, DOI:10.1021/acscatal.1c05245.
- H. Yu, Y. Peng, Y. Yang and Z.-Y. Li, Plasmon-Enhanced Light–Matter Interactions and Applications, Npj Comput. Mater., 2019, 5(1), 1–14, DOI:10.1038/s41524-019-0184-1.
- E. B. Guidez and C. M. Aikens, Quantum Mechanical Origin of the Plasmon: From Molecular Systems to Nanoparticles, Nanoscale, 2014, 6(20), 11512–11527, 10.1039/C4NR02225D.
- N. J. Halas, S. Lal, W.-S. Chang, S. Link and P. Nordlander, Plasmons in Strongly Coupled Metallic Nanostructures, Chem. Rev., 2011, 111(6), 3913–3961, DOI:10.1021/cr200061k.
- R. Rastogi, E. A. Dogbe Foli, R. Vincent, P.-M. Adam and S. Krishnamoorthy, Engineering Electromagnetic Hot-Spots in Nanoparticle Cluster Arrays on Reflective Substrates for Highly Sensitive Detection of (Bio)Molecular Analytes, ACS Appl. Mater. Interfaces, 2021, 13(28), 32653–32661, DOI:10.1021/acsami.1c01953.
- T. Atay, J.-H. Song and A. V. Nurmikko, Strongly Interacting Plasmon Nanoparticle Pairs:
![[thin space (1/6-em)]](https://www.rsc.org/images/entities/char_2009.gif) From Dipole−Dipole Interaction to Conductively Coupled Regime, Nano Lett., 2004, 4(9), 1627–1631, DOI:10.1021/nl049215n.
From Dipole−Dipole Interaction to Conductively Coupled Regime, Nano Lett., 2004, 4(9), 1627–1631, DOI:10.1021/nl049215n. - F. Wen, Y. Zhang, S. Gottheim, N. S. King, Y. Zhang, P. Nordlander and N. J. Halas, Charge Transfer Plasmons: Optical Frequency Conductances and Tunable Infrared Resonances, ACS Nano, 2015, 9(6), 6428–6435, DOI:10.1021/acsnano.5b02087.
- A. N. Koya and J. Lin, Charge Transfer Plasmons: Recent Theoretical and Experimental Developments, Appl. Phys. Rev., 2017, 4(2), 021104, DOI:10.1063/1.4982890.
- G. U. Kuda-Singappulige and C. M. Aikens, Theoretical Insights into Excitation-Induced Oxygen Activation on a Tetrahedral Ag8 Cluster, J. Phys. Chem. A, 2021, 125(43), 9450–9458, DOI:10.1021/acs.jpca.1c05129.
- S. F. Tan, L. Wu, J. K. W. Yang, P. Bai, M. Bosman and C. A. Nijhuis, Quantum Plasmon Resonances Controlled by Molecular Tunnel Junctions, Science, 2014, 343(6178), 1496–1499, DOI:10.1126/science.1248797.
- P. Nordlander, C. Oubre, E. Prodan, K. Li and M. I. Stockman, Plasmon Hybridization in Nanoparticle Dimers, Nano Lett., 2004, 4(5), 899–903, DOI:10.1021/nl049681c.
- E. Prodan, C. Radloff, N. J. Halas and P. Nordlander, A Hybridization Model for the Plasmon Response of Complex Nanostructures, Science, 2003, 302(5644), 419–422, DOI:10.1126/science.1089171.
- J. Zuloaga, E. Prodan and P. Nordlander, Quantum Description of the Plasmon Resonances of a Nanoparticle Dimer, Nano Lett., 2009, 9(2), 887–891, DOI:10.1021/nl803811g.
- P. Liu, D. V. Chulhai and L. Jensen, Atomistic Characterization of Plasmonic Dimers in the Quantum Size Regime, J. Phys. Chem. C, 2019, 123(22), 13900–13907, DOI:10.1021/acs.jpcc.9b02812.
- F. Alkan and C. M. Aikens, Understanding Plasmon Coupling in Nanoparticle Dimers Using Molecular Orbitals and Configuration Interaction, Phys. Chem. Chem. Phys., 2019, 21(41), 23065–23075, 10.1039/C9CP03890F.
- P. Pandeya and C. M. Aikens, Theoretical Analysis of Optical Absorption Spectra of Parallel Nanowire Dimers and Dolmen Trimers, J. Phys. Chem. C, 2020, 124(24), 13495–13507, DOI:10.1021/acs.jpcc.0c04419.
- F. Alkan and C. M. Aikens, Understanding the Effect of Symmetry Breaking on Plasmon Coupling from TDDFT, J. Phys. Chem. C, 2021, 125(22), 12198–12206, DOI:10.1021/acs.jpcc.1c02707.
- Z. Jamshidi, N. Asadi-Aghbolaghi, R. Morad, E. Mahmoudi, S. Sen, M. Maaza and L. Visscher, Comparing the Nature of Quantum Plasmonic Excitations for Closely Spaced Silver and Gold Dimers, J. Chem. Phys., 2022, 156(7), 074102, DOI:10.1063/5.0079258.
- E. Selenius, S. Malola, M. Kuisma and H. Häkkinen, Charge Transfer Plasmons in Dimeric Electron Clusters, J. Phys. Chem. C, 2020, 124(23), 12645–12654, DOI:10.1021/acs.jpcc.0c02889.
- O. Pérez-González, N. Zabala and J. Aizpurua, Optical Characterization of Charge Transfer and Bonding Dimer Plasmons in Linked Interparticle Gaps, New J. Phys., 2011, 13(8), 083013, DOI:10.1088/1367-2630/13/8/083013.
- Y. Huang, Y. Chen, L.-L. Wang and E. Ringe, Small Morphology Variations Effects on Plasmonic Nanoparticle Dimer Hotspots, J. Mater. Chem. C, 2018, 6(36), 9607–9614, 10.1039/C8TC03556C.
- L. S. Slaughter, Y. Wu, B. A. Willingham, P. Nordlander and S. Link, Effects of Symmetry Breaking and Conductive Contact on the Plasmon Coupling in Gold Nanorod Dimers, ACS Nano, 2010, 4(8), 4657–4666, DOI:10.1021/nn1011144.
- G. U. Kuda-Singappulige, D. B. Lingerfelt, X. Li and C. M. Aikens, Ultrafast Nonlinear Plasmon Decay Processes in Silver Nanoclusters, J. Phys. Chem. C, 2020, 124(37), 20477–20487, DOI:10.1021/acs.jpcc.0c03160.
- G. U. Kuda-Singappulige and C. M. Aikens, Excited-State Absorption in Silver Nanoclusters, J. Phys. Chem. C, 2021, 125(45), 24996–25006, DOI:10.1021/acs.jpcc.1c05054.
- N. Asadi-Aghbolaghi, R. Rüger, Z. Jamshidi and L. Visscher, TD-DFT + TB: An Efficient and Fast Approach for Quantum Plasmonic Excitations, J. Phys. Chem. C, 2020, 124(14), 7946–7955, DOI:10.1021/acs.jpcc.0c00979.
- W. Thiel, Semiempirical Quantum–Chemical Methods, Wiley Interdiscip. Rev.: Comput. Mol. Sci., 2014, 4(2), 145–157, DOI:10.1002/wcms.1161.
- A. S. Christensen, T. Kubař, Q. Cui and M. Elstner, Semiempirical Quantum Mechanical Methods for Noncovalent Interactions for Chemical and Biochemical Applications, Chem. Rev., 2016, 116(9), 5301–5337, DOI:10.1021/acs.chemrev.5b00584.
- Q. Sun and R. L. M. Gieseking, Parametrization of the PM7 Semiempirical Quantum Mechanical Method for Silver Nanoclusters, J. Phys. Chem. A, 2022, 126(37), 6558–6569, DOI:10.1021/acs.jpca.2c05782.
- M. Gaus, H. Jin, D. Demapan, A. S. Christensen, P. Goyal, M. Elstner and Q. Cui, DFTB3 Parametrization for Copper: The Importance of Orbital Angular Momentum Dependence of Hubbard Parameters, J. Chem. Theory Comput., 2015, 11(9), 4205–4219, DOI:10.1021/acs.jctc.5b00600.
- A. Fihey, C. Hettich, J. Touzeau, F. Maurel, A. Perrier, C. Köhler, B. Aradi and T. Frauenheim, SCC-DFTB Parameters for Simulating Hybrid Gold-Thiolates Compounds, J. Comput. Chem., 2015, 36(27), 2075–2087, DOI:10.1002/jcc.24046.
- R. L. Gieseking, M. A. Ratner and G. C. Schatz, Semiempirical Modeling of Ag Nanoclusters: New Parameters for Optical Property Studies Enable Determination of Double Excitation Contributions to Plasmonic Excitation, J. Phys. Chem. A, 2016, 120(26), 4542–4549, DOI:10.1021/acs.jpca.6b04520.
- R. L. Gieseking, M. A. Ratner and G. C. Schatz, Theoretical Modeling of Voltage Effects and the Chemical Mechanism in Surface-Enhanced Raman Scattering, Faraday Discuss., 2017, 205, 149–171, 10.1039/C7FD00122C.
- N. V. Ilawe, M. B. Oviedo and B. M. Wong, Effect of Quantum Tunneling on the Efficiency of Excitation Energy Transfer in Plasmonic Nanoparticle Chain Waveguides, J. Mater. Chem. C, 2018, 6(22), 5857–5864, 10.1039/C8TC01466C.
- F. Alkan and C. M. Aikens, TD-DFT and TD-DFTB Investigation of the Optical Properties and Electronic Structure of Silver Nanorods and Nanorod Dimers, J. Phys. Chem. C, 2018, 122(41), 23639–23650, DOI:10.1021/acs.jpcc.8b05196.
- Z. Liu, F. Alkan and C. M. Aikens, TD-DFTB Study of Optical Properties of Silver Nanoparticle Homodimers and Heterodimers, J. Chem. Phys., 2020, 153(14), 144711, DOI:10.1063/5.0025672.
- Z. Liu, M. B. Oviedo, B. M. Wong and C. M. Aikens, Plasmon-Induced Excitation Energy Transfer in Silver Nanoparticle Dimers: A Real-Time TDDFTB Investigation, J. Chem. Phys., 2022, 156(15), 154705, DOI:10.1063/5.0082960.
- R. L. M. Gieseking, Third-Order Nonlinear Optical Properties of Ag Nanoclusters: Connecting Molecule-like and Nanoparticle-like Behavior, Chem. Mater., 2019, 31(17), 6850–6859, DOI:10.1021/acs.chemmater.9b01290.
- A. D. Becke, Density-Functional Exchange-Energy Approximation with Correct Asymptotic Behavior, Phys. Rev. A: At., Mol., Opt. Phys., 1988, 38(6), 3098–3100, DOI:10.1103/PhysRevA.38.3098.
- P. J. Stephens, F. J. Devlin, C. F. Chabalowski and M. J. Frisch, Ab Initio Calculation of Vibrational Absorption and Circular Dichroism Spectra Using Density Functional Force Fields, J. Phys. Chem., 1994, 98(45), 11623–11627, DOI:10.1021/j100096a001.
- D. Figgen, G. Rauhut, M. Dolg and H. Stoll, Energy-Consistent Pseudopotentials for Group 11 and 12 Atoms: Adjustment to Multi-Configuration Dirac–Hartree–Fock Data, Chem. Phys., 2005, 311(1), 227–244, DOI:10.1016/j.chemphys.2004.10.005.
- K. A. Peterson and C. Puzzarini, Systematically Convergent Basis Sets for Transition Metals. II. Pseudopotential-Based Correlation Consistent Basis Sets for the Group 11 (Cu, Ag, Au) and 12 (Zn, Cd, Hg) Elements, Theor. Chem. Acc., 2005, 114(4), 283–296, DOI:10.1007/s00214-005-0681-9.
- B. P. Pritchard, D. Altarawy, B. Didier, T. D. Gibson and T. L. Windus, New Basis Set Exchange: An Open, Up-to-Date Resource for the Molecular Sciences Community, J. Chem. Inf. Model., 2019, 59(11), 4814–4820, DOI:10.1021/acs.jcim.9b00725.
- M. J. Frisch; G. W. Trucks; H. B. Schlegel; G. E. Scuseria; M. A. Robb; J. R. Cheeseman; G. Scalmani; V. Barone; B. Mennucci and G. A. Petersson, et al., Gaussian 16, Revision B.01, Gaussian, Inc., Wallingford CT, 2016 Search PubMed.
- R. L. M. Gieseking, Quantum Mechanical Effects in High-Resolution Tip-Enhanced Raman Imaging, J. Phys. Chem. C, 2022, 126(28), 11690–11700, DOI:10.1021/acs.jpcc.2c03309.
- O. A. Hull and C. M. Aikens, Theoretical Investigations on the Plasmon-Mediated Dissociation of Small Molecules in the Presence of Silver Atomic Wires, J. Phys. Chem. A, 2023, 127(10), 2228–2241, DOI:10.1021/acs.jpca.2c07531.
- A. D. Dillon and R. L. M. Gieseking, Evolution of Plasmon-like Excited States in Silver Nanowires and Nanorods, J. Chem. Phys., 2022, 156(7), 074301, DOI:10.1063/5.0080839.
- J. Ridley and M. Zerner, An Intermediate Neglect of Differential Overlap Technique for Spectroscopy: Pyrrole and the Azines, Theor. Chim. Acta, 1973, 32(2), 111–134, DOI:10.1007/BF00528484.
- J. J. P. Stewart, MOPAC: A Semiempirical Molecular Orbital Program, J. Comput.-Aided Mol. Des., 1990, 4(1), 1–103, DOI:10.1007/BF00128336.
- R. L. M. Gieseking, A New Release of MOPAC Incorporating the INDO/S Semiempirical Model with CI Excited States, J. Comput. Chem., 2021, 42(5), 365–378, DOI:10.1002/jcc.26455.
- L. Jensen, L. L. Zhao and G. C. Schatz, Size-Dependence of the Enhanced Raman Scattering of Pyridine Adsorbed on Agn (n = 2–8, 20) Clusters, J. Phys. Chem. C, 2007, 111(12), 4756–4764, DOI:10.1021/jp067634y.
- E. B. Guidez and C. M. Aikens, Diameter Dependence of the Excitation Spectra of Silver and Gold Nanorods, J. Phys. Chem. C, 2013, 117(23), 12325–12336, DOI:10.1021/jp4023103.
Footnote |
| † Electronic supplementary information (ESI) available: Decomposition of excited states into pure transitions for the linear Ag nanowires. Breakdown of the main absorption states in the Ag31+ nanorod dimers. See DOI: https://doi.org/10.1039/d4cp01393j |
| This journal is © the Owner Societies 2024 |