DOI:
10.1039/C5RA22477B
(Paper)
RSC Adv., 2016,
6, 7212-7223
Glucose oxidase stabilized fluorescent gold nanoparticles as an ideal sensor matrix for dual mode sensing of glucose†
Received
27th October 2015
, Accepted 7th January 2016
First published on 12th January 2016
Abstract
In this work, a simple, facile and green route for the preparation of glucose oxidase (GOx) stabilized, size controlled gold nanoparticles (Au NPs) is demonstrated. Interestingly upon changing pH, these Au NPs are disintegrated leading to the formation of GOx stabilized fluorescent gold nanoparticles (FL Au NPs) that emit an intense yellowish green colour on excitation at 365 nm using UV light. Structural and morphological changes are analyzed by using spectroscopy (FTIR and UV-vis), microscopy (TEM) and electrochemical studies. Further colourimetric and electrochemical measurements show the feasibility of employing such materials as an ideal sensor matrix for the determination of glucose using a dual mode sensing strategy. Essentially both Au NPs and FL Au NPs detect glucose at a low concentration with high sensitivity, good stability and reproducibility suggesting promising applications in the field of biosensors. Here, the enzyme GOx plays a bifunctional role as a stabilizer as well as a reducing agent during the preparation of these nanostructured materials. Particularly GOx retains its enzymatic activity and redox activity even after the stabilization of both Au NPs and FL Au NPs. Among the two, GOx–FL Au NPs displays a better catalytic behaviour for detection of glucose and exhibits higher sensitivity, lower detection limits and impressive turn-over frequency numbers for enzymatic catalysis when compared to GOx–Au NPs and other materials reported for the enzymatic detection of glucose. Finally the analytical feasibility of employing such materials as biosensors for the detection of glucose in real samples is evaluated using human blood serum samples and the results are promising indicating the potential utility of these nanomaterials.
1. Introduction
Ever increasing day-to-day health problems and the cost associated with modern day hospital treatments force researchers across the globe to design and develop new materials for bio-sensing applications. Recently gold nanoparticles (Au NPs) of smaller size of the order of a few atoms called “clusters” have attracted much research attention because of their unique optical and photophysical properties.1 In addition these clusters comprising of very small particles exhibit an intense and strong fluorescence making them an ideal material to tune their emission colour by controlling their size. Preparation of such fluorescent Au nanoparticles (FL Au NPs) has attracted much attention recently due to the ease with which one could tune the surface functionalities using simple chemical strategies to obtain a high intense fluorescence.2 Conventionally some organic fluorescence dyes and semiconductor quantum dots (QDs) like CdS, CdSe etc. are employed for various applications including bio-imaging of live cells, ON–OFF fluorescence based sensing and photocatalysis. But the intrinsic properties of these materials viz., high toxicity, cytotoxic nature and self-aggregation inside the cells lead to many different problems and limit their applications.3,4 In contrast, Au NPs and FL Au NPs possessing a very small size exhibit good biocompatibility and a low level of toxicity.5 The fluorescent properties of such materials arises mainly from the ultra low size of metal NPs and hence potential applications in the fields of bio-imaging, bio-sensing, chemical sensing and lower level detection of toxic and heavy metal ions etc. are realized.6–13 Similar strategies have also been exploited in protein studies by employing macro-sized biomolecules as a stabilizer for producing various nanostructured materials; for example, the preparation of Au NPs using BSA,14–17 lysozyme,18,19 human transferrins,20 lactoferrins,21 trypsin,22 pepsin,23 insulin,24 and enzymes.25,26 Henceforth, the harsh conditions and conventional usage of toxic reducing agents like NaBH4 and LiAlH4 along with some organic stabilizing agents can be avoided for the synthesis of such inorganic nanomaterials. On the other hand biomolecules are ‘greener’ and act as a reducing agent as well as the stabilizing agent during the synthesis of NPs.
As for as the usage of enzymes for the preparation of nanostructured materials is concerned only a very few literature reports are available. For example, Sharma et al.26 reported a green chemical synthesis of Au NPs by employing GOx as a both stabilizing as well as a reducing agent and demonstrated that the enzyme, GOx acts as a bio-nanoreactor for the polymerization of aniline to polyaniline (PANI). Similarly Wen et al.27 reported the preparation of horseradish peroxidase (HRP) functionalized red colour emitting fluorescent Au nanoclusters (NCs) and demonstrated an application in the field of hydrogen peroxide (H2O2) sensing based on fluorescence quenching mechanism. A linear detection range of 100 nM to 100 µM concentration of H2O2 detection was reported. Further Ramanaviciene et al.28,29 reported the development of biosensor for glucose detection using GOx immobilized Au NPs and separately monitored the sensing events using both spectrophotometric and electrochemical techniques. These reports essentially deal with the preparation of enzyme stabilized nanostructured materials and demonstrated their application as sensors. On contrary, in this work, a simple and green chemical method is developed for the preparation of GOx stabilized Au NPs. Further upon changing pH these NPs disintegrate into even smaller fluorescent Au NPs stabilized by GOx. In a way, development of a simple state-of-art strategy is proposed for the preparation of enzyme stabilized nanostructured materials that can be explored further for dual mode sensing applications.
Keeping this in mind, in this work, a facile and green route for the preparation of glucose oxidase (GOx) stabilized Au NPs (GOx–Au NPs) and FL Au NPs (GOx–FL Au NPs) possessing excellent bio-catalytic activity toward glucose sensing is demonstrated. GOx has a rigid structure, consists of a glycoprotein, flavin adenine dinucleotide (FAD), one of the vital parts of the enzyme, which take parts in two electrons and two protons direct electron transfer (DET) redox reaction.26,27 Usually the active centre, FAD is deeply buried inside the protein structure retarding the rate of electron transfer process and to overcome this problem, DET of GOx using the conventional electrodes has been proposed by many researchers.30,31 In our case, the enzyme GOx plays a dual role of stabilizer as well as a reducing agent during the preparation of Au NPs. Optical property of such NPs is tuned by adjusting pH of the solution thereby the conformation of enzyme is altered and also the size of resultant NPs is reduced. As-prepared GOx–Au NPs is observed to be agglomerated forming a ‘worm-like’ structure in alkaline pH. Upon changing the pH value from alkaline to neutral (10 to 7) these agglomerated NPs disintegrate to form tiny particles resulting as FL Au NPs that emit a strong yellowish green fluorescent colour under the exposure of UV light having a wavelength of 365 nm. In addition, the enzyme, GOx is observed to be redox active that can be exploited further for electrochemical investigation. This paves a way for dual mode bio-sensing applications using both colourimetric and electrochemical measurements. Here, in this work glucose is shown as an example since it is a very important analyte to assess the glucose level in blood; given the fact that more than 200 million people across the globe suffer from diabetics as reported by World Health Organization (WHO). Moreover diagnosing and controlling the level of glucose in blood is very critical for diseases such as diabetes mellitus. We also presume that the reported strategy can easily be extended to other kinds of enzymes and proteins that can be used for the desired applications by exploiting their respective enzymatic activities.
2. Experimental section
2.1. Chemicals
Enzyme, glucose oxidase extracted from Aspergillus niger was purchased from Sigma Aldrich, Bangalore, India. Glucose and cysteine were obtained from HiMedia and sodium metal was procured from Sigma Aldrich, Bangalore, India. AuCl3·HCl·4H2O and 2,2′-azino-bis(3-ethylbenzothiazoline)-6-sulphonic acid (ABTS) were purchased from Sigma Aldrich, Chennai, India. Similarly KH2PO4 & K2HPO4 (HiMedia), NaOH (Merck) and HCl (Merck) were also procured. All these chemicals were of analytical grade (AR) and used as received without any further purification. Millipore water having a resistivity of 18.2 MΩ cm was obtained from a quartz distillation unit and used for the preparation of all the aqueous solutions employed in this work.
2.2. Preparation of GOx stabilized Au NPs (GOx–Au NPs) and FL Au NPs (GOx–FL Au NPs)
Prior to the preparation of Au NPs, all the glassware were cleaned with aqua regia; rinsed with Millipore water and then dried in air (Caution: aqua regia is extremely harmful, highly toxic and corrosive in nature so special care must be taken for precautions while handling). In a typical experiment, 0.01 M glucose was dissolved in 5 mL of Millipore water and then a piece of sodium metal was added. Suddenly, the colourless solution turns into pale yellow in colour. Then the resulting solution was stirred in an ice bath and the enzyme, GOx (1 mg mL−1) was added into the solution followed by 1 mM of AuCl3·HCl·4H2O. During this process, colour of the solution changes from pale yellow into red indicating the formation of GOx stabilized Au NPs. Interestingly pH of the resultant red coloured solution was determined to be alkaline (pH = 10) and upon neutralization by adding a few drops of 0.1 M HCl, pH of the solution was brought down to neutral condition (pH = 7). During this process colour of the resultant solution remains same and surprisingly this solution emits a strong yellowish green fluorescence upon exposure to UV light (365 nm) indicating the formation of even smaller Au NPs. Here GOx plays a vital role as both the reducing as well as the stabilizing agent. Spectroscopic studies such as FTIR and UV-visible spectroscopy and microscopic analysis using TEM were carried out to investigate the structural and morphological changes of the resultant nanomaterials. Further photoluminescence (PL) studies were carried out to investigate the fluorescence property of disintegrated GOx–Au NPs by analyzing their emission spectra recorded for various excitation wavelengths.
2.3. Preparation of electrochemical sensor electrode
Furthermore bio-sensing application of these nanomaterials is explored by adapting a dual mode sensing approach using both colourimetric and electrochemical methods for the detection of glucose. Electrochemical techniques namely cyclic voltammetry (CV) and chronoamperometry (CA) were used for the glucose sensing studies by drop casting the as-prepared Au NPs onto a glassy carbon (GC) electrode. Three-electrode configuration comprising of modified GC as a working electrode, Ag/AgCl as a reference electrode and Pt wire as a counter or auxiliary electrode respectively was used for the electrochemical studies. Before modification, GC electrode was polished with alumina powder and ultrasonicated in Millipore water for 15 minutes. Then the pre-cleaned GC electrode was analyzed by using CV in an aqueous electrolytic solution consisting of 1 mM K4[Fe(CN)6] and 0.1 M NaCl (as a supporting electrolyte) for background checking and then the electrode was washed with water and dried in air. The polished GC electrode was directly modified with either as-prepared GOx stabilized Au NPs or GOx–FL Au NPs by drop casting it onto GC surface and dried overnight. After that the resulting modified electrode was directly dipped into Nafion solution for about 1–2 minutes and then dried with N2 gas. Finally, both the GOx–Au NPs and GOx–FL Au NPs modified GC electrodes were analyzed using electrochemical measurements and for the subsequent glucose detection. CV analysis was carried out by cycling the potential of working electrode within pre-defined limits either at a fixed scan rate or over a wide range of scan rate. Similarly CA studies were carried out by monitoring the change in current with respect to change in concentration of glucose at a fixed potential corresponding to redox potential of the enzyme, GOx. The concentration was varied over a wide range by incremental addition and all the other parameters were displayed in the respective figures.
2.4. Detection of glucose by colourimetric method using a bioassay
Similarly colorimetric analysis was performed by using a bio-assay for hydrogen peroxide (H2O2) namely, a standard aqueous solution of ABTS (2,2′-azino-bis(3-ethylbenzothiazoline)-6-sulphonic acid) by monitoring the change in absorption (colour change) at a fixed wavelength of 419 nm using UV-visible spectroscopy. In a typical experiment, standard aqueous solutions of 50 mM ABTS and 10 mM glucose in phosphate buffer solution (PBS, pH = 7.0) were prepared and incubated at 37 °C for 30 minutes. These solutions were used as a stock solution. About 10 µL aliquots of either GOx–Au NPs or GOx–FL Au NPs were taken and 20 µL of standard 50 mM ABTS solution was further added. Then different concentrations of glucose were added and the mixture was once again incubated at 37 °C for 30 minutes. Finally, the resultant solution was analyzed using UV-visible spectroscopy by measuring the absorbance value at a fixed wavelength of 419 nm using the microplate reader. Furthermore, in order to evaluate the analytical feasibility of the proposed biosensors, both electrochemical and colourimetric detection of glucose was carried out using human blood serum samples. These samples were obtained from our Institute clinic with a proper permission and approval from the committee constituted at the Institute level. Serum samples were stored under refrigeration when not in use. All these experiments were performed in compliance with the relevant laws and institutional guidelines and the institutional committees have approved these experiments. It is also worth mentioning here that informed consent was obtained for these experimentations where human blood serum samples were employed for real sample analysis.
2.5. Instrumentation
Electrochemical techniques namely CV and CA experiments were carried out using AUTOLAB equipment procured from The Netherlands. The corresponding studies and their analysis were carried out using General Purpose Electrochemical Software (GPES) provided by them. Absorbance and fluorescence spectra were recorded by using UV-Visible Perkin Elmer Lamda 650 with Infinite M200MPC model equipment. TEM images were obtained using TECNAI G2 20 FEI model operated at 200 kW. TEM samples were prepared by drop casting method on a copper grid. FTIR spectra were recorded using Bruker Optic GmbH TENSUR 27 model operated with Opus 162 software version 6.5m.
3. Results and discussion
3.1. Transmission electron microscope (TEM) analysis
Structure and morphology of the enzyme stabilized resultant Au nanomaterials are analyzed using TEM and the corresponding images are displayed in Fig. 1. It can be seen from the figure that as-prepared GOx stabilized Au NPs shows an agglomerated (Fig. 1D) micron sized particles in which Au NPs align in the polypeptide protein structure of the enzyme resulting in a ‘worm-like’ morphology26,27 (Fig. 1B). Upon reducing the pH from alkaline to neutral (from 10 to 7) using an acid treatment procedure, these particles disintegrate to form even smaller Au NPs (Fig. 1A). Particle size analysis of this TEM image (Fig. 1C) reveals the size distribution is predominantly in the range of 2–9 nm and the average particle size is determined to be 5.4 ± 0.7 nm. Interestingly analysis of individual single Au NPs particle (Fig. 1A; inset) shows the formation of clear lattice fringe pattern (ESI; Fig. S1†) and the corresponding SAED pattern provided in the inset of Fig. 1B reveals the formation of crystalline fcc structure of Au.
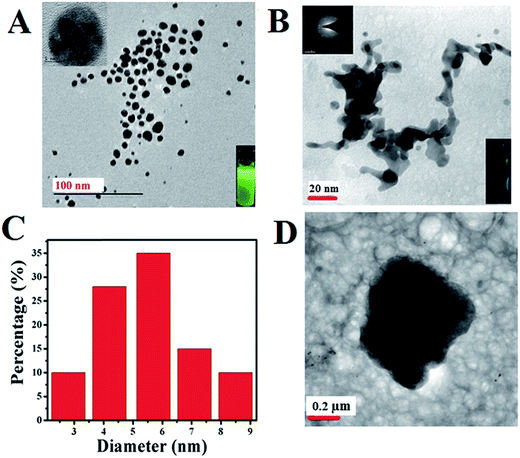 |
| | Fig. 1 TEM images of FL Au NPs (A) and the corresponding particle size distribution analysis (C). Inset: zoomed version of TEM image of single FL Au nanoparticle showing the formation of lattice fringes. Similarly TEM images of as-prepared GOx–Au NPs (B & D) at different scales along with its corresponding SAED pattern. Inset: (A) yellowish green fluorescence emission colour obtained from GOx–FL Au NPs by disintegration and of agglomerated GOx–Au NPs (B) exhibiting no fluorescence upon exposure to 365 nm UV light. | |
3.2. UV-visible and photoluminescence (PL) spectroscopic studies
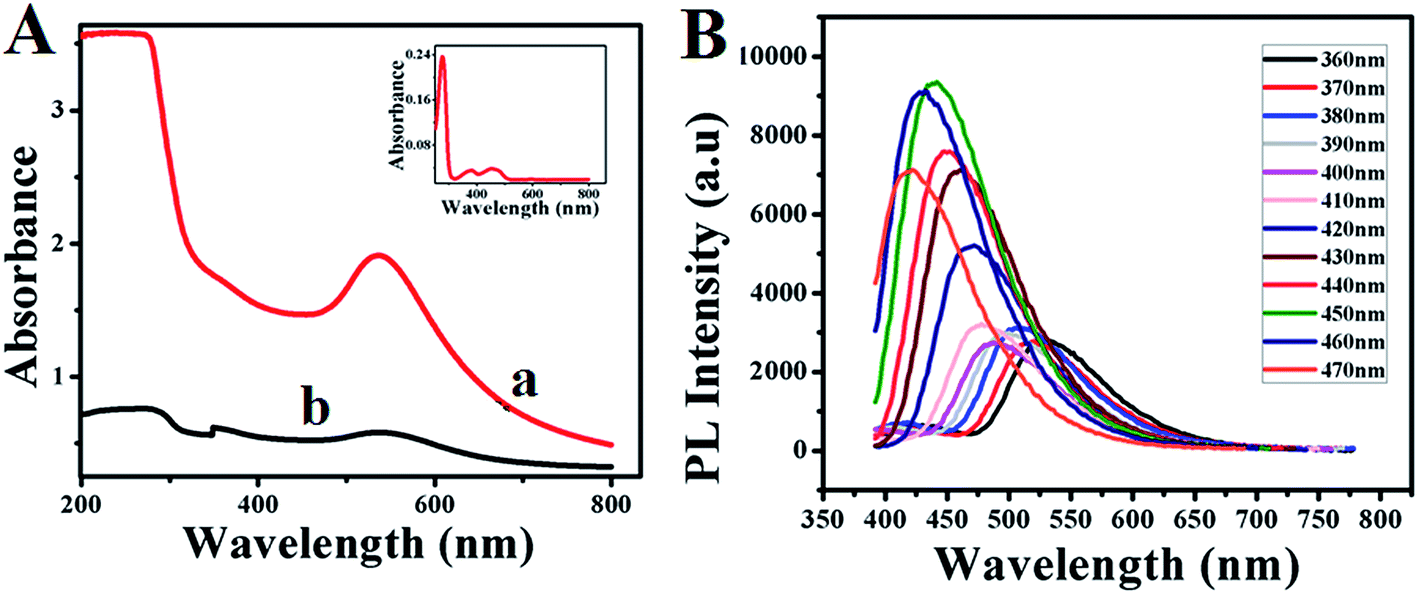
Further the formation of GOx–Au NPs and GOx–FL Au NPs along with the conformational changes of protein molecules present within the enzyme, GOx are analyzed using UV-vis spectroscopy. Fig. 2A shows the UV-vis spectra of as-prepared GOx stabilized Au NPs (a) and acid treated Au NPs resulting in the formation of fluorescence emission (b). For comparison a similar spectrum obtained for GOx alone in PBS buffer is also shown as inset. In the case of GOx alone, three well defined absorbance peaks appeared at 278 nm, 374 nm and 452 nm respectively. The absorbance peak at 278 nm corresponds to the characteristic peak of polypeptide chain of the protein structure and the peaks at 374 nm and 452 nm are assigned to the oxidized forms of flavin (FAD–FADH2) group.32 On the other hand the absorbance peak observed at 550 nm in the case of GOx–Au NPs (Fig. 2a) and the acid treated one, GOx–FL Au NPs (Fig. 2b) is designated to the characteristic absorption peak corresponding to the surface plasmon of Au NPs. It can be noted that the absorption peak at 278 nm disappeared for GOx–Au NPs due to the alignment of Au NPs in the protein network resulting in conformational change of the enzyme. It is also evident from Fig. 1B and correlates very well with TEM analysis. Similarly in the case of disintegrated GOx–FL Au NPs this peak is slightly shifted to 304 nm owing to the protonation of protein molecules due to the acid treatment resulting in red shift of the absorbance value (ESI; Fig. S2†). These results clearly reveal the formation of GOx stabilized Au NPs and FL Au NPs by retaining its redox moiety of FAD–FADH2.
 |
| | Fig. 2 (A) UV-vis spectra of (a) as-prepared GOx–Au NPs (red line) and (b) GOx–FL Au NPs (black line). Inset shows the UV-vis spectrum of the enzyme, GOx alone in PBS (pH = 7.0) buffer solution. (B) Photoluminescence (PL) emission spectra of disintegrated GOx–FL Au NPs obtained at different excitation wavelengths ranging from 360 nm to 470 nm. | |
Interestingly, acid treated GOx–Au NPs shows a fluorescent behaviour. In order to find out whether the fluorescence behaviour arises from the smaller Au NPs due to the acid treatment or from the enzyme, GOx, a control experiment was carried out by recording their corresponding photoluminescence (PL) spectra (ESI; Fig. S3†). These control experiments are essential and critical since the UV-vis spectrum of GOx alone (inset of Fig. 2A) displays features corresponding to the flavin center that might also exhibit the PL response. These PL emission spectra were recorded at an excitation wavelength of 360 nm and the results show that both the enzyme GOx alone and GOx stabilized FL Au NPs display an emission peak at 540 nm (ESI; Fig. S3†). Surprisingly the fluorescence intensity of GOx–FL Au NPs is increased by more than four folds when compared to the intensity associated with that of GOx alone. This is because of the plasmonic enhancement which arises due to the interaction of Au NPs and the surface ligand; here in this case the enzyme, GOx. Since the size of Au NPs is relatively larger than 2 nm, they exhibit surface plasmon resonance (SPR) and hence the fluorescence of the fluorophore can be enhanced by these surface plasmons. As the fluorophores are placed adjacent to metal nanoparticles, their fluorescence intensity can be altered enormously due to increase in radiative emission rate, which is caused by the increased local density of photonic state around the nanoparticles.33 Hence, upon exposure to UV light (365 nm) these Au NPs emit a strong yellowish green fluorescence in contrast to GOx–Au NPs as shown in the insets of Fig. 1A and B. These results clearly rule out the possibility of formation of Au nanoclusters and the observed fluorescence behaviour is essentially due to the enhancement of fluorescence arising from GOx using tiny Au NPs. Furthermore PL spectroscopic studies are performed for GOx–FL Au NPs by recording the emission spectra at different excitation wavelengths ranging from 360 nm to 470 nm and the corresponding spectra are shown in Fig. 2B. It can be noticed that at an excitation wavelength of 360 nm, maximum emission is observed at 540 nm and upon increasing the excitation wavelength, a blue shift in emission is observed. These PL spectra clearly display excitation wavelength dependent emission behaviour and the maximum emission is observed at an excitation wavelength of 450 nm. Quantum yield value of GOx–FL Au NPs is determined by using a standard reference fluorophore of Rhodamine B in water and it is calculated to be 5% ([ESI†]).
3.3. FTIR studies
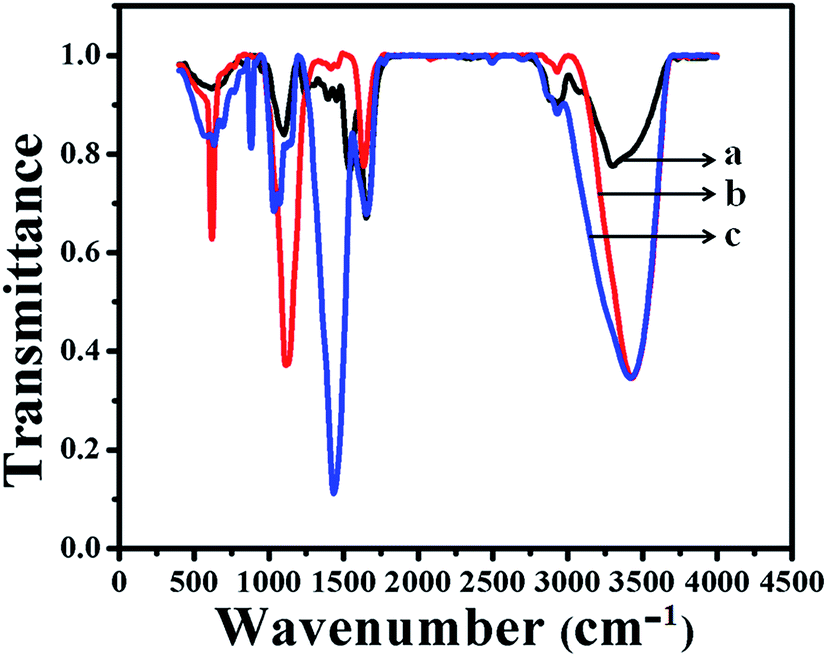
Typical FTIR spectra of as-prepared GOx–Au NPs and GOx–FL Au NPs are shown in Fig. 3. For comparison a similar spectrum of the enzyme, GOx alone is also displayed. The formation of peak at 3409 cm−1 in the case of GOx (Fig. 3a) is assigned to stretching frequency of either –OH or amine groups present within its structure and this peak is also observed for GOx–Au NPs (Fig. 3c) and GOx–FL Au NPs (Fig. 3b) suggesting the stabilization of these nanomaterials by the enzyme, GOx. Further the peaks at 1660 cm−1 and 1540 cm−1 (Fig. 3a) indicate the presence of typical amide I (C![[double bond, length as m-dash]](https://www.rsc.org/images/entities/char_e001.gif) O) and amide II (NH) bonds within the enzyme. On contrary GOx stabilized Au NPs (Fig. 3c) and FL Au NPs (Fig. 3b) exhibit the peaks at 1540 cm−1 due to amide I (CO) but the peak at 1660 cm−1 disappeared owing to the conformational change of the enzyme occurs due to stabilization. Moreover GOx–FL Au NPs (Fig. 3b) show a small doublet peak at 1450 cm−1 and 1400 cm−1 respectively, indicate the presence of both COO− and COOH groups similar to the enzyme alone (Fig. 3a). But GOx–Au NPs (Fig. 3c) shows only a strong intense peak at 1435 cm−1 because of the presence of COO− ions and not the stretching frequency due to COOH group since these NPs are prepared in alkaline medium where COO− ions dominate. These results are in agreement with our UV-vis analysis discussed earlier and confirms the stabilization of these nanomaterials using GOx.
O) and amide II (NH) bonds within the enzyme. On contrary GOx stabilized Au NPs (Fig. 3c) and FL Au NPs (Fig. 3b) exhibit the peaks at 1540 cm−1 due to amide I (CO) but the peak at 1660 cm−1 disappeared owing to the conformational change of the enzyme occurs due to stabilization. Moreover GOx–FL Au NPs (Fig. 3b) show a small doublet peak at 1450 cm−1 and 1400 cm−1 respectively, indicate the presence of both COO− and COOH groups similar to the enzyme alone (Fig. 3a). But GOx–Au NPs (Fig. 3c) shows only a strong intense peak at 1435 cm−1 because of the presence of COO− ions and not the stretching frequency due to COOH group since these NPs are prepared in alkaline medium where COO− ions dominate. These results are in agreement with our UV-vis analysis discussed earlier and confirms the stabilization of these nanomaterials using GOx.
 |
| | Fig. 3 FTIR spectra of the enzyme, GOx alone (a), GOx stabilized FL Au NPs (b) and GOx–Au NPs (c) respectively. | |
Disintegration of agglomerated Au NPs leading to the formation of FL Au NPs on reducing the pH from alkaline to neutral condition is further confirmed by UV-vis spectroscopic studies with aid of cysteine addition. This particular experiment will explicitly reveal disintegration of Au NPs. In case of agglomerated structure addition of cysteine results in no change in the surface plasmon absorption peak appeared at 550 nm corresponding to Au NPs. On the other hand, GOx–FL Au NPs leads to a shift in the surface plasmon absorption peak due to phase exchange reaction.34,35 In our study, GOx–Au NPs shows an absorption peak at 550 nm and there is no shift in the absorption peak with respect to varying concentration of cysteine (ESI; Fig. S4B†). On contrary, GOx–FL Au NPs shows a decrease in intensity values of the surface plasmon absorption peak at 550 nm and exhibits a new peak at 660 nm suggesting the phase exchange reaction due to cysteine addition (ESI; Fig. S4A†). In addition, the colour of the solution changes from red to blue in the case of GOx–FL Au NPs on adding cysteine suggesting a phase exchange process due to the agglomeration of NPs.34,35 This behaviour is not observed in case of GOx–Au NPs since it already possess an aggregated structure as indicated from TEM analysis (Fig. 1B and D). These results clearly confirm the formation of GOx–FL Au NPs from as-prepared GOx–Au NPs by disintegration on changing pH of the solution.
3.4. Electrochemical investigation of GOx stabilized Au NPs and FL Au NPs
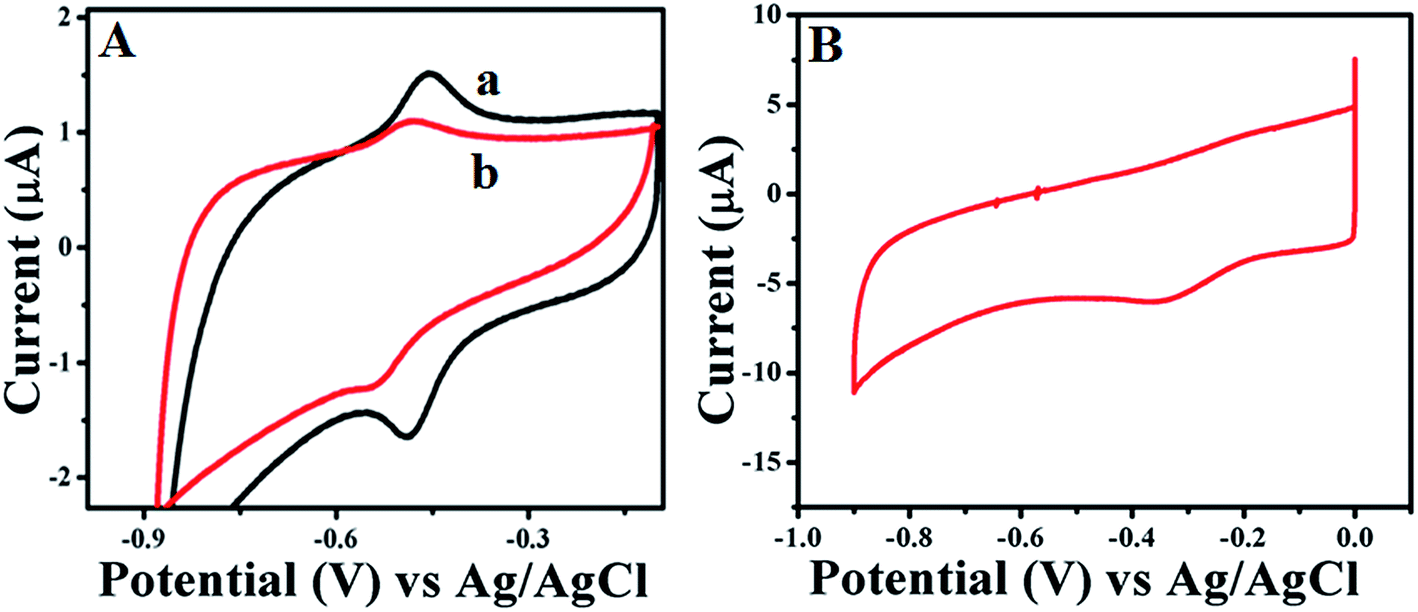
Further electrochemical properties of GOx stabilized Au NPs and FL Au NPs are investigated by drop casting them onto GC electrode using CV and CA studies carried out in PBS (pH = 7.0) buffer aqueous solution under N2 atmosphere. Fig. 4A shows the CV studies performed using GOx–Au NPs (Fig. 4a) and GOx–FL Au NPs (Fig. 4b) modified GC electrode at a fixed scan rate of 50 mV s−1. For comparison a similar CV recorded for GOx modified GC electrode without the Au NPs was also shown (Fig. 4B). It can be clearly noticed the formation of redox peaks associated with direct electron transfer process of enzyme due to co-factor FAD and FADH2 present within GOx in both the cases of Au NPs modified electrodes in contrast to just GOx enzyme modified electrode where the formation of redox peak is not clear. The corresponding formal potential associated with GOx–Au NPs (Fig. 4a) is determined to be −0.464 mV vs. Ag/AgCl. This potential value is measured by calculating the potential difference between the anodic and cathodic peaks appeared in the voltammogram at a fixed scan rate of 50 mV s−1. Similarly, in the case of GOx–FL Au NPs (Fig. 4b) this formal potential is cathodically shifted to −0.550 mV vs. Ag/AgCl. This may be due to the different orientation of enzyme on FL Au NPs in which the redox active cofactor enzyme is deeply buried. Peak to peak separation between the anodic and cathodic peaks (ΔEp) is calculated to be 26 mV and the anodic and cathodic peaks current ratio, Ipa/Ipc is equal to 1. These observations clearly indicate that the electron transfer reaction associated with that of enzyme GOx is a reversible, two proton–two electron (2H, 2e−) process and the native structure of the enzyme is retained along with its redox property.
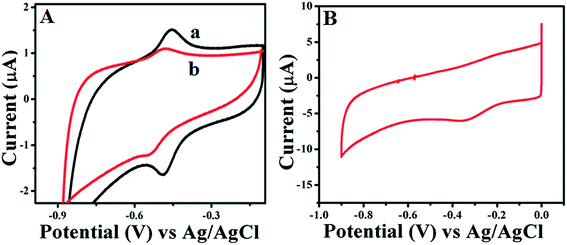 |
| | Fig. 4 (A) CVs recorded at a fixed scan rate of 50 mV s−1 for (a) as-prepared GOx–Au NPs and (b) GOx stabilized FL Au NPs modified GC electrode in PBS (pH = 7.0) buffer solution under N2 atmosphere. (B) CV recorded for comparison at a fixed scan rate of 50 mV s−1 for GOx modified GC electrode without the Au NPs in PBS (pH = 7.0) buffer solution under N2 atmosphere. | |
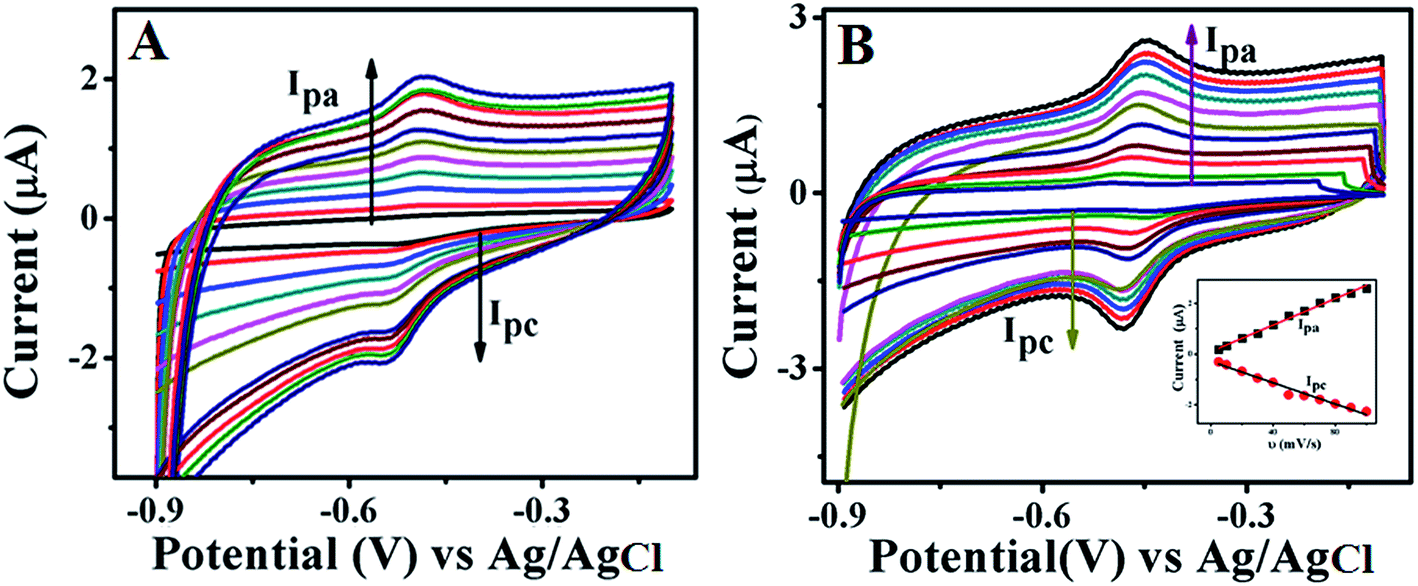
Fig. 5 displays CVs recorded at different scan rates ranging from 5 mV s−1 to 100 mV s−1 for GOx stabilized FL Au NPs (A) and GOx–Au NPs (B) in PBS (pH = 7.0) buffer aqueous solution under N2 atmosphere. These studies are carried out in order to investigate the effect of scan rate on the redox behaviour of the enzyme. With increase in scan rate, a systematic increase in redox peak currents is observed. In this figure inset shows a plot of variation of both anodic and cathodic peak currents with respect to scan rate. This particular plot is linear for both the cases suggesting a good reversible electron transfer process for the redox reaction which is surface confined indicating that the GOx enzyme is anchored on top of both the FL Au NPs and Au NPs. This study clearly indicates that the enzyme retains its redox activity and also is stable over a wide range of scan rate.
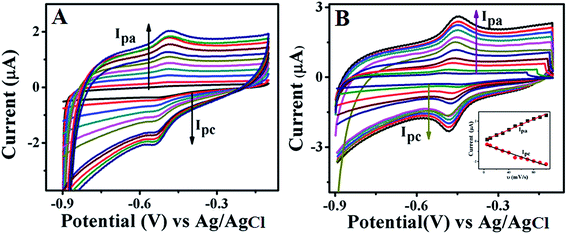 |
| | Fig. 5 CVs of GOx stabilized FL Au NPs (A) and Au NPs (B) modified GC electrode at various scan rates viz. 5, 10, 20, 30, 40, 50, 60, 70, 80, 90, and 100 mV s−1 in PBS (pH = 7.0) solution under N2 atmosphere. Inset shows the linear relationship plots of scan rate vs. current values of both oxidation and reduction peaks corresponding to the enzyme, GOx. | |
Surface coverage (Γ) value of the enzyme can be calculated by integrating the charge associated with the redox peak at a fixed scan rate and by using the equation, Γ = Q/nFA, where Q is the charge corresponding to the redox reaction in CV (Fig. 4) after the background correction, ‘n’ is the number of electrons involved in direct electron transfer (DET) of the enzyme cofactor, which is 2, F is the Faraday's constant and A is the geometric area of electrode. Using this equation, the surface coverage value of the enzyme is calculated to be 1.815 × 10⁻¹¹ mol cm−2 and 1.310 × 10⁻¹³ mol cm−2 for GOx stabilized Au NPs and GOx–FL Au NPs respectively. These values are comparable to the surface coverage values reported for immobilized GOx using other methods such as dihexadecylphosphate employed with colloidal Au NPs (7.82 × 10⁻¹² mol cm−2)36 and carbon paste electrode coated with colloidal Au modified GOx electrode (9.8 × 10⁻¹² mol cm−2).37 These results show that a large number of GOx moieties could be loaded onto the surfaces of Au NPs and FL Au NPs which will significantly improve their sensing and catalytic behaviour.
3.5. Detection of glucose using electrochemical method
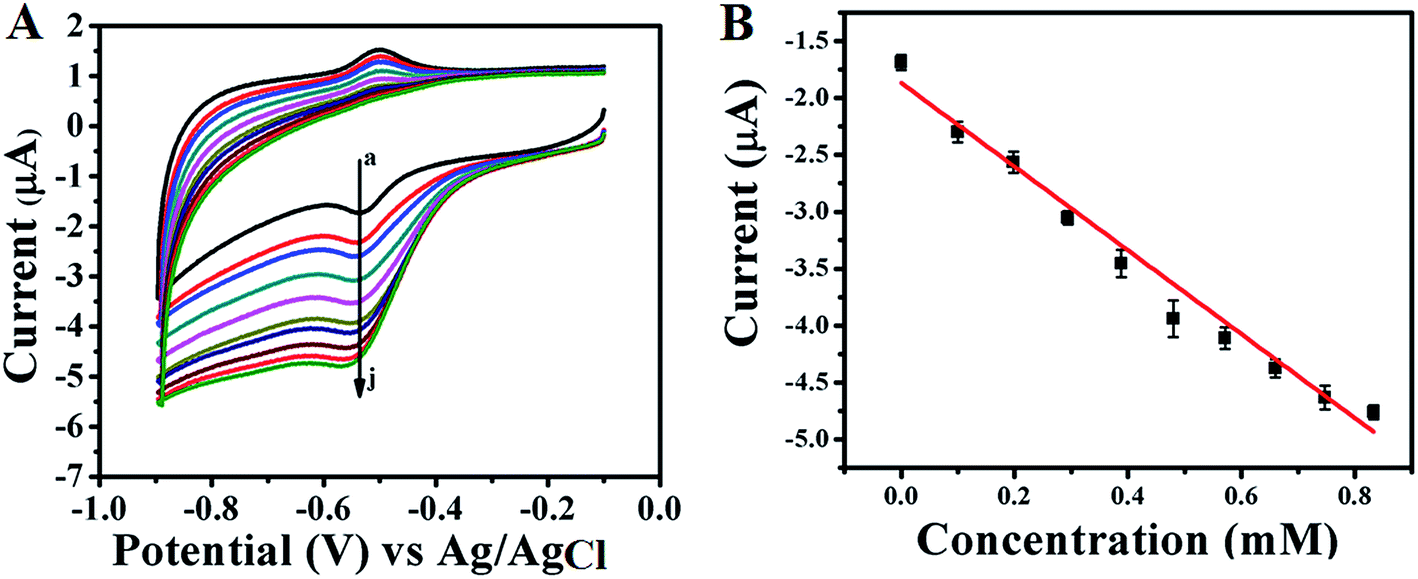
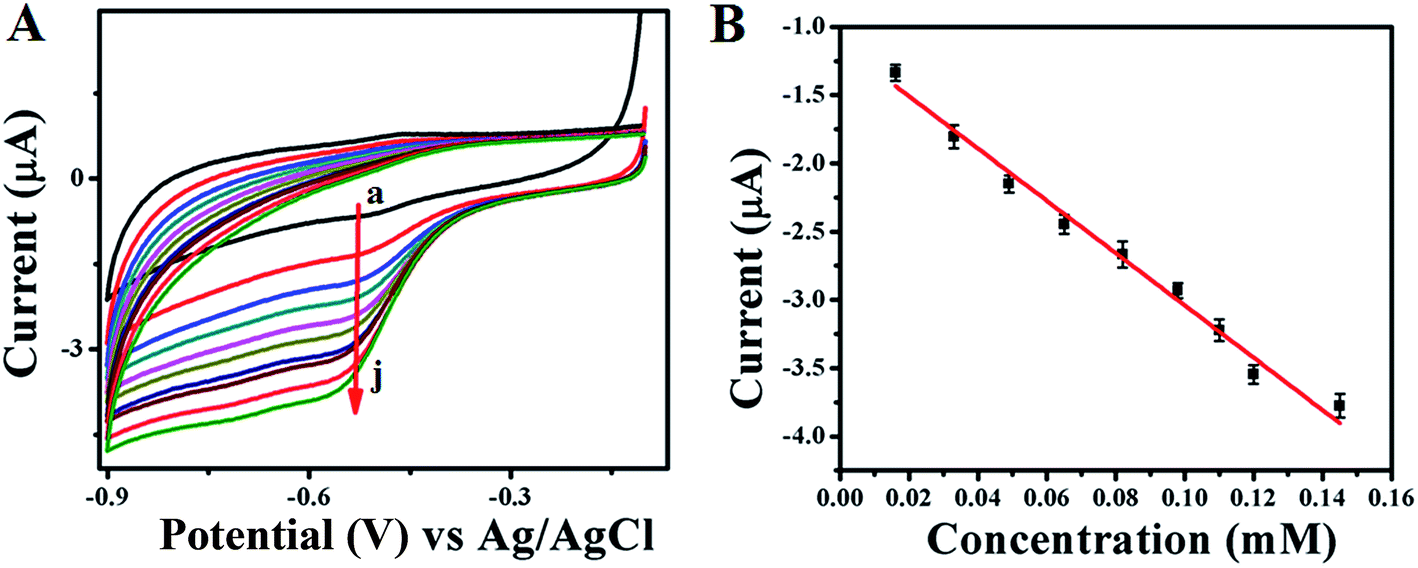
Electrocatalytic activity of GOx enzyme towards glucose oxidation is monitored for both GOx stabilized Au NPs and FL Au NPs by using CV in PBS (pH = 7.0) buffer aqueous solution under N2 atmosphere. Fig. 6A shows the corresponding CVs recorded for GOx–Au NPs modified GC electrode and similarly Fig. 7A shows the CVs recorded using GOx–FL Au NPs modified GC electrode towards glucose addition. For comparison a similar CV recorded under the same condition for both the electrodes before adding any glucose is also shown (Fig. 6A[a] and 7A[a]). The concentration of glucose is varied in physiological range from µM to mM by adding an incremental amount of glucose from a stock solution. It can be visualized from these CVs that increasing concentration of glucose leads to a systematic increase in reduction current suggesting a potential application of this material to be used as an electrochemical biosensor for glucose. Basically GOx oxidizes glucose to glucanolactone resulting in the formation of hydrogen peroxide (H2O2) which is reduced at the reduction potential of the enzyme. With respect to increase in glucose concentration, the amount of H2O2 produced is also enhanced, thereby the increase in reduction current is observed. GOx–FL Au NPs shows a measurable change in reduction current even at low concentration of glucose namely 13 µM and in contrast GOx–Au NPs displays a change in current only at 100 µM glucose concentration. Though the enzyme loading is higher in the case of GOx–Au NPs when compared to GOx–FL Au NPs, the orientation of enzyme by exposing its redox cofactor is suitable in the case of GOx–FL Au NPs which facilitates the electron transfer behaviour and shows a significant change even at a lower concentration of glucose.
 |
| | Fig. 6 (A) CVs recorded for various concentrations of glucose addition viz. (a) 0 mM, (b) 0.1 mM, (c) 0.198 mM, (d) 0.294 mM, (e) 0.388 mM, (f) 0.48 mM, (g) 0.571 mM, (h) 0.660 mM, (i) 0.747 mM and (j) 0.833 mM respectively using GOx–Au NPs modified GC electrode in PBS (pH = 7.0) solution under N2 atmosphere. In this figure arrow indicates the direction of increasing concentration of glucose. (B) A plot of change in current with respect to added glucose concentrations. | |
 |
| | Fig. 7 (A) CVs recorded for various concentrations of glucose addition viz. (a) 0 mM, (b) 0.013 mM, (c) 0.033 mM, (d) 0.049 mM, (e) 0.065 mM, (f) 0.082 mM, (g) 0.098 mM, (h) 0.110 mM, (i) 0.12 mM and (j) 0.145 mM respectively using GOx–FL Au NPs modified GC electrode in PBS (pH = 7.0) solution under N2 atmosphere. In this figure arrow indicates the direction of increasing concentration of glucose. (B) A plot of change in current with respect to added glucose concentrations. | |
In order to estimate the sensor characteristics such as linear concentration range, sensitivity and limit of detection, the measured current values for each addition of glucose are plotted against the concentration for both the cases of GOx stabilized Au NPs and FL Au NPs. The corresponding plots are shown in Fig. 6B and 7B respectively. A linear increase in current with respect to increasing glucose concentration is noted. A linear concentration range of 100 µM to 0.8 mM glucose (correlation coefficient of 0.9805), a sensitivity of 3.744 µA mM−1 and a detection limit of 100 µM are determined from this study for GOx–Au NPs. Similarly in the case of GOx–FL Au NPs, a linear concentration range of 13 µM to 0.15 mM glucose (correlation coefficient of 0.9950), a sensitivity of 18.85 µA mM−1 and a detection limit of 13 µM are calculated. Our results clearly reveal that the addition of even smaller concentration of glucose results in significant enhancement in the reduction current and this is attributed to the higher amount of enzyme loading on Au NPs and FL Au NPs. Among the two, FL Au NPs exhibit a lower detection limit and higher sensitivity due to the favourable orientation of enzyme by exposing the redox cofactor that facilitates DET for glucose oxidation though the enzyme loading is higher for Au NPs. Nevertheless both the nanomaterials display a promising characteristic for glucose detection suggesting the possible use as an electrochemical biosensor. This is further confirmed by CA experiments carried out using GOx–Au NPs modified GC electrode for glucose detection (ESI; Fig. S5†). A typical stair-case model of increasing reduction current with respect to incremental addition of glucose is observed that correlated very well with our CV results suggesting the potential application of these materials as electrochemical biosensors for the detection of glucose.
Efficiency of enzymatic catalysis is further analyzed by using Michaelis–Menten equation and the apparent rate constant (KM) value measured from this analysis is generally used to evaluate the activity of the enzyme (GOx in this case) kinetics. This parameter is determined from Lineweaver–Burk equation given below by following the enzyme–substrate kinetics.38–41
| | |
1/Iss = (1/Imax) + KM/(ImaxC)
| (1) |
where
Iss is the steady state current measured after the addition of glucose,
Imax is the maximum current measured,
KM is the Michaelis–Menten apparent rate constant and
C is the concentration of the substrate, glucose respectively. In this work,
KM value corresponding to GOx enzymatic catalysis is determined by using Lineweaver–Burk plot, which is a plot of 1/
Iss vs. 1/
C (ESI; Fig. S6
†). The apparent rate constant,
KM values of 334 µM and 50 µM are determined for GOx–Au NPs and GOx–FL Au NPs respectively, indicating the higher affinity of GOx stabilized FL Au NPs towards glucose over GOx–Au NPs. Moreover, turnover rate (TR) for the enzymatic catalysis can be calculated using the following equation.
38–41where
Iss is the steady state current measured for the addition of glucose, ‘
n’ is the number of electrons involved in the enzymatic reaction, ‘
F’ is the Faraday's constant and
Γ is the surface coverage value of the enzyme respectively. In our case, GOx–Au NPs exhibits TR value of 1.6 s
−1 and GOx stabilized FL Au NPs displays an impressive TR value of 2.78 × 10
2 s
−1. These values indicate the number of substrate molecules (glucose in this work) converted into product per enzyme molecule per second. It can be noted that GOx–FL Au NPs exhibits a higher value when compared to GOx–Au NPs and these values are quite high and impressive for the enzymatic catalysis. Furthermore, the efficiency of GOx catalytic activity is analyzed by calculating the ratio, TR/
KM which indicates how efficiently the enzyme, GOx converts the substrate, glucose into product, gluconolactone. This value is estimated to be 5.33 × 10
−1 M
−1 s
−1 for GOx–Au NPs and 14.33 M
−1 s
−1 for GOx stabilized FL Au NPs respectively. These results and analyses clearly reveal the efficiency of the enzymatic catalysis of GOx is significantly greater in the case of GOx–FL Au NPs and can potentially be used for electrochemical bio-sensing of glucose.
3.6. Glucose sensing using colourimetric method
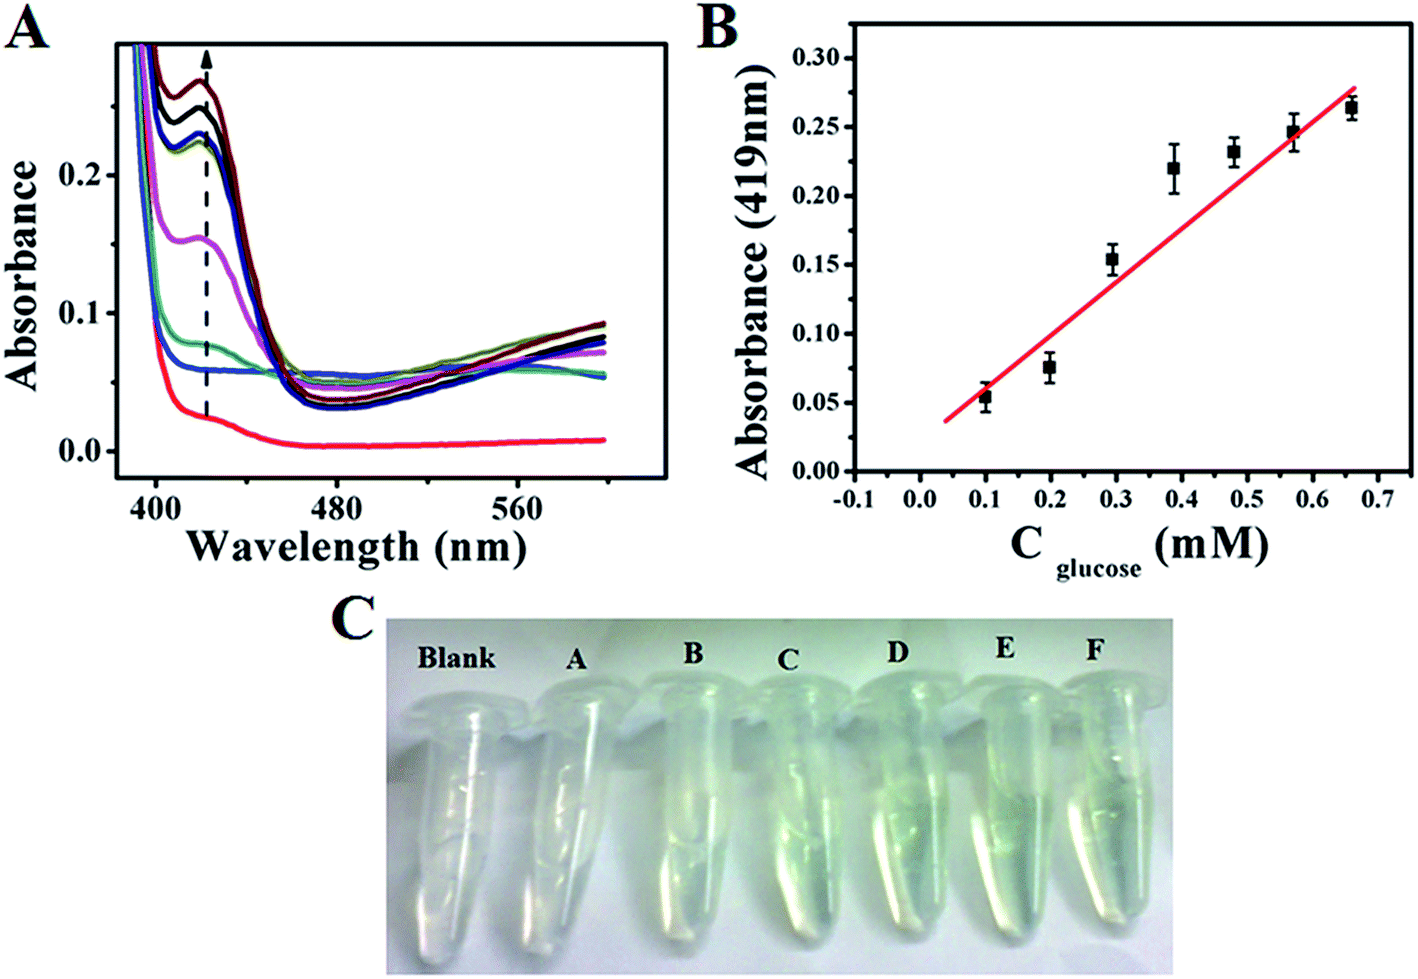
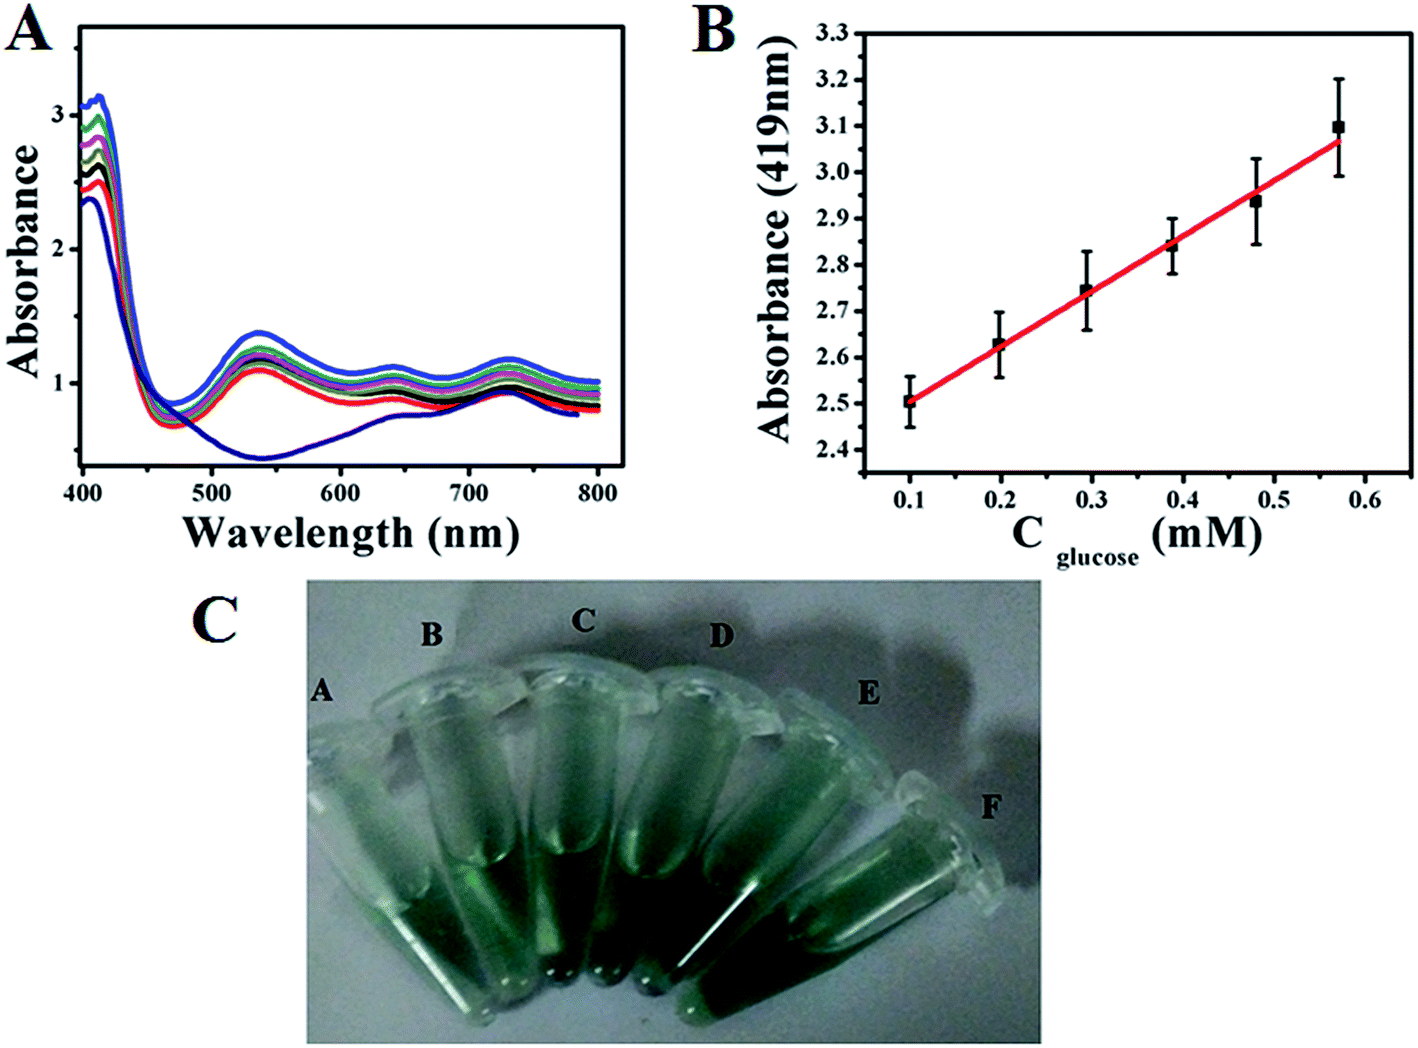
Similarly, colourimetric measurement is also performed for the determination of glucose using both GOx–Au NPs and GOx–FL Au NPs by monitoring the enzymatic activity of glucose oxidation using ABTS, acting as a H2O2 bio-mimic assay. During the oxidation of glucose by GOx, H2O2 is produced as mentioned earlier, which reacts with ABTS to form a resultant green coloured solution that exhibits a prominent absorption peak at 419 nm in UV-vis spectrum.42,43 Fig. 8A and 9A show the typical UV-vis absorption spectra of ABTS bio-assay for different concentrations of glucose varied between 100 µM and 0.7 mM using GOx–Au NPs and GOx–FL Au NPs respectively. Absorption value at 419 nm increases systematically with respect to increase in glucose concentration due to the oxidation of ABTS to ABTS+ by H2O2 produced during the enzymatic oxidation of glucose. This leads to clear variation in intensity of the resultant green coloured solution with respect to increasing addition of glucose concentrations (Fig. 8C and 9C). Fig. 8B and 9B display a linear variation in the absorbance value measured at a fixed wavelength of 419 nm with respect to increase in glucose concentrations for both GOx–Au NPs and GOx–FL Au NPs respectively. It can be noted that the change in absorbance values are quite significant and perfectly linear in the case of GOx–FL Au NPs when compared to that of GOx–Au NPs and these results correlate very well with our electrochemical studies. The detection limit values are estimated to be 177 µM for GOx–Au NPs and 41 µM for GOx–FL Au NPs suggesting the potential application of these materials for naked eye detection of glucose. Photographs depicting the appearance of green colour with respect to increasing concentrations of glucose for the cases of GOx–Au NPs and GOx–FL Au NPs are shown in Fig. 8C and 9C respectively. It can be noted that when compared to blank where no glucose is added, other concentrations of added glucose clearly display a green colour formation. This effect is pronounced in the case of GOx–FL Au NPs on comparison to GOx–Au NPs indicating the better enzymatic catalysis in the former case.
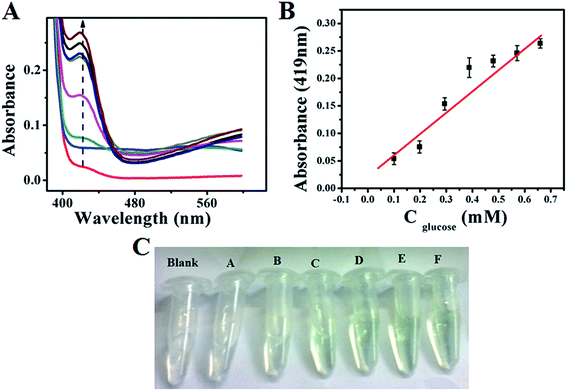 |
| | Fig. 8 (A) UV-vis absorption profiles of ABTS bio-assay for addition of various concentrations of glucose (100 µM to 0.7 mM) using GOx–Au NPs towards colourimetric sensing of glucose. In this figure arrow indicates the increasing direction of absorbance values. (B) A plot of linear variation of absorbance measured at 419 nm vs. concentration of glucose. (C) Photograph depicting variation in green colour intensity with respect to addition of various concentrations of glucose using ABTS + GOx–Au NPs solution. Here blank refers to 0 mM and (A) 0.1 mM, (B) 0.198 mM, (C) 0.294 mM, (D) 0.388 mM, (E) 0.480 mM, and (F) 0.571 mM concentrations of glucose respectively. | |
 |
| | Fig. 9 (A) UV-vis absorption profiles of ABTS bio-assay for addition of various concentrations of glucose (100 µM to 0.6 mM) using GOx–FL Au NPs towards colourimetric sensing of glucose. (B) A plot of linear variation of absorbance measured at 419 nm vs. concentration of glucose. (C) Photograph depicting variation in green colour intensity with respect to addition of various concentrations of glucose using ABTS +GOx–FL Au NPs solution namely (A) 0.1 mM, (B) 0.198 mM, (C) 0.294 mM, (D) 0.388 mM, (E) 0.480 mM, and (F) 0.571 mM concentrations of glucose respectively. | |
Based on our observations and results, a simple mechanism is proposed as given below.
| | |
GOx(ox) + glucose → GOx(red) + gluconolactone + H2O2
| (3) |
| | |
H2O2 + 2e− → H2O – electrochemical method
| (4) |
| | |
H2O2 + ABTS → H2O + ABTS+ – colourimetric method
| (5) |
On adding the substrate glucose, the enzyme, GOx oxidizes it to gluconolactone and during this process H2O2 is produced as a by-product. In case of electrochemical method, the product H2O2 is reduced and by monitoring the change in reduction current with respect to increase in glucose concentration, an enzymatic electrochemical biosensor for glucose detection is demonstrated. Similarly, in the case of colourimetric method, H2O2 reacts with ABTS to form a green coloured solution and its intensity increases with increasing addition of glucose exhibiting the feasibility of developing a colourimetric sensor for glucose. Particularly, in this work a dual mode sensor matrix based on GOx stabilized FL Au NPs and Au NPs is proposed and demonstrated for glucose detection. Typical sensor characteristics in terms of sensitivity, detection limit and Michaelis–Menten rate constant values obtained in this work using both electrochemical and colourimetric methods are compared with various other enzyme based materials reported in literature as shown in Table 1.28,29,36,44–56 It can be seen from the table that GOx–FL Au NPs exhibit a higher sensitivity, lower detection limit and apparently lower KM values for electrochemical detection of glucose when compared to many other electrode materials reported for enzymatic detection of glucose. Similarly in the case of colourimetric detection method using ABTS bio-assay GOx stabilized FL Au NPs display a lower detection limit compared to other materials.28,54,55 Overall superior sensor characteristics observed in the case of GOx–FL Au NPs over GOx–Au NPs and other materials suggest the possibility of employing such a material for detection of glucose. Moreover, the concept of developing a single material using a greener approach for dual mode sensing of an analyte is new and highlighted in the present work.
Table 1 Comparison of sensitivity, detection limit and Michaelis–Menten rate constant values obtained for the sensor matrix proposed in this work with various other enzyme based materials reported for glucose detectiona
| Sample |
Method |
Sensitivity (µA mM−1) |
Detection limit (µM) |
Michaelis–Menten rate constant KM (mM) |
Reference |
| PGE – pyrolytic edge plane graphitic disc electrode. CPE – carbon paste electrode. MAPR – m-aminophenol based resin microspheres. CNT – carbon nanotube. PET – polyethylene terephthalate. PPy – polypyrrole. GCE – glassy carbon electrode. GR – graphite rod. PMS – N-methylphenazonium methyl sulphate. |
| Au/sol–gel/Au NPs/cystamine/GOx |
Electrochemical |
8.3 |
23 |
— |
44 |
| GOx/CdS/PGE |
Electrochemical |
7.0 |
500 |
— |
45 |
| GOx/Au/CPE |
Electrochemical |
8.4 |
100 |
— |
36 |
| Au NPs/GOx/graphite |
Electrochemical |
— |
80 |
17.6 |
46 |
| GOx/Ag NPs/MAPR/GCE |
Electrochemical |
— |
100 |
— |
47 |
| Pt/Rh/Au NPs–GOx–Nafion |
Electrochemical |
— |
30 |
— |
48 |
| Teflon–Au–CNT–GOx |
Electrochemical |
2.6 |
17 |
14.9 |
49 |
| Graphene/Au NPs/GOx/chitosan |
Electrochemical |
17.5 |
180 |
— |
50 |
| GOx/Au NPs/GR |
Electrochemical |
101.02 |
83 |
19.9 |
29 |
| PET/Ti/Au/ZnO:Co/GOx |
Electrochemical |
13.3 |
20 |
21 |
51 |
| Pd–GOx–Nafion–CNT |
Electrochemical |
— |
150 |
— |
52 |
| Ppy/CNT/GOx–GCE |
Electrochemical |
0.023 |
200 |
— |
53 |
| GOx/chitosan/Nafion–CNT/GCE |
Electrochemical |
0.28 |
35 |
— |
54 |
| GOx–Au NPs/GCE |
Electrochemical |
3.744 |
100 |
0.334 |
Present work |
| GOx–FL Au NPs/GCE |
Electrochemical |
18.85 |
13 |
0.050 |
Present work |
| Fe3O4 NPs + ABTS + GOx solution |
Colourimetric |
— |
50 |
— |
55 |
| HRP–Au NPs + ABTS |
Colourimetric |
— |
400 |
— |
56 |
| GOx–Au NPs + PMS |
Spectrophotometry |
— |
— |
— |
28 |
| GOx–Au NPs + ABTS |
Colourimetric |
— |
177 |
— |
Present work |
| GOx–FL Au NPs + ABTS |
Colourimetric |
— |
41 |
— |
Present work |
3.7. Feasibility studies for possible analytical applications
Finally to analyze the feasibility of employing these nanomaterials for analytical applications in clinical diagnosis, GOx–FL Au NPs are used for the determination of glucose using human blood serum samples collected from our Institute clinic after obtaining proper permission and approval as mentioned above in the Experimental section. Basically three different blood serum samples viz., a person with normal level of glucose (sample 1) and patients with low level (sample 2) and high level of diabetics (sample 3) are obtained. These samples are carefully analyzed after proper dilution. Both electrochemical and colourimetric methods are employed for the detection of glucose. Table 2 summarizes the glucose levels obtained in each of these samples. These values are basically an average value of three different measurements. It can be seen from the table that the determined glucose concentrations matches very well with the glucose levels obtained from clinical analysis. Moreover, both the sensor matrix and the method used in this work for detection of glucose covers a range of patients starting from normal, high diabetic (hyperglycemia) and low diabetic (hypoglycemia) conditions. These results clearly suggest that GOx–FL Au NPs possess a high potential to be employed as a biosensor for the dual mode detection of glucose and it can easily be extended to analytical and clinical applications.
Table 2 Determination of glucose from human blood serum samples using GOx–FL Au NPs based on both colourimetric and electrochemical methods. For comparison glucose levels determined from clinical analysis are also provided
| S. No. |
Glucose level estimated from clinical analysis |
Concentration of glucose determined from colourimetric method |
Concentration of glucose obtained from electrochemical method |
| Sample 1 |
6.52 mmol L−1 (∼118 mg dL−1) |
6.45 ± 0.8 mmol L−1 (∼117 mg dL−1) |
6.50 ± 0.3 mmol L−1 (∼117.5 mg dL−1) |
| Sample 2 |
3.95 mmol L−1 (∼71 mg dL−1) |
3.62 ± 0.5 mmol L−1 (∼69 mg dL−1) |
3.91 ± 0.4 mmol L−1 (∼72 mg dL−1) |
| Sample 3 |
11.95 mmol L−1 (∼215 mg dL−1) |
11.40 ± 0.4 mmol L−1 (∼211 mg dL−1) |
11.80 ± 0.2 mmol L−1 (∼216 mg dL−1) |
4. Conclusions
In summary, a successful preparation of GOx stabilized Au NPs and FL Au NPs for the dual mode sensing of glucose using both electrochemical and colourimetric methods is demonstrated and highlighted in the present work. Interestingly as-prepared GOx–Au NPs do not exhibit any fluorescence in contrast to GOx–FL Au NPs obtained by tuning the pH value from alkaline to neutral condition shows a bright yellowish green fluorescence. Further studies reveal that these GOx–Au NPs and GOx–FL Au NPs are stable for at least more than 6 months. GOx retained its native structure of redox active cofactor enzyme, FAD–FADH2 by enabling the catalytic activity of glucose oxidation indicating the feasibility of developing biosensors using these materials. Several characteristics of the proposed sensor namely linear concentration range, detection limit, sensitivity and Michaelis–Menten rate constant along with turn-over number are estimated. Further it is possible to extend the application of such fluorescent NPs in the clinical diagnosis for analytical applications in addition to other fields such as bio-imaging and development of ON–OFF logic gate sensors.
Acknowledgements
AM is thankful to Council of Scientific and Industrial Research (CSIR), India for providing Senior Research Fellowship to pursue his Ph.D. program. Central Instrumentation Facility (CIF) of CSIR – CECRI, Karaikudi is also acknowledged for providing necessary facilities for characterizations and analyses.
References
- C. Shao, B. Yuan, H. Wang, Q. Zhou, Y. Li, Y. Guan and Z. Deng, J. Mater. Chem., 2011, 21, 2863–2866 RSC.
- A. A. Bhirde, V. Patel, J. Gavard, G. Zhang, Ḱ. A. A. Sousa, A. Masedunskas, R. D. Leapman, Ḱ. R. Weigert, J. S. Gutkind and J. F. Rusling, ACS Nano, 2009, 3, 307–316 CrossRef CAS PubMed.
- J. R. Jifang Weng, Curr. Med. Chem., 2006, 13, 897–909 CrossRef.
- J. M. Abad, I. E. Sendroiu, M. Gass, A. Bleloch, A. J. Mills and D. J. Schiffrin, J. Am. Chem. Soc., 2007, 129, 12932–12933 CrossRef CAS PubMed.
- J. M. Abad, M. Gass, A. Bleloch and D. J. Schiffrin, J. Am. Chem. Soc., 2009, 131, 10229–10236 CrossRef PubMed.
- A. Dass, A. Stevenson, G. R. Dubay, J. B. Tracy and R. W. Murray, J. Am. Chem. Soc., 2008, 130, 5940–5946 CrossRef CAS PubMed.
- C.-C. Huang, C.-T. Chen, Y.-C. Shiang, Z.-H. Lin and H.-T. Chang, Anal. Chem., 2009, 81, 875–882 CrossRef CAS PubMed.
- W. Guo, J. Yuan, Q. Dong and E. Wang, J. Am. Chem. Soc., 2010, 132, 932–934 CrossRef CAS PubMed.
- J. Yu, S. A. Patel and R. M. Dickson, Angew. Chem., Int. Ed., 2007, 46, 2028–2030 CrossRef CAS PubMed.
- J. Xie, Y. Zheng and J. Y. Ying, Chem. Commun., 2010, 46, 961–963 RSC.
- H. Wei, Z. Wang, L. Yang, S. Tian, C. Hou and Y. Lu, Analyst, 2010, 135, 1406–1410 RSC.
- Y. Liu, K. Ai, X. Cheng, L. Huo and L. Lu, Adv. Funct. Mater., 2010, 20, 951–956 CrossRef CAS.
- W. Chen, X. Tu and X. Guo, Chem. Commun., 2009, 1736–1738 RSC.
- Y.-C. Shiang, C.-C. Huang and H.-T. Chang, Chem. Commun., 2009, 3437–3439 RSC.
- J. Xie, Y. Zheng and J. Y. Ying, J. Am. Chem. Soc., 2009, 131, 888–889 CrossRef CAS PubMed.
- D. Hu, Z. Sheng, P. Gong, P. Zhang and L. Cai, Analyst, 2010, 135, 1411–1416 RSC.
- A. Retnakumari, S. Setua, D. Menon, P. Ravindran, H. Muhammed, T. Pradeep, S. Nair and M. Koyakutty, Nanotechnology, 2010, 21, 055103 CrossRef PubMed.
- M. A. Habeeb Muhammed, P. K. Verma, S. K. Pal, A. Retnakumari, M. Koyakutty, S. Nair and T. Pradeep, Chem.–Eur. J., 2010, 16, 10103–10112 CrossRef CAS PubMed.
- X. H. Xianxiang Wanga, P. Wu and Y. Lva, Microchem. J., 2011, 99, 327–331 CrossRef.
- S. M. Le Guével and N. Daum, Nanotechnology, 2011, 22, 275103 CrossRef PubMed.
- P. L. Xavier, K. Chaudhari, P. K. Verma, S. K. Pal and T. Pradeep, Nanoscale, 2010, 2, 2769–2776 RSC.
- H. Kawasaki, K. Yoshimura, K. Hamaguchi and R. Arakawa, Anal. Sci., 2011, 27, 591–596 CrossRef CAS PubMed.
- H. Kawasaki, K. Hamaguchi, I. Osaka and R. Arakawa, Adv. Funct. Mater., 2011, 21, 3508–3515 CrossRef CAS.
- C.-L. Liu, H.-T. Wu, Y.-H. Hsiao, C.-W. Lai, C.-W. Shih, Y.-K. Peng, K.-C. Tang, H.-W. Chang, Y.-C. Chien, J.-K. Hsiao, J.-T. Cheng and P.-T. Chou, Angew. Chem., Int. Ed., 2011, 50, 7056–7060 CrossRef CAS PubMed.
- X. Le Gu, H. Benjamin, G. Jung, K. Hollemeyer, V. Trouillet and M. Schneider, J. Phys. Chem. C, 2011, 10955–10963 Search PubMed.
- B. Sharma, S. Mandani and T. K. Sarma, J. Mater. Chem. B, 2014, 2, 4072 RSC.
- F. Wen, Y. Dong, L. Feng, S. Wang, S. Zhang and X. Zhang, Anal. Chem., 2011, 83, 1193–1196 CrossRef CAS PubMed.
- A. Ramanaviciene, G. Nastajute, V. Snitka, A. Kausaite, N. German, D. Barauskas-Memenas and A. Ramanavicius, Sens. Actuators, B, 2009, 137, 483–489 CrossRef CAS.
- N. German, A. Ramanavicius and A. Ramanaviciene, Sens. Actuators, B, 2014, 203, 25–34 CrossRef CAS.
- A. Heller, Nat. Biotechnol., 2003, 21, 631–632 CrossRef CAS PubMed.
- X. Shangguan, H. Zhang and J. Zheng, Electrochem. Commun., 2008, 10, 1140–1143 CrossRef CAS.
- C. Cai and J. Chen, Anal. Biochem., 2004, 332, 75–83 CrossRef CAS PubMed.
- J. R. Lakowicz, K. Ray, M. Chowdhury, H. Szmacinski, Y. Fu, J. Zhang and K. Nowaczyk, Analyst, 2008, 133, 1308–1346 RSC.
- H. Liu and N. Hu, Electroanalysis, 2007, 19, 884–892 CrossRef CAS.
- Y. Wu and S. Hu, Bioelectrochemistry, 2007, 70, 335–341 CrossRef CAS PubMed.
- S. Liu and H. Ju, Biosens. Bioelectron., 2003, 19, 177–183 CrossRef CAS PubMed.
- A. Salimi, E. Sharifi, A. Noorbakhsh and S. Soltanian, Biosens. Bioelectron., 2007, 22, 3146–3153 CrossRef CAS PubMed.
- X. Kang, J. Wang, H. Wu, I. A. Aksay, J. Liu and Y. Lin, Biosens. Bioelectron., 2009, 25, 901–905 CrossRef CAS PubMed.
- B. Wang, B. Li, Q. Deng and S. Dong, Anal. Chem., 1998, 70, 3170–3174 CrossRef CAS PubMed.
- J. Li, S. N. Tan and H. Ge, Anal. Chim. Acta, 1996, 335, 137–145 CrossRef CAS.
- M. Ali, M. N. Tahir, Z. Siwy, R. Neumann, W. Tremel and W. Ensinger, Anal. Chem., 2011, 83, 1673–1680 CrossRef CAS PubMed.
- E. N. Kadnikova and N. M. Kosti, J. Mol. Catal. B: Enzym., 2002, 18, 39–48 CrossRef CAS.
- M. Solís-Oba, V. M. Ugalde-Saldívar, I. González and G. Viniegra-González, J. Electroanal. Chem., 2005, 579, 59–66 CrossRef.
- S. Zhang, N. Wang, Y. Niu and C. Sun, Sens. Actuators, B, 2005, 109, 367–374 CrossRef CAS.
- Y. Huang, W. Zhang, H. Xiao and G. Li, Biosens. Bioelectron., 2005, 21, 817–821 CrossRef CAS PubMed.
- N. German, A. Ramanaviciene, J. Voronovic and A. Ramanavicius, Microchim. Acta, 2010, 168, 221–229 CrossRef CAS.
- W. Lu, L. Tao, Y. Wang, J. Ge, J. Dong and W. Qian, Microchim. Acta, 2015, 182, 479–486 CrossRef CAS.
- X. Guo, B. Liang, J. Jian, Y. Zhang and X. Ye, Microchim. Acta, 2014, 181, 519–525 CrossRef CAS.
- J. Manso, M. L. Mena, P. Yáñez-Sedeño and J. Pingarrón, J. Electroanal. Chem., 2007, 603, 1–7 CrossRef CAS.
- L. N. Changsheng Shana, H. Yanga, D. Hana, Q. Zhanga and A. Ivaskab, Biosens. Bioelectron., 2010, 25, 1070–1074 CrossRef PubMed.
- Z. W. Zhao, X. J. Chen, B. K. Tay, J. S. Chen, Z. J. Han and K. A. Khor, Biosens. Bioelectron., 2007, 23, 135–139 CrossRef CAS PubMed.
- S. H. Lim, J. Wei, J. Lin, Q. Li and J. KuaYou, Biosens. Bioelectron., 2005, 20, 2341–2346 CrossRef CAS PubMed.
- M. M. Joseph Wang, Anal. Chim. Acta, 2005, 539, 209–213 CrossRef.
- M. D. Rubianes and G. A. Rivas, Electrochem. Commun., 2003, 5, 689–694 CrossRef CAS.
- D. Zeng, W. Luo, J. Li, H. Liu, H. Ma, Q. Huang and C. Fan, Analyst, 2012, 137, 4435–4439 RSC.
- H. Wei and E. Wang, Anal. Chem., 2008, 80, 2250–2254 CrossRef CAS PubMed.
Footnote |
| † Electronic supplementary information (ESI) available: Determination of quantum yield, TEM image of GOx–FL Au NPs, PL response of GOx enzyme, UV-vis spectroscopic study on the disintegration of Au nanostructured materials on varying the pH, chronoamperometry plot obtained for glucose sensing experiment and Michaelis–Menten plot for the determination of kinetic parameters associated with the enzymatic catalysis (Fig. S1 to S6). See DOI: 10.1039/c5ra22477b |
|
| This journal is © The Royal Society of Chemistry 2016 |