Chemiresistive gas sensor for the sensitive detection of nitrogen dioxide based on nitrogen doped graphene nanosheets
Mahabul Shaika,
V. K. Rao*a,
Manish Guptaa,
K. S. R. C. Murthyb and
Rajeev Jainc
aBiosensor Development Division, Defence Research & Development Establishment, Gwalior 474002, M.P., India. E-mail: vepakrao@yahoo.com; Fax: +91 751 2341148; Tel: +91 751 2230019
bSemiconductor Technology and Applied Research Centre, SITAR, 1640 Doorvaninagar, Bangalore – 560 016, India
cSchool of Studies in Chemistry, Jiwaji University, Gwalior – 474002, M.P., India
First published on 3rd December 2015
Abstract
In this paper, we report on the development of a chemiresistive sensor for the detection of nitrogen dioxide (NO2) gas at room temperature using nitrogen-doped graphene nanosheets (NGS). The substitution of the nitrogen atoms in the honey-comb structure of graphene enhances the adsorption sites for gas molecules and thereby the sensitivity of the detection of the adsorbed gas molecules increases. Graphene nanosheets (GS) and NGS were prepared by hydrothermal treatment of graphene oxide in the absence and presence of nitrogen precursor respectively. The sensing materials were characterized by FESEM, TEM, XRD, XPS and elemental analysis. The nitrogen content in as-prepared NGS is at around 10%. The thin films of GS and NGS on pre-patterned gold interdigitated electrodes (IDEs) were obtained by the drop-drying method. The NGS coated sensor showed good response for sensing NO2 in comparison to that of GS at room temperature. The recovery of the sensor was greatly accelerated by ultra-violet light illumination. The proposed sensor showed excellent characteristics such as a low detection limit of 120 ppb (at S/N = 3). The effect of humidity on sensor performance was also studied. The proposed sensor also showed excellent selectivity with respect to various common interfering gases.
1. Introduction
Nitrogen dioxide is one of the most prominent toxic gases and it is also responsible for the tropospheric ozone formation and acid rain. Long term exposure to NO2 gas may decrease lung function and increase the risk of respiratory symptoms.1 Consequently, the Occupational Safety and Health Administration (OSHA) have set a permissible exposure limit (PEL) for nitrogen dioxide gas at 5 ppm. To comply with this regulation, the detection of NO2 gas at lower concentrations is of paramount importance. In addition, for practical use, such a sensor must be selective and operate on low power to minimize the maintenance.Many efforts have been paid for the development of the sensors for monitoring the presence of NO2 gas in the atmosphere. A variety of materials including semiconducting metal oxides,2 carbon nanomaterials,3 conducting polymers,4 and organic materials5 were explored for the detection of NO2 gas at low concentrations using chemiresistors and field effective transistors. The semiconducting metal oxide based sensors offer the sensitive detection of NO2 gas, but the major limitations of these sensors are high operating temperatures and hence high power requirement and also cross sensitivity to alcohols and other interferences.6 Thus, many efforts are currently in the progress for the development of sensitive NO2 gas sensors operating at room temperature.
Graphene nanosheets (GS) represent a new type of sensor material capable of detecting low concentrations of gas molecules with high sensitivity under ambient conditions.7–10 Adsorption of electron withdrawing (e.g., NO, NO2, O2, Cl2) or donating (e.g., NH3, H2S) gas molecules on a nanosheet can cause charge transfer between the nanosheet and the adsorbed gas molecules.11 This charge transfer can lead to remarkable changes in the electrical properties of the nanosheets, which provides the basis for highly sensitive gas sensors. The sensitivity and the selectivity of these sensors can greatly be enhanced by doping or functionalizing the graphene nanosheets.12 The substitution doping of graphene with hetero atoms such as nitrogen, boron may also contribute to alter the electrical properties and chemical reactivity of the graphene nanosheets by disturbing the sp2 hybridization. The substituted atoms can act as reactive sites for gas adsorption.13–15 Nitrogen doping in GNS can show significant advantages over undoped nanosheets for gas sensor applications, both due to their reactive surfaces, and the sensitivity of their transport characteristics to the presence of nitrogen.16,17 Further, ab initio studies showed the enhancement in the interactions between the gas molecules and doped graphene, when compared with the undoped graphene.18
In this study, we focus on sensing NO2 gas at room temperature using nitrogen-doped graphene nanosheets prepared by hydrothermal treatment of graphene oxide (GO) in the presence of ammonia solution. Both reduction of GO and doping of nanosheets with nitrogen atoms can simultaneously be achieved in this treatment. We also evaluate the sensing characteristic of the NGS at various concentrations of NO2 gas at room temperature.
2. Experimental section
2.1. Materials and reagents
Natural graphite powder, NaNO3, H2SO4, H2O2, ammonia solution (25%) and N,N′-dimethylformamide were purchased from Aldrich and used as received. Calibration gas cylinders of NO2 (205 ppm), H2S (523 ppm), NH3 (215 ppm), SO2 (520 ppm), CO (505 ppm) equilibrated with dry nitrogen gas used in sensing studies were obtained from M/s Chemtron Science Laboratories Private Limited, India.Comb shaped gold interdigitated electrodes (IDEs) on alumina substrate were obtained by photolithography and chemical etching methods.19 In brief, photoresist (positive type, PR Shipley SPRT518H-A) was spin-coated on the gold coated alumina substrate (M/s Hengli Fletek Co. Ltd., Ziang, China), then, exposed to UV light of ∼350 nm wavelength through photolithography-mask and then developed with compatible developer followed by hard baking at 100 °C for 30 minutes. Then exposed gold was etched using KI/I2 etchant. Finally the desired IDEs on alumina substrate were obtained by removing the photoresist with acetone. The gold digit width and space between the digits is 200 μm and total effective area of the electrodes is 5 mm × 10 mm.
2.2. Preparation of sensing materials
Graphite oxide (GO) was prepared by a modified Hummer's method similar to the method reported in the literature with little modifications.20 In a typical experimental procedure, 1 g of natural graphite power, 0.5 g of NaNO3, and 23 mL of H2SO4 (98%) were stirred together in an ice bath for about 30 min. Under vigorous agitation, 3 g of KMnO4 was added slowly, and then the mixture was transferred to a water bath maintained at 35–40 °C and kept for 24 h. Then, 46 mL of water was gradually added to it, and the solution was stirred for 15 min. Finally, the solution was diluted with 140 mL of water and treated with 5 mL of 30% H2O2 to remove residual KMnO4. The resultant solid was collected by filtration, washed with 0.1 M HCl solution and finally with de-ionized water, and then freeze-dried to obtain GO powder.Nitrogen-doped graphene nanosheets (NGS) were synthesized according to method described in the literature with some modifications.21 In brief, 35 mg of GO was dispersed in 5 mL of deionized water by ultrasonication for 1 h, to this 30 mL of ammonia solution (25 wt% in water) was added, and the mixture was transferred into a 50 mL Teflon lined autoclave and maintained at 180 °C for 16 h. The obtained black solid was washed repeatedly with water and finally with ethanol. The final product was collected by centrifugation and dried at 80 °C overnight under vacuum. Similarly, the reduced graphene oxide (GS) was prepared similar to the procedure described above, where deionized water is used instead of ammonia solution.
2.3. Characterization of sensing materials
The morphology of as prepared materials was studied by field emission scanning electron microscopy (FESEM) (FEI, Tecnai F20) and high resolution transmission electron microscopy (HRTEM) (FEI, Tecnai G2 S-Twin) at an operating voltage of 5 kV and 200 kV respectively. X-ray diffraction (XRD) patterns were performed on a Philips X'Pert Pro diffractometer with Cu-Kα1 (λ = 1.5405 Å) radiation. The X-ray photoelectron spectra were collected on AXIS ULTRA X-ray photoelectron spectrometer. Elemental analysis (CHNS, VarioMICRO, GmbH) was carried out with a conventional combustion method based on the burn-off mass of the sample and comprises a thermal conductivity detector for the analysis of the evolved gases. Approximate content of oxygen was calculated by subtracting the sum of carbon, hydrogen, nitrogen and sulfur contents from 100%, assuming that ash is not present. BET measurements were performed by Micromeritics ASAP 2020 analyzer.2.4. Gas sensing measurements
Drop-drying method was used for depositing the sensing materials (GS and NGS) onto the surface of pre-patterned gold interdigitated electrodes (IDEs). This method of deposition was selected because of its simplicity, possibility to obtain good quality uniform films. A small known amount of GS or NGS was dispersed in N,N′-dimethylformamide (0.2 mg mL−1) by ultrasonication for about 30 minutes, and subsequently 5 μL of the obtained dispersion was placed carefully on the center of the IDEs using a micro-syringe. Then, the coated IDEs were dried at 80 °C for 4 h under vacuum to obtain thin film of sensing materials on IDE platform (denoted as GS/IDE and NGS/IDE for GS and NGS coated IDEs respectively). The optical images of uncoated and coated IDEs were shown in Fig. 1a and b respectively.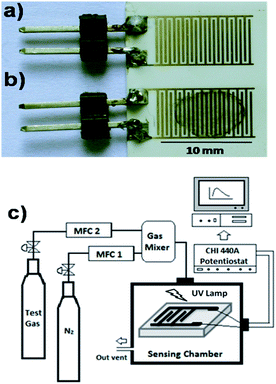 | ||
| Fig. 1 (a and b) Optical images of uncoated and NGS coated IDEs respectively; (c) schematic diagram of gas sensing assembly. | ||
Fig. 1c illustrates the schematic diagram of gas sensing assembly, comprised of gas suppliers (calibration test gas cylinders equilibrated with N2 and dry N2 gas cylinders as diluent gas), digital thermal mass flow controllers (Sierra Smart Trak 2), a glass sensing chamber, an ultraviolet lamp (Cole Palmer, 365 nm, 8 W) placed above the sensor surface and a potentiostat (CH Instruments, Model: 440A, USA) to apply a constant voltage across the IDEs and to measure the current. The test sensor was installed in the glass chamber with a diameter of 2.0 cm and a length of about 10.0 cm, and connected to the potentiostat via copper wires. In this study, nitrogen dioxide was used as the detecting gas. For gas sensing measurements, small amounts of test gas were carried by dry N2 into the glass chamber through a mixing chamber, as shown in Fig. 1c. All gas sensing tests were performed at room temperature (25 ± 2 °C), and the total flow rate of the test gas and the carrier gas was kept constant at 500 standard cubic centimeters per minute (sccm) in each test. Various concentrations of the test gas were produced by adjusting the ratio of the flow rate of test gas to that of the carrier gas. A humidified gas stream was generated by bubbling dry nitrogen gas through water and by mixing it, at appropriate ratios, with NO2 gas. The humidity was measured by using dew point sensor attached to the humidity generator (Owlstone, Model no. OHG-4, UK). All gas sensing experiments were carried out by applying a voltage of 1 V across IDEs, unless otherwise stated. The response of the sensor (R%) is calculated as – R% = [(Ig − Io)/Io] × 100, where, Io is the base line current in dry nitrogen atmosphere and Ig is the current after test gas exposure.
3. Result and discussion
3.1. Preparation and characterization of sensing materials
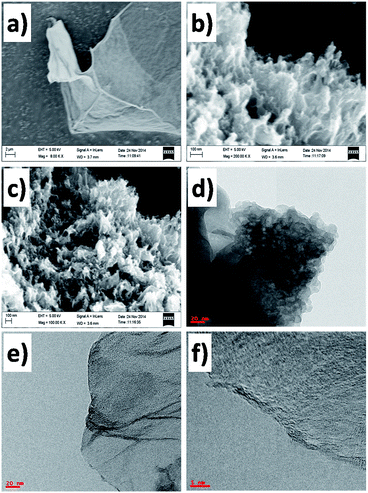
Fig. 2a–c shows the FESEM images of the (a) GO, (b) GS and (c) NGS. The flat, smooth, transparent, sheet-like surface with few wrinkles and folding of GO was observed with a large sheet size and a lateral dimension of few microns (Fig. 2a). However, after undergoing hydrothermal treatment both in the absence and presence of ammonia solution complex three dimensional (3D) porous GS and NGS with stacked and overlapped structures were observed as shown Fig. 2b and c, which is in consistent with the earlier reports.22 TEM image of GS was shown in Fig. 2d and that of NGS were shown in Fig. 2e and f. The TEM image (Fig. 2e) showed NGS with a structure wrinkled nanosheets. Whereas, the TEM image of GS (Fig. 2d) partly aggregated may be due to the strong van der Waals forces between individual graphene nanosheets.23 This is further confirmed by BET surface area measurements of the both the samples (GS and NGS). The N2 adsorption/desorption isotherms of the GS and NGS samples were shown in Fig. 3a and b, respectively. Both the samples reveal a typical type IV adsorption isotherm, but GS with a H3-type hysteresis loop and NGS with H4-type hysteresis loop at different relative pressure ranges. A BET surface area of 631 m2 g−1 was observed for NGS. Whereas, the BET surface area of GS is 428 m2 g−1 was observed for GS, which is much lower than that of the NGS sample. The higher surface of the NGS may be due to the prevention of the aggregation of adjacent graphene by nitrogen doping.23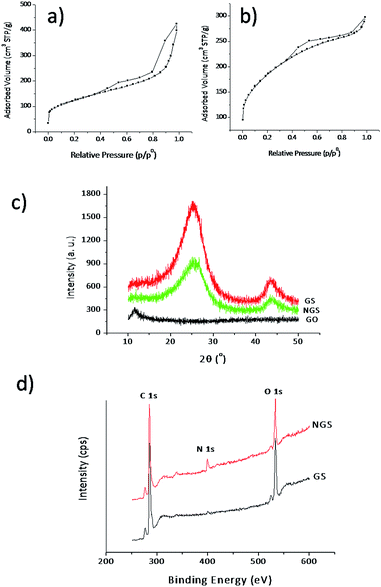 | ||
| Fig. 3 (a and b) Nitrogen adsorption/desorption isotherms of GS and NGS; (c) XRD analysis of GO, GS and NGS; (d) XPS spectra of GS and NGS. | ||
The XRD analysis of GO gives a (001) reflection peak at around 2θ = 10.6° (Fig. 3c), corresponding to a d-space of 0.86 nm. This large interlayer spacing of GO can be attributed to its oxygenated functional groups introduced to the carbon basal plane due to the harsh oxidation treatment of graphite.24 However, this (001) reflection peak of GO was absent after hydrothermal treatment of GO and the peaks centered at 26° and 44° correspond to (002) and (100) reflections of graphite were observed from the reduced graphene oxide (GS and NGS), respectively,25 which further confirms the reduction of GO. The chemical composition of prepared sensing materials was evaluated by using XPS and CHNS analysis. The typical XPS spectra of the prepared GS and NGS samples are depicted in Fig. 3d. The N 1s peak is not obvious for GS; however, N 1s peak centered at 399.6 eV is observed for NGS sample. The Table 1 represents the elemental composition of sensing materials obtained by XPS and CHNS analysis. The CHNS analysis of NGS reveals bulk composition with a nitrogen content of 10.29 wt%, which is similar to that of XPS analysis (9.94 atom%). The decrease in atomic percentage of carbon in NGS when compared with that of GS in both XPS and CHNS analysis indicates the substitution doping of few carbon atoms by nitrogen atoms.
| Sample | CXPS | OXPS | NXPS | (N/C)XPS | CCHNS | OCHNS | NCHNS | (N/C)CHNS |
|---|---|---|---|---|---|---|---|---|
| GS | 81.87 | 17.10 | 1.03 | 0.0125 | 77.93 | 18.61 | 0.68 | 0.008 |
| NGS | 73.18 | 16.88 | 9.94 | 0.136 | 70.49 | 16.95 | 10.29 | 0.146 |
3.2. NO2 sensing characteristics of NGS film
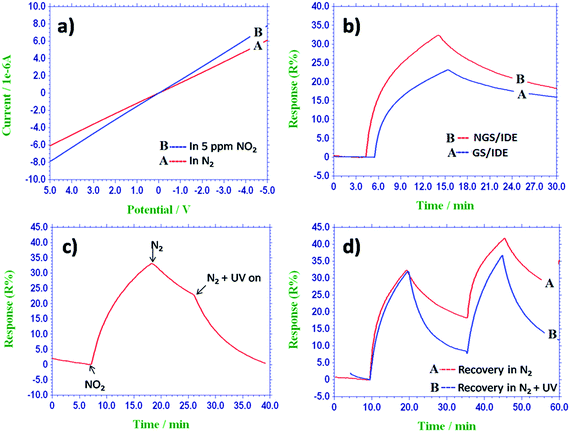
However, the recovery of the sensors was rather slow may be because of the higher binding energy between NGS and NO2. Hence, it is difficult to desorb the adsorbed NO2 gas molecules from the surface of the sensing film in a practical response time at ambient temperatures.26 In order to reduce the recovery time and to accelerate desorption of the test gas; the NGS/IDE sensor was irradiated with UV light. Fig. 4c gives the effect of UV light illumination on recovery of the sensor. A qualitatively similar phenomenon has been reported for a carbon nanotube based NO2 as detection system.27 The NO2 desorption step is carried out by placing a 365 nm UV lamp horizontally above the sensor. Without UV light irradiation, the signal takes 90–120 minutes to recover even in flow of nitrogen gas. But, with UV light illumination the recovery time was reduced to 15 minutes (Fig. 4d). Hence, for the recovery of the sensor UV light illumination was used in addition to the nitrogen gas flow.
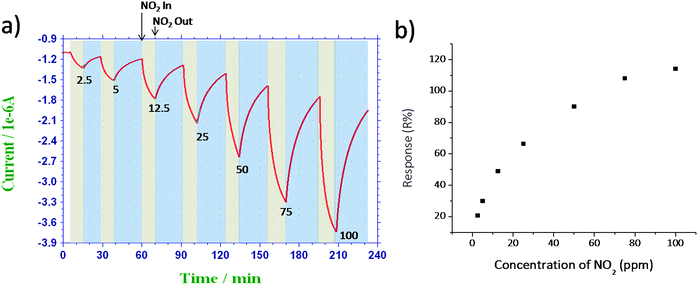
The NGS/IDE sensor was tested against NO2 gas at various concentrations from 2.5 ppm to 100 ppm and the corresponding response–recovery characteristics were shown in Fig. 5a. The NGS/IDE sensor response increases as the concentration of the NO2 gas increases. The response of the sensor as a function of concentration of NO2 gas was plotted in Fig. 5b. The limit of detection of the sensor, based on the signal-to-noise ratio of 3 (S/N = 3) was found to be about 120 ppb, which is much lower than occupational exposure limit of NO2 gas.
3.3. Reproducibility and stability studies
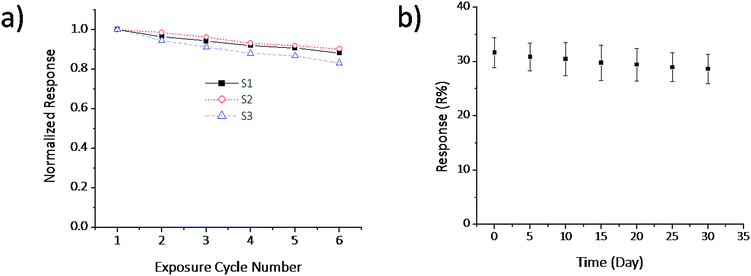
In order to study the reproducibility of the sensor, the NGS was coated on three IDEs (S1, S2 and S3) and sensitivities of each sensor were measured up to six consecutive response–recovery cycles. The initial response of each sensor was normalized to 1 and the responses of the remaining exposure cycles were calculated based on the initial normalized response of the sensor. Fig. 6a shows the normalized response of these three sensors when exposed to 5 ppm NO2 gas verses exposure cycle number. From Fig. 6a, it is clear that the sensor response decreases slightly as the number of response–recovery cycles increases, but the average decrease in the sensor response after six consecutive cycles is around 14% of the initial response. This showed the NGS/IDE sensor has good reproducibility.The stability of the sensor was studied by measuring the response of the sensors (S1, S2 and S3) for a period of one month. The corresponding response versus time was plotted and shown in Fig. 6b. From Fig. 6b, it is clear that the sensor has good stability up to the studied period.
3.4. Effect of humidity on sensor performance
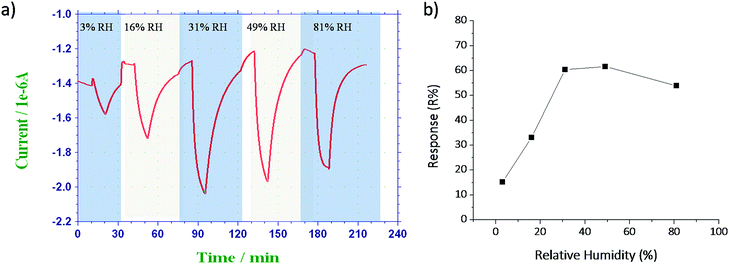
The effect of humidity on sensitivity of the sensor was studied by exposing the sensor with 2.5 ppm NO2 gas at various humidity conditions (3% RH, 16% RH, 31% RH, 49% RH and 81% RH). Before introducing the test gas, the sensor was purged by humidified air of the specified relative humidity to achieve a steady-state baseline. This was necessary to avoid sensor responses from changes in the humidity of the input flow streams. Then the test gas was mixed with humidified air to achieve desired relative humidity and purged into the sensing chamber. The relative humidity of the input gas stream was measured by a dew point sensor. Fig. 7a represents the sensing characteristics of NGS/IDE sensor at various humidity conditions when exposed to 2.5 ppm of NO2 gas and corresponding response versus relative humidity was plotted as Fig. 7b. It was observed that the response of the sensor increases as the humidity increases up to intermediate humidity levels (up to 49% RH). In contrast, at higher humidity conditions the response of the sensor decreases. Similar behavior was observed for carbon nanotube based NO2 gas sensors also.26,28 At an intermediate humidity level, a possible chemical reaction pathway will be as follows.29| 3NO2(g) + H2O → NO(g) + 2HNO3 |
| 2NO2(g) + 2NO(g) → 2NO3(ad) + N2(g) |
The consequence of the above reactions is the formation of NO3 (ad) species. Both NO2 and NO3 co-exist at low humidity levels, but NO3 becomes dominant with an increasing moisture level. As a result, the response of the sensor increases due to the dominant NO3, which has higher binding energy than that of NO2.30 At higher humidity levels the sensing film was covered by water molecules hence the response of the sensor decreases.29
3.5. Sensitivity to interferences
In order to study the effect of interferants on sensor performance, the NGS/IDE sensor was exposed to various common interferants such as NH3, H2S, CO, SO2, and volatile organic vapours such as ethanol, benzene, acetone, dichloromethane (DCM) and chloroform each at a concentration of 200 ppm. The desired concentrations of NH3, H2S, CO, SO2 were generated by diluting the analyte from the calibration gas cylinders and that of volatile organic vapors were generated by bubbling dry nitrogen gas through the analyte reservoir at 25 °C (concentrations were determined by Antoine equation31). The test results were shown in Fig. 8. It shows that the NGS/IDE sensor is more sensitive to NO2 than to interferences measured even at higher concentrations. This may be due to the strong electron withdrawing nature of NO2 gas.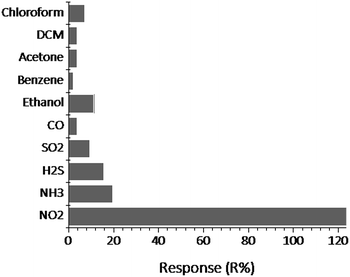 | ||
| Fig. 8 The effect of interferants on NGS/IDE sensor performance. The concentration of NO2 gas is 100 ppm and that of each analyte is 200 ppm. | ||
4. Conclusions
In summary, a room temperature gas sensor was developed for sensing NO2 gas using nitrogen-doped graphene nanosheets coated interdigitated electrodes. The proposed sensor showed very good response for low concentrations of NO2 gas. The recovery of the NGS/IDE sensor was accelerated by illuminating the sensor with ultra-violet light. The sensor showed excellent selectivity for sensing NO2 gas in respect of various interfering gases/vapors such as H2S, SO2, CO, NH3, ethanol, benzene, acetone, dichloromethane (DCM) and chloroform. These properties of the proposed sensors were best suited for their applications in environmental monitoring.Acknowledgements
The authors are thankful to the Director, DRDE for giving permission to publish. The authors are also thankful to Dr G. K. Prasad, Mr G. V. Ramana and Mrs Tara Yadav for their help in the characterization of the sensing materials.Notes and references
- Health aspects of air pollution with particulate matter, ozone and nitrogen dioxide, Report on a World Health Organization Working Group, 2003, p. 48; http://www.euro.who.int/__data/assets/pdf_file/0005/112199/E79097.pdf Search PubMed.
- S. M. Kanan, O. M. El-Kadri, I. A. Abu-Yousef and M. C. Kanan, Sensors, 2009, 9, 8158–8196 CrossRef CAS PubMed.
- Y. Wang and J. T. W. Yeow, J. Sens., 2009, 493904, DOI:10.1155/2009/493904.
- H. Bai and G. Shi, Sensors, 2007, 7, 267–307 CrossRef CAS.
- J. H. Shu, H. C. Wikle and B. A. Chin, Sens. Actuators, B, 2010, 148, 498–503 CrossRef CAS.
- C. Wang, L. Yin, L. Zhang, D. Xiang and R. Gao, Metal oxide gas sensors: sensitivity and influencing factors, Sensors, 2010, 10, 2088–2106 CrossRef CAS PubMed.
- S. M. Hafiz, R. Ritikos, T. J. Whitcher, N. M. Razib, D. C. S. Bien, N. Chanlek, H. Nakajima, T. Saisopa, P. Songsiriritthigul, N. M. Huang and S. A. Rahman, Sens. Actuators, B, 2014, 193, 692–700 CrossRef CAS.
- G. Lu, L. E. Ocola and J. Chen, Appl. Phys. Lett., 2009, 94, 083111–083113 CrossRef.
- G. Eda and M. Chhowalla, Adv. Mater., 2010, 22, 2392–2415 CrossRef CAS PubMed.
- F. Yavari and N. Koratkar, J. Phys. Chem. Lett., 2012, 3, 1746–1753 CrossRef CAS PubMed.
- T. Zhang, S. Mubeen, N. V. Myung and M. A. Deshusses, Nanotechnology, 2008, 19, 332001 CrossRef PubMed.
- S. Basu and P. Bhattacharyya, Sens. Actuators, B, 2012, 173, 1–21 CrossRef CAS.
- J. Y. Dai, J. M. Yuan and P. Giannozzi, Appl. Phys. Lett., 2009, 95, 232105 CrossRef.
- Y. Zou, Eur. Phys. J. B, 2011, 81, 475–479 CrossRef CAS.
- J. A. Lawlor and M. S. Ferreira, Beilstein J. Nanotechnol., 2014, 5, 1210–1217 CrossRef PubMed.
- S. Peng and K. Cho, Nano Lett., 2003, 3, 513–517 CrossRef CAS.
- L. S. Panchakarla, K. S. Subrahmanyam, S. K. Saha, A. Govindaraj, H. R. Krishnamurthy, U. V. Waghmare and C. N. R. Rao, Adv. Mater., 2009, 21, 4726–4730 CAS.
- R. Lv, Q. Li, A. R. Botello-Mendez, T. Hayashi, B. Wang, A. Berkdemir, Q. Hao, A. L. Elıas, R. Cruz-Silva, H. R. Gutierrez, Y. A. Kim, H. Muramatsu, J. Zhu, M. Endo, H. Terrones, J.-C. Charlier, M. Pan and M. Terrones, Sci. Rep., 2012, 2, 586, DOI:10.1038/srep00586.
- M. Shaik, V. K. Rao, A. K. Sinha, K. S. R. C. Murthy and R. Jain, J. Environ. Chem. Eng., 2015, 3, 1947–1952 CrossRef CAS.
- W. S. Hummers and R. E. Offeman, J. Am. Chem. Soc., 1958, 80, 1339 CrossRef CAS.
- C. Zhang, R. Hao, H. Liao and Y. Hou, Nano Energy, 2012, 2, 88–97, DOI:10.1016/j.nanoen.2012.07.021.
- L. Sun, L. Wang, C. Tian, T. Tan, Y. Xie, K. Shi, M. Li and H. Fu, RSC Adv., 2012, 2, 4498–4506 RSC.
- Z. Y. Lin, Y. Liu, Y. G. Yao, O. J. Hildreth, Z. Li, K. Moon and C. P. Wong, J. Phys. Chem. C, 2011, 115, 7120–7125 CAS.
- C. Chen, Q.-H. Yang, Y. Yang, W. Lv, Y. Wen, P.-X. Hou, M. Wang and H.-M. Cheng, Adv. Mater., 2009, 21, 3007–3011 CrossRef CAS.
- C. Botas, P. Alvarez, C. Blanco, R. Santamaria, M. Granda, M. D. Gutierrez, F. Rodríguez-Reinosoc and R. Menéndeza, Carbon, 2013, 52, 476–485 CrossRef CAS.
- A. Goldoni, R. Larciprete, L. Petaccia and S. Lizzit, J. Am. Chem. Soc., 2003, 125, 11329–11333 CrossRef CAS PubMed.
- J. Li, Y. Lu, Q. Ye, M. Cinke, J. Han and M. Meyyappan, Nano Lett., 2003, 3, 929–933 CrossRef CAS.
- I. Sasaki, N. Minami, A. Karthigeyan and K. Iakoubovskii, Analyst, 2009, 134, 325–330 RSC.
- F. Yao, D. L. Duong, S. C. Lim, S. B. Yang, H. R. Hwang, W. J. Yu, I. H Lee, F. Gunes and Y. H. Lee, J. Mater. Chem., 2011, 21, 4502–4508 RSC.
- S. Peng, K. Cho, P. Qi and H. Dai, Chem. Phys. Lett., 2004, 387, 271–276 CrossRef CAS.
- R. H. Perry, D. W. Green and J. O. Maloney, Perry's Chemical Engineers Handbook, McGraw-Hill, New York, 6th edn, 1984 Search PubMed.
| This journal is © The Royal Society of Chemistry 2016 |

