Synthesis and characterization of graphene from waste dry cell battery for electronic applications
Indranil Roya,
Gunjan Sarkara,
Soumya Mondalb,
Dipak Ranac,
Amartya Bhattacharyyaa,
Nayan Ranjan Sahaa,
Arpita Adhikaria,
Dipak Khastgirb,
Sanatan Chattopadhyay*d and
Dipankar Chattopadhyay*a
aDepartment of Polymer Science and Technology, University of Calcutta, 92 A.P.C. Road, Kolkata 700009, India. E-mail: dipankar.chattopadhyay@gmail.com
bRubber Technology Centre, Indian Institute of Technology, Kharagpur 721302, India
cDepartment of Chemical and Biological Engineering, Industrial Membrane Research Institute, University of Ottawa, 161 Louis Pasteur St., Ottawa, ON K1N 6N5, Canada
dDepartment of Electronic Science, University of Calcutta, 92 A.P.C. Road, Kolkata 700009, India
First published on 21st January 2016
Abstract
This study demonstrates the electronic applications of graphene synthesized from the graphite electrode of waste dry cell zinc–carbon batteries. Graphite powder [G (R)] is successfully recovered from the graphite electrode of waste batteries by acid treatment and used as starting material for synthesis of graphene oxide (GO) following Hummers method. Finally, reduced graphene oxide (RGO) was obtained from the chemical reduction of GO by hydrazine hydrate. RGO thus obtained was characterized by X-ray diffraction, Raman spectroscopy, Fourier-transform infrared spectroscopy, UV-vis absorption spectroscopy, dynamic light scattering, energy dispersive X-ray spectra and transmission electron microscopy to get detailed information about the structure and morphology of the RGO. All the above characterization results confirmed the restoration of sp2 conjugation and removal of functional groups after the reduction of GO and also the sheet like morphology of RGO. The surface charge and stability of RGO in an aqueous medium are examined by measuring zeta potential. An electrochemical study demonstrated that, at different sweep rates, the current is the highest for RGO and lowest for GO and the current increases with an increasing sweep rate for all materials. The loop area of all the samples at the 100 mV s−1 sweep rate is the highest. The galvanostatic charging/discharging measurements have also been performed for both the GO and RGO samples at a current density of 1 mA g−1. Electro-conductivity measurement shows that RGO has higher conductivity than GO due to the restoration of the sp2 structure. The current voltage (I–V) characteristics show a non-linear behavior of GO and the ohmic nature of RGO.
1. Introduction
Graphene is a one atom thick mesh of carbon atoms arranged in a honeycomb model1–3 which gives birth to all graphitic materials like graphite, carbon nanotubes, carbon nanofibers and fullerenes. Geim and Novoselov have been awarded the Nobel Prize for the invention of graphene. It was at that time that the world's thinnest, strongest and stiffest material was introduced in the marketplace through extensive media coverage. Graphene exhibits extraordinary mechanical,4 thermal,5 electrical,6 and spintronic properties.7Due to its remarkable properties, graphene has the potential to be used in batteries,8 flexible and transparent conductors,9 super capacitors,10 transistors,11 fuel cells,12 solar cells,13 hydrogen storage,14 electrochemical devices,15 catalysis,16 electrochemical resonators,17 sensors18 and wastewater purification.19 Graphene can also be used in the field of bio-medicinal engineering, such as drug delivery,20,21 gene transfection,22 tissue engineering,23 neural network regeneration,24 cancer cell imaging, targeting and therapy.25–27 So, graphene is an exceptional material with huge potential for application in different areas of science and technology.
In the past few years, many methods for the preparation of graphene have been developed including the (i) micromechanical exfoliation of graphite using the peel-off method by scotch tap,28 (ii) chemical vapor deposition,29 (iii) epitaxial growth on electrically insulating surfaces,30 (iv) longitudinal unzipping of CNTs,31 (v) organic synthesis routes,32 and (vi) colloidal suspension from graphite or graphite derivative.33 It is very challenging to determine the most suitable method for the synthesis of the best quality graphene. Among all these above-mentioned methods, the colloidal suspension method produces a large yield of graphene and the method is also suitable for the chemical functionalization of graphene.29 In this method, graphene is prepared through the chemical reduction of graphene oxide (GO), which is obtained by treating graphite with a strong oxidizing agent. Due to the introduction of oxygen containing functional groups such as hydroxyl, carboxylic, phenolic and epoxides in graphene oxide, d spacing increases and changes also occur in the hybridization of the oxidized carbon atoms from planar sp2 to tetrahedral sp3. The oxidation of graphite totally destroys the electrical conductivity of graphene. However, the reduction of graphene oxide restored the sp2 hybridized structure as well as the electrical conductivity.
To prepare reduced graphene oxide (RGO), GO has been chemically reduced by various reducing agents like hydrazine monohydrate,34 sodium borohydrate,35 hydroquinone,36 amine,37 and strong alkali.38 Among all of these above-mentioned reducing agents, hydrazine monohydrate is most often used due to its high reducing efficiency for the elimination of nearly all oxygen containing functional groups.
Zinc–carbon batteries are low cost primary batteries and therefore are a popular choice for consumers. This was the first commercial dry battery used in flashlights and other possible portable devices since these could work in difficult situations. They have been used and continue to be used in intermittent devices such as remote controls, flashlights, clocks or transistor radios. A zinc–carbon battery contains a carbon rod or graphite rod as a positive electrode in the middle portion of the battery. The electrode is surrounded by a mixture of manganese dioxide and carbon powder. All of the components are packaged in zinc which acts as a container as well as a negative electrode. Thousands of tons of zinc–carbon batteries are used every year around the world and are often not recycled. The zinc–carbon battery is a non-hazardous waste but is continuously being disposed of in the environment which may create some difficulties. Furthermore, the graphite electrode inside the battery can be used, even after discharge since inert properties of the graphite electrode prevent chemical reaction of the electrolyte molecules with the electrode. The graphite electrode and zinc container of the dry cell are recyclable. Several approaches have been reported to synthesize graphene-like materials from wood, leafs, bagasse, fruit wastes, animal wastes (bone and cow dung), semi-industrial wastes (newspaper), industrial wastes (soot powders produced in exhaust of diesel vehicles), food, and insects.39,40 However, we have followed, in this current work, a different approach from the previously reported research. We have attempted to recycle the graphite electrode from the waste zinc–carbon battery with the intention of preparing low cost graphene.
Graphite powder has been successfully recovered from the graphite electrodes of disposed batteries by using acid treatment to eliminate inorganic substances. Then, GO was synthesized from recovered graphite powder following Hummer's method. The RGO is prepared by the reduction of GO using hydrazine hydrate as a reducing agent and characterized by X-ray diffraction (XRD), Raman spectroscopy, Fourier transform infrared (FTIR) spectroscopy, UV-vis absorption spectroscopy, dynamic light scattering (DLS), energy dispersive X-ray (EDX) and transmission electron microscope (TEM). The electrical characterization of graphene was done by current–voltage (I–V) as well as conductivity measurement.
2. Experimental
Materials
In this present work, graphite powder is collected from waste dry cell batteries and used as raw material for the synthesis of GO. Concentrated H2SO4, KMnO4, H2O2, NaNO3, NaOH and N2H4 were purchased from Merck Specialties Pvt. Ltd., India.Recovery of graphite powder from used dry cell battery
Zinc–carbon waste dry cell batteries were obtained from the marketplace. First, we separated the electrodes from the batteries. To remove all kinds of impurities like MnO2, metal particles and carbon, the electrodes were rubbed and washed several times with water. After drying, the electrodes were ground and crushed to produce a fine graphite powder. However, there were still some inorganic materials present in the graphite powder and hence these are further treated in a beaker, containing HCl and HNO3 (3![[thin space (1/6-em)]](https://www.rsc.org/images/entities/char_2009.gif) :
:![[thin space (1/6-em)]](https://www.rsc.org/images/entities/char_2009.gif) 1) and heated for several hours. Finally, this was centrifuged and washed several times in distilled water to bring to normal pH. Recovered graphite powder [G (R)] was dried at 60 °C for 24 h. Fig. 1 shows the schematic illustration of the preparation of graphene from waste zinc–carbon dry cell batteries.
1) and heated for several hours. Finally, this was centrifuged and washed several times in distilled water to bring to normal pH. Recovered graphite powder [G (R)] was dried at 60 °C for 24 h. Fig. 1 shows the schematic illustration of the preparation of graphene from waste zinc–carbon dry cell batteries.
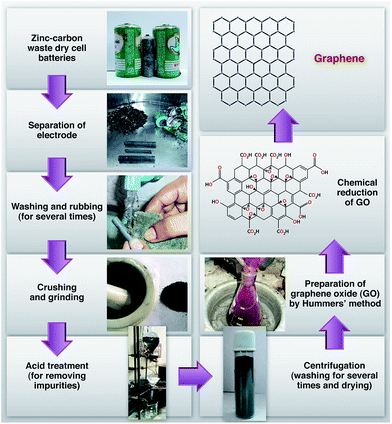 | ||
| Fig. 1 Flow chart of RGO preparation from the graphite electrode of waste zinc–carbon dry cell battery. | ||
Preparation of graphene oxide (GO)
Graphene oxide (GO) was synthesized from recovered graphite powder [G (R)] by Hummers method.41 Recovered graphite powder (1 g) and NaNO3 (1 g) were added in 50 ml of 98% concentrated H2SO4 under ultrasonication for 3–4 h to separate graphite flakes. For the oxidation of graphite flakes, a further 50 ml of 98% concentrated H2SO4 was added in the reaction mixture. Then, 6 g of KMnO4 was added slowly into the reaction mixture under vigorous stirring for 4 h below 20 °C. For the termination of the reaction, 100 ml deionized (DI) water was added slowly into the reaction mixture at ambient temperature with continuous stirring for 2 h. A further 200 ml of hot DI water was added and stirred for 2 h at 90 °C. Then, 20 ml of H2O2 was added into the reaction system to remove the unreacted KMnO4 as well as to finish the reaction. The final mixture was centrifuged and washed with DI water several times. Finally, GO was obtained after drying at 60 °C for 24 h.Preparation of reduced graphene oxide (RGO)
1 g of GO was taken in to a conical flask containing 100 ml of DI water. Then, hydrazine hydrate (6 ml) was added into the reaction mixture and the whole setup was placed in an oil bath at 90 °C under stirring for 12 h. The final black mixture was centrifuged and washed several times and dried at 60 °C for 24 h to get RGO.Characterization
X-ray diffraction (XRD) patterns were collected on an X-PERT-PRO Panalytical diffractometer using Cu Kα (λ = 1.5406) as the X-ray source at a scanning rate of 1° min−1, and a generator voltage and current of 40 kV and 30 mA, respectively. The Raman spectra was monitored using 1.96 eV (633 nm) line of a He Ne laser in a HORIBA-JOBIN-YVON Lab RAM HR 800 instrument recorded on solid samples. The Fourier transform infrared (FTIR) spectroscopic experiment was recorded with a Bruker-Optics Alpha-T spectrophotometer over the range of 500 to 4000 cm−1. UV-vis absorption spectra of the prepared materials were performed in a Perkin Elmer Lambda 25 by dispersing composite material in distilled water. The average hydrodynamic diameter (AHD) and zeta-potential measurements were performed using a Zetasizer Nano-ZS90 System (Malvern Inc.). Energy dispersive X-ray (EDX). Elemental analysis was done by field emission scanning electron microscopy (FESEM, JEOL). The morphology of the materials was observed using a transmission electron microscope (TEM, JEOL-JEM-2100 with a 200 kV accelerating voltage). Samples for TEM analysis were prepared by drying a droplet of material suspension on a carbon coated copper grid. Electrochemical property (CV) and galvanostatic measurement were investigated by a potentiostat–galvanostat (Autolab) using 1 M H2SO4 electrolyte. The electro-conductivity test was conducted by using an Ecopia HNS 5300.3. Results and discussion
X-ray diffraction (XRD)
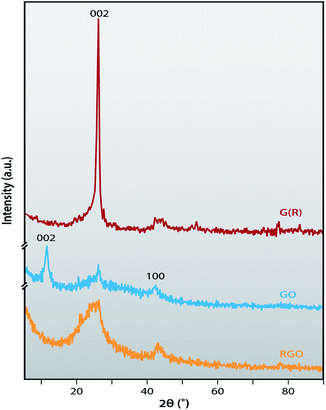
Fig. 2 displays the X-ray diffraction patterns of the recovered G (R) and the subsequent GO, and RGO. The diffraction peak of G (R) shows a narrow peak at 26.05° with very high intensity, corresponding to the (111) plane and the interlayer distance of 0.361 nm, calculated using the Braggs equation. After oxidation, a new diffraction peak appears at 11.54° relevant to the (002) plane and interlayer distance of 0.765 nm, which confirms the successful preparation of GO. The reason behind an increase in interlayer spacing is the incorporation of oxygen containing functional groups like epoxy, carboxyl (–COOH), hydroxyl (–OH) and carbonyl (–C![[double bond, length as m-dash]](https://www.rsc.org/images/entities/char_e001.gif) O). Another peak at 43° corresponded to the turbostratic band of disordered carbon materials. After chemical reduction of GO by hydrazine, the diffraction peak at 11.54° disappeared and the broad peak appeared at 24.6° for RGO with a corresponding interlayer spacing of 0.361 nm due to the elimination of oxygen containing functional groups from GO.42 This indicates the successful reduction of GO to RGO and restoration of sp2 conjugation.43
O). Another peak at 43° corresponded to the turbostratic band of disordered carbon materials. After chemical reduction of GO by hydrazine, the diffraction peak at 11.54° disappeared and the broad peak appeared at 24.6° for RGO with a corresponding interlayer spacing of 0.361 nm due to the elimination of oxygen containing functional groups from GO.42 This indicates the successful reduction of GO to RGO and restoration of sp2 conjugation.43
Raman spectra
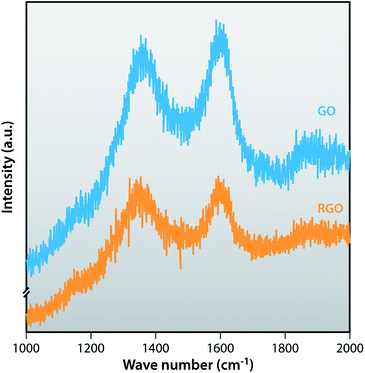
Raman spectra are very useful to characterize carbonaceous materials as well as confirming the graphene structure. The D band represents the breathing of k point phonon A1g, relates the structural defects and disorder, and the G band represents the first order scattering of the E2g vibrational mode in graphite sheets (sp2 atoms).44 Fig. 3 shows Raman spectra of GO and RGO. GO shows a strong D band at 1359 cm−1 and a G band at 1596 cm−1. After the reduction of GO by hydrazine, RGO shows the D band at 1347 cm−1, indicating the disorder in the sp2 – hybridized carbon system and the G band at 1596 cm−1 which is common to all sp2 carbon forms. The intensity ratios of D band and G band correlate the average size of sp2 domain. The ID/IG value of GO (0.96) is less than ID/IG value of RGO (0.98). ID/IG ratio of RGO is higher than GO because after chemical reduction, the conjugated graphene network (sp2 carbon) is re-established since the usual size of a graphene layer is smaller than the graphite layer.45,46Fourier-transform infrared (FTIR) spectroscopy
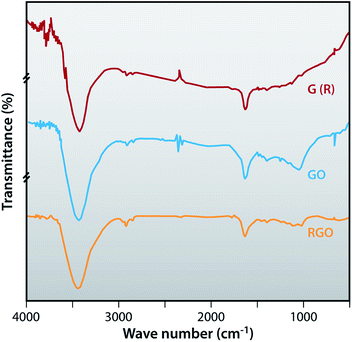
FTIR spectroscopy is used to confirm the successful recovery of graphite from the electrodes of waste batteries, oxidation of graphite and also the successful preparation of reduced graphene oxide. In Fig. 4, the FTIR spectrum of graphite is featureless in the fingerprint region where a peak around 1724 cm−1 is observed which corresponds to the deformation of the C![[double bond, length as m-dash]](https://www.rsc.org/images/entities/char_e001.gif) O vibration of the COOH, which is present at the edge of the GO. OH deformation is observed at 1383 cm−1 and the stretching vibration peak of C(sp2)–O is present at 1055 cm−1. The peak at 1262 cm−1 shows the C–OH stretching vibrations and the peak at 1634 cm−1 belongs to the skeletal vibration of epoxide groups and graphitic domain. All the above FTIR bands are related with oxygen containing functional groups of GO due to the oxidization of graphite. FTIR spectra of RGO show that oxygen containing functional groups almost disappeared, as peaks at 1634 cm−1, 1055 cm−1 and 1724 cm−1 demonstrate. Also the intensity of some peaks of RGO compared to GO is very small as peaks at 1262 cm−1, 1383 cm−1 and 1634 cm−1 show. The intensity of the peaks of RGO at 2919 cm−1 and 2846 cm−1 are more prominent than GO, thereby indicating the efficient reduction of GO.
O vibration of the COOH, which is present at the edge of the GO. OH deformation is observed at 1383 cm−1 and the stretching vibration peak of C(sp2)–O is present at 1055 cm−1. The peak at 1262 cm−1 shows the C–OH stretching vibrations and the peak at 1634 cm−1 belongs to the skeletal vibration of epoxide groups and graphitic domain. All the above FTIR bands are related with oxygen containing functional groups of GO due to the oxidization of graphite. FTIR spectra of RGO show that oxygen containing functional groups almost disappeared, as peaks at 1634 cm−1, 1055 cm−1 and 1724 cm−1 demonstrate. Also the intensity of some peaks of RGO compared to GO is very small as peaks at 1262 cm−1, 1383 cm−1 and 1634 cm−1 show. The intensity of the peaks of RGO at 2919 cm−1 and 2846 cm−1 are more prominent than GO, thereby indicating the efficient reduction of GO.
UV-vis absorption spectra
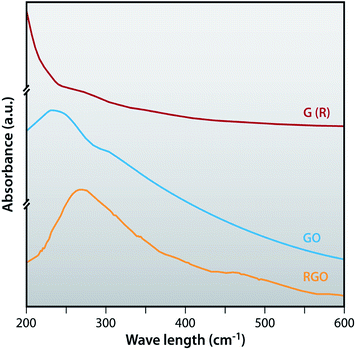
The UV-visible spectra of G (R), GO and RGO dispersed in DI water are shown in Fig. 5. G (R) shows the absorption peak at 272 nm. After oxidation of G (R), GO shows two characteristics absorption peaks, one at around 237 nm due to π–π* transition of aromatic C![[double bond, length as m-dash]](https://www.rsc.org/images/entities/char_e001.gif) C bonds and the other at around 307 nm due to the n–π* transition of C
C bonds and the other at around 307 nm due to the n–π* transition of C![[double bond, length as m-dash]](https://www.rsc.org/images/entities/char_e001.gif) O bonds.47 The absorption peak of graphite (272 nm) totally disappeared in the GO. RGO shows the absorption peak at 270 nm. This indicates that the absorption peak of GO at 237 nm is red shifted to 270 nm and the absorption peak at 307 nm has totally disappeared due to the removal of oxygen containing functional groups.
O bonds.47 The absorption peak of graphite (272 nm) totally disappeared in the GO. RGO shows the absorption peak at 270 nm. This indicates that the absorption peak of GO at 237 nm is red shifted to 270 nm and the absorption peak at 307 nm has totally disappeared due to the removal of oxygen containing functional groups.
Zeta potential
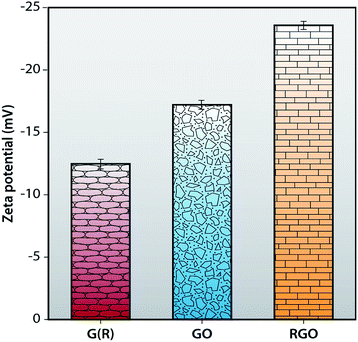
Zeta potential measurements of G (R), GO and RGO are carried out in a DLS instrument to calculate their stability in an aqueous medium. Zeta potential value of neutral nanoparticles is in between −10 mV and +10 mV. In the case of cationic nanoparticles, this value is greater than +30 mV and the value of zeta potential for anionic nanoparticles is less than −30 mV. It is apparent from Fig. 6 that the zeta potential value of G (R) is −12.5 ± 0.43 mV. After oxidation, synthesized GO shows a zeta potential value of −17 ± 0.54 mV which is more anionic and more stable than graphite. This is attributed to the presence of functional groups in GO. RGO shows a negative charge density of −23.5 ± 0.41 mV, comparatively more anionic than G (R) and GO, resulting in a more stable dispersion in an aqueous medium. For a stable dispersion in an aqueous solution, an electrostatic repulsion interaction with a negative charge is essential.48,49Dynamic light scattering
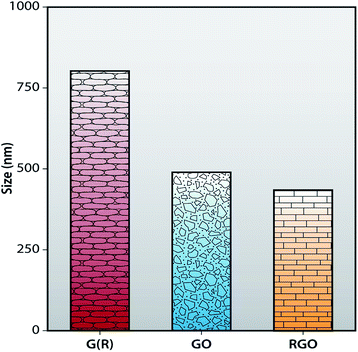
The average hydrodynamic diameter (AHD) of G (R), GO and RGO are obtained using a dynamic light scattering (DLS) instrument. In Fig. 7, the average hydrodynamic diameter of G (R) is 799.2 ± 0.43 nm. After oxidation of G (R), AHD of GO is reduced to 483.4 ± 0.49 nm. Synthesized RGO shows the AHD of 430 ± 0.37 nm, which is much smaller than G (R) and GO. So, it can be concluded that, after chemical reduction, the size of graphene layers become smaller than GO as conjugated graphene network (sp2 carbon) is re-established after the removal of functional groups from GO. This can be correlated with the Raman and FTIR spectra, respectively. However, DLS gives the spherical size information, so the shape of the graphene is assumed to be spherical in DLS.48,50Energy dispersive X-ray (EDX) analysis
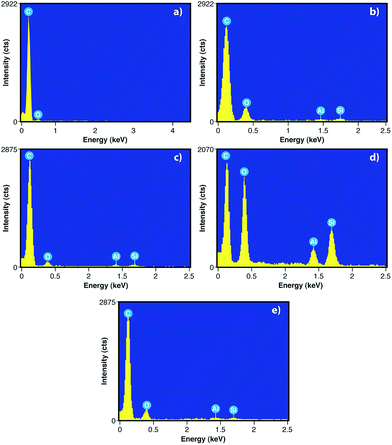
To evaluate the elemental content of graphite from new batteries before use [G (NB)], graphite from old batteries after use [G (OB)], G (R), GO and RGO, we have done the EDX, which is depicted Fig. 8. The EDX spectra in Fig. 8 show the presence of carbon, oxygen and small amounts of aluminum and silicon. However, no such trace of Al and Si is observed in G (NB) because there is no such electrochemical reaction taking place between the cathode and anode. But after use, EDX spectra of G (OB) shows the presence of Al and Si due to the electrochemical reaction. The wt% of C in G (OB) is only 68.71% which is recovered by acid treatment G (R) consisting of 83.25% C. EDX spectra of GO show the presence of a large amount of oxygen due to the presence of oxygen containing functional groups in GO. However, after the reduction of GO, oxygen containing functional groups are almost removed from RGO sheets which can be correlated with the results of FTIR. Table 1 shows the weight percentage of C, O, Al and Si in all the materials.| Elements | G (NB) | G (OB) | G (R) | GO | RGO |
|---|---|---|---|---|---|
| Carbon | 92.62% | 68.71% | 83.25% | 45.72% | 74.54% |
| Oxygen | 7.38% | 30.74% | 15.73% | 49.21% | 24.72% |
| Aluminum | NA | 0.20% | 0.40% | 1.56% | 0.48% |
| Silicone | NA | 0.36% | 0.62% | 3.51% | 0.26% |
Transmission electron microscopy (TEM)
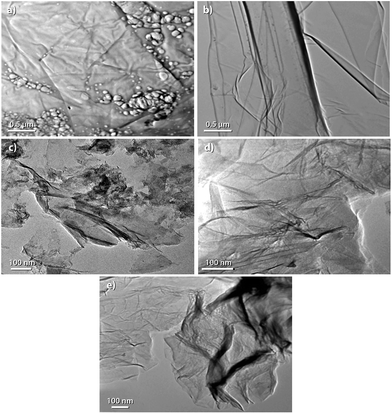
Transmission electron microscopy (TEM) is used for morphological analysis of the nanosheets. TEM images with different magnification of the graphite powder from waste dry cell batteries [G (OB)], recovered graphite powder [G (R)], GO as well as RGO are shown in Fig. 9. G (OB) from waste dry cell batteries before acid treatment in Fig. 9a, shows a flat sheet like morphology but some agglomerate lies on the flat graphite sheets. Fig. 9b shows the image for the recovery of graphite powder by acid treatment. It is clearly visible that graphite has flake like morphology and there is no presence of agglomerated particles above the graphite sheets. This indicates that we have successfully recovered graphite powder from waste zinc–carbon dry cell batteries. GO in Fig. 9c shows that nanosheets anchor with each other with the resulting aggregation of nano-sheets due to the strong π–π interactions. RGO in Fig. 9d and e shows that many wrinkles are present throughout the surface of the RGO sheets.Cyclic voltammetry and galvanostatic charge discharge measurements
Fig. 10a–d shows the plots of current–voltage characteristics of G (NB), G (R), GO and RGO measured by employing a cyclic voltammeter (CV) for the sweep rates of 20 mV s−1, 50 mV s−1 and 100 mV s−1, respectively. Such plots indicate that the current increases with increasing sweep rate for all the samples. The loops in CV graphs are the outcomes of the super-positioning of electric double-layer capacitance and the pseudo-capacitance which originates from the electrochemical reaction of GO, RGO and recovered samples in their respective solutions. Such reactions are basically governed by the intercalation and de-intercalation of O− ions from the active solutions. Also, the largest integral area of the CV loop is observed for the 100 mV s−1 sweep rate which indicates fast electron transfer between the active materials and the electrode.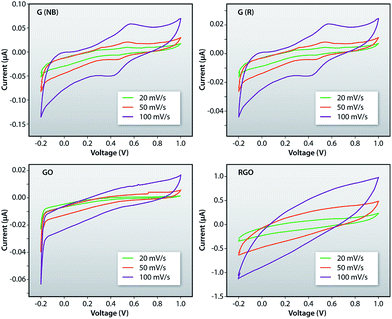 | ||
| Fig. 10 Plot of current–voltage characteristics of the G (NB), G (R), GO and RGO measured using the cyclic voltammetry with different sweep rates. | ||
Fig. 11a–c shows the comparative plots of current–voltage characteristics of the G (NB), G (R), GO and RGO at different sweep rates indicating that the current is highest for RGO samples and it is the lowest in GO samples. The current in RGO samples is measured at the central region in both sides to be 65.6 μA while this current in GO samples is measured to be 2.2 μA. The higher current in RGO samples is due to the removal of oxygen containing functional groups such as O–H, C![[double bond, length as m-dash]](https://www.rsc.org/images/entities/char_e001.gif) O and C–O from GO and the restoration of sp2 hybridization. The ideal rectangular shape of the CV loops in such measurements indicates the behavior of a double-layer capacitor as well as pseudo-capacitance of the system. In the current measurement, distortion from the regular rectangular shape of CV curves indicates a large internal resistance in the active material. Furthermore, the similar shape of CV curves for the entire sweep range indicates that the materials have excellent stability and the electrolyte ions can diffuse into the GO network.
O and C–O from GO and the restoration of sp2 hybridization. The ideal rectangular shape of the CV loops in such measurements indicates the behavior of a double-layer capacitor as well as pseudo-capacitance of the system. In the current measurement, distortion from the regular rectangular shape of CV curves indicates a large internal resistance in the active material. Furthermore, the similar shape of CV curves for the entire sweep range indicates that the materials have excellent stability and the electrolyte ions can diffuse into the GO network.
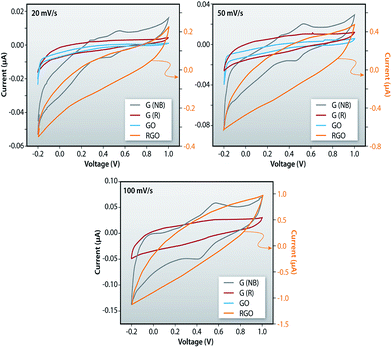 | ||
| Fig. 11 Comparative plots of current–voltage characteristics of the G (NB), G (R), GO and RGO measured using cyclic voltammetry. | ||
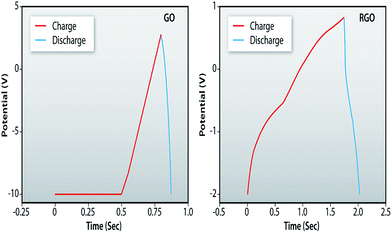
For further investigation of the electrochemical performance of RGO, the galvanostatic charging/discharging measurements have also been performed for both the GO and RGO samples at a current density of 1 mA g−1. The comparative plots, shown in Fig. 12, indicate a superior charging/discharging behavior of RGO in comparison to GO. The specific capacitance values obtained are 1.8 and 48 μF g−1 for the GO and RGO samples, respectively. Similar values obtained from the CV measurements are 1.2 and 44 μF g−1.
Electro-conductivity
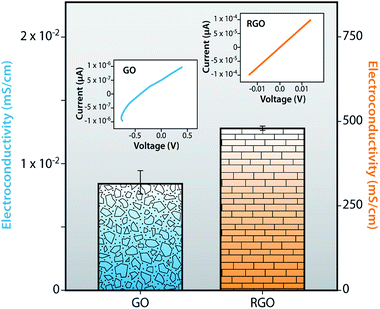
To investigate the electrical conductivity and the current–voltage (I–V) characteristics of RGO, we compared GO and RGO to enhance overall understanding of these processes. Fig. 13 displays the comparative statement of I–V curve and electrical conductivity of GO and RGO at ambient temperature. In this graph, GO shows the conductivity value of 0.0086 mS cm−1, after reduction, while RGO shows the high conductivity value of 478.78 mS cm−1 due to the removal of all functional groups such as epoxide, hydroxyl, carboxyl and carbonyl and restoration of sp2 hybridized structure. Due to the deficiency of π-conjugated orbital, as a result, GO becomes more non-conductive than RGO. Also, I–V characteristics of GO show a non-linear behavior due to the depletion region, but in the case of RGO, the depletion region could not be found because of the gapless band structure. I–V curve of RGO shows a linear behavior (ohmic) for all regions. So, oxidation of graphite destroys the conductivity of GO but the reduction of GO restores the sp2 hybridized structure as well as the electrical conductivity.4. Conclusions
In summary, graphite powder [G (R)] has been successfully recovered from the graphite electrode of a waste dry cell zinc–carbon battery by acid treatment. GO is obtained after oxidation of G (R). Reduced graphene oxide (RGO) has been successfully synthesized from graphene oxide (GO) by chemical reduction. FTIR and EDX spectra of RGO show that oxygen containing functional groups are still present in RGO sheets. Raman spectroscopy provides that the ID/IG ratio of RGO is higher than GO due to restoration of the conjugated graphene network (sp2 carbon) after the removal of functional groups. This is the reason for the decrease in the size of the graphene layer compared to GO which is correlated with DLS results. Zeta potential value shows that RGO is more anionic than others, resulting in a more stable dispersion in an aqueous medium. TEM images of RGO display rippled and crumpled types of morphology due to the lack of interlayer bonding. Electrochemical study of RGO shows that RGO carries a higher current than G (NB), G (R) and GO and the current increases for all materials with increasing sweep rate. The specific capacitance values of GO and RGO from galvanostatic charging/discharging measurements are 1.8 and 48 μF g−1, respectively. Electro-conductivity of the RGO is 478.78 mS cm−1, which is much higher than that of GO (0.0086 mS cm−1) due to the restoration of sp2 structure. I–V characteristics of GO display non-linear behavior but RGO shows a linear behavior (ohmic) for all regions.Acknowledgements
The author I. Roy gratefully acknowledges the Technical Education Quality Improvement Programme, University of Calcutta for providing fellowship. G. Sarkar likes to thank the Rajib Gandhi National Fellowship, UGC, the Government of India. N. R. Saha likes to thank UGC, the Government of India for his fellowship. A. Bhattacharyya likes to thank the Technical Education Quality Improvement Programme, University of Calcutta for his fellowship. D. Maity, B. Bhowmick, Md. M. R. Mollick, D. Mondal, and N. K. Bera of the University of Calcutta and S. Paul of Calcutta Institute of Technology are acknowledged for their help. We acknowledge the CRNN, University of Calcutta for instrumental facilities.Notes and references
- K. S. Novoselov, A. K. Geim, S. V. Morozov, D. Jiang, Y. Zhang, S. V. Dubonos, I. V. Grigorieva and A. A. Firsov, Science, 2004, 306, 666–669 CrossRef CAS PubMed.
- K. S. Novoselov, A. K. Geim, S. V. Morozov, D. Jiang, M. I. Katsnelson, I. V. Grigorieva, S. V. Dubonos and A. A. Firsov, Nature, 2005, 438, 197–200 CrossRef CAS PubMed.
- A. K. Geim and K. Novoselov, Nat. Mater., 2007, 6, 183–191 CrossRef CAS PubMed.
- C. Lee, X. Wei, J. W. Kysar and J. Hone, Science, 2008, 321, 385–388 CrossRef CAS PubMed.
- A. A. Balandin, S. Ghosh, W. Bao, I. Calizo, D. Teweldebrhan, F. Miao and C. N. Lau, Nano Lett., 2008, 8, 902–907 CrossRef CAS PubMed.
- J. H. Chen, C. Jang, S. Xiao, M. Ishigami and M. S. Fuhrer, Nat. Nanotechnol., 2008, 3, 206–209 CrossRef CAS PubMed.
- W. L. Wang, S. Meng and E. Kaxiras, Nano Lett., 2008, 8, 241–245 CrossRef CAS PubMed.
- P. Guo, H. Song and X. Chen, Electrochem. Commun., 2009, 11, 1320–1324 CrossRef CAS.
- Y. T. Liu, Q. P. Feng, X. M. Xie and X. Y. Ye, Carbon, 2011, 49, 3371–3375 CrossRef CAS.
- M. D. Stoller, S. Park, Y. Zhu, J. An and R. S. Ruoff, Nano Lett., 2008, 8, 3498–3502 CrossRef CAS PubMed.
- X. Li, X. Wang, L. Zhang, S. Lee and H. Dai, Science, 2008, 319, 1229–1232 CrossRef CAS PubMed.
- E. Yoo, T. Okata, T. Akita, M. Kohyama, J. Nakamura and I. Honma, Nano Lett., 2009, 9, 2255–2259 CrossRef CAS PubMed.
- Z. Li, F. Gong, G. Zhou and Z.-S. Wang, J. Phys. Chem. C, 2013, 117, 6561–6566 CAS.
- Y. Zhou, Q. Bao, L. A. L. Tang, Y. Zhong and K. P. Loh, Chem. Mater., 2009, 21, 2950–2956 CrossRef CAS.
- F. Schedin, A. K. Geim, S. V. Morozov, E. W. Hill, P. Blake, M. I. Katsnelson and K. S. Novoselov, Nat. Mater., 2007, 6, 652–655 CrossRef CAS PubMed.
- I. Roy, A. Bhattacharyya, G. Sarkar, N. R. Saha, D. Rana, P. P. Ghosh, M. Palit, A. R. Das and D. Chattopadhyay, RSC Adv., 2014, 4, 52044–52052 RSC.
- J. S. Bunch, A. M. van der Zande, S. S. Verbridge, I. W. Frank, D. M. Tanenbaum, J. M. Parpia, H. G. Craighead and P. L. McEuen, Science, 2007, 315, 490–493 CrossRef CAS PubMed.
- C. H. Lu, H. H. Yang, C. L. Zhu, X. Chen and G. N. Chen, Angew. Chem., Int. Ed., 2009, 48, 4785–4787 CrossRef CAS PubMed.
- A. Meidanchi and O. Akhavan, Carbon, 2014, 69, 230–238 CrossRef CAS.
- D. Ma, J. Lin, Y. Chen, W. Xue and L.-M. Zhang, Carbon, 2012, 50, 3001–3007 CrossRef CAS.
- L. Zhang, J. Xia, Q. Zhao, L. Liu and Z. Zhang, Small, 2010, 6, 537–544 CrossRef CAS PubMed.
- L. Feng, S. Zhang and Z. Liu, Nanoscale, 2011, 3, 1252–1257 RSC.
- O. Akhavan, E. Ghaderi and M. Shahsavar, Carbon, 2013, 59, 200–211 CrossRef CAS.
- O. Akhavan and E. Ghaderi, J. Mater. Chem. B, 2013, 1, 6291–6301 RSC.
- O. Akhavan and E. Ghaderi, Small, 2013, 9, 3593–3601 CrossRef CAS PubMed.
- O. Akhavan, E. Ghaderi and H. Emamy, J. Mater. Chem., 2012, 22, 20626–20633 RSC.
- K. Yang, L. Hu, X. Ma, S. Ye, L. Cheng, X. Shi, C. Li, Y. Li and Z. Liu, Adv. Mater., 2012, 24, 1868–1872 CrossRef CAS PubMed.
- K. S. Kim, Y. Zhao, H. Jang, S. Y. Lee, J. M. Kim, K. S. Kim, J.-H. Ahn, P. Kim, J.-Y. Choi and B. H. Hong, Nature, 2009, 457, 706–710 CrossRef CAS PubMed.
- S. Park and R. S. Ruoff, Nat. Nanotechnol., 2009, 4, 217–224 CrossRef CAS PubMed.
- X. Lu, M. Yu, H. Huang and R. S. Ruoff, Nanotechnology, 1999, 10, 269–272 CrossRef CAS.
- L. Y. Jiao, X. R. Wang, G. Diankov, H. L. Wang and H. J. Dai, Nat. Nanotechnol., 2010, 5, 321–325 CrossRef CAS PubMed.
- X. Yan and L. S. Li, J. Mater. Chem., 2011, 21, 3295–3300 RSC.
- S. Stankovich, R. D. Piner, X. Q. Chen, N. Q. Wu, S. T. Nguyen and R. S. Ruoff, J. Mater. Chem., 2006, 16, 155–158 RSC.
- O. C. Compton, D. A. Dikin, K. W. Putz, L. C. Brinson and S. T. Nguyen, Adv. Mater., 2010, 22, 892–896 CrossRef CAS PubMed.
- J. F. Shen, Y. Z. Hu, M. Shi, X. Lu, C. Qin, C. Li and M. X. Ye, Chem. Mater., 2009, 21, 3514–3520 CrossRef CAS.
- G. X. Wang, X. P. Shen, B. Wang, J. Yao and J. Park, Carbon, 2009, 47, 1359–1364 CrossRef CAS.
- J. F. Che, L. Y. Shen and Y. H. Xiao, J. Mater. Chem., 2010, 20, 1722–1727 RSC.
- X. B. Fan, W. C. Peng, Y. Li, X. Y. Li, S. L. Wang, G. L. Zhang and F. B. Zhang, Adv. Mater., 2008, 20, 4490–4493 CrossRef CAS.
- O. Akhavan, K. Bijanzad and A. Mirsepah, RSC Adv., 2014, 4, 20441–20448 RSC.
- G. Ruan, Z. Sun, Z. Peng and J. M. Tour, ACS Nano, 2011, 5, 7601–7607 CrossRef CAS PubMed.
- W. S. Hummers and R. E. Offeman, J. Am. Chem. Soc., 1958, 80, 1339 CrossRef CAS.
- S. F. Pei, J. P. Zhao, J. H. Du, W. C. Ren and H. M. Cheng, Carbon, 2010, 48, 4466–4474 CrossRef CAS.
- Z. J. Fan, K. Wang, T. Wei, J. Yan, L. P. Song and B. Shao, Carbon, 2010, 48, 1686–1689 CrossRef CAS.
- A. C. Ferrari, J. C. Meyer, V. Scardaci, C. Casiraghi, M. Lazzeri, F. Mauri, S. Piscanec, D. Jiang, K. S. Novoselov, S. Roth and A. K. Geim, Phys. Rev. Lett., 2006, 97, 187401 CrossRef CAS PubMed.
- S. Stankovich, D. A. Dikin, R. D. Piner, K. A. Kohlhaas, A. Kleinhammes, Y. Jia, Y. Wu, S. T. Nguyen and R. S. Ruoff, Carbon, 2007, 45, 1558–1565 CrossRef CAS.
- F. Tuinstra and J. L. Koenig, J. Chem. Phys., 1970, 53, 1126–1130 CrossRef CAS.
- K. Krishnamoorthy, R. Mohan and S.-J. Kim, Appl. Phys. Lett., 2011, 98, 244101 CrossRef.
- Y. Wang, S. J. Zhen, Y. Zhang, Y. F. Li and C. Z. Huang, J. Phys. Chem. C, 2011, 115, 12815–12821 CAS.
- X. Qi, K.-Y. Pu, X. Zhou, H. Li, B. Liu, F. Boey, W. Huang and H. Zhang, Small, 2010, 6, 663–669 CrossRef CAS PubMed.
- Y. Wang, L. Q. Chen, Y. F. Li, X. J. Zhao, L. Peng and C. Z. Huang, Nanotechnology, 2010, 21, 305601 CrossRef PubMed.
| This journal is © The Royal Society of Chemistry 2016 |

