Determination of carbon isotopes in carbonates (calcite, dolomite, magnesite, and siderite) by femtosecond laser ablation multi-collector ICP-MS†
Received
15th October 2021
, Accepted 15th December 2021
First published on 16th December 2021
Abstract
This study reports a method for in situ determination of stable carbon (δ13C‰) isotope compositions for calcite, dolomite, magnesite and siderite by femtosecond laser ablation multi-collector inductively coupled plasma mass spectrometry (fs-LA-MC-ICP-MS). The chemical and bulk C isotope compositions of various carbonates have been characterized by LA-ICP-MS and isotope ratio mass spectrometry (IRMS), respectively. Magnesite shows limited chemical variation, whereas the major element compositions of dolomite and siderite vary greatly among samples and individual grains. The spectral interference of doubly charged ions (24Mg2+ for 12C+ and 26Mg2+ for 13C+) and polyatomic species (12CH+ for 13C+) was evaluated. The associated internal precision of in situ C isotope analysis correlates with intensities and is better than 0.20‰ (2SE) when the measured 12C ion signal is >12.5 volts. Carbonate samples DOL-8, MGS-1 and SD-5 show relatively uniform bulk and in situ carbon isotope compositions with precisions better than 0.24‰ and 0.45‰ (2SD) and are adopted as in-house standards. The laser ablation analysis results of various calcite, dolomite, magnesite and siderite samples with δ13C in the range of −6.28‰ to 0.32‰ agree excellently with IRMS determined values using standard-sample bracketing (SSB) calibration, with a precision of 0.37–0.68‰ (2SD). Matrix effects have been investigated and determined to be insignificant for the same carbonate matrix with variable chemical compositions when adopting a femtosecond laser. Instrumental carbon isotope fractionation observed among different carbonate matrices is non-negligible (e.g., up to 4.29‰ between calcite and magnesite) using fs-LA-MC-ICP-MS, and an external multi-reference calibration can be applied for non-matrix matched analyses.
1. Introduction
Carbon occurs as both a major and trace element in variable amounts in various Earth systems (atmosphere, hydrosphere, and lithosphere). It has three isotopes, including two stable isotopes of 12C (98.89%) and 13C (1.11%) and a radioactive isotope 14C (∼10−12).1 The significant relative mass difference (∼89%) between 13C and 12C results in a wide range of C isotope compositions in nature. By far, carbonates are the most abundant carbon-bearing minerals in the Earth's crust, with calcite and dolomite (CaMg(CO3)2) accounting for at least 90% of crustal carbon in massive sedimentary and metamorphic formations.2 Other abundant carbonates including magnesite, siderite and rhodochrosite occur widely in sedimentary rocks, and in numerous metalliferous ore deposits in magmatic, hydrothermal, or sedimentary environments.3 Carbon isotope analyses of a variety of carbonates contribute to the understanding of terrestrial geochemical cycles given the number of natural processes that result in a large variation of δ13C values between approximately −100‰ and +20‰.4,5
Conventional isotope ratio mass spectrometry (IRMS) allows for accurate and highly precise stable carbon isotope measurements of the absolute abundance of stable carbon isotopes in natural or synthetic materials. Recently, the reported analytical precision (sample-to-sample, 1SD) of δ13C values measured for carbonate consuming 30 μg of sample was better than 0.04‰ (1SD) using a Thermo™ MAT253 coupled to a Thermo™ Kiel IV carbonate device.6 Nevertheless, the interpretation of C isotopic signatures acquired by conventional methods (i.e., IRMS) is limited since they represent averaged (i.e., multi-grain) isotopic values for individual samples.
In situ C isotopic analyses by secondary ionization mass spectrometry (SIMS),7–12 NanoSIMS13 and laser ablation coupled to multi-collector inductively coupled plasma mass spectrometry (LA-MC-ICP-MS)14 have received increased interest in Earth science-related studies, which provides valuable isotopic information of geological samples at a high resolution. For example, single carbonate crystallites (dolomite-ankerite) as small as 3–10 μm across can be readily analyzed by SIMS with a sub per-mil (‰) accuracy and precision (2s).10 The micron-scale C isotope signatures of magmatic calcium carbonate (calcite) have been successfully measured using ns-LA-MC-ICP-MS with a satisfactory precision (within 0.50‰; 2SD).14 Due to the complex chemical and physical features of natural carbonate, efforts have been made to calibrate a series of dolomite-ankerite solid solution reference materials for C isotope microanalysis using SIMS.11 For example, a compositional bias was recorded in C isotope values for dolomite, which increased exponentially by 2.5–5.5‰ with increasing Fe contents.11 Without exception, instrumental bias resulting from compositional dependency (i.e., matrix effect) remains as one of the analytical challenges for the wide application of in situ C isotope analyses for various carbonate matrices using LA-MC-ICP-MS. Chen et al. (2017) successfully used nanosecond laser-Nu plasma MC-ICP-MS to determine the carbon isotope of calcium carbonate,14 whereas the development of the carbon isotope microanalytical method of calc-magnesian, magnesian and ferruginous carbonates still remains a challenge. It is challenged by the lack of matrix-matched standards and C isotope fractionation at both the laser ablation site and ICP site.
In this last regard, femtosecond (fs) laser ablation systems are characterized by a much shorter pulse duration, even shorter than the thermal relaxation time of materials compared to the more popular nanosecond laser, which avoids heating laser plasma interaction.15,16 Moreover, femtosecond lasers generate smaller and more uniform distribution of aerosol particles (usually on the nanoscale), which enhances the transmission efficiency and ion signal intensity.15–21 Less thermal effects and generation of small particles result in high ion signal intensity and reduced fractionation, which makes femtosecond laser ablation systems most effective in reducing matrix effects for in situ isotopic analyses by the LA-MC-ICP-MS method.15–17,20 For example, accurate copper isotope compositions of cuprite samples were successfully determined using a pure Cu metal standard by fs-laser ablation analysis.18 Isotopic fractionation induced by the matrix dependency of Fe bearing minerals when calibrated against a pure metal isotopic standard was not observed using fs-LA-MC-ICP-MS.22 In this study, we adopt a femtosecond laser to reduce carbon isotope fractionation at the laser ablation site for the analysis of calc-magnesian, magnesian and ferruginous carbonates. Here, we characterize a series of in-house carbonate reference materials and evaluate the feasibility of in situ C isotopic analysis for carbonates (calcite, dolomite, magnesite, and siderite) by fs-LA-MC-ICP-MS.
2. Experimental
2.1.
In situ chemical composition analyses
The major and trace element concentrations for all investigated carbonate samples were determined with a RESOlution 193 nm laser system attached to an iCAP-Q ICP-MS at the State Key Laboratory of Geological Processes and Mineral Resources (GPMR), China University of Geosciences in Wuhan. NIST SRM 612 and USGS reference glass materials (BIR-1G, BCR-2G and BHVO-2G) were repeatedly analyzed for each 7–10 unknowns for calibration, as proposed by Chen et al. (2011).23 NIST 612 was used to correct for instrument drift and the USGS glass materials were used for external calibration for concentration determination. Both standards and samples were measured using a 33 μm spot size, a 10 Hz repetition rate, and a corresponding energy density of ∼3 J cm−2. Offline data reduction, including the calculation of composition, detection limits and individual run uncertainties were calculated with ICPMSDataCal software.24
2.2. Bulk carbon isotope analyses
Bulk carbonate mineral separates were crushed and milled to <75 μm for carbon isotopic determination using a MAT253 isotope ratio mass spectrometer (IRMS) coupled to a Thermo Fisher Gasbench II interface at the State Key Laboratory of Biogeology and Environmental Geology (BGEG), China University of Geosciences (Wuhan). The powdered carbonate samples (∼100–500 μg) were placed into a 10 mL borsyl headspace vial and reacted with 500 μL of 99% orthophosphoric acid (MERCK, Darmstadt, Germany, catalog #1.00565) for ∼5 hours at 72 °C. The δ13C values of the evolved CO2 were measured and reported as per mil relative to the Vienna Pee Dee Belemnite (VPDB) reference.25 The data quality was monitored via repeated analyses of the internal laboratory standard GBW04416 (δ13C = +1.61‰), which yielded an analytical precision of better than 0.1‰ (1σ).
2.3.
In situ carbon isotope analyses
In situ C isotope analyses were performed on a 257 nm Yb fs-laser ablation system (NWR-FemtoUC, USA) coupled to a NEPTUNE Plus MC-ICP-MS instrument (Thermo Fisher Scientific, Bremen, Germany) at GPMR. The duration of the laser pulse is 300 fs, the wavelength is 257 nm, the maximum energy is 120 mJ, and the maximum pulse repetition rate is 1000 Hz. 13C and 12C were measured simultaneously in Faraday cups H3 and L4, and the 25Mg2+ ion signal was acquired in the central cup. The samples were ablated in a helium atmosphere (0.6–0.7 L min−1) within the ablation cell, which was then mixed with argon gas (1.0–1.5 L min−1) in the sample-out line down-stream from the ablation chamber before entering the plasma torch. A signal-smoothing device was used downstream from the sample cell to decrease the tau effect, which helps eliminate the short-term variability of the signal.26 All measurements were performed in low mass resolution mode (M/M as defined by a peak edge width from 5 to 95% of the full peak height) of ∼400, whereas medium mass resolution (∼4000) was adopted to resolve spectral interference. The details of the instrumental operating conditions and measurement parameters are summarized in Table 1.
Table 1 Operating conditions for the MC-ICP-MS and laser ablation system
| Instruments |
Operating conditions |
|
|
|
MC-ICP-MS (Neptune plus)
|
| Cup-configuration |
L4 |
C |
H3 |
|
|
12C |
25Mg2+ |
13C |
| RF power |
1150–1200 W |
|
|
| Cool gas flow |
16.0 L min−1 |
|
|
| Auxiliary gas flow |
1.0 L min−1 |
|
|
| Argon make-up gas flow |
∼1.0–1.5 L min−1 |
|
|
| Helium carrier gas flow |
0.6–0.7 L min−1 |
|
|
| Nitrogen gas flow |
0 mL min−1 |
|
|
| Interface cones |
X skimmer cone + standard sample cone |
|
|
| Mass resolution |
∼400 (low) |
|
|
| Block number |
1 |
|
|
| Cycles of each block |
120 |
|
|
| Integration time (s) |
0.524 s |
|
|
![[thin space (1/6-em)]](https://www.rsc.org/images/entities/char_2009.gif) |
|
Laser ablation system (NWR-FemtoUC, USA)
|
| Laser type |
Yb:YAG femtosecond laser |
|
|
| Wavelength |
257 nm |
|
|
| Pulse length |
300 fs |
|
|
| Energy density |
3.24 J cm−2 |
|
|
| Ablation mode |
Raster mode |
|
|
| Spot size |
60 μm |
|
|
| Raster scan rate |
10 μm s−1 |
|
|
| Laser frequency |
80 Hz |
|
|
The offline selection and integration of background and analytical signals, and time drift correction and isotopic ratio calibration were performed using Iso-Compass software.27In situ C isotope data reported were corrected for instrumental mass bias using the standard-sample bracketing method. In order to allow for the comparison of the in situ δ13C data determined here relative to those of in-house reference materials, all data presented were recalculated to the commercially available VPDB marine carbonate reference material25 using the following equations:
| | 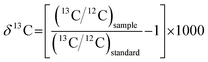 | (1) |
| | | δ13Csample/VPDB = δ13Csample/in-house RM + δ13Cin-house RM/VPDB | (2) |
where
δ13C
sample/in-house RM is the measured
δ value of the sample relative to the in-house reference materials by fs-LA-MC-ICP-MS and
δ13C
in-house RM /VPDB is the
δ value of the in-house reference materials relative to VPDB determined by IRMS.
3. Results and discussion
3.1. Chemical and bulk isotopic characterization of carbonates
Different types of isomorphic series of carbonate minerals were adopted in this study, including 6 dolomites (DOL-1, DOL-2, DOL-3, DOL-6, DOL-8, and DOL-9), 3 magnesites (MGS-1, MGS-2, and MGS-3) and 5 siderites (SD-1, SD-2, SD-3, SD-4, and SD-5), together with two previously characterized calcites (SXD8 and Oka153).14
The major and trace element compositions of the carbonate materials are listed in Appendix Table S1† and shown in Fig. 1. The results of LA-ICP-MS analysis show that the major element composition of magnesite is relatively uniform with Mg contents that range between 26.3 and 27.4%, while that of dolomite and siderite varies greatly among samples and within individual grains. Dolomite displays variable Mg and Fe contents that range between 8.6–12.5% and 0.03–5.4%, respectively, whereas Mn and Ca show limited variation (abundances vary within 1.5%). Most dolomite grains are characterized by relatively homogeneous major element compositions (2SD < 0.6%), whereas DOL-1 and DOL-6 exhibit within-grain variations. For instance, the Fe and Mg contents of DOL-1 vary from 0.5–4.0% and 9.0–11.5%, respectively, and those of DOL-6 show ranges between 5.1–6.5% and 7.4–9.1%. The siderite samples show variable Mg contents (2.4–8.6%), whereas they in general contain little Mn and Ca (<1.8% and 0.2%, respectively). Among them, SD-4 contains the highest Mg (average of 8.6%) and the lowest Fe contents (average of 32.2%). Trace element contents for the investigated carbonates are mainly lower than 10 μg g−1, with the exception of Na, Al and Sr that are several to hundreds of μg g−1 (Appendix Table S1†).
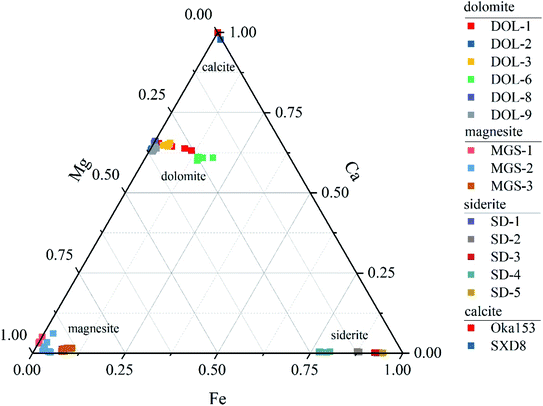 |
| | Fig. 1 Major-element variations of different carbonate matrices (dolomite, magnesite, siderite and calcite). | |
Three to six randomly selected chips were taken from each carbonate sample to obtain the bulk carbon isotope values using IRMS (e.g., Fig. 2), and data are shown in Table 2. The bulk δ13C values of the examined dolomite define a range of −5.27‰ to 0.32‰, and those of magnesite and siderite range between 0.16‰ and 3.00‰ and −9.78‰ to −5.32‰, respectively. Among the investigated carbonate samples, DOL-8, MGS-1 and SD-5 show good reproducibility within 0.25‰ (2SD), suggesting relative isotopic homogeneity on the hand-specimen scale. The carbonates with larger determined uncertainties (e.g., >0.50‰, 2SD) show C isotopic variations for distinctive chips separated; for instance, different siderite crystals taken from the SD-2 sample are characterized with distinctive C isotope compositions as −4.90‰, −5.20‰ and −5.87‰, respectively (Fig. 2).
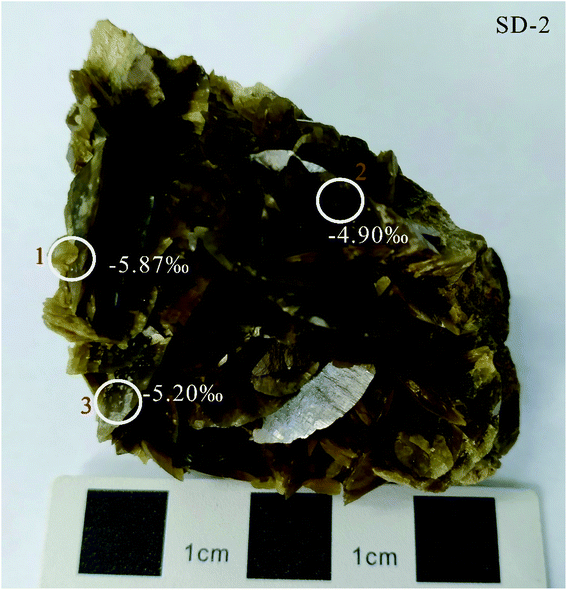 |
| | Fig. 2 Photograph of the hand specimen of SD-2 siderite with marked sampling positions of chips 1, 2, and 3 and associated IRMS determined C isotope compositions. | |
Table 2 fs-laser ablation C isotope measurements for the carbonate samplesa
| Sample |
Matrix |
Bracketing standard |
fs-LA values |
IRMS values |
|
δ
13C (‰) |
2SD (‰) |
n
|
δ
13C (‰) |
2SD (‰) |
n
|
|
“n” represents the number of laser ablation rastering and IRMS analyses, respectively. “2SD” represents twice the standard deviation.
Data from Chen et al. (2017).14
|
| Oka153 |
Calcite |
SXD8 |
−5.61 |
0.42 |
26 |
−5.77b |
0.04b |
1 |
| DOL-8 |
Dolomite |
DOL-8 |
−1.06 |
0.37 |
22 |
−1.09 |
0.08 |
3 |
| DOL-9 |
Dolomite |
|
0.41 |
0.65 |
28 |
0.32 |
0.30 |
3 |
| DOL-2 |
Dolomite |
|
−5.61 |
0.59 |
35 |
−5.27 |
0.62 |
3 |
| DOL-3 |
Dolomite |
|
−1.15 |
1.41 |
33 |
−0.92 |
1.58 |
3 |
| DOL-1 |
Dolomite |
|
−2.64 |
3.19 |
41 |
−0.96 |
0.94 |
3 |
| DOL-6 |
Dolomite |
|
−2.76 |
0.81 |
15 |
−2.14 |
0.83 |
3 |
| MGS-1 |
Magnesite |
MGS-1 |
3.04 |
0.40 |
24 |
3.00 |
0.12 |
6 |
| MGS-2 |
Magnesite |
|
0.49 |
0.57 |
16 |
0.16 |
0.51 |
6 |
| MGS-3 |
Magnesite |
|
0.91 |
0.99 |
20 |
0.70 |
0.78 |
3 |
| SD-5 |
Siderite |
SD-5 |
−6.26 |
0.45 |
22 |
−6.21 |
0.24 |
3 |
| SD-1 |
Siderite |
|
−6.14 |
0.68 |
15 |
−6.08 |
0.16 |
3 |
| SD-2 |
Siderite |
|
−6.37 |
0.54 |
13 |
−5.32 |
0.98 |
3 |
| SD-3 |
Siderite |
|
−5.98 |
0.38 |
15 |
−6.28 |
0.08 |
3 |
| SD-4 |
Siderite |
|
−10.11 |
0.98 |
18 |
−9.78 |
0.22 |
3 |
3.2. Spectral interference
For the determination of C isotopes using fs-LA-MC-ICP-MS, spectral interference involves both polyatomic species (dominantly carbon hydroxide ion) and doubly charged Mg ions, and tetravalent charged Ti and Cr ions. Both the sample and carrier gases of argon and helium contain CO2 or organic impurities, which results in 12CH+ interference of 13C. The 12CH+ interference, which occurs on the high mass side of the 13C ion signal, can be significant and is dependent on both the Ar and He gas flow rates. Fig. 3 shows the influences of the Ar and He gas flow rates on CH+ interference examined in medium resolution mode (resolving power ∼ 4000). 12CH+/13C ratios increase from 0 to 0.333 when the Ar gas flow rate is augmented from 1.208 to 1.463 L min−1 (Fig. 3c). Similarly, this interference also becomes more significant with increasing He gas flow rates (Fig. 3d). The 12CH+/13C interference can be avoided by carefully tuning and adopting low gas flow rates for both Ar and He (<1.208 and 0.6 L min−1).
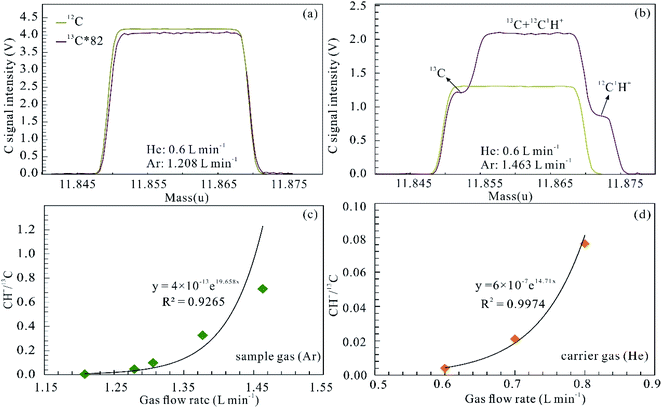 |
| | Fig. 3 Influences of the Ar and He gas flow rates on 12C1H+ interference. Peak shapes for 12C and 13C of the background at different Ar and He gas flow rates (a and b), and 12C1H+ superimposed on the high mass shoulder of 13C in (b). Signal intensity of 13C was multiplied by 82 to match the signal intensity of 12C. 12C1H+ interference (12C1H+/13C) displays an exponential function of both the Ar sample gas flow (c) and the He carrier gas flow (d). | |
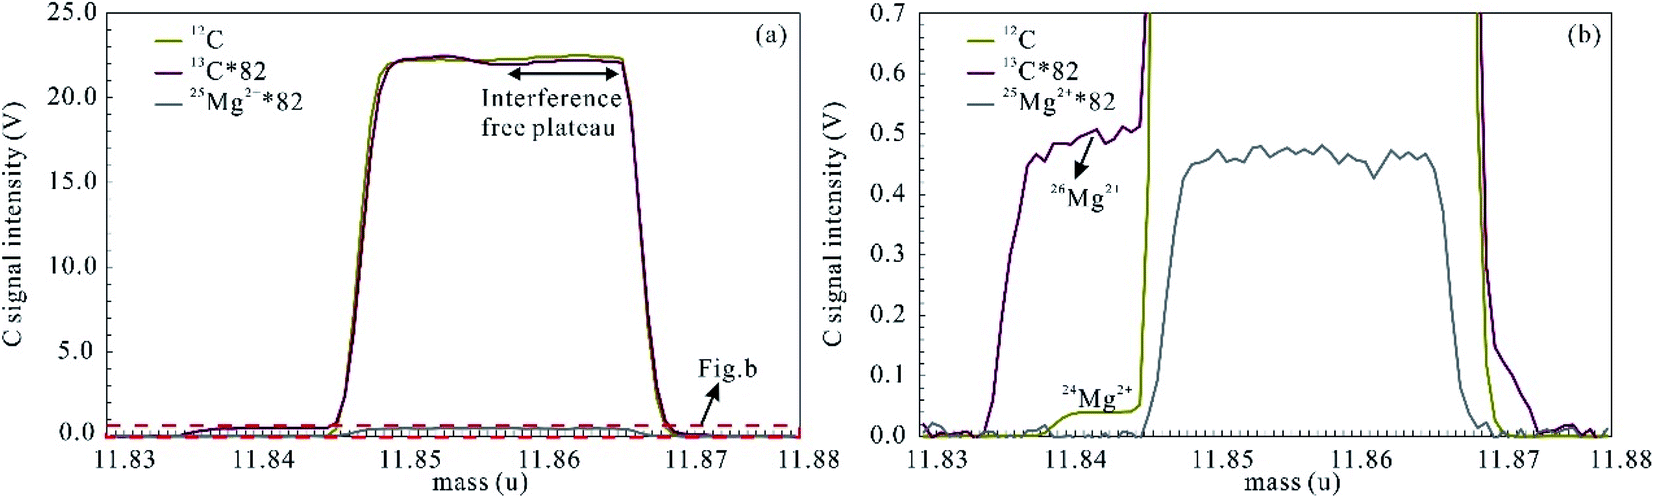
All investigated carbonates in this study are low in Ti and Cr (<10 μg g−1; Appendix Table S1†), and the tetravalent charged ion interference of 48Ti4+ for 12C+ and 52Cr4+ for 13C+ is negligible. In contrast, the spectral interference of doubly charged Mg ions may be significant for C isotope analyses of magnesium-rich carbonate minerals, such as dolomite and magnesite (Fig. 4). 26Mg2+ and 24Mg2+ interference both occur on the low mass shoulder of 13C and 12C ion signals and thus the latter was measured at an off-center position (high mass shoulder) and in interference-free plateau region (Fig. 4).
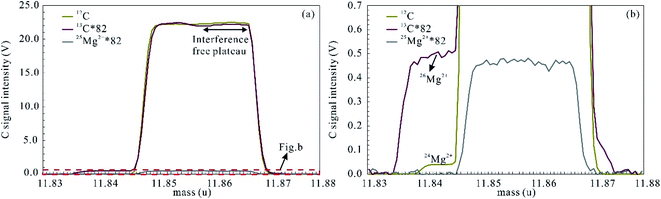 |
| | Fig. 4 Peak shapes for 12C and 13C obtained from MGS-1. Interference of doubly charged Mg ions superimposed on the low mass shoulder of 12C and 13C, which leaves the high mass shoulder as the interference free plateau. Signal intensities of 13C and 25Mg2+ were multiplied by 82 to match the signal intensity of 12C. | |
3.3. Internal precision
The internal uncertainty (or precision; repeatability within the ablation raster) for an individual fs-LA-MC-ICP-MS analysis ranged from 0.13 to 1.14‰ and varied according to C signal intensities; the latter was achieved by modifying laser ablation parameters such as an ablation spot size of 45–60 μm, scan rate of 2–12 μm s−1, frequency of 25–80 Hz and fluence of 2.7–3.3 J cm−2 (Fig. 5). Fig. 5 clearly shows the dependency of the internal precision on the 12C ion signal intensity. Of note, an increase in the 12C ion signal intensity from 3 to 12.5 V results in a significant improvement of the repeatability, and ideally measured 12C ion signals should be >12.5 V in order to achieve a level of precision <0.2‰ (2SE).
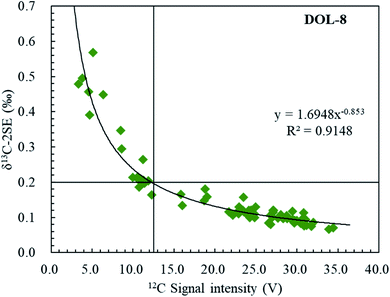 |
| | Fig. 5 Internal precisions of δ13C (2SE) measured by femtosecond laser ablation MC-ICP-MS on DOL-8, as a function of signal intensity of 12C (volts). It demonstrated that the measurement repeatability of the δ13C ratio (SE) is an exponential function of the 12C intensity. | |
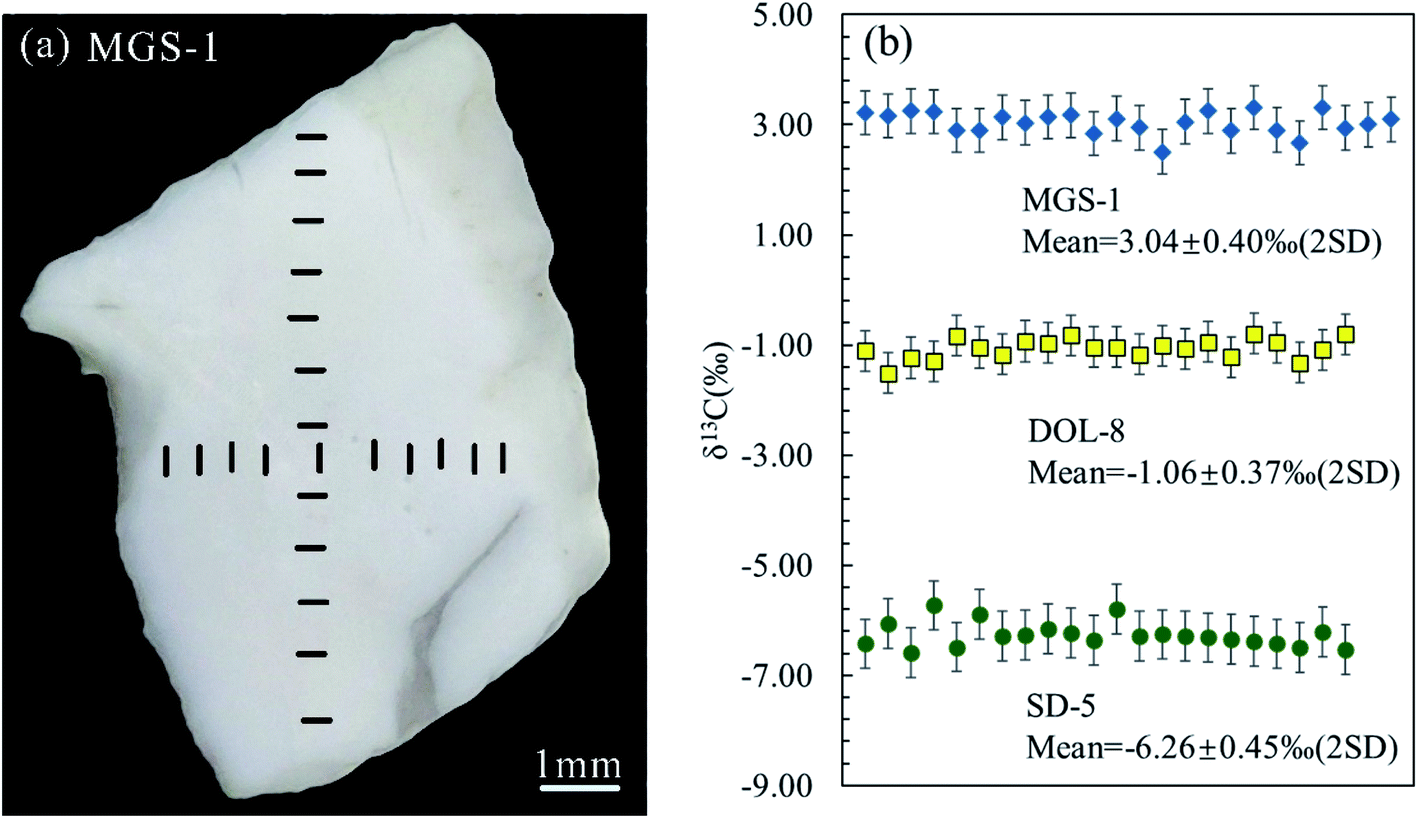
3.4. Reproducibility
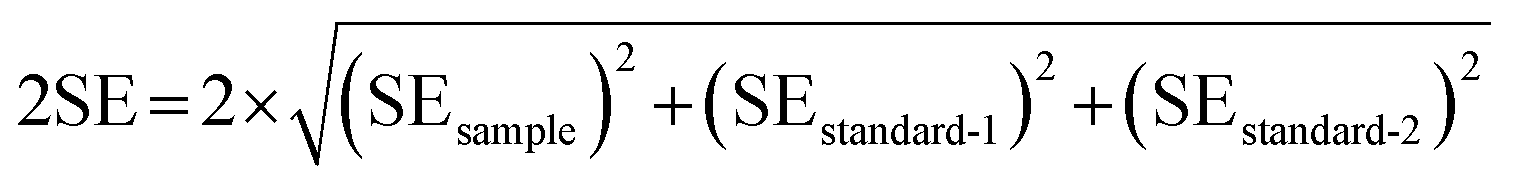
The external reproducibility (level of duplication) associated with the in situ C isotope analysis of carbonates is in general influenced by instrument stability, reliability of mass bias correction, correction for spectral interference, and homogeneity of the C isotope composition of individual samples.28 The in situ reproducibility of carbonate samples with relatively good bulk carbon isotope reproducibility (including DOL-8, MGS-1, and SD-5) were further verified in this study by investigating individual carbonate grains. The dimensions of the three carbonate grains examined are approximately 1.5 cm × 2 cm, 1 cm × 1.5 cm and 1 cm × 1 cm, respectively (e.g., Fig. 6a). The external reproducibility of the measured C isotope ratios was obtained from repeated measurements with the same experimental/instrument conditions. The associated uncertainty for each sample (external reproducibility) is expressed as twice the standard deviation (2SD). The within-run precision (2SE) of each analysis involves the uncertainty propagation from the bracketing standard materials, adopting the following equation as proposed in Zhang et al. (2020):27| |  | (3) |
where standard-1 and standard-2 represent measurements of the bracketing standards performed before and after the sample, respectively.
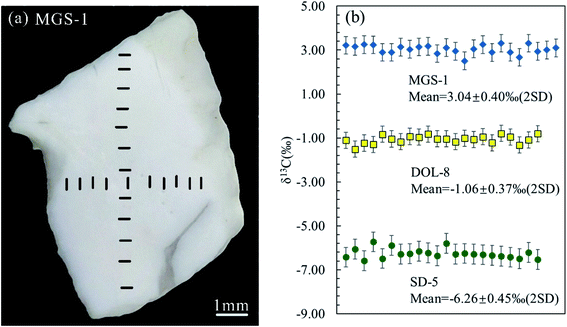 |
| | Fig. 6 External reproducibility of the C isotope analyses for MGS-1, DOL-8 and SD-5 (b) with the line scan ablation positions marked on MGS-1 (a). | |
Repeated analyses of C isotopes for different portions of the individual carbonate grains were performed by conducting analyses along cross sections as shown in Fig. 6a. This yielded δ-values with twice standard deviation of −1.06 ± 0.37‰ (n = 22), 3.04 ± 0.40‰ (n = 24) and −6.26 ± 0.45‰ (n = 22) for DOL-8, MGS-1 and SD-5, respectively (Fig. 6b). Repeated analyses of DOL-8, MGS-1 and SD-5 yielded δ13C external reproducibility in the range of 0.37–0.45‰ (2SD), which are similar to those previously reported (∼0.50‰; 2SD) in Chen et al. (2017)14 using ns-LA-MC-ICP-MS, and therefore represent the resolving capacity of the in situ C isotope analysis protocol established in this study.
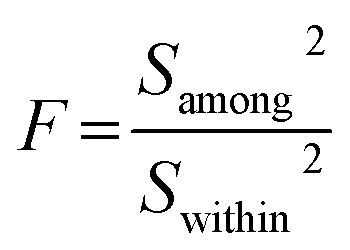
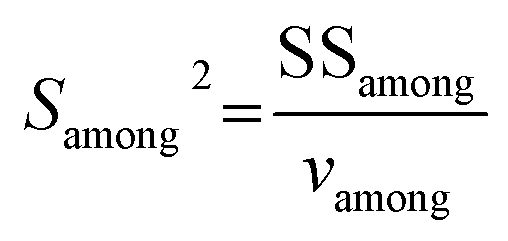
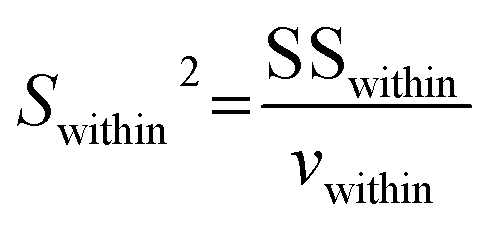
An alternatively preliminary homogeneity assessment has been conducted using the obtained data from different zones of the large investigated grain with the two-factor analysis of variance (ANOVA), according to ISO guide 35.29 The δ13C results of different zones in each carbonate were randomly separated into three units. F is the ratio of among-unit variance (Samong2) to within-unit variance (Swithin2):
| |  | (4) |
where
Samong2 represents the ratio of the among-unit sums of squares (SS
among) to the associated among-unit degrees of freedom (
vamong), and
Swithin2 is the ratio of the within-unit sums of squares (SS
within) to the associated within-unit degrees of freedom (
vwithin):
| |  | (5) |
| |  | (6) |
where
vamong and
vwithin are dependent on the number of units and the analysis number within each unit.
where
m represents the number of units and
N represents the total number of statistics.
The results are shown in the ANOVA table (Table 3). F-Testing demonstrates that the samples have very good C isotopic homogeneity [F < Fcritical (vamong, vwithin); the critical value of F for α = 5%].
Table 3 ANOVA table for homogeneity testing of carbon isotope compositions of magnesite, dolomite and sideritea
| Sample |
![[X with combining macron]](https://www.rsc.org/images/entities/i_char_0058_0304.gif)
|
SSamong |
SSwithin |
F
|
F
0.05 (2,30) |
|
m = 3; N = 33; vamong = 2; vwithin = 30.
|
| MGS-1 |
3.06 |
0.12 |
1.03 |
1.72 |
3.32 |
| DOL-8 |
−1.10 |
0.10 |
0.92 |
1.54 |
3.32 |
| SD-5 |
−6.24 |
0.09 |
1.64 |
0.78 |
3.32 |
To sum up, these three carbonate materials are considered to have isotopically homogeneous C isotope compositions on a μm to mm scale and are therefore adopted as in-house reference materials for carbon isotope analysis using fs-LA-MC-ICP-MS.
3.5. Results of in situ C isotope analysis of calcite, dolomite, magnesite and siderite using fs-LA-MC-ICP-MS
Multiple carbonate materials with a wide range of δ13C (bulk sample) values ranging from −9.78 to 0.70‰ were investigated using the standard-sample bracketing strategy outlined here. The previously characterized SXD8 carbonate together with DOL-8, MGS-1 and SD-5 were used as the bracketing standards.14
Calcite.
Both calcites (SXD8 and Oka153) are characterized by low Mg, Fe and Mn contents (<0.7%), and detailed chemical and isotopic information can be found in Chen et al. (2017).14 Separate calcite grains from sample Oka153 were analyzed using SXD8 as the bracketing standard yielding an average δ13C value of −5.61 ± 0.42‰ (2SD), which agrees well with that determined by IRMS (Table 2 and Fig. 7a).14
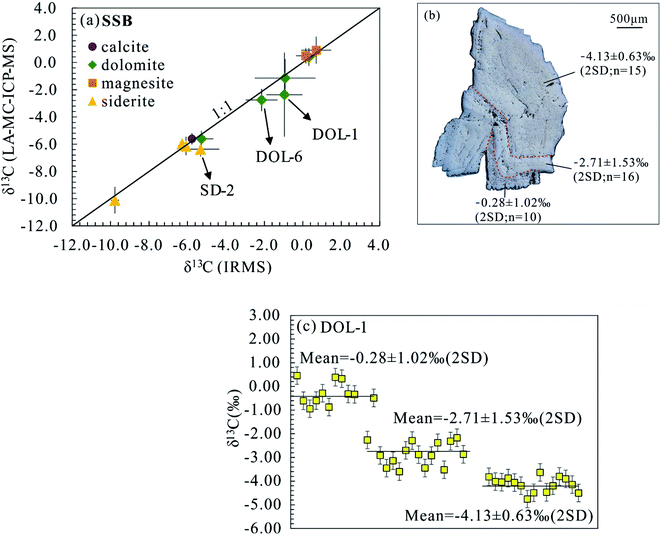 |
| | Fig. 7 Measured δ13C values of dolomite, magnesite and siderite using fs-LA-MC-ICP-MS in comparison to IRMS data (a). The solid line is a 1:1 reference line. Laser ablation carbon isotope measurements of DOL-1 show three distinct in situ δ13C values (b and c). | |
Dolomite.
The five dolomite samples selected for this investigation contain variable Mg and Fe contents (8.6–12.5% and 0.1–5.4%, respectively; Fig. 1 and Appendix Table S1†). Two dolomite samples (DOL-9 and DOL-2) with relatively homogeneous isotope ratios yield δ13C values of 0.41 ± 0.65‰ and −5.61 ± 0.59‰, respectively (Table 2 and Fig. 7a). Both results are in good agreement with the bulk δ13C analyse results obtained by IRMS. DOL-1 together with DOL-3 and DOL-6 displays a saddle texture (e.g., Fig. 7b), which is recognized as a common product of late-stage diagenesis and hydrothermal activity or as a replacement product in some dolomitized limestones.30,31 The bulk carbon isotope compositions for these saddle dolomites DOL-1, DOL-3 and DOL-6 show slight heterogeneity as associated uncertainties are >0.83‰ (2SD), with in situ analyses yielding average δ13C values of −2.64 ± 3.19‰, −1.15 ± 1.41‰, and −2.76 ± 0.81‰ (2SD), respectively; despite their larger associated uncertainties, the average in situ C isotope values are consistent with those obtained for the corresponding bulk samples by IRMS. The recorded large uncertainty is indicated by distinct C isotope composition in different grains or zones. For instance, DOL-1 defines three distinct in situ δ13C values of −4.13 ± 0.63‰, −2.71 ± 1.53‰, and −0.28 ± 1.02‰ in different zones of the grain with generally heavier C isotopes identified in the rim (Fig. 7b and c). The recorded C isotopic variation indicates significant isotope fractionation during the diagenesis of the investigated saddle dolomites.
Magnesite.
The magnesite crystals selected for this study are chemically homogeneous (Fig. 1). The reported in situ δ13C value for MGS-2 using MGS-1 as the bracketing standard is 0.49 ± 0.57‰ (2SD), which shows good agreement with IRMS measurements (Table 2 and Fig. 7a). The laser-ablation δ13C analyses of MGS-3 display an average value and associated precision of 0.90 ± 0.99‰ (2SD; Table 2 and Fig. 7a). The slightly larger uncertainty for MGS-3 compared to that of MGS-2 is consistent with that observed in the bulk C isotope analyses (Table 2), which implies that MGS-3 is isotopically heterogeneous on both the high-spatial micron scale and the hand-specimen scale.
Siderite.
Average δ13C values of −6.14 ± 0.68‰, −5.98 ± 0.38‰ and −10.11 ± 0.98‰ were obtained, respectively, for samples SD-1, SD-3 and SD-4 by laser ablation analyses using SD-5 as the bracketing standard and show good agreement with the bulk sample IRMS values (Table 3 and Fig. 7a). Of particular note, in situ C isotopic results for SD-3 show excellent micron-scale homogeneity (2SD = 0.38‰ and n = 15) despite slightly variable chemical compositions (Table 2 and Fig. 1). Of note, laser ablation analyses for SD-2 yield an average δ13C value and associated uncertainty of −6.37 ± 0.54‰ (2SD), which is slightly lower than the average IRMS value of −5.32 ± 0.98‰ (2SD), but similar to the same chip with IRMS determined δ13C value of −5.87‰ (Fig. 2).
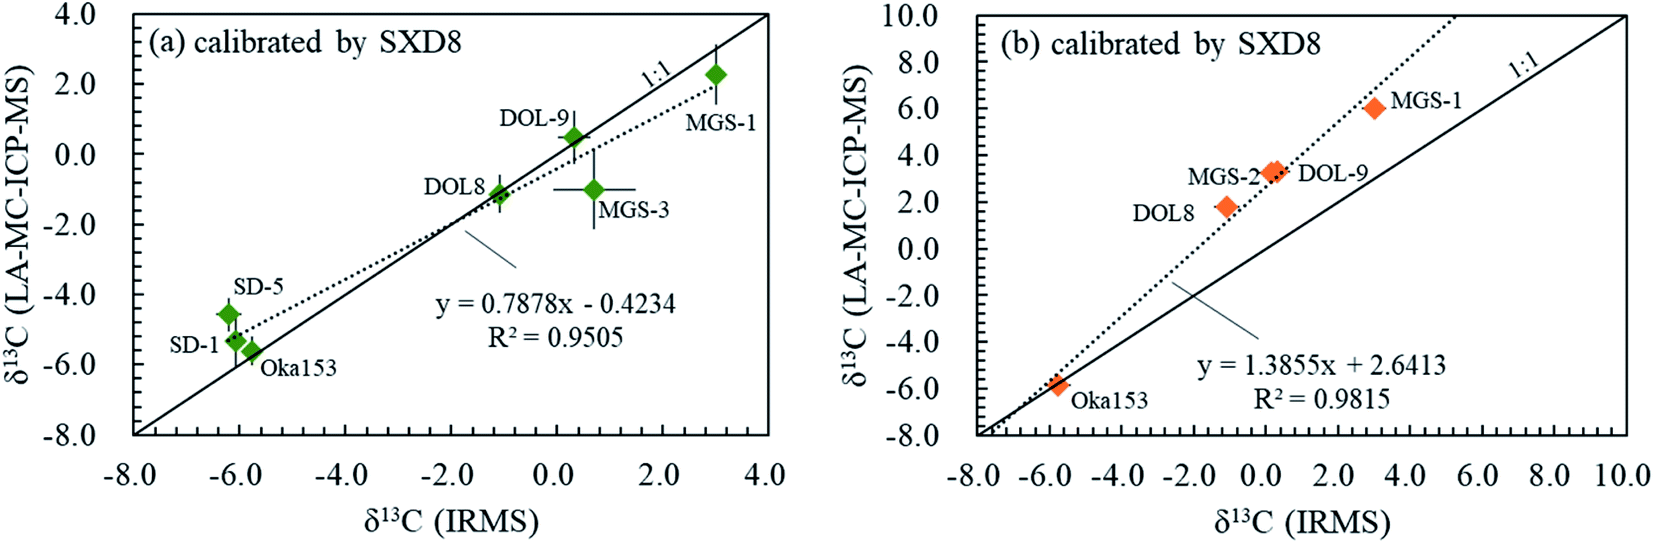
3.6. Carbon isotope fractionation among various carbonates
The range of carbon isotope signatures reported here for different carbonate minerals, which include calcite, dolomite, magnesite and siderite, using the fs-LA-MC-ICP-MS method is shown in Fig. 8. All C isotope compositions for carbonates investigated here are compared relative to calcite standards and were obtained during two analytical sessions on different analytical days. The possible matrix-dependent C isotope difference/fractionation between calcite (SXD8) and dolomite (DOL-8 and DOL-9) is variable and ranges from insignificant (first analytical session) to non-negligible (up to 2.89‰ in the second analytical session; Fig. 8a and b). The instrumental fractionation values between magnesite (MGS-1 and MGS-3) and siderite (SD-1 and SD-5) with respect to calcite are both non-negligible, up to 4.29‰ and 1.64‰, respectively (Fig. 8a and b). The matrix difference can influence the accuracy by: (1) introducing isobaric interference and/or (2) altering the instrumental mass bias effected by plasma ionization and ion transmission efficiency, as well as (3) laser-induced fractionation at the site of ablation.32–35 Fe and Mg may be the dominant matrix elements within the investigated carbonate matrices inducing carbon isotope fractionation using fs-LA-MC-ICP-MS. As discussed above, the isobaric interference of doubly charged Mg ions is avoidable by conducting analyses on the interference free plateau, and thus it does not play the dominant role in the C isotope fractionation between calcite (SXD8) and Mg-bearing carbonate (e.g., dolomite DOL-8 and DOL-9 and magnesite MGS-1 and MGS-2). Therefore, the matrix difference dominantly results in a non-spectral instrumental mass bias. The different sample physical and chemical properties of carbonate matrices could result in different aerosol particle sizes causing differential transport and vaporization efficiency, elemental/isotopic redistribution in aerosols and a hot melt layer due to diverse volatile properties of elements, different plasma temperatures and space charge by a distinct number of samples transmitted, all of which affect both plasma ionization and ion transmission efficiency and laser-induced fractionation.35 Evans et al. (2021)36 reported that the matrix dependency of B isotope measurements is related to ICP-MS tuning conditions, especially RF power, and suggested that strict matrix matching does not appear necessary when using a session-specific correction line based on three well-characterized references. Similarly, Fig. 8 shows a good linear correlation between the LA results and IRMS data in both analytical sessions, and the external multi-reference calibration can serve as an alternative calibration approach in addition to the matrix-matched calibration. By adopting the linear correlation and the laser ablation C isotope results for multi-reference materials, accurate C isotope results (IRMS results in the formula) of carbonate samples can be calculated using the equation below:where δ13Cm is the LA analysis δ value, Cr represents the IRMS/true δ value, and k and b are the slope and the y-intercept of the linear regression and can be determined using multiple standards in routine analyses (Fig. 8a and b). The slope and y-intercept of the linear regression are affected by instrument conditions and operating engineers (Fig. 8a and b). This linear relationship should be established on a daily basis to guarantee the accuracy and precision of C isotopic analysis.
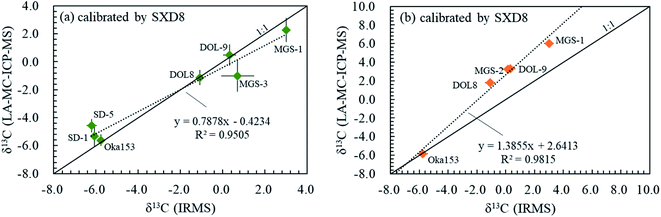 |
| | Fig. 8 Carbon isotopic fractionation of different carbonate minerals including calcite, dolomite, magnesite and siderite using fs-LA-MC-ICP-MS in two different analytical sessions (a and b). δ13C obtained by fs-laser ablation is a function of that obtained by IRMS, represented by the dashed line, applying SXD8 calcite as a calibration standard. The solid line is a 1:1 reference line. | |
The instrumental mass bias for the measurement of C isotope ratios was also previously corrected using internal normalization adopting boron isotope in solution MC-ICP-MS.37,38 In their work, absolute carbon 13C/12C isotope amount ratios (corrected with 11B/10B) have been obtained for four NIST reference materials with a precision better than 0.05%, which provides a possible option to correct instrument drift for the non-matrix matched calibration protocols. Detailed future work should be conducted in order to correct the non-spectral matrix effects for different carbonate matrices, especially rare minerals (e.g., stichtite and malachite) for which calibration standards have not yet been established.8
4. Conclusions
This study presents a method to obtain relatively high-precision in situ C isotope compositions for a variety of carbonates (calcite, dolomite, magnesite and siderite) by fs-LA-MC-ICP-MS. The internal precision of in situ C isotope analyses is better than 0.2‰ (2SE) for analyses with recorded 12C ion signal intensities >12.5 V, and the corresponding external reproducibility of in-house standards DOL-8, MGS-1 and SD-5 is better than 0.45‰ (2SD). Using the standard-sample bracketing (SSB) calibration protocol, the C isotopes of various carbonates with variable δ13C signatures (−6.28–0.32‰) are accurately determined with uncertainties that range between 0.37‰ and 0.68‰ (2SD). Moreover, in situ C isotope results obtained with the fs-LA-MC-ICP-MS protocol described here essentially eliminate matrix effects as they are relatively uniform for the same carbonate matrix with variable chemical compositions. Instrumental carbon isotope fractionation among the investigated different carbonate matrices (e.g., up to 4.29‰ between calcite and magnesite) are observed using fs-LA-MC-ICP-MS, and an external multi-reference calibration can be applied for non-matrix matched analyses.
Conflicts of interest
There are no conflicts to declare.
Acknowledgements
We thank Yong Du for assistance in IRMS analysis. We are grateful to the comments of two anonymous reviews, which significantly helped to improve the manuscript, and to Alice Smallwood for editorial handling of the manuscript. This work is financially supported by the National Natural Science Foundation of China (Grant No. 41973016) and the National Key R&D Program of China (No. 2019YFA0708400).
References
- H. Craig, Geochim. Cosmochim. Acta, 1953, 3, 53–92 CrossRef CAS.
-
R. J. Reeder and D. J. Barber, Carbonates: Mineralogy and Chemistry, Mineralogical Society of AmericaWashington, DC, 1983, vol. 11, pp. 1–47 Search PubMed.
-
F. Pirajno, in Hydrothermal Processes and Mineral Systems, Springer, 2009, pp. 727–883 Search PubMed.
- P. Deines, Geochim. Cosmochim. Acta, 2004, 68, 2659–2679 CrossRef CAS.
-
J. Hoefs, Stable Isotope Geochemistry, Springer, 2018 Search PubMed.
- S. Crivellari, P. J. Viana, M. de Carvalho Campos, H. Kuhnert, A. B. M. Lopes, F. W. da Cruz and C. M. Chiessi, J. Anal. At. Spectrom., 2021, 36, 1125–1134 RSC.
- J. M. Ferry, T. Ushikubo, N. T. Kita and J. W. Valley, Geochim. Cosmochim. Acta, 2010, 74, 6517–6540 CrossRef CAS.
- E. B. Melchiorre, G. R. Huss and A. Lopez, Chem. Geol., 2014, 367, 63–69 CrossRef CAS.
- C. Rollion-Bard, D. Mangin and M. Champenois, Geostand. Geoanal. Res., 2007, 31, 39–50 CrossRef CAS.
- M. G. Śliwiński, K. Kitajima, R. Kozdon, M. J. Spicuzza, A. Denny and J. W. Valley, Int. J. Greenhouse Gas Control, 2017, 57, 116–133 CrossRef.
- M. G. Śliwiński, K. Kitajima, R. Kozdon, M. J. Spicuzza, J. H. Fournelle, A. Denny and J. W. Valley, Geostand. Geoanal. Res., 2016, 40, 173–184 CrossRef.
- G. Q. Tang, X. H. Li, Q. L. Li, Y. Liu and X.-X. Ling, Surf. Interface Anal., 2019, 52, 190–196 CrossRef.
- M. J. Bojanowski, B. Bagiński, C. Guillermier and I. A. Franchi, Chem. Geol., 2015, 416, 51–64 CrossRef CAS.
- W. Chen, J. Lu, S.-Y. Jiang, K.-D. Zhao and D.-F. Duan, Anal. Chem., 2017, 89, 13415–13421 CrossRef CAS.
- R. Glaus, R. Kaegi, F. Krumeich and D. Günther, Spectrochim. Acta, Part B, 2010, 65, 812–822 CrossRef.
- M. Shaheen, J. Gagnon and B. Fryer, Spectrochim. Acta, Part B, 2015, 107, 97–109 CrossRef CAS.
- C. C. Garcia, H. Lindner, A. von Bohlen, C. Vadla and K. Niemax, J. Anal. At. Spectrom., 2008, 23, 470–478 RSC.
- K. Ikehata, K. Notsu and T. Hirata, J. Anal. At. Spectrom., 2008, 23, 1003–1008 RSC.
- M. Lazarov and I. Horn, Spectrochim. Acta, Part B, 2015, 111, 64–73 CrossRef CAS.
- G. Steinhoefel, I. Horn and F. von Blanckenburg, Chem. Geol., 2009, 268, 67–73 CrossRef CAS.
- H. Yuan, K. Chen, B. ZhiAn, C. Zong, M. Dai, C. Fan and C. Yin, Chin. Sci. Bull., 2013, 58, 3914–3921 CrossRef CAS.
- I. Horn, F. von Blanckenburg, R. Schoenberg, G. Steinhoefel and G. Markl, Geochim. Cosmochim. Acta, 2006, 70, 3677–3688 CrossRef CAS.
- L. Chen, Y. Liu, Z. Hu, S. Gao, K. Zong and H. Chen, Chem. Geol., 2011, 284, 283–295 CrossRef CAS.
- Y. Liu, Z. Hu, S. Gao, D. Günther, J. Xu, C. Gao and H. Chen, Chem. Geol., 2008, 257, 34–43 CrossRef CAS.
- T. B. Coplen, Pure Appl. Chem., 1994, 66, 273–276 CAS.
- Z. Hu, W. Zhang, Y. Liu, S. Gao, M. Li, K. Zong, H. Chen and S. Hu, Anal. Chem., 2015, 87, 1152–1157 CrossRef CAS PubMed.
- W. Zhang, Z. Hu and Y. Liu, J. Anal. At. Spectrom., 2020, 35, 1087–1096 RSC.
- W. Zhang, Z. Hu, Y. Liu, L. Feng and H. Jiang, Chem. Geol., 2019, 522, 16–25 CrossRef CAS.
-
ISO Guide 35, Reference Materials — Guidance for Characterization and Assessment of Homogeneity and Stability, International Organization for Standardization, Geneva, 2017 Search PubMed.
- B. M. Radke and R. L. Mathis, J. Sediment. Res., 1980, 50, 1149–1168 CAS.
- A. Searl, Mineral. Mag., 1989, 53, 547–555 CrossRef CAS.
- I. Horn and F. von Blanckenburg, Spectrochim. Acta, Part B, 2007, 62, 410–422 CrossRef.
- S. E. Jackson and D. Günther, J. Anal. At. Spectrom., 2003, 18, 205–212 RSC.
-
P. Sylvester, in Laser ablation ICP-MS in the earth sciences: Current practices and outstanding issues, Mineralogical Association of Canada, 2008, vol. 40, pp. 67–78 Search PubMed.
- W. Zhang and Z. Hu, Spectrochim. Acta, Part B, 2020, 171, 105929 CrossRef CAS.
- D. Evans, A. Gerdes, D. Coenen, H. R. Marschall and W. Müller, J. Anal. At. Spectrom., 2021, 36, 1607–1617 RSC.
- R. Santamaria-Fernandez, D. Carter and R. Hearn, Anal. Chem., 2008, 80, 5963–5969 CrossRef CAS PubMed.
- R. Santamaria-Fernandez and T. Le Goff, J. Anal. At. Spectrom., 2010, 25, 378–383 RSC.
Footnote |
| † Electronic supplementary information (ESI) available. See DOI: 10.1039/d1ja00356a |
|
| This journal is © The Royal Society of Chemistry 2022 |

 a,
Wei
Chen
a,
Wei
Chen