
 Open Access Article
 This Open Access Article is licensed under a
 Creative Commons Attribution 3.0 Unported Licence
Analyzing the interconnected dynamics of domestic biofuel burning in India: unravelling VOC emissions, surface-ozone formation, diagnostic ratios, and source identification
Arnab Mondal a,
Surajit Mondal*b,
Paulami Ghoshc and
Papita Dasd
a,
Surajit Mondal*b,
Paulami Ghoshc and
Papita Dasd
aInstitute of Environment and Sustainable Development, Banaras Hindu University, Varanasi, 221005, India
bDepartment of Electrical and Electronics Engineering, School of Advanced Engineering, University of Petroleum and Energy Studies, Dehradun, 248007, India. E-mail: surajitmondalee@gmail.com
cSchool of Health Sciences and Technology, University of Petroleum and Energy Studies, Dehradun, 248007, India
dDepartment of Chemical Engineering, Jadavpur University, Kolkata, 700032, India
First published on 25th June 2024
Abstract
Burning biomass fuels in Indian households is a common and cost-efficient way to generate energy for various domestic tasks. However, this practice is a significant source of non-methane volatile organic compounds (NMVOCs) released into the atmosphere, impacting local and global air quality. The substantial quantities of NMVOCs produced from burning biofuels at home can have adverse effects on climate and human health worldwide. This review focuses on exploring the processes involved in domestic biofuel combustion, detailing different stages of burning, and discussing the tools and techniques required to measure NMVOC emissions accurately. It also aims to identify potential emission sources through methods such as diagnostic ratios and PCA analysis. By striving to reduce NMVOC emissions from household biofuel burning, the goal is to provide a basis for informing policymakers in developing effective regulations and policies to address this environmental issue.
Sustainability spotlightShining a Sustainability Spotlight on Domestic Biofuel Combustion: A Comprehensive Examination of VOC Emissions, Ozone Formation, and Source Identification in Residential Activities Across the Indian Subcontinent. This review delves into the intricacies of combustion-dilution chamber design, replicating typical indoor emission conditions, and explores the spectrum of VOCs released during ignition, flaming, and smoldering phases. Investigating ground-level ozone and PAN formation from emitted VOCs, this review meticulously employs diagnostic ratios and PCA analysis to identify potential air pollutant sources. Analyzing air pollutant loading over Delhi from January 2018 to June 2021, encompassing NOx, NO, NO2, CO, and VOCs, the study also examines government policies aimed at mitigating air pollution. The review concludes by deliberating on potential solutions to limit volatile organic compound emissions. |
1. Introduction
Domestic biofuel burning is an act of burning animal excreta and flora, living or dead, to produce energy for day-to-day residential activities. These activities primarily include cooking and space heating. Although biomass burning is a naturally occurring process, humans have harnessed fire for various purposes including cooking, space heating, and lighting.1,2 Domestic biofuel burning is different from biomass burning as the latter is defined to be the burning of forests, grasslands and agricultural wastes in fields, which may have human or natural origin.3 Domestic biofuels mainly consist of firewood, dungcake patties, agricultural residues and charcoal that are being burnt solely for non-commercial activities and in limited quantities. Burning agricultural residues for clearing fields after the harvesting period is not considered as domestic biofuel burning. Due to the increasing population, the exploitation of domestic biofuels is intensifying at an alarming rate to meet the basic energy requirements. Domestic biofuel burning is a substantial source of particulate matter emissions, along with trace gases and volatile organic compounds.4–8 These emissions from the burning of domestic biofuels have both direct and indirect effects on the ambient air quality and climate change.9–12 The emissions from biofuel burning include CO2, CH4, N2O, NO2, NO, SO2, carcinogenic organic compounds such as benzene and formaldehyde and other harmful compounds like particulate matter, CO and HNCO.13–19 The cumulative gaseous emissions due to such activities can largely impact the atmospheric chemistry on a global scale and have huge potential to influence the self-cleansing capacity of the troposphere.20–22 The emissions of nitrogen oxides along with non-methane volatile organic compounds (NMVOCs) from biofuel combustion may worsen local air quality by the formation of ground-level ozone and secondary organic aerosols.16,23 Hence, domestic biofuel burning plays a crucial role in the outdoor as well as indoor air quality and is one of the largest factors in the global burden of diseases.24NMVOCs are known to be emitted from various indoor sources such as cooking, wall paints, cleaning supplies, room fresheners, and body deodorants. The monitoring and measurement of NMVOCs also provide a better understanding of ground-level ozone formation.
Due to the easier availability and lower prices, there is a rapid increase in the consumption of domestic biofuels as a primary source of energy production, especially among the weaker economic groups in developing and third-world nations.2,25 Multiple studies have reported the amount of domestic biomass fuels being burnt for residential activities globally (Fig. 1). Low-income communities frequently depend on domestic biomass fuels due to financial constraints. Slum dwellers often lack access to clean cooking fuels, such as LPG, primarily because they lack the necessary residential documents required to obtain a valid LPG connection.26
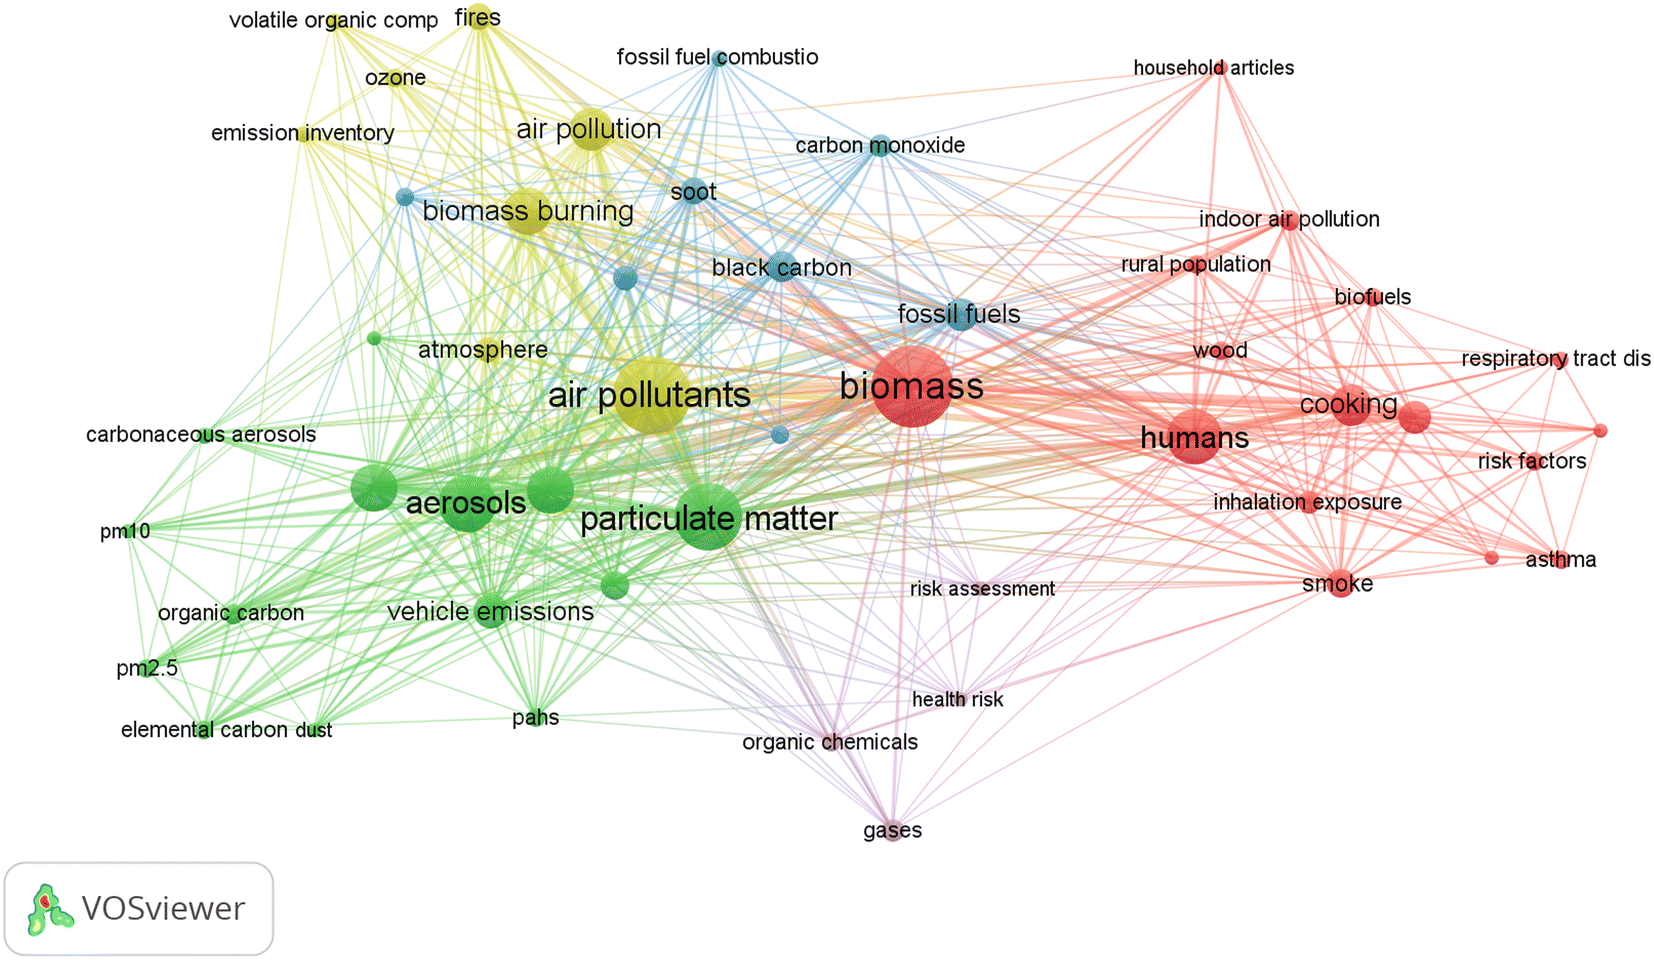 | ||
| Fig. 1 Visualisation of inter-related topics using VOSviewer network. | ||
According to the World Health Organization (WHO), over 90% of rural households in developing countries rely on solid fuels for residential use.27 It is estimated that approximately 3 billion people globally use biomass fuels for cooking, water heating, and indoor heating during the winter season.28 In India alone, the estimated amount of domestic biofuels being burnt was calculated to be 538 metric tonnes per year during 1996–97.29,30 India's domestic energy needs are heavily reliant on solid fuels, with an estimated 270 million tonnes of fuelwood accounting for approximately 40% of the country's total energy consumption from solid residential fuels.31 About 71% of the Indian households were reported to rely primarily on solid residential fuels for cooking during 2005–06.32 The burning of domestic biofuels for residential activities like cooking and indoor heating is common among the rural and slum dwellers. The consumption of domestic biofuels for residential activities in rural areas is significantly higher than in urban areas, with a threefold difference. Thus, it is important to check on the amount of domestic biofuels being burnt worldwide and the related pollutant emissions to understand their effects on the atmosphere along with their probable mitigation measures.
The heavy reliance on domestic biofuels for energy needs among India's rural populations and urban slum dwellers has raised growing concerns about the environmental and health impacts of their combustion. As the country's population continues to expand, the demand for affordable and accessible energy sources has intensified, leading to a rapid surge in the use of domestic biofuels. This trend is particularly prevalent among economically disadvantaged groups, where access to cleaner alternatives is often limited. To address this pressing issue, it is crucial to gain a comprehensive understanding of the combustion process, develop accurate quantification techniques, and assess the associated NMVOC emissions and their impact on surface ozone and peroxyacetyl nitrate (PAN) formation. Additionally, identifying the probable sources of these emissions through diagnostic ratios will provide valuable insights. By gathering this information, policymakers will be equipped with the necessary knowledge to take appropriate actions and encourage the adoption of cleaner energy fuels among India's rural and urban slum populations. This multifaceted approach, combining scientific research and policy interventions, holds the potential to mitigate the adverse effects of domestic biofuel combustion and promote sustainable energy solutions for all.
2. Methodology
2.1 Instrumental setup for laboratory-controlled chamber experiments
The dilution sampler for the combustion of domestic biofuels is designed in such a way that it accurately captures the emitted gases and particulate matter at the highest possible efficiency and provides natural conditions during the combustion. The dilution chamber also provides sufficient dilution, cooling and residence time to replicate the combustion conditions during the residential biofuel burning activities.33 A duct pipe (inner dia. 0.16 m) is connected to the sampler's hood, which is large enough to capture the emissions without any spillage and a draught fan (max. velo. 1.5 ms−1) adjusted at the other end of the duct, which acts as an exhaust for the smoke.33 The gas samples for NMVOC sampling are collected through the duct using an isokinetic probe at a height of ∼2.5 m. The samples can either be analysed using online measurement techniques6 or an offline sampling technique can also be deployed.34 For offline measurement of NMVOCs, the gas samples can be collected in a silonite-treated stainless steel cannister,24,35 silicon canister,36 glass canister,37 charcoal sorbent tube38 and Tedlar/Mylar bags.39 The canisters must be flushed with high-purity nitrogen gas for the removal of impurities and residues from previous sampling.40 The flow rate with which the NMVOC grab samples are collected should be maintained between 0.25 L min−1 to 1 L min−1 depending upon the volume of the canister/tube/bag used for the collection as per Method-0031.412.2 Processes of combustion
The combustion of domestic biofuels can be classified as flaming-dominated or smouldering-dominated combustion, which can be differentiated based on their combustion efficiency and modified combustion efficiency (MCE). The complete combustion cycle can be represented by a series of events that can be broadly divided into 3 distinct phases, which are (i) ignition, (ii) flaming and (iii) smoldering.42,432.3 Instruments for NMVOC analysis
Accurate quantification of such species requires specific methodologies and high-precision instruments for such measurements. Gas chromatography (GC) is a commonly used and efficient technique for the separation and quantification of NMVOC species within a gas sample.47 Apart from GCs, high performance liquid chromatography (HPLC) and proton transfer reaction-mass spectroscopy (PTR-MS) are also used for the analysis, identification and quantification of NMVOC species.48,493. Discussion
The gaseous emissions from the combustion of domestic biofuels include carbon monoxide (CO), carbon dioxide (CO2), methane (CH4), oxides of nitrogen (NOx), sulphur dioxide (SO2), volatile organic compounds (VOCs), halogenated hydrocarbons etc. Domestic biofuels are an essential and widely-used source of fuel for residential activities such as cooking and space heating for millions of economically weaker natives of the developing and third-world nations.58,59 Anthropogenic NMVOC emissions are quite prevalent in urbanised establishments where these NMVOCs play a vital role in the formation of ground-level ozone, PAN and other photochemical oxidants, which are associated with smog formation.603.1 NMVOC emissions from domestic biofuel combustion
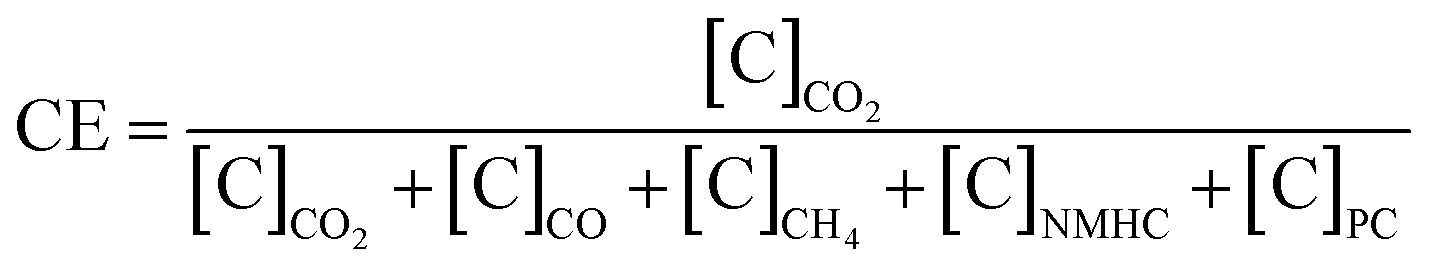
The sources of NMVOC emissions include both natural and anthropogenic activities. The NMVOC emissions from plants and trees naturally include isoprene, monoterpenes, α-pinenes, β-pinenes, etc., and are called biogenic VOCs61 while anthropogenic NMVOCs are emitted from the combustion of domestic biofuels and fossil fuels.62 Isoprene is the most abundant BVOC emitted from broad-leaved trees, which accounts for almost half of all the BVOCs emitted globally and has a higher ozone formation value (OFP) value due to higher reactivity.63 The NMVOC emissions from the combustion of biofuels mostly have carbon lengths varying from C1–C20.64 A large number of NMVOCs are emitted from the combustion of biomass fuels. Liu et al. (2008) reported significant emissions of NMVOC species like ethene, ethyne, ethane, propene, 1–3 butadiene, isoprene, BTEX and methyl chloride during the combustion of biomass fuels.65The emissions during the combustion are partially dependent on the naturally alternating combustion phases and the emissions. The combustion conditions can be determined using combustion efficiency (CE), which is expressed as the ratio of carbon (C) emitted as CO2 to the total amount of carbon emitted:
 | (1) |
 | (2) |
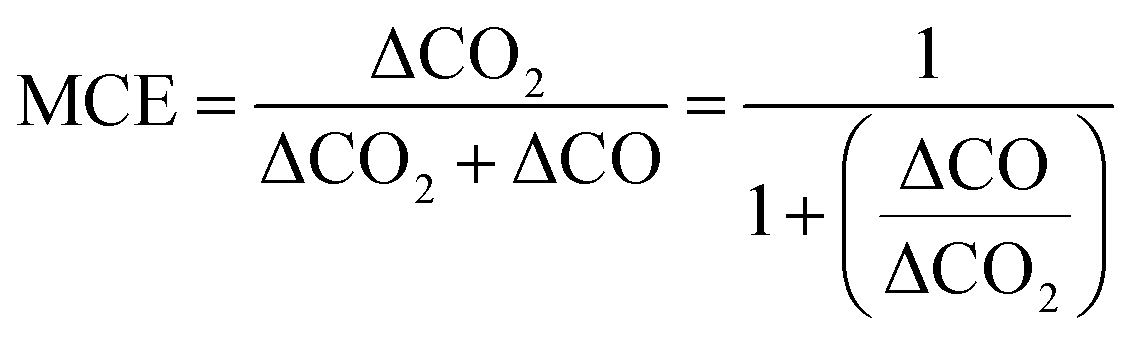
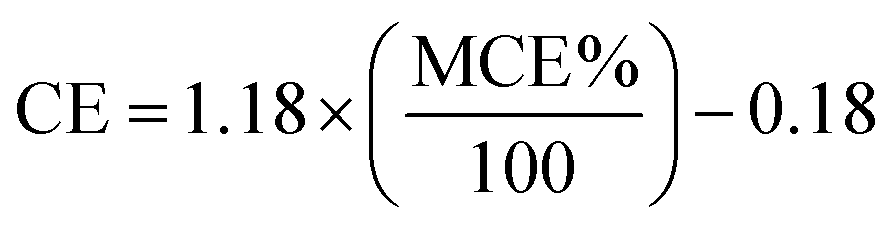
Values greater than 0.95 generally determine the predominance of the flaming phase, while MCE values less than 0.85 determine the predominance of the smoldering phase. The MCE values in the range 0.85–0.95 represent roughly equal amounts of the flaming and smoldering phases during the burn cycle.66,67 However, the difference in the values calculated for CE and MCE for any combustion is very trivial. An experimental empirical relation for CE and MCE can be derived using eqn (3).21
 | (3) |
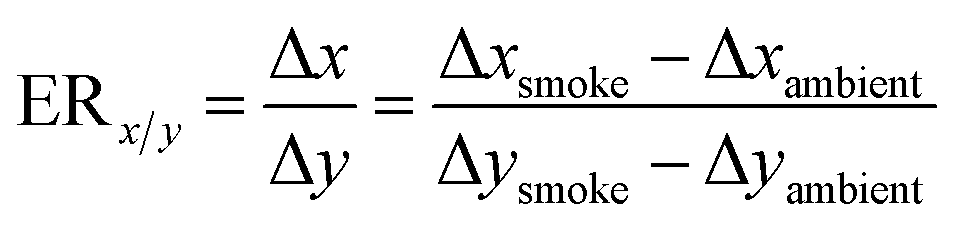
The information on the emission of a compound can be presented in two forms: emission ratios and emission factors. The emission ratios relate the emission of a particular species to the reference species like CO2 or CO. The emission factors relate the emission of any particular species to the amount of fuel burnt.13 The emission ratios (ER) can be calculated by dividing the concentration of compound ‘x’ emitted during the combustion process by the simultaneously measured concentration of the reference gas (CO2 or CO). While calculating, the ambient background concentration of the compound under consideration and the reference gas must be subtracted.68,69
 | (4) |
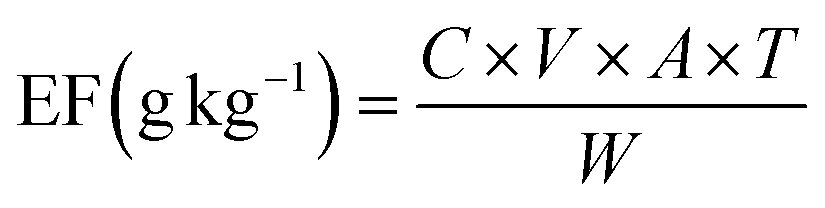
Another parameter often used for the characterization of the emission of compounds from the combustion process is the emission factor, which is defined by the amount of the compound (under consideration) released per unit of dry fuel consumed and is expressed in terms of g kg−1. The EFs of the NMVOCs for domestic fuel combustion can be determined based on flue gas volume and the mass concentration of pollutants.36
 | (5) |
The emission factors of NMVOC species from the combustion of fuelwood, dung cake, agriculture residues and mixed domestic biofuels reported in various studies are presented in Table 1. The elevated emission factors of the NMVOC species reported by Verma et al. (2019) might be due to the usage of kerosene for the initiation of the combustion process.38
| NMVOC compounds | Brushwood average (SD)35 | Fuelwood average (SD)38 | Fuelwood average6 | Hardwood average (SD)68 | Dung-chulha average (SD)35 | Dungcake average (SD)38 | Dungcake average6 | Dungcake average (SD)68 | Crop residue average (SD)38 | Crop residue average6 | Mixed fuel average (SD)35 | Mixed fuel average (SD)38 |
|---|---|---|---|---|---|---|---|---|---|---|---|---|
| Carbon dioxide (CO2) | 1242 (61) | 1578.3 (130.7) | nm | 1462 (16) | 984 (23) | 1532.5 (84.4) | nm | 1129 (80) | 1505.7 (134.4) | nm | 969 (31) | 1546.0 (237.9) |
| Carbon monoxide (CO) | 53 (30.1) | 132.36 (89.88) | nm | 77.2 (13.5) | 97.7 (9.5) | 196.20 (54.32) | nm | 80.9 (13.8) | 190.37 (86.45) | nm | 74.8 (16.0) | 264.81 (152.95) |
| Ethane (C2H6) | 0.38 (0.25) | nm | 0.192 | 0.16 (0.12) | 0.71 (0.19) | nm | 0.972 | 1.07 (0.30) | nm | 0.242 | 0.42 (0.09) | nm |
| Propane (C3H8) | 9.48 (8.41) × 10−2 | nm | 0.039 | 0.20 (0.14) | 0.21 (0.07) | nm | 0.374 | 0.45 (0.13) | nm | 0.057 | 0.11 (0.03) | nm |
| n-Butane (C4H10) | 1.57 (1.67) × 10−2 | nm | 0.009 | 1.11 (1.48) | 4.71 (1.88) × 10−2 | nm | 0.096 | 0.29 (0.09) | nm | 0.009 | 2.68 (0.88) × 10−2 | nm |
| iso-Butane (C4H10) | 4.6 (4.86) × 10−3 | nm | 0.004 | 0.40 (0.47) | 1.73 (0.71) × 10−2 | nm | 0.036 | 0.21 (0.12) | nm | 0.026 | 0.95 (0.27) × 10−2 | nm |
| n-Pentane (C5H12) | 4.44 (4.08) × 10−3 | nm | 0.002 | 2.18 (1.73) × 10−2 | 2.01 (0.98) × 10−2 | nm | 0.033 | 0.19 (0.25) | nm | 0.003 | 0.91 (0.37) × 10−2 | nm |
| n-Hexane (C6H14) | 1.96 (1.58) × 10−3 | nm | 0.0009 | 1.85 × 10⁻² | 1.03 (0.47) × 10−2 | nm | 0.023 | 0.29 (0.24) | nm | 0.001 | 0.53 (0.18) × 10−2 | nm |
| Ethene (C2H4) | 0.62 (0.28) | nm | 0.397 | 2.70 (1.17) | 1.86 (0.48) | nm | 1.365 | 4.23 (1.39) | nm | 0.445 | 1.13 (0.38) | nm |
| Propene (C3H6) | 2.28 (0.20) | nm | 0.114 | 0.57 (0.19) | 0.80 (0.23) | nm | 0.836 | 1.47 (0.58) | nm | 0.17 | 0.41 (0.09) | nm |
| 1-Butene (C4H8) | 6.32 (4.59) × 10−2 | nm | 0.022 | 0.72 (0.90) | 0.15 (0.04) | nm | 0.172 | 0.39 (0.33) | nm | 0.033 | 8.38 (1.83) × 10−2 | nm |
| Ethyne (C2H2) | 0.46 (0.16) | nm | 0.09 | 0.76 (0.36) | 1.13 (0.42) | nm | 0.094 | 0.59 (0.44) | nm | 0.055 | 0.89 (0.32) | nm |
| Benzene (C6H6) | 0.37 (0.14) | 2.92 (0.19) | 0.18 | 1.05 (0.19) | 1.03 (0.33) | 13.18 (2.03) | 0.565 | 1.96 (0.45) | 17.55 (5.63) | 0.258 | 0.72 (0.21) | 11.10 (5.95) |
| Toluene (C6H5CH3) | 0.22 (0.08) | 2.10 (0.20) | 0.05 | 0.24 (0.16) | 0.48 (0.27) | 1.19 (1.04) | 0.447 | 1.26 (0.05) | 0.86 (0.68) | 0.122 | 0.29 (0.07) | 0.84 (0.37) |
| Ethylbenzene (C8H10) | 1.25 (1.2) × 10−2 | 0.36 (0.05) | 0.007 | 4.19 (4.25) × 10−2 | 3.41 (0.79) × 10−2 | 0.16 (0.09) | 0.019 | 0.36 (0.08) | 0.31 (0.59) | 0.003 | 1.97 (0.40) × 10−2 | 0.15 (0.11) |
| o-Xylene (C8H10) | 0.83 (0.57) × 10−2 | 0.73 (0.14) | 0.007 | 3.93 (4.31) × 10−2 | 2.38 (0.76) × 10−2 | 0.18 (0.17) | 0.011 | 0.22 (0.08) | 0.11 (0.09) | 0.001 | 1.44 (0.41) × 10−2 | 0.20 (0.19) |
| Styrene (C8H8) | 2.28 (1.50) × 10−2 | nm | 0.037 | 8.71 (6.69) × 10−2 | 5.88 (1.58) × 10−2 | 0.14 (0.06) | 0.233 | 0.25 (0.09) | 0.61 (0.09) | 0.095 | 3.4 (1.9) × 10−2 | 0.13 (0.06) |
| Isoprene (C5H8) | 1.98 (1.48) × 10−2 | nm | 0.01 | 4.16 (2.23) × 10−2 | 8.94 (5.80) × 10−2 | nm | 0.168 | 0.32 (0.44) | nm | 0.014 | 3.03 (2.39) × 10−2 | nm |
| 1-Pentene (C5H10) | 9.65 (6.55) × 10−3 | nm | 0.003 | 1.43 (0.93) × 10−2 | 4.17 (1.59) × 10−2 | nm | 0.06 | 0.16 (0.08) | nm | 0.006 | 2.13 (0.60) × 10−2 | nm |
| 1-Hexene (C6H12) | 1.26 (0.73) × 10−2 | nm | 0.02 | nm | 6.10 (2.46) × 10−2 | nm | 0.168 | nm | nm | 0.063 | 3.09 (0.91) × 10−2 | nm |
| m,p-Xylene (C8H10) | 2.78 (1.56) × 10−2 | 0.98 (0.96) | 0.01 | 9.57 (7.99) × 10−2 | 6.36 (1.26) × 10−2 | 0.98 (0.74) | 0.081 | 0.60 (0.29) | 0.46 (0.44) | 0.027 | 4.03 (0.98) × 10−2 | 0.82 (0.66) |
| Acetaldehyde (C2H4O) | 0.33 (0.19) | nm | 0.57 | 0.54 (0.36) | 0.80 (0.27) | nm | 2.689 | 1.88 (1.63) | nm | 1.173 | 0.44 (0.11) | nm |
| Acetone (C3H6O) | 0.36 (0.22) | nm | 0.27 | 0.52 (0.25) | 0.70 (0.21) | nm | 1.237 | 1.63 (0.38) | nm | 0.724 | 0.41 (0.10) | nm |
| Butanal (C4H8O) | 1.9 (1.29) × 10−2 | nm | nm | 8.28 (6.27) × 10−3 | 4.28 (1.50) × 10−2 | nm | nm | 5.40 (2.19) × 10−2 | nm | nm | 2.68 (1.05) × 10−2 | nm |
| Methanol (CH3OH) | 2.03 (2.01) | nm | 1.78 | 1.92 (0.61) | 2.09 (1.14) | nm | 3.495 | 2.38 (0.90) | nm | 2.435 | 1.18 (0.40) | nm |
| Ethanol (CH5OH) | 2.18 (2.00) × 10−2 | nm | 0.005 | 0.12 (0.01) | 4.08 (5.93) × 10−2 | nm | 0.013 | 0.56 (0.58) | nm | 0.005 | 5.63 (6.69) × 10−2 | nm |
| Furan (C4H4O) | 5.98 (3.37) × 10−2 | nm | 0.17 | 0.24 (0.02) | 0.109 (0.041) | nm | 0.598 | 0.53 (0.20) | nm | 0.381 | 6.81 (2.19) × 10−2 | nm |
| α-Pinene (C10H16) | 5.38 (6.94) × 10−4 | nm | 1.9 × 10⁻⁵ | 2.02 (2.33) × 10−2 | 8.30 (5.40) × 10−4 | nm | 0.0028 | 0.348 (0.487) | nm | 3.9 × 10⁻⁵ | 7.82 (6.32) × 10−4 | nm |
| β-Pinene (C10H16) | 1.37 (0.91) × 10−3 | nm | nm | 4.67 × 10⁻² | 2.27 (1.49) × 10−3 | nm | 0.0008 | 0.471 | nm | nm | 2.76 (3.15) × 10−3 | nm |
| 1,2,4-Trimethylbenzene (C9H12) | 4.25 (2.69) × 10−3 | 0.04 (0.03) | nm | 1.74 (2.35) × 10−2 | 1.04 (0.46) × 10−2 | 0.09 (0.07) | nm | 3.91 (1.65) × 10−2 | 0.14 (0.13) | nm | 7.52 (4.28) × 10−3 | 0.26 (0.23) |
| Dichloromethane (CH2Cl2) | 2.18 (3.13) × 10−4 | 0.50 (0.46) | nm | nm | 4.46 (3.94) × 10−4 | 0.86 (0.79) | nm | nm | 1.94 (0.71) | nm | 4.04 (6.44) × 10−4 | 0.78 (0.70) |
| Dichloroethane (C2H4Cl2) | 2.55 (2.17) × 10−4 | 0.31 (0.22) | nm | 1.24 (0.3) × 10−4 | 8.80 (2.98) × 10−4 | 0.41 (0.21) | nm | 4.97 × 10⁻³ | 0.44 (0.13) | nm | 1.21 (2.32) × 10−3 | 0.35 (0.33) |
The emission factor of an NMVOC compound can also be calculated if the emission ratio is provided in the literature using eqn (6).13,21
 | (6) |
Stewart et al. (2021) have speciated 94% of the total measured NMVOCs emitted from the combustion of domestic biofuels by identifying over 200 NMVOC species.6 The NMVOC samples from the combustion of domestic biofuels collected in a canister can be limited due to the size of the canister and the flow rate with which the grab samples are collected. It can further cause hindrances in the overall calculation of total emissions representing the complete combustion phase. The sample collected during different phases of combustion can severely alter the total calculated amount of NMVOCs emitted from domestic biofuels.
3.2 Impact of NMVOCs on ground-level ozone (O3) and PAN formation
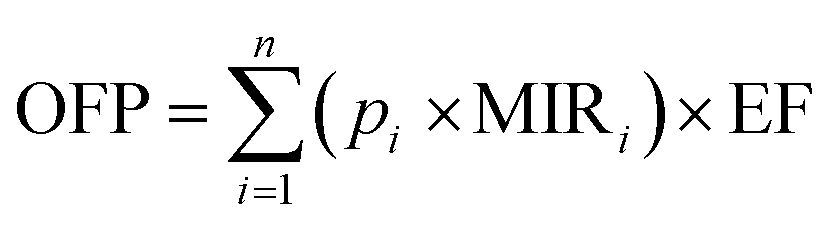
The NMVOCs play an important role in atmospheric chemistry as they are potent ozone precursors and have a significant role in the photochemical cycles taking place in the atmosphere.70 NMVOCs are important precursors of ground-level ozone as well as secondary organic aerosol and have the potential to create an impact as the NMVOCs react with the atmosphere at different rates and with different mechanisms; the concentration of different types of NMVOCs stances different challenges on the quality of ambient air.71,72The NMVOCs, upon reacting with NOx, are known to aid in the formation of ground-level ozone through oxidation initiated by the OH (hydroxyl) radical in the presence of sunlight. For the estimation of the ground-level ozone formation from the emitted NMVOC species, OFP (ozone-forming potential) is used.40,73,74 Wang et al. (2014) defined that the OFP (measured in g kg−1) is the product of the concentration of each NMVOCs and maximum incremental reactivity coefficient and is calculated using eqn (7).75
 | (7) |
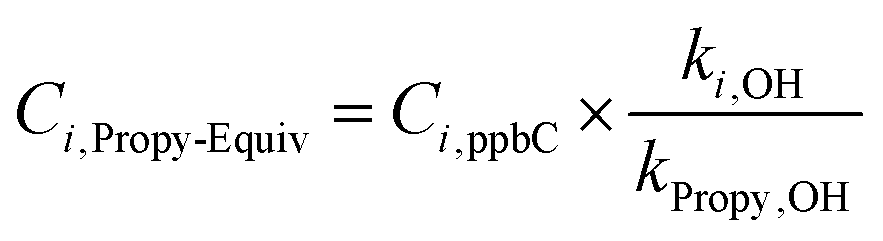
Another approach for understanding the effects of NMVOCs on ozone formation is to quantify the propylene-equivalent (Propy-Equiv) concentrations, which can be calculated using eqn (8).
 | (8) |
The photochemical ozone creating potential (POCP) values are commonly used to rank individual NMVOCs based on their ozone formation potential.81 The POCP values are relative and can be calculated using eqn (9).
 | (9) |
Derwent & Jenkin (1991) defined POCP as ozone concentration changes when the emission of a particular NMVOC species is neglected (set to zero) during a photochemical model calculation per unit emission of each NMVOC species on a mass basis, which can be expressed as eqn (10).82
 | (10) |
Ethylene (ethene) is an important precursor of ground-level ozone formation and has medium reactivity towards the hydroxyl (OH) radical. In an experiment conducted by Derwent & Jenkin (1991) by taking the POCP value for ethene as 100, the POCP values for different alkane species were observed to be between 30–50, excluding ethane, which showed much lower values.82 The alkene species lay within the range 64–106, decreasing up the homologous series. The POCP values of aromatic species lay within two ranges of 50–80 and 90–120, except for benzene, for which the POCP value was below 50. Average POCP values for various NMVOC species are taken from the literature and are presented in Fig. 2 and 3.82,83
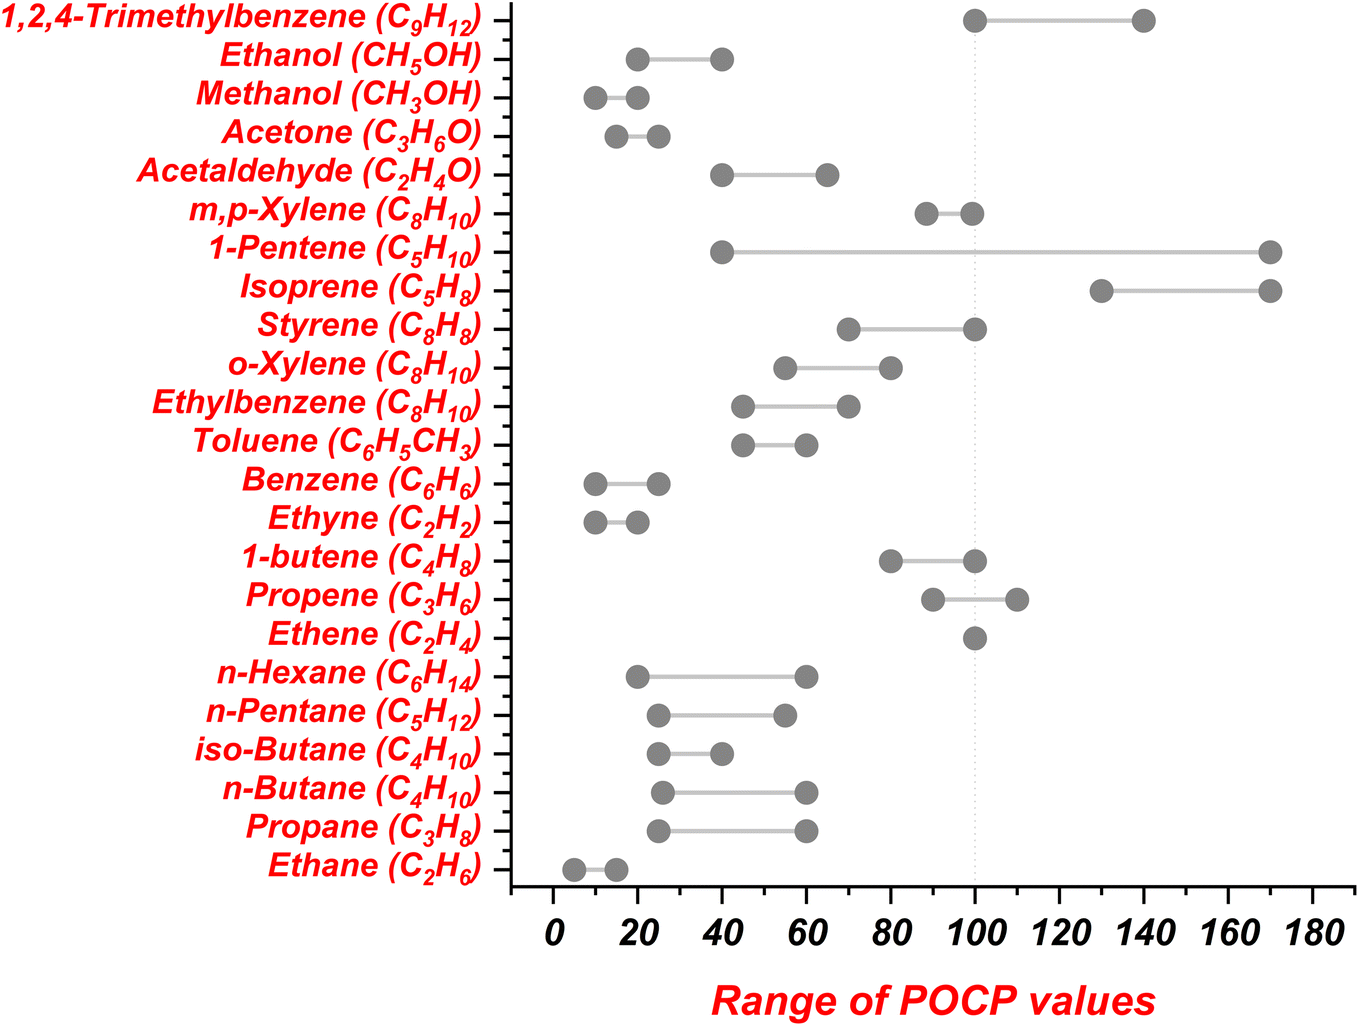 | ||
| Fig. 2 Reported range of POCP values for NMVOC species.82 | ||
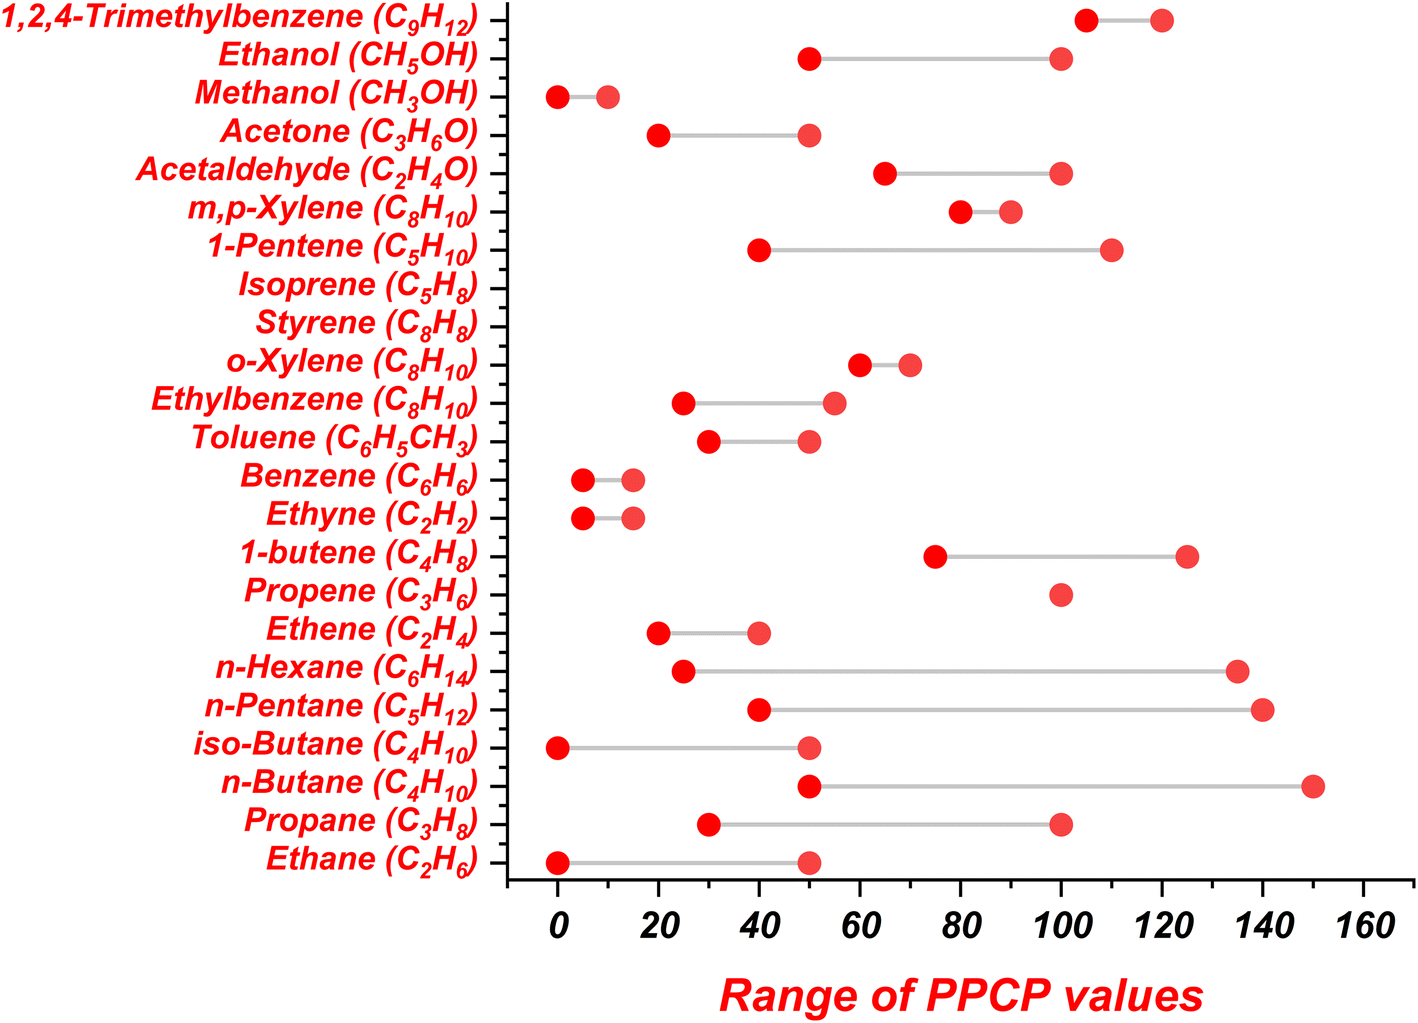 | ||
| Fig. 3 Reported range of PPCP values for NMVOC species.82 | ||
Pandey & Sahu (2014) estimated the ozone formation in the upper troposphere over India using the propylene-equivalent concentrations for the months of April–December 2008.79 The propylene equivalent concentration values were taken for certain NMVOC species like ethane, propane, butane, pentane, acetylene, iso-butane, iso-pentane and benzene. The emission of ethane (0.52 ± 0.05 ppbv) from the biomass burning was found to produce the maximum amount of tropospheric ozone, followed by acetylene (0.08 ppbv), propane (0.05 ppbv) and benzene (0.02 ppbv). Sharma et al. (2016) reported that the Indo-Gangetic plains (IGP) showed higher formation of ground-level ozone due to the emission of NMVOCs from the combustion of domestic biofuels.84 Jena et al. (2015) estimated that the concentration of surface-ozone levels due to biomass burning episodes was augmented by 25–50% (4–10 ppbv) in the north-eastern region of India and 10–25% (1–3 ppbv) in the central and southern parts of India during the year 2005.85 Another study by Kumar et al. (2010) reported the enhancement of surface-ozone formation by 34% (19 ppbv) due to severe biomass burning episodes (forest fires) reported in the central Himalayan region during 2007–2009.86
Peroxyacetyl nitrate (PAN) is primarily formed near the emission sources of NMVOCs and NOx, but it can also be formed from other sources.87 The formation of PAN is based on the atmospheric degradation of biogenic and anthropogenic NMVOCs like isoprene, acetaldehyde, acetone and other oxygenated-VOCs. PAN is relatively stable at low temperatures, which aids in the long-range transportation and formation of surface ozone in remote areas during decomposition.88
In their study, Sun et al. (2020) explained that the formation of PAN (CH3C(O)OONO2) from NMVOCs emitted from the combustion of domestic fuels can be calculated using PPCP (photochemical PAN creation potential) and evaluated using eqn (11).89
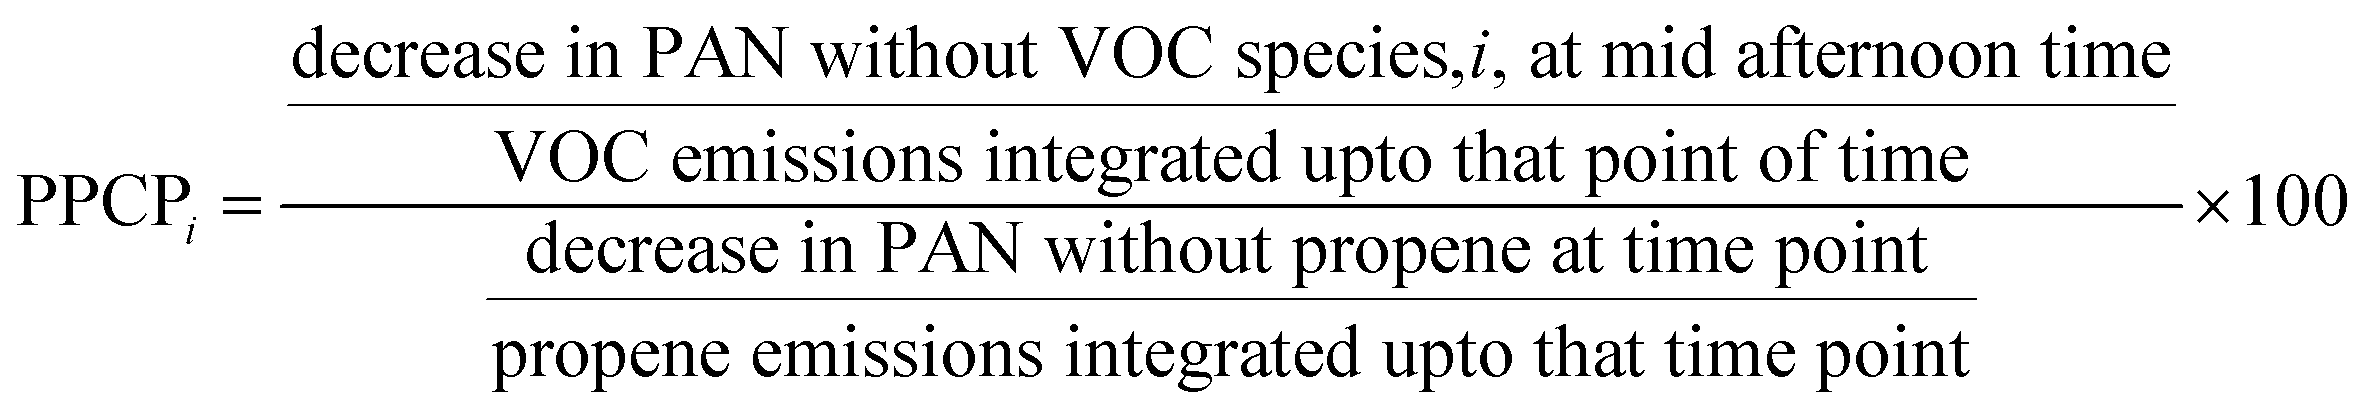 | (11) |
Similar to the calculation of POCP, the PPCP is calculated considering propylene (propene) instead of ethene, as it is an important precursor of PAN formation.90 The NMVOC species exhibit different abilities in the formation of PAN by the atmospheric oxidation process. PAN has a single precursor-free peroxyacetyl radical CH3CO(O2), which is derived as
| CH3CO + O2 + M = CH3CO(O2) + M | (12) |
| CH3COO2 + NO2 + M = PAN + M | (13) |
Derwent & Jenkin (1991) estimated that ethene and butene, along with acetylene, exhibit the lowest PPCP values, while the aromatic compounds with one CH3 group attached to the benzene ring show a PPCP value of ∼100.82 The values of PPCP for toluene and benzene are further reduced due to their low OH reactivity. Few of the alkane species, like ethane and n-butane, showed lower PPCP values (0–50), while the majority of alkane species displayed PPCP values greater than 50. The range of PPCP values for different NMVOC species are taken from Derwent & Jenkin (1991) and are documented in Fig. 2 and 3.82 The values of POCP (Fig. 2) and PPCP (Fig. 3) are primarily dependent on various factors like emission rates and emission factors, molecular weight, OH reactivity and chemical structure of the NMVOC species.81
3.3 Diagnostic ratio
Certain NMVOCs are valuable tracers that indicate their sources of origin and atmospheric transport processes.91 The diagnostic ratio is an easy and crucial tool for the identification of the emission sources of NMVOC compounds. The diagnostic ratio can help the policymakers identify the emission hotspot regions and plan an effective mitigation strategy to minimise emissions. The source profile and emission factor vary from region to region; therefore, a local source profile and diagnostic ratio improve confidence in the source identification.92 The diagnostic ratio is dependent on factors like the compound's atmospheric lifetime, photochemistry and reaction with OH radicals in the atmosphere. The unique tracers used for the identification of different emission sources are quite helpful for the evaluation of the source contributions, although there is a limitation on defining a tracer as each source emits a wide spectrum of NMVOC species. However, for the exploration of characteristics of NMVOC compositions from various emission sources, ratios of two NMVOC species can be used for the identification.65 Acetylene (ethyne), for example, is commonly used as a tracer for combustion, and the ratios of ethyne with several hydrocarbons are frequently used for the examination of the impact of other emission sources on combustion emissions.93,94 The ratios of propane, n-butane and isobutane with ethyne are used to indicate the contribution from LPG leakages.91 Ratio of pairs of NMVOC species like n-butane to iso-butane, toluene to benzene and ethylbenzene to m,p-xylene are found to be well correlated, and the ratios of these pairs significantly differ for various sources.65,95 The emission of isoprene is also found in vehicular exhaust, and thus, the ratio of 1,3-butadiene to isoprene can be used to distinguish between biogenic and anthropogenic emissions.65Biomass burning is known to emit large amounts of ethane, ethene, ethyne, propane, propene, isoprene, 1,3-butadiene, 1-butene, benzene, toluene, ethylbenzene, o-xylene and other organic compounds.96 These compounds have varying reaction potential values with OH radicals and different atmospheric lifetimes, due to which the ratio of two NMVOC species can be used for source identification and chemical evolution.97 The diagnostic ratios help in identifying the source of domestic biofuel burning, but the identification of such sources, depending on a single pair of NMVOCs may be misleading.96–98
Lower T/B ratios (toluene to benzene), usually less than 1, indicate emissions from biomass burning as well as coal combustions but the difference between the two is not found to be significant, which limits the exact estimation of the source of emissions.75 Geng et al. (2019), however, reported T/B ratio values greater than 9.7 for the combustion of wood and crop residue pellets used in biomass boilers. Diagnostic ratios for multiple pairs being reported in various studies are presented in Table 2.96
| Biomass burning | Diagnostic ratios | Reference | |||||||
|---|---|---|---|---|---|---|---|---|---|
| Toluene/benzene | Ethyne/ethane | Ethyne/propane | Ethane/propane | Benzene/propane | Benzene/xylenes | Benzene/styrene | Benzene/toluene | ||
| Biomass boiler wood pellet | 9.72 | 0.83 | 2.36 | 2.61 | 1.57 | — | — | — | 96 |
| Biomass boiler crop residue pellet | 10.46 | 0.57 | 4.27 | 6.28 | 2.41 | — | — | — | 96 |
| Residential biofuel and waste disposal | 0.33–0.34 | — | — | — | — | 0.25–0.28 | 0.18–0.22 | — | 99 |
| Biomass burning | — | — | — | — | — | — | — | 1.4–2.6 | 100 |
| Open hardwood cooking | 0.27 | — | — | — | — | 0.12 | 0.11 | — | 68 |
| 3 stone firewood | 0.11 | — | — | — | — | 0.1 | 0.09 | — | 101 |
| Biomass burning- rice straw | 1.47 | 0.3 | 1.08 | 3.65 | 0.83 | — | — | — | 91 |
| Biomass burning- sugarcane leaves | 1.16 | 0.21 | 0.8 | 3.77 | 0.3 | — | — | — | 91 |
| Residential stove- wheat | 0.28 | 3.82 | 6 | 1.57 | 3.57 | — | — | — | 65 |
| Residential stove- corn | 0.78 | 0.64 | 1.6 | 2.5 | 1.8 | — | — | — | 65 |
| Residential stove- wood | 0.53 | 1.33 | 4 | 3 | 2.13 | — | — | — | 65 |
| Biomass burning | 0.41 | — | — | — | — | — | — | — | 65 |
| Open fire dry grass | — | — | 8.3 | — | 1.6 | — | — | — | 102 |
| Wood burning | 0.05 | — | — | — | — | — | — | — | 103 |
| Charcoal burning | 0.5 | — | — | — | — | — | — | — | 103 |
| Biomass burning | 0.45 | — | — | — | — | — | — | — | 104 |
| Solid fuel combustion (wood) | — | — | — | — | — | — | — | 3.4 | 105 |
3.4 Source identification analysis with PCA
Principal component analysis (PCA) is a widely used technique that reduces the dimensionality of large datasets and increases the interpretability without any loss of information.106 PCA creates uncorrelated variables, effectively maximising the variance. PCA analysis with varimax rotation and Kaiser normalisation is performed using SPSS software, considering only those factors having the eigen value >1.107 Varimax rotation in PCA maximizes the variance of squared loadings within each factor while enhancing differences between factors, simplifying component interpretation by creating a clearer structure with distinct high and low loadings that facilitates variable-factor relationships.108 Kaiser normalization is a rescaling method applied after rotation to ensure the stability of solutions across samples. It involves rescaling the loadings back to their original size, giving equal weight to all items during rotation. In PCA, an eigenvalue exceeding 1 indicates that the associated principal component accounts for greater variance than a single original variable within the dataset.For the analysis and source identification of air pollutants, a study was conducted over the Indian capital territory of Delhi for the period between January 2018 and June 2021 (42 months), covering the 9 districts of Delhi for identifying the key sources of pollutants. The measured air pollutants, including NOx, NO, NO2, CO, surface ozone, benzene, toluene, ethylbenzene, xylene and m,p-xylene, were considered for the study. The air pollutant concentration data were acquired from the Central Pollution Control Board (CPCB) website (https://app.cpcbccr.com/ccr/).
To identify the sources of air pollutants, PCA was applied (Table 3).
| Parameters | Central Delhi | East Delhi | New Delhi | North-east Delhi | North-west Delhi | ||||||
|---|---|---|---|---|---|---|---|---|---|---|---|
| Factor 1 | Factor 2 | Factor 1 | Factor 2 | Factor 1 | Factor 2 | Factor 1 | Factor 2 | Factor 1 | Factor 2 | Factor 3 | |
| NOx | 0.96 | 0.12 | 0.90 | 0.00 | 0.92 | 0.17 | 0.93 | 0.22 | 0.88 | 0.35 | |
| NO | 0.88 | 0.22 | 0.92 | −0.02 | 0.92 | 0.15 | 0.92 | 0.15 | 0.87 | 0.36 | |
| NO2 | 0.87 | 0.86 | 0.20 | 0.83 | 0.25 | 0.81 | 0.11 | 0.16 | |||
| CO | 0.51 | 0.30 | 0.88 | 0.09 | 0.85 | 0.76 | 0.13 | 0.15 | 0.79 | ||
| Toluene | 0.16 | 0.76 | 0.63 | −0.20 | 0.78 | −0.34 | 0.73 | 0.17 | 0.77 | ||
| Xylene | 0.28 | 0.70 | 0.38 | 0.22 | 0.95 | 0.39 | 0.18 | ||||
| Benzene | 0.25 | 0.68 | 0.66 | 0.47 | 0.73 | −0.35 | 0.80 | 0.31 | 0.19 | 0.84 | 0.12 |
| Ozone | 0.26 | −0.40 | −0.22 | 0.86 | −0.12 | 0.82 | −0.29 | 0.21 | 0.88 | ||
| m,p-Xylene | 0.11 | 0.42 | 0.22 | 0.96 | 0.17 | 0.72 | |||||
| Ethyl benzene | 0.19 | 0.94 | 0.87 | ||||||||
| Eigen value | 2.94 | 1.85 | 4.05 | 1.22 | 3.58 | 1.11 | 4.37 | 3.00 | 3.77 | 1.56 | 1.45 |
| % variance | 36.76 | 23.11 | 50.61 | 15.25 | 51.18 | 15.83 | 43.74 | 30.02 | 37.67 | 15.62 | 14.53 |
| Cumulative% | 36.76 | 59.87 | 50.61 | 65.86 | 51.18 | 67.01 | 43.74 | 73.76 | 37.67 | 14.53 | 67.82 |
| Parameters | North Delhi | South-west Delhi | South Delhi | West Delhi | |||||||
|---|---|---|---|---|---|---|---|---|---|---|---|
| Factor 1 | Factor 2 | Factor 3 | Factor 4 | Factor 1 | Factor 2 | Factor 1 | Factor 2 | Factor 1 | Factor 2 | Factor 3 | |
| NOx | 0.25 | 0.95 | 0.85 | −0.15 | 0.85 | 0.40 | 0.91 | 0.13 | |||
| NO | 0.39 | 0.83 | −0.16 | 0.92 | −0.19 | 0.87 | 0.36 | 0.94 | −0.12 | ||
| NO2 | 0.92 | 0.17 | 0.85 | 0.71 | 0.45 | 0.82 | 0.18 | 0.19 | |||
| CO | 0.62 | −0.12 | −0.47 | 0.84 | −0.11 | 0.87 | 0.33 | 0.81 | 0.10 | ||
| Toluene | 0.90 | 0.16 | 0.14 | 0.77 | −0.22 | 0.81 | 0.23 | 0.73 | −0.49 | ||
| Xylene | 0.86 | 0.25 | 0.20 | 0.95 | |||||||
| Benzene | 0.92 | 0.19 | 0.13 | 0.69 | 0.18 | 0.84 | 0.29 | 0.84 | −0.22 | ||
| Ozone | 0.95 | 0.98 | −0.61 | 0.46 | 0.94 | ||||||
| MP-xylene | 0.23 | 0.97 | 0.84 | 0.28 | 0.80 | 0.81 | −0.19 | ||||
| Eth-benzene | 0.99 | 0.84 | 0.43 | 0.79 | 0.82 | 0.11 | −0.21 | ||||
| Eigen value | 3.05 | 2.57 | 2.01 | 1.17 | 5.48 | 1.11 | 4.73 | 2.21 | 5.60 | 1.25 | 1.04 |
| % variance | 30.53 | 25.65 | 20.09 | 11.68 | 60.88 | 12.29 | 52.54 | 24.54 | 55.99 | 12.45 | 10.43 |
| Cumulative% | 30.53 | 56.19 | 76.28 | 87.96 | 60.88 | 73.17 | 52.54 | 77.08 | 55.99 | 68.44 | 78.87 |
The central Delhi district showed high factor loading of NOx, NO, NO2 and CO with 36.78% of the variance for Factor 1, whereas Factor 2, with 23.11% of variance, has high factor loading (>0.6) of toluene, benzene and xylene. NOx, NO, NO2 and CO are related to vehicular activities and implicate higher emissions due to vehicular emissions.109 However, the NMVOC emissions comprising benzene, toluene and xylene indicate the dominance of pollutants from industrial and biomass burning activities.110 The eastern district of Delhi presented high factor loading of NO, NOx, CO, NO2, benzene and toluene with 50.61% variance contribution for Factor 1 and 15.25% variance for Factor 2 with a high factor loading of ozone. It is evident that the emissions of NO, NOx, CO, NO2, benzene and toluene may have contributed to the combustion of fossil fuels in vehicles, while the high factor loading of surface ozone can be linked to the transformation of NMVOCs from vehicular activities and biomass burning.107,110 Similar to the east Delhi district, Factor 1 of the New Delhi district also showed high factor loading of NOx, NO, CO, benzene and toluene with 51.18% variance contribution and 15.83% of Factor 2 with high loading of surface ozone.
In the north-eastern district of Delhi, Factor 1 had a high factor loading of NOx, NO, NO2, benzene, CO and toluene, explaining 43.73% of the variance, whereas Factor 2 had a higher factor loading of m,p-xylene, xylene and ethylbenzene with 30% of the variance. NOx, NO, NO2, benzene, CO and toluene in urban areas are linked to vehicular emissions from fossil fuel burning, while high factor loading of m,p-xylene, xylene and ethylbenzene are associated with industrial and residential sources.107,111 The north-west Delhi district showed high factor loading of NOx, NO, ethylbenzene, NO2 and toluene for Factor 1, explaining 37.67% variance and high factor loading of benzene for Factor 2, explaining 15.6% variance. Factor 3 had a high factor loading of CO and m,p-xylene, with 14.5% of the variance. Higher NOx emissions with CO and toluene are associated with vehicular emissions, while higher benzene factor loading indicates open biomass and residential biofuel combustion in nearby areas.
The north Delhi district showed high factor loading of toluene, xylene and benzene for Factor 1 with 30.53% variance. Factor 2 had a high factor loading of NOx, NO and NO2, explaining 25.65% of variance. Factor 3, with a high loading of m,p-xylene and ethylbenzene explains 20% of the variance, while Factor 4 shows a high loading of surface ozone. Emissions of toluene, xylene and benzene are associated with domestic biofuel burning and stubble burning, while emissions of NOx, NO and NO2 are associated with vehicular emissions. High factor loading of m,p-xylene and ethylbenzene are associated with industrial and residential sources. High factor loading of surface ozone emissions is linked with the transformation chemistry of NMVOCs from vehicular/biofuel burning activities. The south-west district of Delhi showed high factor loading of NO, NO2, NOx, CO, benzene, toluene, ethylbenzene and m,p-xylene for Factor 1, explaining 60.88% of the variance, associated with fossil fuel burning in vehicles or stubble burning.110 Factor 2 has a high loading of surface ozone linked with the emission of NMVOCs from vehicular and biomass burning activities.
The south Delhi district has high factor loading of NOx, NO and NO2, CO, benzene and toluene with 52.54% of variance for Factor 1 while high loading of ethylbenzene and m,p-xylene with 24.54% of variance for Factor 2. NOx, NO, NO2, CO, benzene and toluene are related to vehicular emissions, while ethylbenzene and m,p-xylene are associated with industrial and residential sources.112 West Delhi district showed high factor loading of NOx, NO, NO2, CO, toluene, benzene, m,p-xylene and ethylbenzene for Factor 1, explaining 55.99% of the variance while high factor loading of surface ozone for Factor 2, explaining 12.45% of the variance. NOx, NO, NO2, CO, toluene, benzene, m,p-xylene and ethylbenzene are linked with vehicular and stubble-burning emissions while surface ozone is associated with NMVOCs from vehicular and biomass burning activities.
4. Health impacts of indoor air pollution from domestic biofuel combustions
Domestic biofuel combustion leads to serious health implications, especially due to the lack of properly ventilated kitchen areas and cooking spaces. Table 4 underscores the diverse effects of indoor pollution resulting from household biofuel combustion, NMVOC emissions, and surface-ozone generation and how they collectively impact human health.| Indoor pollution and human health impacts | ||
|---|---|---|
| Sl. no. | Aspect | Impact |
| 1 | Household biofuel combustion | Respiratory issues and lung infections |
| Eye and throat irritation | ||
| Aggravation of pre-existing conditions like asthma | ||
| 2 | NMVOC emissions | Respiratory problems and allergies |
| Neurological effects | ||
| Carcinogenic risks in long-term exposure | ||
| Long-term exposure linked to cancer | ||
| Irritation of eyes, nose, and throat | ||
| 3 | Surface-ozone generation | Aggravation of respiratory problems |
| Worsening cardiovascular conditions | ||
| Impaired lung development in children | ||
| Increased frequency of asthma attacks | ||
| Premature mortality and decreased lung function | ||
Humans, on average, spend approximately 90% of their time indoors.113,114 The exposure to NMVOCs has significantly increased due to the extended time spent in indoor environments such as offices, gyms, and homes. Numerous studies have indicated that the concentration of NMVOCs is higher indoors than outdoors. NMVOCs are continuously emitted from household items, tobacco smoke, wall paints, cleaning agents, disinfectants, air fresheners, etc., and can accumulate in small, poorly ventilated spaces. The effect of NMVOCs on human health is determined by the duration of indoor stay and the type and intensity of regular activities. The chemical load of NMVOCs indoors is higher in winter than in summer. The health effects of NMVOCs are similar across all ages and genders, meaning children experience the same health issues as adults.
A study has shown that NMVOCs are not only associated with carcinogenic and respiratory diseases but also enhance metabolic risks and cause obesity and diabetes.115 The benzene-based volatile metabolites were found to exert both diabetes and obesity risks by exceeding the index values of non-alcoholic fatty liver disease. Various studies have investigated the environmental impacts of VOC emissions and carcinogenic risk (CR) associated with the inhalation of VOCs.
Monoaromatic compounds, like benzene, toluene, ethylbenzene and xylene (collectively termed as BTEX), are an important group released from domestic biomass fuel combustions. The BTEX is known to have a negative impact on the kidneys, heart, lungs, renal system and nervous system, causing cardiovascular disease, dyslipidemia and leukocytosis.116,117 Aromatic compounds like benzene are known human carcinogens. Carbonyls are considered hazardous to human health due to long-term exposure. Short-term health impacts from the inhalation of VOCs like aromatic compounds and carbonyls are dizziness, headaches, irritation of throat/skin/eyes etc. Long-term health implications include nasal tumours, asthma, leukaemia, nasopharyngeal cancer and reduced pulmonary function.118 Toluene, an aromatic VOC, is non-carcinogenic, but toluene derivatives are associated with obesity and diabetes.115
4.1 Health risk assessment
An estimate of the level of exposure to various substances is provided by exposure assessment. The carcinogenic potency of a compound and its average exposure to a target group is used for the calculation of cancer risk. Xiong et al. (2021) determined the chronic daily intake (CDI, mg kg−1 day−1) by multiplying NMVOC concentration (Cvoc, mg m−3), inhalation rate normalised to body weight (IR/BW in L per kg body weight-day), A is the unitless inhalation absorption factor, exposure frequency (EF in weeks per year) and 10−6 is a unit conversion coefficient converting micrograms to milligrams and litres to cubic metre.119 Mathematically,| CDI = Cvoc × {IR/BW} × A × EF × 10−6 | (14) |
After the assessment of CDI of various NMVOCs, the health risk associated can be determined by hazard quotient (HQ, unitless) and inhalation cancer risk (ICR, unitless). HQ and ICR present the chronic non-cancer and cancer-associated risks, respectively. HQ and ICR can be calculated as:
| HQ = Cvoc/REL | (15) |
| ICR = CDI × CPF × ASF × ED/AT × FAH | (16) |
| Volatile organic compounds | USEPA class | Chemical formulae | REL (μg m−3) | CPF (mg per kg day)−1 |
|---|---|---|---|---|
| a US Environmental Protection Agency carcinogen classifications: Group A- Human carcinogen; Group B2- Probable human carcinogen; Group D- Not classifia2ble as to human carcinogenicity (International Agency for Research on Cancer). | ||||
| Benzene | A | C6H6 | 3 | 0.1 |
| 1,3-Butadiene | B2 | C4H6 | 2 | 0.6 |
| Chloroform | B2 | CHCl3 | 300 | 0.019 |
| Ethylbenzene | D | C8H10 | 2000 | 0.0087 |
| Toluene | — | C7H8 | 300 | — |
| Styrene | — | C8H8 | 900 | — |
| Propylene | — | C3H6 | 3000 | — |
| m/o/p-Xylenes | — | C8H10 | 700 | — |
| n-Hexane | — | C6H14 | 7000 | — |
5. Policies for the reduction of NMVOC emissions from domestic biofuel burning
Solid residential fuel usage is prevalent in rural households due to its economic viability, aesthetic reasons and ease of access. To address the issue of on-field burning of crop residues, the Government of India (GoI) implemented stringent measures and collaborated with environmental scientists and educators to formulate proposals and forums. The GoI promoted sustainable management methods and introduced schemes to raise awareness about the harmful effects of emissions linked to biofuel combustion. To reduce NMVOC emissions from biofuel combustion, the government introduced policies benefiting citizens below the poverty line (BPL), providing free LPG connections and subsidized refills to improve their socio-economic status. Despite these efforts, it was observed that people continued to rely primarily on domestic biofuels due to affordability issues, limiting the adoption of LPG.Domestic biofuel usage is prominent in rural and slum areas due to its economic aspect and easier availability. Stringent measures have been regulated to curb the burning of crop residues on-field. Numerous proposals and forums were formulated by the Government of India (GoI) with the help of environmental scientists and educators. The GoI promoted the usage of alternative sustainable management methods and introduced multiple schemes to make people aware of the harmful consequences of linked emissions from biofuel combustion. To limit the NMVOC emissions associated with biofuel combustion, the government introduced multiple policies benefitting people below the poverty line (BPL), which aimed to provide free LPG connections and refill at subsidized rates for the improvement of the socio-economic status of economically underdeveloped citizens. However, it was later observed that people continued to rely primarily on domestic biofuels, and the usage of LPG was limited due to low affordability.
To reduce the associated NMVOC emissions from biofuel combustion, low pollutant emitting fuelwood species might be promoted for residential activities. Singh et al. (2014) conducted an experiment in which 32 fuelwood species were evaluated based on their emission qualities.120 Fuelwood properties like moisture, density, nitrogen, carbon, energy value, ash generated, silica content, NMVOC emissions and fuel value index were considered for defining less hazardous fuelwood species associated with lower emissions. 9 fuelwood species were identified, which showed minimum emissions of pollutants and can be grown even on degraded lands.120 These 9 species were Acacia auriculiformis, Acacia nilotica, Albizia lebbeck, Albizia chinensis, Embelica officinalis, Eucalyptus hybrid, Prosopis juliflora, Punica granatum and Terminalia chebula.
The agricultural production in India is immense, but there is a lack of management of generated agricultural wastes, which are underregulated compared to municipal solid wastes (MSW). This is largely due to the handling of agricultural wastes, which is undertaken by the respective owners with little involvement from the public sector. India, being an agrarian nation, generates large volumes of food products associated with huge agricultural by-products and wastes. Jain et al. (2014) estimated that India generated about 620.44 Mt per year of crop residue waste, of which Uttar Pradesh contributes to the majority of crop residue burned, followed by Punjab and Haryana.121 The farmers often use crop residues along with fuelwood for their residential activities like cooking and space heating in winter. The particulate matter emissions from crop burning were found to be 17 times more than the other sources (MSW burning, vehicular emissions and industrial emissions) combined.122 The Government of India has already implemented “waste to energy mission” by installing biogas plants to curb the crop residue burning, but it must be promoted comprehensively.
The Government of India also directed the National Thermal Power Plant (NTPC) to blend 10% of crop residue pellets with coal during power generation, which will benefit the farmers as well.123 This step will ensure farmers minimise their dependency on crop residue usage for residential activities. Instead, they will try to maximise their profits by selling off the crop residue pellets to the government. Processing biomass fuels in a pellet form can reduce the emissions of NMVOCs compared to the raw biomass material. A study found that pelletization reduced the VOCs emission potential of carbonized refuse-derived fuel by approximately 86% during storage compared to the ground raw material.124 Another study on wood pellets made from Norway spruce and Scots pine sawdust showed that the main VOCs produced due to oxidation of stored wood pellets were methanol, pentane, pentanal, and hexanal. Higher VOC concentrations but lower emission rates were found in softwood pellets compared to hardwood and blended pellets.125
6. Conclusion
This review is primarily focused on the combustion of domestic biofuels used for residential activities in the Indian subcontinent, along with associated NMVOC emissions and their emission factors, diagnostic ratios, ground-level ozone and PAN formation resulting from the emitted NMVOCs. The article discusses the combustion-dilution chamber design, which replicates the typical indoor emission conditions. This article also discusses the different species of NMVOCs emitted during various combustion phases like ignition, flaming and smoldering. The review further discusses the surface ozone and PAN formation from the NMVOCs emitted during the combustion cycle. The identification of potential sources of air pollutants using diagnostic ratios and PCA analysis is also described meticulously. The air pollutant loading for NOx, NO, NO2, CO and surface ozone, along with NMVOCs like benzene, toluene, o-xylene, m,p-xylene and ethylbenzene over Delhi from January 2018 to June 2021, were considered for the analysis. Various policies introduced by the government to mitigate the existing crisis of air pollutants and potential solutions for limiting the emissions of volatile organic compounds are also discussed in the present study.Data availability
This review is based on the existing research and literature. All data referenced in this article are derived from publicly available sources, which are cited throughout the text and listed in the references section. No new data were generated or analyzed in this study. The primary sources of data include: (1) Published journal articles. (2) Books and book chapters. (3) Conference proceedings. (4) Online databases and repositories. Readers seeking to access the data discussed in this review should refer to the original publications, which are duly cited in the references section. For any further information, the corresponding author can be contacted.Author contributions
AM carried out statistical analysis and led the manuscript preparation; PG contributed to manuscript completion, SM and PD provided overall guidance and contributed to shaping the manuscript into the final format.Conflicts of interest
The authors declare that they have no known competing financial interests or personal relationships that could have appeared to influence the work reported in this paper.Acknowledgements
The authors received no financial support for the research, authorship, and/or publication of this article.References
- R. Arya, S. Ahlawat, L. Yadav, M. Rani, A. Mondal and R. Jangirh, et al., Emission inventory of inorganic trace gases from solid residential fuels over the National Capital Territory of India, Environ. Sci. Pollut. Res., 2023, 31(3), 4012–4024 CrossRef PubMed.
- A. Mondal, R. Jangirh, R. Arya, L. Yadav, S. Ahlawat and P. Yadav, et al., Analysing solid residential fuel usage patterns in rural and urban slums of Delhi: Implications for pollution reduction and sustainable practices, Energy Sustainable Dev., 2024, 80, 101460 CrossRef.
- C. Venkataraman, G. Habib, D. Kadamba, M. Shrivastava, J. F. Leon and B. Crouzille, et al., Emissions from open biomass burning in India: Integrating the inventory approach with high-resolution Moderate Resolution Imaging Spectroradiometer (MODIS) active-fire and land cover data: ESTIMATES OF BIOMASS BURNING AND POLLUTANT, Global Biogeochem. Cycles, 2006, 20(2), GB2013 CrossRef.
- M. O. Andreae, Emission of trace gases and aerosols from biomass burning – an updated assessment, Atmos. Chem. Phys., 2019, 19(13), 8523–8546 CrossRef CAS.
- A. Mondal, S. K. Gupta, S. Yaduvanshi, M. Khan, S. Layek and V. K. Kudapa, et al., Impact and potential of carbon sequestration and utilization: fundamentals and recent developments, Int. J. Coal Prep. Util., 2024, 19, 1–26 CrossRef.
- G. J. Stewart, W. J. F. Acton, B. S. Nelson, A. R. Vaughan, J. R. Hopkins and R. Arya, et al., Emissions of non-methane volatile organic compounds from combustion of domestic fuels in Delhi, India, Atmos. Chem. Phys., 2021, 21(4), 2383–2406 CrossRef CAS.
- G. J. Stewart, B. S. Nelson, W. J. F. Acton, A. R. Vaughan, N. J. Farren and J. R. Hopkins, et al., Emissions of intermediate-volatility and semi-volatile organic compounds from domestic fuels used in Delhi, India, Atmos. Chem. Phys., 2021, 21(4), 2407–2426 CrossRef CAS.
- H. W. Wallace, N. P. Sanchez, J. H. Flynn, M. H. Erickson, B. L. Lefer and R. J. Griffin, Source apportionment of particulate matter and trace gases near a major refinery near the Houston Ship Channel, Atmos. Environ., 2018, 173, 16–29 CrossRef CAS.
- R. Arya, J. Rathore, A. K. Mishra and A. Mondal, Microplastics in the Atmosphere, In Remediation of Plastic and Microplastic Waste [Internet], CRC Press, Boca Raton, 1st edn, 2023, pp. , pp. 71–88, Available from: https://www.taylorfrancis.com/books/9781003449133/chapters/10.1201/9781003449133-5 Search PubMed.
- J. S. Gaffney and N. A. Marley, The impacts of combustion emissions on air quality and climate – From coal to biofuels and beyond, Atmos. Environ., 2009, 43(1), 23–36 CrossRef CAS.
- R. Jangirh, A. Mondal, P. Yadav, L. Yadav, A. Datta and P. Saxena, et al., Characterization of Road Dust in Delhi: Heavy Metal Analysis, Health Risks, and Sustainability Implications, Aerosol Sci. Eng., 2024 DOI:10.1007/s41810-024-00231-x.
- S. Mondal, P. Das, A. Mondal, S. Paul, J. K. Pandey and T. Das, Remediation of Plastic and Microplastic Waste [Internet]. First, Taylor and Francis, Norway, 2023, vol. 1, Available from: https://www.bokus.com/bok/9781032555591/remediation-of-plastic-and-microplastic-waste/ Search PubMed.
- M. O. Andreae and P. Merlet, Emission of trace gases and aerosols from biomass burning, Global Biogeochem. Cycles, 2001, 15(4), 955–966 CrossRef CAS.
- M. F. Demirbas and T. Demirbas, Hazardous Emissions from Combustion of Biomass, Energy Sources, Part A, 2009, 31(6), 527–534 CrossRef CAS.
- C. R. Estrellan and F. Iino, Toxic emissions from open burning, Chemosphere, 2010, 80(3), 193–207 CrossRef CAS PubMed.
- J. B. Gilman, B. M. Lerner, W. C. Kuster, P. D. Goldan, C. Warneke, P. R. Veres, et al., Biomass burning emissions and potential air quality impacts of volatile organic compounds and other trace gases from temperate fuels common in the United States [Internet], Gases/Laboratory Studies/Troposphere/Chemistry (chemical composition and reactions), 2015, https://acp.copernicus.org/preprints/15/21713/2015/acpd-15-21713-2015.pdf Search PubMed.
- J. M. Roberts, P. Veres, C. Warneke, J. A. Neuman, R. A. Washenfelder and S. S. Brown, et al., Measurement of HONO, HNCO, and other inorganic acids by negative-ion proton-transfer chemical-ionization mass spectrometry (NI-PT-CIMS): application to biomass burning emissions, Atmos. Meas. Tech., 2010, 3(4), 981–990 CrossRef CAS.
- J. M. Roberts, P. R. Veres, A. K. Cochran, C. Warneke, I. R. Burling and R. J. Yokelson, et al., Isocyanic acid in the atmosphere and its possible link to smoke-related health effects, Proc. Natl. Acad. Sci. U. S. A., 2011, 108(22), 8966–8971 CrossRef CAS PubMed.
- W. T. Sommers, R. A. Loehman and C. C. Hardy, Wildland fire emissions, carbon, and climate: Science overview and knowledge needs, For. Ecol. Manage., 2014, 317, 1–8 CrossRef.
- R. Atkinson, Atmospheric chemistry of VOCs and NOx, Atmos. Environ., 2000, 34(12–14), 2063–2101 CrossRef CAS.
- R. Koppmann, K. von Czapiewski and J. S. Reid, A review of biomass burning emissions, part I: gaseous emissions of carbon monoxide, methane, volatile organic compounds, and nitrogen containing compounds [Internet]. 2005, https://acp.copernicus.org/preprints/5/10455/2005/.
- J. Lelieveld, F. J. Dentener, W. Peters and M. C. Krol, On the role of hydroxyl radicals in the self-cleansing capacity of the troposphere, Atmos. Chem. Phys., 2004, 4(9/10), 2337–2344 CrossRef CAS.
- M. J. Alvarado, C. R. Lonsdale, R. J. Yokelson, S. K. Akagi, H. Coe and J. S. Craven, et al., Investigating the links between ozone and organic aerosol chemistry in a biomass burning plume from a prescribed fire in California chaparral, Atmos. Chem. Phys., 2015, 15(12), 6667–6688 CrossRef CAS.
- J. Sun, Z. Shen, L. Zhang, Y. Zhang, T. Zhang and Y. Lei, et al., Volatile organic compounds emissions from traditional and clean domestic heating appliances in Guanzhong Plain, China: Emission factors, source profiles, and effects on regional air quality, Environ. Int., 2019, 133, 105252 CrossRef CAS PubMed.
- C. F. Gould, S. Jha, S. Patnaik, S. Agrawal, A. T. Zhang and S. Saluja, et al., Variability in the household use of cooking fuels: The importance of dishes cooked, non-cooking end uses, and seasonality in understanding fuel stacking in rural and urban slum communities in six north Indian states, World Dev., 2022, 159, 106051 CrossRef.
- C. Dhingra, S. Gandhi, A. Chaurey and P. K. Agarwal, Access to clean energy services for the urban and peri-urban poor: a case-study of Delhi, India, Energy Sustainable Dev., 2008, 12(4), 49–55 CrossRef.
- K. Ravindra, M. Kaur-Sidhu, S. Mor and S. John, Trend in household energy consumption pattern in India: A case study on the influence of socio-cultural factors for the choice of clean fuel use, J. Cleaner Prod., 2019, 213, 1024–1034 CrossRef.
- R. Suresh, V. K. Singh, J. K. Malik, A. Datta and R. C. Pal, Evaluation of the performance of improved biomass cooking stoves with different solid biomass fuel types, Biomass Bioenergy, 2016, 95, 27–34 CrossRef CAS.
- M. S. Reddy and C. Venkataraman, Inventory of aerosol and sulphur dioxide emissions from India: I—Fossil fuel combustion, Atmos. Environ., 2002, 36(4), 677–697 CrossRef CAS.
- M. S. Reddy and C. Venkataraman, Inventory of aerosol and sulphur dioxide emissions from India. Part II—biomass combustion, Atmos. Environ., 2002, 36(4), 699–712 CrossRef CAS.
- P. Thomas, N. Soren, N. P. Rumjit, J. George James and M. P. Saravanakumar, Biomass resources and potential of anaerobic digestion in Indian scenario, Renewable Sustainable Energy Rev., 2017, 77, 718–730 CrossRef.
- C. Venkataraman, A. D. Sagar, G. Habib, N. Lam and K. R. Smith, The Indian National Initiative for Advanced Biomass Cookstoves: The benefits of clean combustion, Energy Sustainable Dev., 2010, 14(2), 63–72 CrossRef CAS.
- C. Venkataraman, Rao GUM. Emission Factors of Carbon Monoxide and Size-Resolved Aerosols from Biofuel Combustion, Environ. Sci. Technol., 2001, 35(10), 2100–2107 CrossRef CAS PubMed.
- A. Mondal, U. S. Saharan, R. Arya, L. Yadav, S. Ahlawat and R. Jangirh, et al., Non-methane volatile organic compounds emitted from domestic fuels in Delhi: Emission factors and total city-wide emissions, Atmos. Environ.: X, 2021, 11, 100127 CAS.
- L. T. Fleming, R. Weltman, A. Yadav, R. D. Edwards, N. K. Arora and A. Pillarisetti, et al., Emissions from village cookstoves in Haryana, India, and their potential impacts on air quality, Atmos. Chem. Phys., 2018, 18(20), 15169–15182 CrossRef CAS.
- D. Park, M. L. Barabad, G. Lee, S. B. Kwon, Y. Cho and D. Lee, et al., Emission Characteristics of Particulate Matter and Volatile Organic Compounds in Cow Dung Combustion, Environ. Sci. Technol., 2013, 47(22), 12952–12957 CrossRef CAS PubMed.
- S. Lal, L. K. Sahu, S. Venkataramani, T. A. Rajesh and K. S. Modh, Distributions of O3, CO and NMHCs over the rural sites in central India, J. Atmos. Chem., 2008, 61(1), 73–84 CrossRef CAS.
- M. Verma, S. Pervez, D. Majumdar, R. Chakrabarty and Y. F. Pervez, Emission estimation of aromatic and halogenated VOCs from household solid fuel burning practices, Int. J. Environ. Sci. Technol., 2019, 16(6), 2683–2692 CrossRef CAS.
- D. Bhattu, P. Zotter, J. Zhou, G. Stefenelli, F. Klein and A. Bertrand, et al., Effect of Stove Technology and Combustion Conditions on Gas and Particulate Emissions from Residential Biomass Combustion, Environ. Sci. Technol., 2019, 53(4), 2209–2219 CrossRef CAS PubMed.
- Y. Yan, L. Peng, R. Li, Y. Li, L. Li and H. Bai, Concentration, ozone formation potential and source analysis of volatile organic compounds (VOCs) in a thermal power station centralized area: A study in Shuozhou, China, Environ. Pollut., 2017, 223, 295–304 CrossRef CAS PubMed.
- USEPA, Sampling Method for Volatile Organic Compounds (SMVOC) [Internet], USEPA, 1996, https://www.epa.gov/sites/production/files/2015-12/documents/0031.pdf Search PubMed.
- T. Saud, T. K. Mandal, R. Gadi, D. P. Singh, S. K. Sharma and M. Saxena, et al., Emission estimates of particulate matter (PM) and trace gases (SO2, NO and NO2) from biomass fuels used in rural sector of Indo-Gangetic Plain, India, Atmos. Environ., 2011, 45(32), 5913–5923 CrossRef CAS.
- M. Zhang, A. Buekens and X. Li, Dioxins from Biomass Combustion: An Overview, Waste Biomass Valorization, 2017, 8(1), 1–20 CrossRef CAS.
- D. Möller, Chemistry of the Climate System: [Internet], DE GRUYTER, Berlin, Boston, 2014, http://www.degruyter.com/view/books/9783110331943/9783110331943/9783110331943.xml Search PubMed.
- B. R. T. Simoneit, Biomass burning — a review of organic tracers for smoke from incomplete combustion, Appl. Geochem., 2002, 17(3), 129–162 CrossRef CAS.
- M. Elsasser, C. Busch, J. Orasche, C. Schön, H. Hartmann and J. Schnelle-Kreis, et al., Dynamic Changes of the Aerosol Composition and Concentration during Different Burning Phases of Wood Combustion, Energy Fuels, 2013, 27(8), 4959–4968 CrossRef CAS.
- C. Meng and P. Janusz, Analysis of Environmental Air Samples by Solid-Phase Microextraction and Gas Chromatography/Ion Trap Mass Spectrometry, Environ. Sci. Technol., 1995, 29(3), 693–701 CrossRef PubMed.
- G. G. Pandit, P. K. Srivastava and A. M. Mohan Rao, Monitoring of indoor volatile organic compounds and polycyclic aromatic hydrocarbons arising from kerosene cooking fuel, Sci. Total Environ., 2001, 279(1–3), 159–165 CrossRef CAS PubMed.
- B. Yuan, A. R. Koss, C. Warneke, M. Coggon, K. Sekimoto and J. A. de Gouw, Proton-Transfer-Reaction Mass Spectrometry: Applications in Atmospheric Sciences, Chem. Rev., 2017, 117(21), 13187–13229 CrossRef CAS PubMed.
- J. Begerow, E. Jermann, T. Keles and L. Dunemann, Performance of two different types of passive samplers for the GC/ECD-FID determination of environmental VOC levels in air, Fresenius. J. Anal. Chem., 1999, 363(4), 399–403 CrossRef CAS.
- S. Król, B. Zabiegała and J. Namieśnik, Monitoring VOCs in atmospheric air II. Sample collection and preparation, TrAC, Trends Anal. Chem., 2010, 29(9), 1101–1112 CrossRef.
- M. de Blas, M. Navazo, L. Alonso, N. Durana and J. Iza, Automatic on-line monitoring of atmospheric volatile organic compounds: Gas chromatography–mass spectrometry and gas chromatography–flame ionization detection as complementary systems, Sci. Total Environ., 2011, 409(24), 5459–5469 CrossRef CAS PubMed.
- R. L. Seila, H. H. Main, J. L. Arriaga, V. G. Martınez and A. B. Ramadan, Atmospheric volatile organic compound measurements during the 1996 Paso del Norte Ozone Study, Sci. Total Environ., 2001, 276(1–3), 153–169 CrossRef CAS PubMed.
- C. Schlundt, S. Tegtmeier, S. T. Lennartz, A. Bracher, W. Cheah and K. Krüger, et al., Oxygenated volatile organic carbon in the western Pacific convective center: ocean cycling, air–sea gas exchange and atmospheric transport, Atmos. Chem. Phys., 2017, 17(17), 10837–10854 CrossRef CAS.
- L. K. Sahu and P. Saxena, High time and mass resolved PTR-TOF-MS measurements of VOCs at an urban site of India during winter: Role of anthropogenic, biomass burning, biogenic and photochemical sources, Atmos. Res., 2015, 164–165, 84–94 CrossRef CAS.
- K. Sekimoto and A. R. Koss, Modern mass spectrometry in atmospheric sciences: Measurement of volatile organic compounds in the troposphere using proton-transfer-reaction mass spectrometry, J. Mass Spectrom., 2021, 56(3), e4619 CrossRef CAS PubMed.
- C. N. Hewitt, S. Hayward and A. Tani, The application of proton transfer reaction-mass spectrometry (PTR-MS) to the monitoring and analysis of volatile organic compounds in the atmosphere, J. Environ. Monit., 2003, 5(1), 1–7 RSC.
- A. Mondal, R. Arya, L. Yadav, R. Jangirh, S. Ahlawat, P. Yadav, et al., BTEX Emissions from Biomass Burning over Delhi, 2019, http://rgdoi.net/10.13140/RG.2.2.23203.99369.
- I. C. Yadav and N. L. Devi, Biomass Burning, Regional Air Quality, and Climate Change, In Encyclopedia of Environmental Health [Internet], Elsevier, 2019, pp. , pp. 386–391, https://linkinghub.elsevier.com/retrieve/pii/B978012409548911022X Search PubMed.
- S. C. Lee, M. Y. Chiu, K. F. Ho, S. C. Zou and X. Wang, Volatile organic compounds (VOCs) in urban atmosphere of Hong Kong, Chemosphere, 2002, 48(3), 375–382 CrossRef CAS PubMed.
- F. Cataldo, O. Ursini, E. Lilla and G. Angelini, Ozonolysis of α-PINENE, β-PINENE, d- and l -Turpentine Oil Studied by Chirooptical Methods; Some Implications on the Atmospheric Chemistry of Biogenic Volatile Organic Compounds, Ozone: Sci. Eng., 2010, 32(4), 274–285 CrossRef CAS.
- T. Ohara, H. Akimoto, J. Kurokawa, N. Horii, K. Yamaji and X. Yan, et al., An Asian emission inventory of anthropogenic emission sources for the period 1980–2020, Atmos. Chem. Phys., 2007, 7(16), 4419–4444 CrossRef CAS.
- C. Song, B. Liu, Q. Dai, H. Li and H. Mao, Temperature dependence and source apportionment of volatile organic compounds (VOCs) at an urban site on the north China plain, Atmos. Environ., 2019, 207, 167–181 CrossRef CAS.
- B. Zielinska, J. C. Sagebiel, G. Harshfield, A. W. Gertler and W. R. Pierson, Volatile organic compounds up to C20 emitted from motor vehicles; measurement methods, Atmos. Environ., 1996, 30(12), 2269–2286 CrossRef CAS.
- Y. Liu, M. Shao, L. Fu, S. Lu, L. Zeng and D. Tang, Source profiles of volatile organic compounds (VOCs) measured in China: Part I, Atmos. Environ., 2008, 42(25), 6247–6260 CrossRef CAS.
- S. K. Akagi, R. J. Yokelson, C. Wiedinmyer, M. J. Alvarado, J. S. Reid and T. Karl, et al., Emission factors for open and domestic biomass burning for use in atmospheric models, Atmos. Chem. Phys., 2011, 11(9), 4039–4072 CrossRef CAS.
- I. T. Bertschi, R. J. Yokelson, D. E. Ward, T. J. Christian and W. M. Hao, Trace gas emissions from the production and use of domestic biofuels in Zambia measured by open-path Fourier transform infrared spectroscopy, J. Geophys. Res.: Atmos., 2003, 108(D13) DOI:10.1029/2002JD002158.
- C. E. Stockwell, T. J. Christian, J. D. Goetz, T. Jayarathne, P. V. Bhave and P. S. Praveen, et al., Nepal Ambient Monitoring and Source Testing Experiment (NAMaSTE): emissionsof trace gases and light-absorbing carbon from wood and dung cooking fires,garbage and crop residue burning, brick kilns, and other sources, Atmos. Chem. Phys., 2016, 16(17), 11043–11081 CrossRef CAS.
- J. Suthawaree, S. Kato, K. Okuzawa, Y. Kanaya, P. Pochanart and H. Akimoto, et al., Measurements of volatile organic compounds in the middle of Central East China during Mount Tai Experiment 2006 (MTX2006): observation of regional background and impact of biomass burning, Atmos. Chem. Phys., 2010, 10(3), 1269–1285 CrossRef CAS.
- W. R. Simpson, R. von Glasow, K. Riedel, P. Anderson, P. Ariya and J. Bottenheim, et al., Halogens and their role in polar boundary-layer ozone depletion, Atmos. Chem. Phys., 2007, 7(16), 4375–4418 CrossRef CAS.
- K. Wu, X. Yang, D. Chen, S. Gu, Y. Lu and Q. Jiang, et al., Estimation of biogenic VOC emissions and their corresponding impact on ozone and secondary organic aerosol formation in China, Atmos. Res., 2020, 231, 104656 CrossRef CAS.
- P. J. Ziemann and R. Atkinson, Kinetics, products, and mechanisms of secondary organic aerosol formation, Chem. Soc. Rev., 2012, 41(19), 6582 RSC.
- D. Dong, M. Shao, Y. Li, S. Lu, Y. Wang and Z. Ji, et al., Carbonyl emissions from heavy-duty diesel vehicle exhaust in China and the contribution to ozone formation potential, J. Environ. Sci., 2014, 26(1), 122–128 CrossRef CAS PubMed.
- Z. Mo, M. Shao, S. Lu, H. Niu, M. Zhou and J. Sun, Characterization of non-methane hydrocarbons and their sources in an industrialized coastal city, Yangtze River Delta, China, Sci. Total Environ., 2017, 593–594, 641–653 CrossRef CAS PubMed.
- H. Wang, S. Lou, C. Huang, L. Qiao, X. Tang and C. Chen, et al., Source Profiles of Volatile Organic Compounds from Biomass Burning in Yangtze River Delta, China, Aerosol Air Qual. Res., 2014, 14(3), 818–828 CrossRef CAS.
- M. C. Dodge, Combined effects of organic reactivity and NMHC/NOx ratio on photochemical oxidant formation—a modeling study, Atmos. Environ., 1967, 18(8), 1657–1665 CrossRef.
- W. P. L. Carter, Development of Ozone Reactivity Scales for Volatile Organic Compounds, Air Waste, 1994, 44(7), 881–899 CrossRef CAS.
- Ü. Rannik, N. Altimir, I. Mammarella, J. Bäck, J. Rinne and T. M. Ruuskanen, et al., Ozone deposition into a boreal forest over a decade of observations: evaluating deposition partitioning and driving variables, Atmos. Chem. Phys., 2012, 12(24), 12165–12182 CrossRef.
- K. Pandey and L. K. Sahu, Emissions of volatile organic compounds from biomass burning sources and their ozone formation potential over India, Curr. Sci., 2014, 106(9), 1270–1279 CAS.
- R. Atkinson and J. Arey, Atmospheric Degradation of Volatile Organic Compounds, Chem. Rev., 2003, 103(12), 4605–4638 CrossRef CAS PubMed.
- R. G. Derwent, M. E. Jenkin, N. R. Passant and M. J. Pilling, Photochemical ozone creation potentials (POCPs) for different emission sources of organic compounds under European conditions estimated with a Master Chemical Mechanism, Atmos. Environ., 2007, 41(12), 2570–2579 CrossRef CAS.
- R. G. Derwent and M. E. Jenkin, Hydrocarbons and the long-range transport of ozone and pan across Europe, Atmos. Environ., Part A, 1991, 25(8), 1661–1678 CrossRef.
- J. Altenstedt and K. Pleijel, POCP for individual VOC under European conditions [Internet], Institutet för Vatten- och Luftvårdsforskning, 1998, Available from: https://www.ivl.se/download/18.343dc99d14e8bb0f58b7368/1445515409320/B1305.pdf Search PubMed.
- S. Sharma, S. Chatani, R. Mahtta, A. Goel and A. Kumar, Sensitivity analysis of ground level ozone in India using WRF-CMAQ models, Atmos. Environ., 2016, 131, 29–40 CrossRef CAS.
- C. Jena, S. D. Ghude, G. G. Pfister, D. M. Chate, R. Kumar and G. Beig, et al., Influence of springtime biomass burning in South Asia on regional ozone (O 3): A model based case study, Atmos. Environ., 2015, 100, 37–47 CrossRef CAS.
- R. Kumar, M. Naja, S. Venkataramani and O. Wild, Variations in surface ozone at Nainital: A high-altitude site in the central Himalayas, J. Geophys. Res., 2010, 115(D16), D16302 CrossRef.
- J. Yuan, Z. Ling, Z. Wang, X. Lu, S. Fan and Z. He, et al., PAN–Precursor Relationship and Process Analysis of PAN Variations in the Pearl River Delta Region, Atmosphere, 2018, 9(10), 372 CrossRef CAS.
- E. V. Fischer, D. J. Jacob, R. M. Yantosca, M. P. Sulprizio, D. B. Millet and J. Mao, et al., Atmospheric peroxyacetyl nitrate (PAN): a global budget and source attribution, Atmos. Chem. Phys., 2014, 14(5), 2679–2698 CrossRef CAS PubMed.
- M. Sun, J. Cui, X. Zhao and J. Zhang, Impacts of precursors on peroxyacetyl nitrate (PAN) and relative formation of PAN to ozone in a southwestern megacity of China, Atmos. Environ., 2020, 231, 117542 CrossRef CAS.
- Y. Zhang, X. Wang, B. Barletta, I. J. Simpson, D. R. Blake and X. Fu, et al., Source attributions of hazardous aromatic hydrocarbons in urban, suburban and rural areas in the Pearl River Delta (PRD) region, J. Hazard. Mater., 2013, 250–251, 403–411 CrossRef CAS PubMed.
- Y. Zhang, M. Shao, Y. Lin, S. Luan, N. Mao and W. Chen, et al., Emission inventory of carbonaceous pollutants from biomass burning in the Pearl River Delta Region, China, Atmos. Environ., 2013, 76, 189–199 CrossRef CAS.
- L. Hui, X. Liu, Q. Tan, M. Feng, J. An and Y. Qu, et al., Characteristics, source apportionment and contribution of VOCs to ozone formation in Wuhan, Central China, Atmos. Environ., 2018, 192, 55–71 CrossRef CAS.
- B. Barletta, S. Meinardi, F. Sherwood Rowland, C. Y. Chan, X. Wang and S. Zou, et al., Volatile organic compounds in 43 Chinese cities, Atmos. Environ., 2005, 39(32), 5979–5990 CrossRef CAS.
- J. H. Tang, L. Y. Chan, C. Y. Chan, Y. S. Li, C. C. Chang and S. C. Liu, et al., Characteristics and diurnal variations of NMHCs at urban, suburban, and rural sites in the Pearl River Delta and a remote site in South China, Atmos. Environ., 2007, 41(38), 8620–8632 CrossRef CAS.
- M. I. Khoder, Ambient levels of volatile organic compounds in the atmosphere of Greater Cairo, Atmos. Environ., 2007, 41(3), 554–566 CrossRef CAS.
- C. Geng, W. Yang, X. Sun, X. Wang, Z. Bai and X. Zhang, Emission factors, ozone and secondary organic aerosol formation potential of volatile organic compounds emitted from industrial biomass boilers, J. Environ. Sci., 2019, 83, 64–72 CrossRef CAS PubMed.
- H. L. Wang, C. H. Chen, Q. Wang, C. Huang, L. Y. Su and H. Y. Huang, et al., Chemical loss of volatile organic compounds and its impact on the source analysis through a two-year continuous measurement, Atmos. Environ., 2013, 80, 488–498 CrossRef CAS.
- E. Galarneau, Source specificity and atmospheric processing of airborne PAHs: Implications for source apportionment, Atmos. Environ., 2008, 42(35), 8139–8149 CrossRef CAS.
- C. Sarkar, V. Sinha, B. Sinha, A. K. Panday, M. Rupakheti and M. G. Lawrence, Source apportionment of NMVOCs in the Kathmandu Valley during the SusKat-ABC international field campaign using positive matrix factorization, Atmos. Chem. Phys., 2017, 17(13), 8129–8156 CrossRef CAS.
- Y. Yan, C. Yang, L. Peng, R. Li and H. Bai, Emission characteristics of volatile organic compounds from coal-, coal gangue-, and biomass-fired power plants in China, Atmos. Environ., 2016, 143, 261–269 CrossRef CAS.
- C. E. Stockwell, P. R. Veres, J. Williams and R. J. Yokelson, Characterization of biomass burning emissions from cooking fires, peat, crop residue, and other fuels with high-resolution proton-transfer-reaction time-of-flight mass spectrometry, Atmos. Chem. Phys., 2015, 15(2), 845–865 CrossRef.
- T. Wang, H. Guo, D. R. Blake, Y. H. Kwok, I. J. Simpson and Y. S. Li, Measurements of Trace Gases in the Inflow of South China Sea Background Air and Outflow of Regional Pollution at Tai O, Southern China, J. Atmos. Chem., 2005, 52(3), 295–317 CrossRef CAS.
- S. M. Tsai, J. Zhang, K. R. Smith, Y. Ma, R. A. Rasmussen and M. A. K. Khalil, Characterization of Non-methane Hydrocarbons Emitted from Various Cookstoves Used in China, Environ. Sci. Technol., 2003, 37(13), 2869–2877 CrossRef CAS PubMed.
- A. Monod, B. C. Sive, P. Avino, T. Chen, D. R. Blake and R. F. Sherwood, Monoaromatic compounds in ambient air of various cities: a focus on correlations between the xylenes and ethylbenzene, Atmos. Environ., 2001, 35(1), 135–149 CrossRef CAS.
- L. Wang, J. G. Slowik, N. Tripathi, D. Bhattu, P. Rai and V. Kumar, et al., Source characterization of volatile organic compounds measured by proton-transfer-reaction time-of-flight mass spectrometers in Delhi, India, Atmos. Chem. Phys., 2020, 20(16), 9753–9770 CrossRef CAS.
- E. Manoli, D. Voutsa and C. Samara, Chemical characterization and source identification/apportionment of fine and coarse air particles in Thessaloniki, Greece, Atmos. Environ., 2002, 36(6), 949–961 CrossRef CAS.
- K. Ravindra, T. Singh, S. Mor, V. Singh, T. K. Mandal and M. S. Bhatti, et al., Real-time monitoring of air pollutants in seven cities of North India during crop residue burning and their relationship with meteorology and transboundary movement of air, Sci. Total Environ., 2019, 690, 717–729 CrossRef CAS PubMed.
- A. A. Mansor, S. Shamsul, S. Abdullah, N. C. Dom, N. N. L. M. Napi and A. N. Ahmed, et al., Identification of Indoor Air Quality (IAQ) Sources in Libraries through Principal Component Analysis (PCA), IOP Conf. Ser.: Mater. Sci. Eng., 2021, 1144(1), 012055 CAS.
- B. Buzcu and M. P. Fraser, Source identification and apportionment of volatile organic compounds in Houston, TX, Atmos. Environ., 2006, 40(13), 2385–2400 CrossRef CAS.
- S. Mor, S. Kumar, T. Singh, S. Dogra, V. Pandey and K. Ravindra, Impact of COVID-19 lockdown on air quality in Chandigarh, India: Understanding the emission sources during controlled anthropogenic activities, Chemosphere, 2021, 263, 127978 CrossRef CAS PubMed.
- E. Gallego, F. X. Roca, X. Guardino and M. G. Rosell, Indoor and outdoor BTX levels in Barcelona City metropolitan area and Catalan rural areas, J. Environ. Sci., 2008, 20(9), 1063–1069 CrossRef CAS PubMed.
- H. Guo, T. Wang, I. J. Simpson, D. R. Blake, X. M. Yu and Y. H. Kwok, et al., Source contributions to ambient VOCs and CO at a rural site in eastern China, Atmos. Environ., 2004, 38(27), 4551–4560 CrossRef CAS.
- T. A. Jacobson, J. S. Kler, M. T. Hernke, R. K. Braun, K. C. Meyer and W. E. Funk, Direct human health risks of increased atmospheric carbon dioxide, Nat. Sustain., 2019, 2(8), 691–701 CrossRef.
- V. V. Tran, D. Park and Y. C. Lee, Indoor Air Pollution, Related Human Diseases, and Recent Trends in the Control and Improvement of Indoor Air Quality, Int. J. Environ. Res. Public Health, 2020, 17(8), 2927 CrossRef PubMed.
- X. Zhou, X. Zhou, C. Wang and H. Zhou, Environmental and human health impacts of volatile organic compounds: A perspective review, Chemosphere, 2023, 313, 137489 CrossRef CAS PubMed.
- Y. He, H. Qiu, W. Wang, Y. Lin and K. F. Ho, Exposure to BTEX is associated with cardiovascular disease, dyslipidemia and leukocytosis in national US population, Sci. Total Environ., 2024, 919, 170639 CrossRef CAS PubMed.
- K. Niaz, H. Bahadar, F. Maqbool and M. Abdollahi, A review of environmental and occupational exposure to xylene and its health concerns, EXCLI J., 2015, 14, 1167–1186 Search PubMed.
- V. Soni, P. Singh, V. Shree and V. Goel, Effects of VOCs on Human Health, In Air Pollution and Control [Internet], ed. Sharma N., Agarwal A. K., Eastwood P., Gupta T. and Singh A. P., Singapore, Springer Singapore, 2018, pp. , pp. 119–142, (Energy, Environment, and Sustainability), Available from: http://link.springer.com/10.1007/978-981-10-7185-0_8 Search PubMed.
- Y. Xiong, J. Zhou, Z. Xing and K. Du, Cancer risk assessment for exposure to hazardous volatile organic compounds in Calgary, Canada, Chemosphere, 2021, 272, 129650 CrossRef CAS PubMed.
- K. Singh, N. N. Gautam, B. Singh, V. L. Goel and D. D. Patra, Screening of environmentally less-hazardous fuelwood species, Ecol. Eng., 2014, 64, 424–429 CrossRef.
- N. Jain, A. Bhatia and H. Pathak, Emission of Air Pollutants from Crop Residue Burning in India, Aerosol Air Qual. Res., 2014, 14(1), 422–430 CrossRef.
- S. K. Mittal, N. Singh, R. Agarwal, A. Awasthi and P. K. Gupta, Ambient air quality during wheat and rice crop stubble burning episodes in Patiala, Atmos. Environ., 2009, 43(2), 238–244 CrossRef CAS.
- S. Bhuvaneshwari, H. Hettiarachchi and J. Meegoda, Crop Residue Burning in India: Policy Challenges and Potential Solutions, Int. J. Environ. Res. Public Health, 2019, 16(5), 832 CrossRef CAS PubMed.
- A. Białowiec, M. Micuda, A. Szumny, J. Łyczko and J. Koziel, The Proof-of-the-Concept of Application of Pelletization for Mitigation of Volatile Organic Compounds Emissions from Carbonized Refuse-Derived Fuel, Materials, 2019, 12(10), 1692 CrossRef PubMed.
- L. Soto-Garcia, W. J. Ashley, S. Bregg, D. Walier, R. LeBouf and P. K. Hopke, et al., VOCs Emissions from Multiple Wood Pellet Types and Concentrations in Indoor Air, Energy Fuels, 2015, 29(10), 6485–6493 CrossRef CAS PubMed.
| This journal is © The Royal Society of Chemistry 2024 |