 Open Access Article
Emerging investigator series: carbon electrodes are effective for the detection and reduction of hexavalent chromium in water†
Callie M.
Stern
 ,
Darius W.
Hayes
,
Lebogang O.
Kgoadi
and
Noémie
Elgrishi
,
Darius W.
Hayes
,
Lebogang O.
Kgoadi
and
Noémie
Elgrishi
 *
*
Department of Chemistry, 232 Choppin Hall, Louisiana State University, Baton Rouge, LA 70803, USA. E-mail: noemie@lsu.edu
First published on 24th March 2020
Abstract
Electrochemical methods are an attractive option for the detection and reduction of toxic Cr(VI) to benign Cr(III) in drinking water. Here a method is reported for the reproducible detection and reduction of hexavalent chromium in water on glassy carbon electrodes, over a wide range of pH. This study allows for unmodified inexpensive carbon electrodes to join gold and gold modified electrodes as substrates for Cr(VI) removal from water.
Water impactCost and energy efficient methods are required to identify and eliminate Cr(VI) contaminations from drinking water. This manuscript demonstrates the effectiveness of inexpensive glassy carbon electrodes for the reliable electrochemical detection and reduction of Cr(VI) in water over a wide pH range. The method is not perturbed by uncontrolled ions or organic molecules present in authentic water samples. |
Introduction
Increased strain worldwide on drinking water supplies requires effective strategies for water purification as well as for detection and quantification of contaminants. In particular, oxyanions are a class of contaminants which continue to accumulate in water supplies. Oxyanion contaminations have multiple origins, including agricultural processes (e.g. sulfate, nitrate, and phosphate) and industrial processes (e.g. chromate, arsenate). Chromate contamination in particular is a major concern. Chromium is extensively used in industrial applications.1,2 In areas of high chromium use, Cr(VI) compounds can leach into the ground and contaminate water supplies. This is particularly true in regions with high tanning industry activities (e.g. in China, India, and Bangladesh) but also areas with other industrial uses for chromium, such as chrome plating. The most famous example of Cr(VI) environmental contamination in the United States is Hinkley, CA, with Cr(VI) ground levels still far exceeding 50 μg L−1.3 A recent evaluation of the EPA Unregulated Contaminant Monitoring Rule (UCMR) database highlighted the presence of up to 97 μg L Cr(VI) in drinking water in the United States, with Cr(VI) levels detected in all states.4In aqueous systems in the environment, chromium exists in the two main oxidation states Cr(III), and Cr(VI). Cr(III) is an essential dietary element that helps regulate glucose levels and fat metabolism5 while Cr(VI) is highly toxic and possesses high water solubility and mobility.1,2 The prevalence of Cr(VI) in drinking water is concerning as Cr(VI) is easily transported in cells through the sulfate intake pathway, causing adverse health effects.6–8
Current technological options for Cr(VI) decontamination are limited. Methods include reverse osmosis, evaporation, chemical precipitation, adsorption and filtration.9 These methods typically present shortcomings, including especially high energetic demands, large capital investment, and often limited selectivity.9 A common strategy underlying these methods is to first reduce Cr(VI) to Cr(III). Electrochemical methods are attractive for this process as they offer control over the energy of electrons involved. They also present the advantage of eliminating the need to introduce external reducing agents, which limits byproduct formation. The relatively high number of electrons (3e−) and protons (as many as 8H+) exchanged in this reduction are responsible for a very large activation barrier, rendering direct electroreduction energy intensive. Chromate electroreduction has been reported on a variety of electrodes, including gold and boron-doped diamond electrodes.10–12 The most complete mechanistic picture dates back to 2005 in the landmark paper by Compton and coworkers.10 Through extensive kinetic studies, they demonstrated that Cr(VI) undergoes an electrochemically reversible and chemically irreversible reduction on gold electrodes at pH 1. The authors reported that the much less expensive glassy carbon electrodes showed poor reproducibility at pH 1 and no significant reduction was observed at pH 4.2 or 13.10 Consequently, more costly electrode substrates were required for the detection and reduction of hexavalent chromium. Since this report, chromate detection and reduction has focused on complex methods requiring engineering of precious metal nano-particles and electrodes.2,13–17
We were intrigued by Compton's observations and sought to revisit and re-explore the behavior of chromate on carbon electrodes more in depth, over a wider range of conditions. Herein, a method is reported for the detection and reduction of Cr(VI) in water on inexpensive un-modified electrode substrate. The method allows glassy carbon electrodes to be efficient for the electrochemical detection and reduction of toxic Cr(VI) in water over a wide range of pH, and parameters governing the Cr(VI) reduction kinetics are identified. Enhanced mechanistic understanding would allow for the use of cheap screen-printed carbon electrodes instead of more expensive gold or boron-doped diamond electrodes.
Experimental
Reagents and water samples
Potassium chloride (BDH Chemicals, 99.0–100.5%) was purified through recrystallization from ethanol before use. Potassium chromate (Alfa Aesar, 99%), potassium dichromate (J. T. Baker, ACS grade), citric acid monohydrate (Acros, 99.5%), sodium dihydrogen citrate (Alfa Aesar, 99%), citric acid-disodium salt sesquihydrate (Alfa Aesar, 99%), citric acid-trisodium salt dihydrate (Acros, 99%), potassium hydroxide (BDH Chemicals, 85%), and hydrochloric acid (BDH Chemicals, 36.5–38%) were used without further purification.All solutions were prepared with ultrapure Milli-Q deionized water, with a resistivity of 18.2 MΩ cm at 25 °C, unless stated otherwise. The lake water sample was collected from University Lake at the Milford Wampold Memorial Park, Baton Rouge, LA and the river water sample was collected at the downtown Baton Rouge Levee. Both were collected in August 2019 and filtered before use.
Buffer and analyte preparation
All solutions were prepared freshly before each experiment. Citric acid buffers were prepared by mixing the acid and base in 5 mL of water in a scintillation vial. KCl was present to help control ionic strength in all solutions, unless otherwise noted. A Mettler Toledo InLab Ultra-Micro-ISM probe or a Mettler Toledo InLab Micro Pro-ISM probe were used for pH measurements. The probes were calibrated before use with a three-point test of 4.01, 7.00, and 10.01 pH buffers from Mettler Toledo, used as received. When slight pH adjustment of the as prepared buffers were necessary, concentrated solutions of HCl or KOH in Milli-Q water were used to reach the exact targeted pH.Optical methods
UV-vis absorbance spectra were obtained using either a benchtop Ocean Optics DH-2000-BAL UV-vis-NIR light source coupled with optic fibers to an Ocean FX spectrometer detector or an Agilent Cary 5000 UV-vis-NIR spectrophotometer. All spectra were collected in a 1 cm path length Spectrosil® quartz cuvette.Electrochemical methods
All cyclic voltammetry experiments were performed using a SP-300 or BP-300 BioLogic potentiostat. The cell was composed of a disposable 20 mL borosilicate glass scintillation vial capped with a custom-made Teflon cap machined to have openings for the three electrodes and PTFE tubing for sparging.18The reference electrodes used were AgCl/Ag 1 M KCl (CH Instruments) stored individually in 1 M KCl in Milli-Q water. The potential of the reference electrodes was periodically tested for drift by measuring the open circuit potential between two reference electrodes in 1 M KCl. Potential drift of no more than 1.5 mV was observed over the course of the study. The counter electrode was a platinum electrode (2 mm diameter, CH Instruments). The working electrodes were freshly polished glassy carbon 3 mm diameter electrodes (CH Instruments). Current densities reported are based on the geometric surface area of the electrodes. Electrodes were polished manually for 2 minutes with a slurry of 0.05 μm alumina powder (CH Instruments) in Milli-Q water on Microcloth polishing pads, then rinsed with Milli-Q water and sonicated for 20 seconds in Milli-Q water to remove any excess alumina powder and dried with N2. A total of 4 different working electrodes were used, and a median of four voltammograms were collected for each experimental condition. The capacitive current of each electrode was comparable but not identical. For this reason, background capacitive currents of the specific electrodes are subtracted, and faradic currents are reported in analyses to compare data collected across the different electrodes. The US Texas convention is used to report electrochemical data.18 Recrystallized 1 M KCl was used as the supporting electrolyte for all experiments. None of the buffer solutions showed any electrochemical activity in the potential window scanned prior to addition of the analyte. The scan rate was fixed at 0.1 V s−1 for all traces. All solutions were sparged with N2 for 10 minutes, after which the working electrodes were placed into the analyte solution for 30 seconds before the start of all scans. This allowed the solution to settle from convection after sparging and for the surface of the electrode to equilibrate with the solutions in a controlled fashion. With this protocol, data could be reliably collected and analyzed for mechanistic information, eliminating the previously reported intractable behavior which prevented studies of this kind.10
Results and discussion
Reactivity at glassy carbon electrodes in acidic solutions and speciation
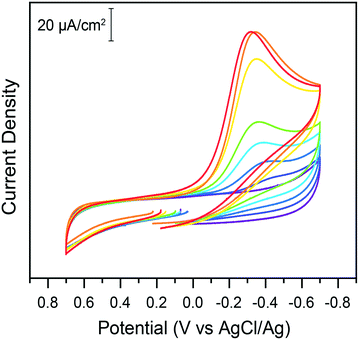
With the newly developed protocol described in the experimental section, electrochemical properties of chromate on glassy carbon electrodes were tested in water. In the absence of added acid, cyclic voltammograms of potassium chromate solutions on glassy carbon electrodes in 1 M KCl electrolyte exhibit no reduction peaks in the 0.7 to −0.7 V potential window probed (Fig. 1). While the thermodynamic reduction potential of Cr(VI) is reported as 1.35 V vs. NHE (for the HCrO4−/Cr3+ couple),6,19 the kinetic barriers involved in the transformation are so high that the reduction does not noticeably occur in these conditions. This highlights the challenge posed by energy efficient chromate reduction. Upon titration of sub-stoichiometric amounts of acids in the electrochemical cell, a reduction wave is observed, which shifts towards less reducing potentials as more acid is added (Fig. 1). The peak current increases with acid additions. In plots of the log of current as a function of the log of acid concentration, a linear fit is obtained (adj. R2 = 0.985) although a plateau current at higher acid concentrations is also a possibility (ESI† Fig. S1). Such a plateau would be hypothesized to be caused by a change in the rate limiting step of the reduction as proton availability increases. The peak potential shifts linearly to less negative values with the log of acid concentration (ESI† Fig. S2).This indicates acid dependent rate limiting chemical steps. The overall expected reaction is the reduction of Cr(VI) by three electrons to Cr(III). However, the exact nature of the chromium species in solutions warrants further discussion as the accompanying change in pH (ESI† Fig. S3) could also impact Cr(VI) speciation. Hexavalent chromium is known to undergo a pH dependent equilibrium between the chromate and dichromate forms in water following the reaction:
| 2CrO42− + 2H+ ⇄ Cr2O72− + H2O | (1) |
Given the sensitivity of this equilibrium to the total concentration of chromium species in solution, the nature of the Cr(VI) species in solution was probed, first through UV-vis experiments. Samples of 100 μM total chromium content were made at a controlled pH of 5. The UV-vis spectra obtained starting with 100 μM potassium chromate and 50 μM potassium dichromate in the conditions of the study were identical, with a maximal absorbance at 350 nm (ESI† Fig. S4). This confirmed that at the low concentrations of total chromium in the experiment, and relevant to water contaminations, Cr(VI) is not present as dichromate and therefore chromate should be the target of detection, reduction or remediation strategies in water. This observation is in accord with the proposed calculated Pourbaix diagram of chromium in water at low total chromium concentration (Fig. 2) and provides experimental confirmation of the absence of Cr2O72− as a predominant Cr(VI) species in conditions under investigation.20 The Pourbaix diagram also highlights a different influence of acid on speciation, namely the protonation of chromate following eqn (2), which leads to considering the equilibrium in eqn (3):
| CrO42− + H+ ⇄ HCrO4− | (2) |
| 2HCrO4− ⇄ Cr2O72− + H2O | (3) |
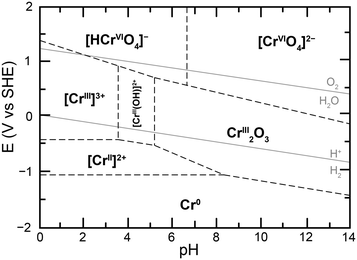 | ||
| Fig. 2 Proposed calculated Pourbaix diagram for chromium at 10−6 M total dissolved chromium and 25 °C, adapted from ref. 20. | ||
The speciation and reactivity are thus expected to be both concentration and pH dependent. Unfortunately, there are discrepancies in the thermodynamic parameters involved in these equations. The pKa of chromate is given from 5.9 to 6.5 depending on the source and conditions.1,10,21,22
Spectrophotometric titrations were carried out to observe the protonation of CrO42− by citric acid in water. Isosbestic points at 296, 339 and 444 nm suggest a clean conversion of CrO42− to HCrO4− (ESI† Fig. S5), with an estimated apparent pKa in the 6.45–6.51 range in these conditions.
Chromate reduction in buffered systems
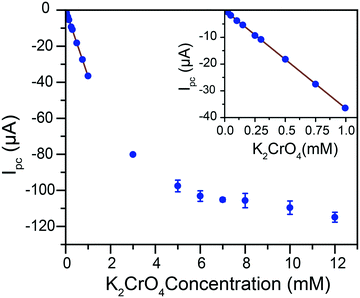
Given the pH dependence of chromate speciation, electrochemical results were obtained in solutions of controlled pH. A titration of chromate into an aqueous 0.1 M citric acid buffer at pH 4.75 was performed and the reduction response monitored by cyclic voltammetry (ESI† Fig. S6). The current response for Cr(VI) reduction follows two distinct regimes in these conditions (Fig. 3). At low Cr(VI) concentrations, a linear increase in current is observed with Cr(VI) concentration from 25 μM to 1 mM. The adjusted correlation coefficient for a linear fit going through the origin is R2 = 0.999, with a calibration curve slope of −36.6 (±9 × 10⁻²) μA mM−1. The linear relationship is lost as the total Cr(VI) concentration increases beyond ca. 1 mM. The peak potential during this titration initially remains constant (ESI† Fig. S7). However, as the concentration of Cr(VI) continues to increase a linear shift of the peak potential is observed towards positive potentials (ESI† Fig. S7). This peak shift, along with the break in the linear current–concentration relationship, are proposed to be caused by the formation of dichromate at higher concentrations following the equilibrium in eqn (3).Even at the highest concentrations tested, only a single reduction peak was observed in voltammograms, contrary to the behavior reported on gold and boron-doped diamond electrodes.10
This would indicate that the equilibrium is dynamic and established quickly: with an equilibrium established quickly, the system converts chromate to dichromate on the time scale of the experiment at high Cr(VI) concentrations. These results demonstrate that in our conditions the equilibrium is pushed in favor of dichromate in the millimolar concentration range but firmly in the chromate state in the sub-millimolar range, which is the range relevant to water purification and environmental detection of Cr(VI).
With the knowledge of the impact of acids and Cr(VI) concentrations on the speciation and reduction of Cr(VI), the effect of pH was methodically investigated. Citric acid buffers were chosen for this experiment, to take advantage of the wide five-pH unit span offered by the triprotic acid. The pH was varied from pH 2.25 to 7.25 in 0.25 increments and the impact on the electrochemical reduction of 200 μM of chromate was measured using cyclic voltammetry. Representative traces at select pH points are given in Fig. 4.
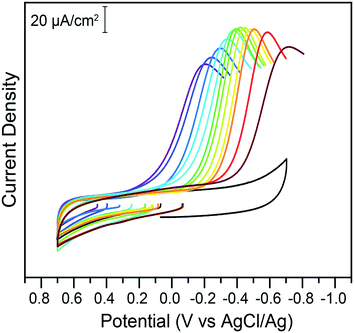 | ||
| Fig. 4 Cyclic voltammograms of 200 μM potassium chromate in 1 M KCl electrolyte in the absence (black) or presence of 0.1 M citric acid buffer at various pH values, on glassy carbon electrodes. All data was collected at 100 mV s−1. The pH of the buffer, from the purple to the brown trace, is 2.25, 2.5, 3.0, 3.25, 4.0, 4.5, 5.0, 5.25, 5.50, 6.0, 6.25, and 6.75. Return traces not shown for clarity. Full traces available in the ESI.† | ||
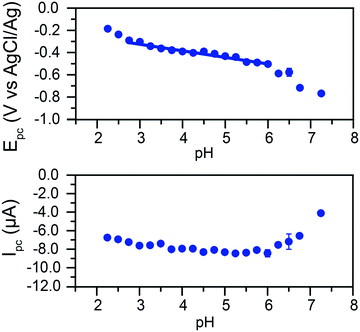
The peak currents and peak potentials for Cr(VI) electrochemical reduction were measured at each pH tested. Cathodic peak currents plotted as a function of pH are given in the bottom of Fig. 5. At low pH values, peak currents become more intense with increased pH. Peak currents do not noticeably change with the pH of the solution between pH 3.75 and 6. Upon further increases in pH, a decrease of the intensity of peak currents is observed.
This broad division of the reaction in three zones is similarly observed in the graph of peak potentials as a function of solution pH (Fig. 5, top). A wide zone of ca. 2.75 to 6 shows a linear relationship between the pH and the peak potential. This would indicate the reactions follow the same mechanism across a wide range of pH. The slope of the linear fit is 59.6 mV pH−1. This slope agrees with the theoretical value of 59 mV pH−1 for an equal transfer of protons and electrons.
This suggests that the reduction of Cr(VI) is gated by a slow proton-coupled electron transfer (PCET). The change in behavior at higher pH values coincides with the apparent pKa of the reaction in eqn (2) in these conditions, suggesting a transition from HCrO4− to CrO42− electroreduction.
By analogy with that which was proposed at pH 1 on gold electrodes,10 the data can be explained by the following mechanism: slow transfer of an electron and a proton in a PCET step to form a highly active Cr(V) intermediate (Scheme 1). The Cr(V) intermediate23 then quickly reacts following pathways which cannot be determined in the current conditions as they are past the rate determining step. These results allow the challenge of chromate detection and reduction to be reframed by focusing on methodologies to enhance the initial 1e−/1H+ reduction to improve overall efficiencies.
 | ||
| Scheme 1 Proposed rate limiting step in Cr(VI) reduction at the electrode at pH ca. 3 to 6. Adapted from ref. 10. | ||
These results suggest that the mechanism observed on glassy carbon electrodes is analogous to the behavior reported on gold, and further reinforces that glassy carbon electrodes are now a viable alternative for expensive gold electrodes for Cr(VI) detection and reduction in water. The large pH range in which peak currents show little variation is valuable for detection purposes, as slight pH variations in a sample would have minimum impact on the determination of Cr(VI) concentrations using cyclic voltammetry (Fig. 3 and 5).
Application to Cr(VI) detection in water samples
The potential of cheap glassy carbon electrodes for Cr(VI) detection and reduction in controlled water solutions was demonstrated. Water supplies typically present enhanced complexity, however, and the potential impact of unknown trace compounds in water samples was investigated next. Samples were collected from four different water sources to compare with the previously gathered data with highly controlled Milli-Q water. The different water sources were deionized water, tap water, University Lake water from Louisiana State University's campus, and the Mississippi River at the downtown Baton Rouge levee. Cr(VI) concentration in these water samples were not expected to be significant,4 which provided a varied ions and impurity canvas to test the robustness of the detection and reduction method. Precisely 200 μM of K2CrO4 were added to each water sample. Prior to the measurements, solids were dissolved in the samples: sodium dihydrogen citrate and citric acid-disodium salt sesquihydrate to obtain a 0.1 M buffer at a target pH of 4.75 as well as KCl for a 1 M electrolyte. The target pH was chosen to mitigate the impact on current of possible slight pH variations across water sources. Each sample was tested through cyclic voltammetry and the current response measured for Cr(VI) reduction was used to determine the concentration of Cr(VI) using the calibration curve in Fig. 3.The results in Table 1 demonstrate that the method is robust for Cr(VI) detection even in the presence of uncontrolled ions or other molecules which may be present in the different water samples. This exemplifies the effectiveness of glassy carbon electrodes for the detection of Cr(VI) in water at mild pH values. While not the focus of this study, one would anticipate lower detection limit could be obtained through standard electroanalytical methods, e.g. pulsed techniques.
Conclusions
This work demonstrates the untapped opportunity offered by inexpensive electrode substrates for the detection and reduction of Cr(VI) in water. The method developed does not rely on noble metal electrodes and paves the way for the development of robust electrochemical methods for the detection and reduction of Cr(VI) in water. A flow system could be envisioned to decontaminate water sources from hexavalent chromium. The use of the triprotic citric acid as the buffer allowed Cr(VI) reduction to be studied across the large span of 5 pH units while minimizing the impact of changing the nature of the acid/base couples present.Conflicts of interest
There are no conflicts to declare.Acknowledgements
This work was supported by the Louisiana Board of Regents Research Competitiveness Subprogram under contract number LEQSF(2019-22)-RD-A-05 as well as startup funds from the Department of Chemistry and the College of Science at Louisiana State University, in part through the Office of Research & Economic Development and the Workforce and Innovation for a Stronger Economy (WISE)/Act 803 fund for equipment. CMS is thankful for support from the Louisiana Board of Regents for a Graduate Fellowship under the award number LEQSF(2014-19)-GF-02 as well as the Jerry D. Dumas Sr. and Nancy L. Dumas Superior Graduate Scholarship. LOK and DWH acknowledge support from LSU work study program.Notes and references
- D. Mohan and C. U. Pittman Jr., J. Hazard. Mater., 2006, 137, 762–811 CrossRef CAS PubMed
.
- D. Mohan, K. P. Singh and V. K. Singh, Ind. Eng. Chem. Res., 2005, 44, 1027–1042 CrossRef CAS
.
- J. A. Izbicki, T. D. Bullen, P. Martin and B. Schroth, Appl. Geochem., 2012, 27, 841–853 CrossRef CAS
.
- M. Chebeir, G. Chen and H. Liu, Environ. Sci.: Water Res. Technol., 2016, 2, 906–914 RSC
.
- C. M. Davis and J. B. Vincent, JBIC, J. Biol. Inorg. Chem., 1997, 2, 675–679 CrossRef CAS
.
- W. Jin, H. Du, S. Zheng and Y. Zhang, Electrochim. Acta, 2016, 191, 1044–1055 CrossRef CAS
.
- J. Alexander and J. Aaseth, Analyst, 1995, 120, 931 RSC
.
- K. Salnikow and A. Zhitkovich, Chem. Res. Toxicol., 2008, 21, 28–44 Search PubMed
.
- S. Kalidhasan, A. Santhana Krishna Kumar, V. Rajesh and N. Rajesh, Coord. Chem. Rev., 2016, 317, 157–166 CrossRef CAS
.
- C. M. Welch, O. Nekrassova and R. G. Compton, Talanta, 2005, 65, 74–80 CAS
.
- L. D. Burke and P. F. Nugent, Electrochim. Acta, 1997, 42, 399–411 CrossRef CAS
.
- S. B. Faldini, S. M. L. Agostinho and H. C. Chagas, J. Electroanal. Chem. Interfacial Electrochem., 1990, 284, 173–183 CrossRef CAS
.
- A. J. Chaudhary, N. C. Goswami and S. M. Grimes, J. Chem. Technol. Biotechnol., 2003, 883, 877–883 CrossRef
.
- S. Li, Z. Hu, S. Xie, H. Liu and J. Liu, Int. J. Electrochem. Sci., 2018, 13, 655–663 CrossRef
.
- Q. Ji, D. Yu, G. Zhang, H. Lan, H. Liu and J. Qu, Environ. Sci. Technol., 2015, 49, 13534–13541 CrossRef CAS PubMed
.
- Y. Huang, H. Ma, S. Wang, M. Shen, R. Guo, X. Cao, M. Zhu and X. Shi, ACS Appl. Mater. Interfaces, 2012, 4, 3054–3061 CrossRef CAS PubMed
.
- C. Dong, G. Wu, Z. Wang, W. Ren, Y. Zhang, Z. Shen, T. Li and A. Wu, Dalton Trans., 2016, 45, 8347–8354 RSC
.
- N. Elgrishi, K. J. Rountree, B. D. McCarthy, E. S. Rountree, T. T. Eisenhart and J. L. Dempsey, J. Chem. Educ., 2018, 95, 197–206 CrossRef CAS
.
- A. D. Bokare and W. Choi, Environ. Sci. Technol., 2011, 45, 9332–9338 CrossRef CAS PubMed
.
- B. Beverskog and I. Puigdomenech, Corros. Sci., 1997, 39, 43–57 CrossRef CAS
.
- G. P. Gallios and M. Vaclavikova, Environ. Chem. Lett., 2008, 6, 235–240 CrossRef CAS
.
- F. Brito, J. Ascanio, S. Mateo, C. Hernández, L. Araujo, P. Gili, P. Martín-Zarza, S. Domínguez and A. Mederos, Polyhedron, 1997, 16, 3835–3846 CrossRef CAS
.
- I. J. Buerge and S. J. Hug, Environ. Sci. Technol., 1997, 31, 1426–1432 CrossRef CAS
.
Footnote |
| † Electronic supplementary information (ESI) available: Cyclic voltammograms and UV-visible spectra as referenced in the text. See DOI: 10.1039/d0ew00146e |
| This journal is © The Royal Society of Chemistry 2020 |

