 Open Access Article
Perylene diimide functionalized nano-silica: green emissive material for selective probing and remediation of 4-nitrocatechol, Ru3+, and Cu2+ with biosensing applications†
Sanjay
Yadav
*ac,
Nishu
Choudhary
ac,
Avinash T.
Vasave
ac,
Vasavdutta
Sonpal
bc and
Alok Ranjan
Paital
 *ac
*ac
aSalt and Marine Chemicals Division, CSIR-Central Salt & Marine Chemicals Research Institute, G.B. Marg, Bhavnagar-364002, Gujarat, India. E-mail: arpaital@csmcri.res.in; sychem00700@gmail.com
bAnalytical and Environmental Science Division & Centralized Instrument Facility, CSIR-Central Salt & Marine Chemicals Research Institute, Bhavnagar 364 002, Gujarat, India
cAcademy of Scientific and Innovative Research (AcSIR), Ghaziabad-201002, India
First published on 21st October 2024
Abstract
Hybrid materials having dual applications in environmental monitoring and remediation are vital for mitigating pollution and economic benefits. In this regard, mesoporous silica is extensively studied compared to nano-silica materials due to challenges in controlling particle size morphology, and aggregation. In this work, a hybrid material was developed using nano-silica as a substrate and perylene diimide derivative as a fluorophore for simultaneous detection and adsorption of specific toxic analytes. A microemulsion method was applied for the synthesis of nano-silica with spherical to discoid morphology providing a high surface area. The surface immobilization of perylene diimide and subsequent bay-functionalization yielded the green emissive material nano-SiO2@BAPERTOL. This material selectively detects 4-nitrocatechol (4-NC) via dynamic fluorescence quenching (FRET), and Ru3+ and Cu2+ among metal cations through static fluorescence quenching, with LODs of 4.34 nM, 0.56 nM, and 0.43 nM, respectively. This material exhibits hydrogen bonding-mediated high adsorption capacity (∼775 mg g−1) towards 4-NC and coordination-driven adsorption of Ru3+ and Cu2+ ions (460, 566 mg g−1). Also, the biosensing potential of the material was evaluated using brine shrimp (Artemia nauplii). Conclusively, the material serves as a single recyclable platform for selective detection and remediation of 4-NC, Ru3+, and Cu2+ ions, demonstrating superior performance and sustainability.
1. Introduction
Environmental monitoring and remediation using a single platform have gained momentum due to its numerous advantages. Typically, materials capable of either detection or adsorption/removal functions were widely used. Given the differing requirements of these functions, water-soluble materials were typically used for detection, while insoluble materials were used for removal studies. Recently, various single-platform materials have been designed to derive dual functions of detection and removal of toxic analytes simultaneously from aquatic environments.1–6 Most of these functional materials consist of a mesoporous substrate and a fluorophore-appended chelating motif. The substrate's role is to offer a high surface area and better aquatic dispersion for higher organic loading and improved photophysical sensitivity. Similarly, the chelating fluorophore's role is to signal and bind the targeted analytes for removal. To this, silica-based porous functional materials have gained significant attention due to their excellent properties and versatile applications in fields such as catalysis, sensing, drug delivery, and environmental monitoring. Silica's chemical stability, high surface area, biocompatibility, and ease of functionalization make it an ideal substrate for developing advanced functional materials.7–13 Improving the surface area of silica-based materials is a new unmet need for high-end applications. Two promising approaches to achieving high surface area in silica-based materials include the use of either mesoporous materials (such as SBA-15 or MCM-41) or the synthesis of nano-sized silica materials.14–18 The nano-sized silica materials, due to their smaller size, inherently provide a higher surface area-to-volume ratio, enhancing their interaction with the surrounding environment. Among the methods of synthesis for nano-silica, the microemulsion method stands out for its precise control over particle size and morphology, versatility, mild synthesis conditions, scalability, and ability to produce stable, and uniform nano-sized silica particles.19–21 Considering these merits, nano-silica synthesized via a microemulsion technique is an excellent choice as a solid support for deriving dual functional materials. Therefore, we aimed to synthesize and develop hybrid materials from a nano-silica material with dual functional activity for simultaneous environmental monitoring and remediation applications. The functionalized nano-silica materials are less explored compared to mesoporous silica and worth exploring.22,23 We selected perylene diimide as a fluorescence tag for several reasons. Perylene is highly valued as a higher-wavelength emissive fluorophore due to its unique optical properties, including high quantum yield, photostability, and chemical stability, which make it particularly suitable for biological and environmental detection applications.24–28 Additionally, perylene diimide is easy to functionalize on the silica surface, and post-functionalization (bay-functionalization) can be performed to create targeted binding sites for analytes. Therefore, we have considered an electron-rich perylene moiety functionalized on nano-silica for optical signalling and removal functions towards electron-deficient nitro analytes more particularly 4-nitrocatechol. It is a toxic pollutant and is commonly a by-product of industrial processes like dye, pesticide, and pharmaceutical manufacturing that contaminates rivers and groundwater through wastewater streams.29,30 4-Nitrocatechol, formed from catechol and radicals, is a key secondary organic aerosol precursor with high yields, low volatility, and significant reactivity with OH radicals, influencing atmospheric processes and degradation pathways. Its environmental presence poses serious risks due to its toxicity and potential to disrupt biological systems, emphasizing the need for monitoring and mitigation.31 For monitoring applications, conventional techniques for detecting 4-nitrocatechol (4-NC) include liquid chromatography with UV detection.30 Another method using reversed-phase chromatography with UV/Vis detection, adapted to liquid chromatography/electrospray ionization mass spectrometry, has been developed for detecting 4-NC in atmospheric aerosols.32 Raman and UV-visible spectroscopies have been used to examine 4-NC's molecular properties, with quantum chemical calculations revealing specific complex formations in aqueous solutions.33,34 However, these techniques require trained experts, and pre-treatment and suffer from toxicity and poor sensitivity. Recently, fluorescence sensing has gained significant attention for being user-friendly, displaying excellent selectivity, and being sustainable in approach.35,36 However, only countable reports are present in the literature for fluorescence sensing of 4-NC.37–39 Heterogeneous fluorescence probes, particularly those that are easily recyclable, have become more attractive than organic probes. Also, for remediation approaches, the bioremediation of 4-nitrocatechol (4-NC) has been achieved through bacterial degradation. Pseudomonas sp. strain WBC-3, induced with para-nitrophenol (PNP), completely degrades 4-NC, highlighting its bioremediation potential.40 Photolysis studies show varying 4-NC degradation rates in semisolid isomalt versus liquid solutions, emphasizing the importance of the chemical environment. Additionally, Ochrobactrum sp. B2 degrades 4-NC via a pathway forming 1,2,4-benzenetriol and hydroquinone.41,42 A more effective and economical approach for the elimination of 4-NC is the adsorption process. Recently, metal-bearing surfaces (Ti(IV), Fe(III), and Al(III)) have been studied to show strong adsorption of 4-nitrocatechol.43 Additionally, the facile immobilization of cyclobis(paraquat-p-phenylene) macrocycles on silica surfaces has been demonstrated to adsorb large amounts of 4-nitrocatechol, forming large aggregates on the surface.44 Conclusively, both approaches of fluorescence detection and adsorption operated independently in the literature and no reports of concurrent detection and adsorption of 4-NC are reported. Integrating the dual functions (detection & remediation) into a single platform offers several advantages and is ideal for environmental monitoring and remediation efforts.45–50 Therefore, it is essential to develop a dual functional material for the detection and removal of 4-NC, which is not documented in the literature.Herein, we have created a functional nano-silica (nano-SiO2@BAPERTOL) to derive dual functions of detection and adsorption of analytes. Initially, nano-sized silica was synthesized using a microemulsion technique having a high surface area of approximately 1351 m2 g−1. The nano-silica was then covalently functionalized with synthesized perylene derivative APERT ligand, followed by post-functionalization (bay-functionalization) to create the green emissive final material nano-SiO2@BAPERTOL. The bay functionalization was carried out to create binding sites for metal ions and higher wavelength emissions. This kind of bay-functionalization of perylene is known for affecting the absorption and emission spectra, as well as the excited-state dynamics, like intersystem crossing, internal conversion, and fluorescence quantum yield.51,52 This material was found to be selective towards 4-nitrocatechol and metal ions like Cu2+ and Ru3+. These metals can originate from various industrial processes, including electroplating, mining, and chemical manufacturing, and their presence in water bodies can lead to severe ecological and health problems. International agencies like the WHO and EPA have set a maximum limit of 2 mg L−1 for Cu2+ ions in drinking water.53–56 There is no set limit for Ru3+ ions due to limited research on their detection and removal. However, the detection and removal of these pollutants from water is crucial for aquatic environmental monitoring and remediation.
2. Results & discussion
2.1. Structural & surface characterizations
The synthetic scheme shown below (Scheme 1) describes the synthesis of the ligand (APERT), nano-silica, and its chemical functionalization. The nano-silica (nano-SiO2) was synthesized using the microemulsion method, where trimethylbenzene (TMB) served as the oil phase, tetraethyl orthosilicate (TEOS) in the water phase acted as the silica precursor, thiourea was the hydrolyzing agent, sodium bis(2-ethylhexyl)sulfosuccinate (AOT) functioned as the surfactant, and isopropanol was used as the co-solvent. In a typical reaction (detailed in the experimental section), a mixture of TMB and AOT was prepared to form a clear solution. The water phase containing TEOS was then added to this mixture, leading to the formation of reverse micelles, where water droplets are dispersed in the oil phase, creating a W/O microemulsion. Additionally, thiourea solution and isopropanol were added to initiate the hydrolysis and condensation of TEOS within the water droplets, resulting in the formation of silica nanoparticles within the micelle structure. This process produced discrete nano-sized (30–40 nm) silica structures (nano-SiO2) with a high surface area (1351 m2 g−1) and unique morphology, likely due to the growth of the silica nanoparticles within the confined spaces of the reverse micelles, ensuring uniform size distribution. After synthesizing the nano-silica, it was chemically processed with 3-CPTES to form nano-SiO2@Cl material. This intermediate material was further processed with a synthesized perylene ligand (APERT) to form nano-SiO2@APERT material, which was further bay functionalized to obtain the final material nano-SiO2@BAPERTOL. The synthesized ligand and the material were thoroughly characterized by various analytical techniques and further utilized for concurrent optical detection and removal applications.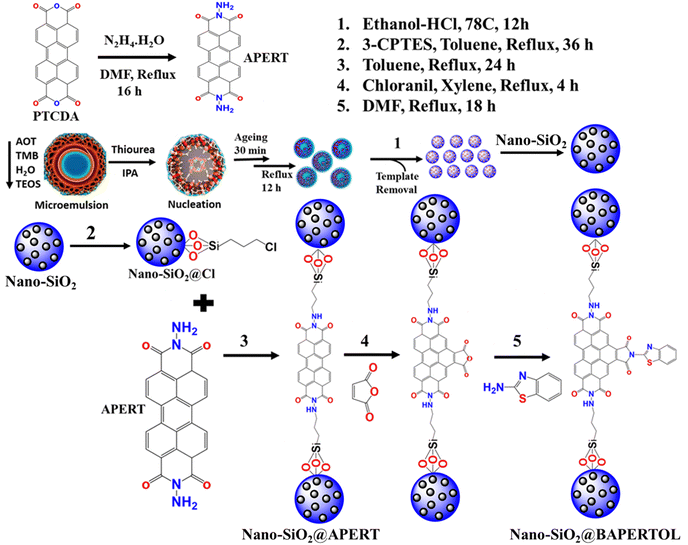 | ||
| Scheme 1 The synthetic and chemical processing representation of the nano-silica (nano-SiO2), nano-SiO2@Cl, nano-SiO2@APERT, and the final material nano-SiO2@BAPERTOL. | ||
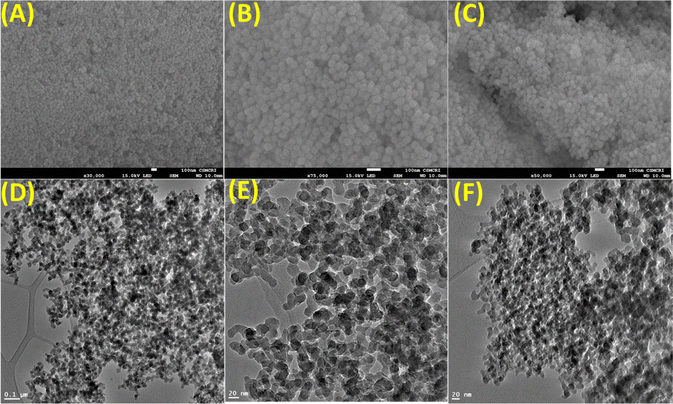
Analytical techniques such as FeSEM, TEM, BET, PXRD, FTIR, Zeta potential, TGA, XPS, UV-Vis, and fluorescence spectroscopy were employed to extract information about the surface morphology, surface area, porosity, functionality, nature, charge potential, stability, and optical behavior of the synthesized materials. The synthetic conditions yielded spherical to discoid nano-silica (nano-SiO2) that remains nearly constant during chemical processing (Fig. 1A–C). The TEM analysis of the nano-SiO2 also revealed defined silica morphology with a particle size of 30–40 nm with no morphological changes after chemical functionalization (Fig. 1D and F). The close analysis of HR-TEM of the final nano-SiO2@BAPERTOL material showed aggregation behavior & dense silica particles, probably due to the functionalization process (Fig. 1F).
The surface area and pore size measurements (physicochemical parameters) were obtained using BET analysis (Fig. 2A and Table 1), revealing a high surface area of 1351 m2 g−1 for the synthesized nano-SiO2. The surface area, pore size, and pore volume were subsequently reduced through the functionalization processes to obtain nano-SiO2@Cl and the final material nano-SiO2@BAPERTOL, indicating successful surface and pore functionalization (Fig. S1 and Table 1, ESI†). Additionally, capillary condensation was highest in the starting material and least in the final material, further confirming successful chemical processing. The high surface area of the starting material was likely due to the small size of the silica particles, which increases the effective available surface area due to a higher surface-to-volume ratio. This is advantageous for the effective loading of ligands, and beneficial for high-performance application.
| Samples | Surface area (m2 g−1) | Pore volume (cm3 g−1) | Pore diameter (nm) |
|---|---|---|---|
| Nano-SiO2 | 1351.21 | 0.914 | 2.1 |
| Nano-SiO2@Cl | 181.78 | 0.089 | 1.8 |
| Nano-SiO2@BAPERTOL | 13.087 | 0.0016 | 1.2 |
The synthesized materials were also subjected to PXRD and TGA measurements to determine their nature, ligand loading, and stability. The broad-angle PXRD of the nano-SiO2 exhibited an amorphous structure with a broad band at 23.81°, which remained consistent throughout the chemical processing, showing bands at 23.46° and 22.72° for nano-SiO2@Cl and the final material nano-SiO2@BAPERTOL, respectively (Fig. 2B). The thermal profile of the synthesized materials displayed the percentage weight loss, thermal stability, and degree of covalent functionalization. The thermal profiles (Fig. 2C) were divided into three phases. Phase 1 (0–250 °C) denotes the removal of any form of physically adsorbed water molecules in the materials, with higher water loss (∼17%) in the final material, likely due to the presence of more electronegative functionalities forming hydrogen bonds with water molecules. Phase 2 (250–550 °C) corresponded to the removal of organic functionalities attached to the materials, with percentage weight losses of 14.43%, 33.62%, and 61.10% for nano-SiO2@Cl, nano-SiO2@APERTOL, and the final material nano-SiO2@BAPERTOL, respectively. The successive higher weight loss in the synthesized materials indicates successful covalent functionalization, with the highest weight loss in the final material demonstrating effective ligand loading due to pore and surface functionalization. Phase 3 (550–800 °C) denotes the destruction and dihydroxylation of the materials.
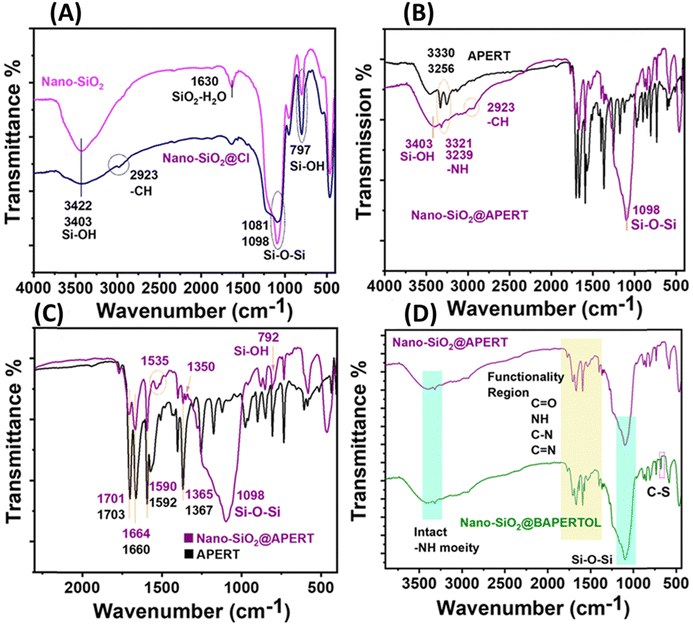
The FTIR spectrum and XPS profiles (Fig. 3 and 4) of the synthesized materials were analyzed to determine their surface states and functional groups. The FTIR spectrum of nano-silica (nano-SiO2) exhibited characteristic peaks at 3422 and 1081 cm−1, corresponding to Si–OH and Si–O–Si functionalities, confirming the successful synthesis of nano-silica (Fig. 3A).46 Comparing the FTIR spectrum of nano-silica with that of Cl-functionalized nano-silica, additional peaks at 2923 and 2884 cm−1 were observed, indicating the alkyl stretching of the CPTES group and confirming the successful grafting of the CPTES group to form nano-SiO2@Cl material. To confirm the covalent attachment of the synthesized ligand (APERT), the FTIR spectra of APERT and nano-SiO2@APERT were compared exhibiting that all characteristic peaks of silica were present, along with new peaks at 3321, 3239, 1701, 1664, 1535, 1590, and 1365 cm−1 (Fig. 3B). The peaks at 3321 and 3239 cm−1 correspond to -NH stretching, while 1701 and 1664 cm−1 correspond to symmetric and asymmetric amide stretching (amide-1 and amide-2). The peaks at 1590, 1535, and 1365 cm−1 correspond to C![[double bond, length as m-dash]](https://www.rsc.org/images/entities/char_e001.gif) C aromatic stretching and C–N linkage. The presence of all APERT ligand peaks in the intermediate material suggests successful grafting of the APERT ligand, forming nano-SiO2@APERT material (Fig. 3C). The FTIR spectra of the final material, nano-SiO2@BAPERTOL, exhibited additional peaks at 1570 and 660 cm−1, corresponding to C
C aromatic stretching and C–N linkage. The presence of all APERT ligand peaks in the intermediate material suggests successful grafting of the APERT ligand, forming nano-SiO2@APERT material (Fig. 3C). The FTIR spectra of the final material, nano-SiO2@BAPERTOL, exhibited additional peaks at 1570 and 660 cm−1, corresponding to C![[double bond, length as m-dash]](https://www.rsc.org/images/entities/char_e001.gif) N and C–S functionalities, respectively, confirming the successful synthesis of the final material, as supported by EDX analysis (Fig. 3D and Fig. S2, S3, ESI†).
N and C–S functionalities, respectively, confirming the successful synthesis of the final material, as supported by EDX analysis (Fig. 3D and Fig. S2, S3, ESI†).
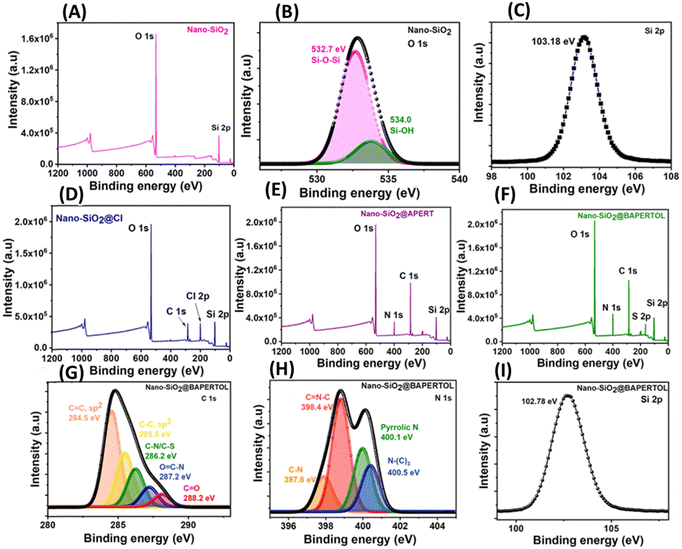
The materials were further evaluated by X-ray photoelectron spectroscopy (XPS). The XPS full scan spectrum of the synthesized nano-silica (nano-SiO2) showed signals for silicon (Si) and oxygen (O), indicating the successful synthesis of nano-silica particles (Fig. 4A). The core–shell O 1s spectra exhibited peaks at 532.7 and 534.0 eV, corresponding to the Si–O–Si and Si–OH functionalities; also the silica framework was confirmed by the XPS core–shell Si-2p spectrum (Fig. 4B and C).47 The Cl functionalization of the nano-silica was confirmed by the full scan spectrum of the nano-SiO2@Cl material, showing additional signals at 285 and 200.0 eV, corresponding to the alkyl group and Cl-2p functionality (Fig. 4D). The attachment of the APERT ligand moiety was confirmed by the full scan and C 1s spectra of the nano-SiO2@APERT material. The full scan spectrum showed an extra signal for nitrogen functionality along with the increased intensity of the carbon signal, indicating a successful functionalization process (Fig. 4E) The XPS C 1s core–shell spectra showed signals at 284.5, 285.4, 286.2, 287.2, and 288.2 eV, corresponding to the C![[double bond, length as m-dash]](https://www.rsc.org/images/entities/char_e001.gif) C(sp2), C–C(sp3), C–N, O
C(sp2), C–C(sp3), C–N, O![[double bond, length as m-dash]](https://www.rsc.org/images/entities/char_e001.gif) C–N, and C
C–N, and C![[double bond, length as m-dash]](https://www.rsc.org/images/entities/char_e001.gif) O functionalities (Fig. S4, ESI†). Furthermore, the synthesis of the final material nano-SiO2@BAPERTOL was confirmed by the XPS full scan, C 1s, and N 1s spectra. The XPS full scan spectra of the final material displayed extra signals for sulfur with increased intensities of the carbon, oxygen, and nitrogen signals, indicating successful covalent processing (Fig. 4F). The C 1s and N 1s core–shell spectra showed signals at 284.5, 285.4, 286.2, 287.2, 288.2, 397.8, 398.4, 400.1, and 400.5 eV, corresponding to the C
O functionalities (Fig. S4, ESI†). Furthermore, the synthesis of the final material nano-SiO2@BAPERTOL was confirmed by the XPS full scan, C 1s, and N 1s spectra. The XPS full scan spectra of the final material displayed extra signals for sulfur with increased intensities of the carbon, oxygen, and nitrogen signals, indicating successful covalent processing (Fig. 4F). The C 1s and N 1s core–shell spectra showed signals at 284.5, 285.4, 286.2, 287.2, 288.2, 397.8, 398.4, 400.1, and 400.5 eV, corresponding to the C![[double bond, length as m-dash]](https://www.rsc.org/images/entities/char_e001.gif) C(sp2), C–C(sp3), C–N, O
C(sp2), C–C(sp3), C–N, O![[double bond, length as m-dash]](https://www.rsc.org/images/entities/char_e001.gif) C–N, and C
C–N, and C![[double bond, length as m-dash]](https://www.rsc.org/images/entities/char_e001.gif) O functionalities of the carbon spectra, and C–N, C
O functionalities of the carbon spectra, and C–N, C![[double bond, length as m-dash]](https://www.rsc.org/images/entities/char_e001.gif) N–C, pyrrolic N, and N–(C)3 functionalities of the nitrogen spectra, confirming the successful synthesis of the desired final material nano-SiO2@BAPERTOL (Fig. 4G–I).
N–C, pyrrolic N, and N–(C)3 functionalities of the nitrogen spectra, confirming the successful synthesis of the desired final material nano-SiO2@BAPERTOL (Fig. 4G–I).
Given the final material's numerous electronegative functionalities (N, O, S), understanding its surface charge is crucial before investigating its optical and adsorption properties. The surface charge potential values were measured using zeta potential at various pH levels (Fig. S5, ESI†). At low pH, the zeta potential of the final material was found to be +16–12 mV, at neutral pH −36.7 to −40.6 mV, and it remained nearly the same at higher pH values. The positive values at low pH are likely due to the protonation of –NH sites forming {nano-SiO2@BAPERTOL-H+}, while the negative values at neutral and higher pH are due to the presence of electronegative donor atoms (N, O, S).
2.2. Optical properties & stability studies
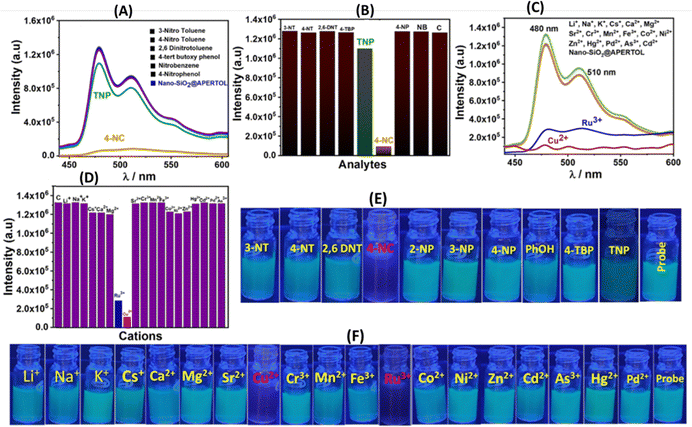
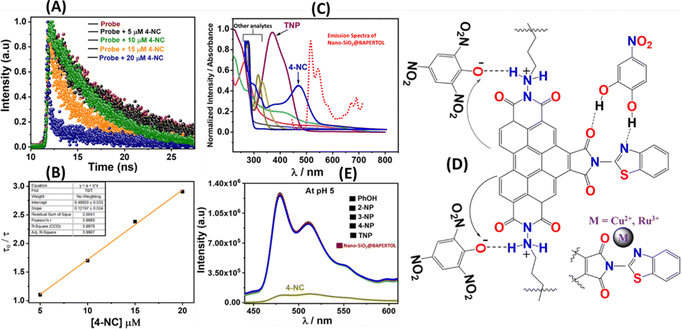
The photophysical characteristics of the material nano-SiO2@BAPERTOL were investigated in a dispersion solution phase (4 mg/10 mL) by UV-Vis and fluorescence spectroscopy. Analysis of the UV-Vis spectrum profile of the finely dispersed material revealed three distinct bands at 258, 387 & 593 nm, corresponding to the π to π* and n to π* transitions (Fig. S6; inset, ESI†). Initially, various cations underwent selectivity testing within the UV-Vis range. In the presence of Cu2+ and Ru3+ ions among the cations, spectral changes occurred, characterized by an increase in spectral intensity (hypochromic shift), while no such alterations were observed with the other cations (Fig. S6, ESI†). Notably, the observed UV-Vis spectral changes with Ru3+ and Cu2+ ions validate the interaction between the material's donor atoms and these ions. Consequently, to delve deeper into the material's selective optical behavior, fluorescence studies were conducted in an aqueous buffer medium at pH ∼ 7.2 (HEPES) encompassing cations, anions, and nitroaromatics (Fig. 5). These studies, employing an excitation wavelength of 380 nm, unveiled two emission spectral bands at 480 nm and 510 nm, demonstrating a large Stokes shift of ∼100 nm. Notably, the material exhibited a selective fluorescence quenching response in the presence of 4-NC among nitroaromatics, with minimal, non-significant fluorescence quenching observed with TNP (Fig. 5A). Moreover, the material's fluorescence response with TNP was relatively low compared to 4-NC, underscoring its selective nature towards 4-NC among nitroaromatics (Fig. 5B). Similarly, a notable fluorescence response was elicited by Cu2+, and Ru3+ ions among cations, while no fluorescence response was noted in the presence of anions (Fig. 5C and Fig. S7, ESI†). To reaffirm the material's selectivity for 4-NC over analogous compounds (diols), we conducted a fluorescence selectivity study with the diols, revealing no significant fluorescence quenching (Fig. S8, ESI†). Conclusively, these experiments evidenced the selective nature of the material towards 4-NC among nitroaromatics and Cu2+ and Ru3+ ions among the wide range of cations and anions. Interference selectivity experiments were also performed with the excess of other ions along with specific analytes revealing the selective nature of the material in the detection of specific analytes in a complex pool of other ions (Fig. S9, ESI†).2.3. Fluorescence sensing studies
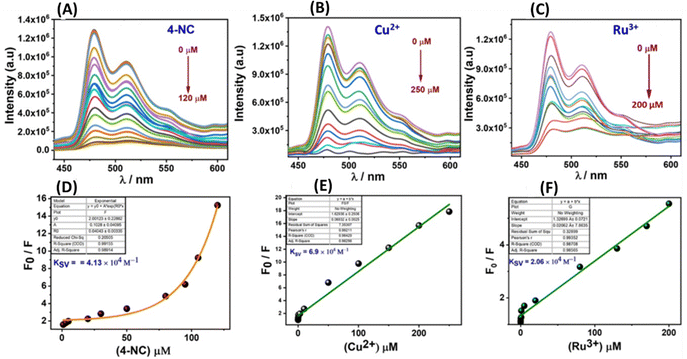
The material demonstrated a high fluorescence quenching efficiency for 4-NC, Ru3+, and Cu2+ ions, with quenching efficiencies ranging from approximately 90% to 99%, indicating its sensitive detection capabilities for these substances (Fig. 6A–C). To assess the stability of its fluorescence emission, a time-dependent study was conducted, which revealed that the material maintained a stable fluorescence emission intensity over time (Fig. S10, ESI†). Since the material showed good luminescent properties and significant quenching response, in a further quest to derive more information regarding fluorescence parameters, titration experiments were performed with the 4-NC, Ru3+, and Cu2+ at saturation concentration with incremental additions (Fig. 7).Sensing parameters such as Stern–Volmer constants (Ksv), LOD, and LOQ values were analyzed and determined. Following non-linear fitting towards the 4-NC hinted towards static or dynamic fluorescence quenching, or a mixture of both. The nonlinear curve fitting equation can be represented as F0/F = A·Ek[m] + B, where [m] is the concentration of the 4-NC, and F0 and F are the initial and final fluorescence intensity of the material before & after the addition of 4-NC, whereas A, B and K are constants.
The Stern–Volmer quenching constant (Ksv) for 4-NC was obtained as the product of the constant A & K utilized from the above nonlinear equation, which is found to be 4.13 × 10⁴. The quenching constant (KSV) is the product of the constants A & K utilized in the equation and is found to be 4.13 × 10⁴ for 4-NC. Similarly, a linear regression curve towards Ru3+ and Cu2+ ions was obtained suggesting a static fluorescence quenching response supported by UV-Vis spectral changes. Furthermore, the linear fitting can be represented as F0/F = Ksv[M] + 1, where [M] is the concentration of the specific ions (Cu2+, Ru3+), F0 and F are the initial and final fluorescence intensities before and after the specific analyte addition, and Ksv is the quenching constant which can be obtained from the slope of the linear fitting curve, which was found to be 2.06 & 6.9 × 10⁴ M−1. The LOD values were obtained by adding small incremental addition of specific analytes using the 3σ method and similarly, LOQ values were obtained using the 10σ method (Table 2 and Fig. S11 and S12, ESI†).6,48
| Analyte | K sv | LOD (nM) | LOQ (nM) | Linear range (μM) | R sd (%) |
|---|---|---|---|---|---|
| 4-NC | 4.13 × 10⁴ | 4.34 | 14.4 | 0.0144–1.5 | 2.64 |
| Cu2+ | 6.9 × 10⁴ | 0.43 | 1.3 | 0.0013–0.32 | 2.87 |
| Ru3+ | 2.06 × 10⁴ | 0.56 | 1.6 | 0.0016–0.6 | 2.24 |
The electrostatic interaction between the more acidic TNP and secondary amine functionality present in the material will lead to the formation of an ionic compound, which will bring the electron-rich perylene moiety into proximity to the nitro phenolate for an electron transfer process to occur mainly responsible for the fluorescence quenching, while other nitro phenols don’t quench the fluorescence as being less acidic in nature (Fig. 8D). Additionally, a fluorescence selectivity study at pH = 5 was performed to elucidate the sensing mechanism as no fluorescence quenching was observed with nitro phenols and TNP as electrostatic interaction is inactive; however, the fluorescence quenching with the 4-NC was obtained similar to that of control experiments referred to as FRET being active alone (Fig. 8E). Meanwhile, at neutral pH ∼ 7.2 the fluorescence quenching with 4-NC and some with TNP can be attributed to a combination of FRET and acid base-induced electron transfer.
2.4. Adsorption studies
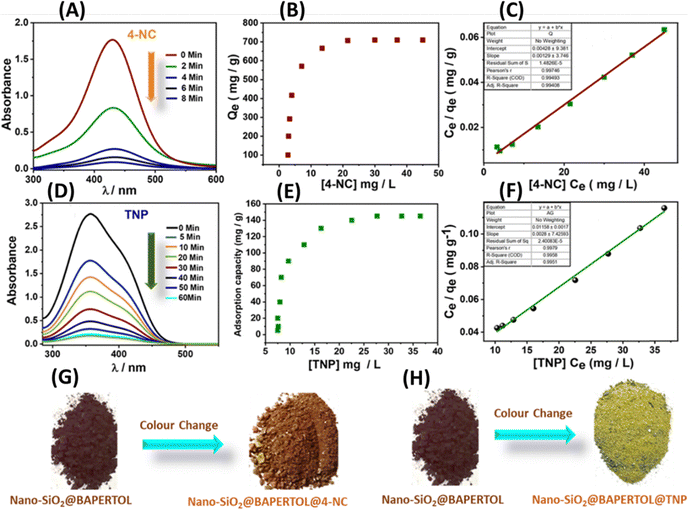
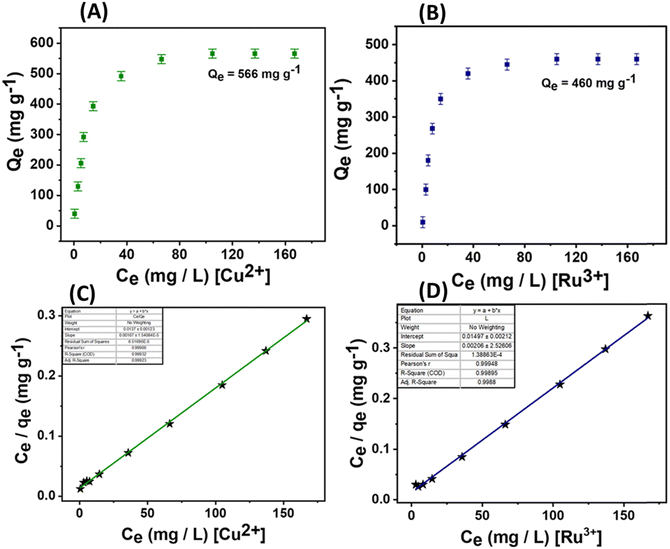
In addition to the excellent optical parameters of the material for detecting these analytes, its adsorption capabilities are crucial for environmental remediation and monitoring applications. Therefore, the adsorption performances of the material were precisely evaluated for 4-NC, TNP, Ru3+ ions, and Cu2+ ions (Fig. 9 and 10). For nitroaromatic adsorption of 4-NC and TNP, an initial colour removal experiment was conducted and monitored using UV-Vis spectroscopy (Fig. 9).47 In this experiment, 5 mg of the material was added to 50 mL of a 50-ppm solution of 4-NC and TNP. The results showed a drastic color removal for 4-NC within 6 min, evidencing the ultra-fast colour removal ability of the material towards 4-NC; however, the color removal of TNP was comparatively slower and took 60 min, respectively (Fig. 9A and D). The material alone (unfunctionalized) did not remove any colour from the analytes, indicating a possible chemisorption mechanism. This suggests that the functionalized nano-silica@BAPERTOL interacts more effectively with 4-NC and TNP molecules compared to bare, unfunctionalized nano-SiO2. Furthermore, to evaluate the adsorption capacity (Qe) of the material toward 4-NC and TNP, batch adsorption experiments were conducted and monitored with UV-Vis studies over a concentration range of 10 to 50 ppm, using a treatment dosage of 5 mg. After 90 minutes of treatment time, each suspension solution was centrifuged, and syringe-filtered, and their UV-Vis spectra were recorded. The final concentration of 4-NC and TNP was determined from the UV-Vis calibration plots of 4-NC and TNP.57 The equilibrium adsorption capacity was calculated by the formula Qe = (Ci − Ce) V/W, where Ci and Ce are the initial and equilibrium concentration of 4-NC & TNP (mg L−1), V is the volume of the aqueous suspension (L) and W is the weight of the adsorbent (g). The adsorption capacities of the material were found to be 710 mg g−1 for 4-NC and 145 mg g−1 for TNP, which are significantly higher than those reported in the literature (Fig. 9B and E). Moreover, the adsorption isotherms were analyzed and plotted, revealing a favorable fit with the Langmuir model, as indicated by a correlation factor (R2) approaching unity (Fig. 9C and 7F). The high adsorption capacity is likely due to π–π stacking interactions and the extent of strong hydrogen bonding between the secondary amine groups (–NH) on the material and the hydroxyl groups (OH) of the 4-NC, along with acid–base electrostatic interactions in the case of TNP molecules (Fig. 8D). Adsorption isotherms were evaluated, with the Langmuir model providing the best fit. For bulk applications, a scale-up adsorption experiment (2 g) demonstrated a visual color change after the adsorption of 4-NC and TNP (Fig. 9G and H).Similar batch adsorption experiments were conducted for Ru3+ and Cu2+ ions (Fig. 10).5 In this study, 5 mg of the material was introduced into solutions with varying concentrations (20 to 200 ppm) of Cu2+ and Ru3+ salts. The mixtures were agitated for 90 minutes. After equilibrium time, the solutions were centrifuged and filtered using a 0.45 μm syringe filter and the final concentrations were analyzed using ICP-MS (inductively coupled plasma mass spectrometry). The calculations indicated adsorption capacities of approximately 552 mg g−1 for Cu2+ and 460 mg g−1 for Ru3+ (Fig. 10A and B). This substantial adsorption capacity is attributed to the coordination-driven complex formation (Fig. 8D). The analysis of adsorption isotherms suggests best fitting of the Langmuir model with a correlation factor approaching unity, indicating monolayer adsorption of the analytes (Fig. 10C, D and Fig. S14, ESI†). A competitive extraction study revealed good extraction capacity in a mixed pool of metal ions (50 ppm), tracked using EDX and XPS analysis. EDX showed signals of Si, O, C, N, S, Ru3+, Cu2+, and Cl, while XPS analysis indicated decreased intensity of oxygen, nitrogen, and sulfur, evidencing a selective adsorption process through these donor atoms (Table S2 and Fig. S15A, B, ESI†). The competitive performance was calculated using the formula E (%) = (Ci − Cf)/Ci × 100. Conclusively, the material displayed excellent adsorption behavior towards these specific analytes, with parameters tabulated below (Table 3).
| Analyte | Experimental adsorption capacity (qe) (mg g−1) | Langmuir linear isotherm | ||
|---|---|---|---|---|
| Q max (mg g−1) | K L[L g−1] | R 2 | ||
| 4-NC | 705 | 775.19 | 0.3014 | 0.99 |
| TNP | 145 | 357.14 | 0.2417 | 0.99 |
| Cu2+ | 566 | 598.80 | 0.1602 | 0.99 |
| Ru3+ | 460 | 485.43 | 0.0579 | 0.99 |
2.5. Recyclability studies
In the pursuit of sustainability and the creation of systems offering environmental and economic advantages, recyclability emerges as a crucial and indispensable tool for future hybrid materials. The material's recyclability underwent examination through UV-Vis spectroscopy (Fig. 11). As an illustrative example of the typical case, the UV-Vis spectra of the material were recorded at neutral optimum analytical conditions (Fig. 11A-1). Subsequently, following copper adsorption, thorough washing with water was conducted, and the UV-Vis spectra were recorded again, revealing a hyperchromic effect with Cu2+ ions (Fig. 11A-2). Upon adsorption, the material underwent elution with 0.2 N HCl, followed by further washing with water, resulting in UV-Vis spectra indicating the formation of protonated species of the material, characterized by two bands with increased UV-Vis spectral intensity (Fig. 11A-3). Next, the material was subjected to basification with 0.2 N NaOH, exhibiting spectra similar to the original control spectra, indicating the material's facile acid–base regeneration (Fig. 11A-4). Similar acid–base experiments were conducted towards Ru3+ ions for recyclability and tracked using fluorescence spectroscopy (Fig. S16, ESI†). These acid–base regeneration studies were conducted for up to five cycles for both Cu2+ and Ru3+ ions and also tracked via fluorescence spectroscopy (Fig. 11B and Fig. S17A, B, ESI†). Initially, the adsorption capacity decreased by 2–3%; however, after the third cycle, the adsorption capacity remained stable, demonstrating resistance to consecutive stripping experiments. For the desorption and regeneration of the material from 4-NC and TNP, various solvents such as acetone and methanol were initially attempted. However, this process proved to be time-consuming, requiring multiple washings over several cycles, yet yielding.58 In contrast, desorption using a basic solution of 0.4 N NaOH was remarkably effective, regenerating the material within 5 minutes with only two washing treatments for 4-NC and TNP (Fig. 11C and Fig. S18, ESI†).The swift regeneration is likely attributed to the abstraction of protons from the secondary NH sites of the material by the basic solution, disrupting the acid–base-induced interaction and forming sodium salts of TNP, which remain in the aqueous phase. The regenerated material obtained underwent centrifugation, thorough washing, and overnight drying in an oven at 70 °C. Evaluation of the adsorption performance of the regenerated material was conducted for up to 5 cycles, yielding results comparable to control experiments and tracked via fluorescence spectroscopy (Fig. 11D and Fig. S19, ESI†). In addition, the detection performance was also monitored during regeneration experiments up to 5 cycles showing similar quenching efficiency to that of control experiments (Fig. S20, ESI†). Furthermore, the functionality, morphology, and optical response of the regenerated material were confirmed and thoroughly characterized using FTIR, TEM, and fluorescence spectroscopy (Fig. S21, ESI†).
2.6. Biosensing applications
The practical utility of functional materials brings significant advantages and facilitates tracking and monitoring applications. Thus, the nano-SiO2@BAPERTOL material was utilized for biosensing applications via fluorescence imaging to detect Cu2+ and Ru3+ ions in an animal model, brine shrimp Artemia nauplii.6,48 Since this probe material is water-insoluble, we focused on targeting the guts of small animals like Artemia nauplii for biosensing applications via fluorescence imaging.59 Initially, brine shrimp Artemia nauplii were hatched (30 organisms in a 10 mL vial) and subsequently incubated with the material for 3 h. Following treatment, the Artemia nauplii easily ingested the material in their gastrointestinal tract (GI), as observed using a BX53 OLYMPUS microscope (Fig. 12A). This is also supported by the green emission of the material under a UV filter (Fig. 12B and C). Subsequently, the brine shrimp Artemia nauplii were exposed to 5 μM concentrations of Ru3+ and Cu2+ ions, resulting in quenching of the green emission (Fig. 12D and E), also when exposed to higher concentrations (90 μM) of these specific ions, the complete quenching of the green emission was observed (Fig. 12F). The suppression of green emission by the material at low concentrations of Ru3+ and Cu2+ in the animal models within the aqueous medium highlights the potential applicability of this material for biosensing of these ions.2.7. Real sample quantification applications
The real sample applications play a pivotal role in assessing the performance, reliability, and practical utility of materials, thereby guiding their development and eventual deployment in relevant fields. To ascertain the practical utility of the nano-silica@BAPERTOL material as a probe material, the quantification of Cu2+ ions in the real sample was performed using catalyst wastewater. Equal amounts of the probe material (4 mg/15 mL) in Milli-Q water (control) and the actual aqueous samples underwent fluorescence emission studies. Subsequently, the real sample solutions were spiked with known copper-ion standard solutions and fluorescence spectra were recorded (Fig. S22, ESI†). Assessing the calibration plot derived from the previous fluorescence titration experiment with copper, the quantification of copper ions in the real samples was estimated. It was observed that the recovery percentages ranged from 100.57 to 103.44 for copper (Table S3, ESI†), with RSD values below 2%, indicating the reliable applicability of the probe material for detecting Cu2+ ions in real samples.3. Experimental section
3.1. Synthesis of APERT ligand
For the standard synthetic procedure, 3 g (7.64 mmol) of perylene tetracarboxylic dianhydride (PTCDA) was reacted with 4.2 mL (83.89 mmol) of hydrazine hydrate in 150 mL dry DMF for 16 h at 130 °C. Upon cooling the reaction mixture, purple-violet colored precipitates were observed, which were then filtered and washed with a 2 N solution of 50 mL NaOH to remove excess PTCDA. A bright green luminescent solution was observed during the washing procedure. Following the NaOH solution wash, the precipitates underwent subsequent washing steps with water, methanol, and chloroform 3 times. Finally, the obtained purple-colored precipitates were vacuum dried at 50 °C for 2 h, resulting in 2.66 g of the product designated as APERT ligand, which was further characterized by FTIR (Fig. S23, ESI†).3.2. Microemulsion-assisted synthesis of nano-SiO2
In the biphasic synthesis of nano-silica, initially 0.5 grams of dioctyl sodium sulfosuccinate was added to 50 mL of trimethylbenzene and stirred at 550 rpm for 15 minutes to get a clear solution. To this reaction mixture, 5 mL (22.56 mmol) of TEOS in 25 mL was added slowly for 20 min and stirred for another 30 min. Afterward, thiourea solution (5 g in 40 mL) (hydrolyzing agent) and 8 mL isopropanol as a co-solvent was added to the above reaction mixture and aged for 20 min to observe a white colloidal solution, which was then subjected to reflux for 4 h. After the reaction time, the product was collected through centrifugation at 10![[thin space (1/6-em)]](https://www.rsc.org/images/entities/char_2009.gif) 000 rpm for 5 min and subsequently washed with water and methanol 4 times and dried in an oven overnight at 60 °C. To remove the template, the white precipitates were further refluxed thrice in 100 mL of HCl–ethanol (0.4 N) mixture, centrifuged, washed properly with water and methanol, and finally dried overnight in an oven at 70 °C affording 4.85 g of product designated as nano-SiO2 material.
000 rpm for 5 min and subsequently washed with water and methanol 4 times and dried in an oven overnight at 60 °C. To remove the template, the white precipitates were further refluxed thrice in 100 mL of HCl–ethanol (0.4 N) mixture, centrifuged, washed properly with water and methanol, and finally dried overnight in an oven at 70 °C affording 4.85 g of product designated as nano-SiO2 material.
3.3. Synthesis of nano-SiO2@Cl
For the synthesis of nano-SiO2@Cl, 2 g of the above-synthesized nano-SiO2 was refluxed with 4 mL (16.61 mmol) of 3-chloropropyltriethoxysilane (3-CPTES) in toluene at 110 °C for 24 h. Afterwards, the product was collected through centrifugation and washed with toluene and methanol 2 times and finally dried in an oven at 60 °C for 4 h obtaining 2.25 g product designated as nano-SiO2@Cl material.3.4. Synthesis of final material nano-SiO2@BAPERTOL
For the synthesis of the final material (nano-SiO2@BAPERTOL), 2 g of the nano-SiO2@Cl material was refluxed with 2.2 g (5.23 mmol) of the synthesized APERT ligand in 150 mL of dry toluene at 110 °C for 24 h. Upon cooling the reaction mixture, the precipitates were centrifuged at 6000 rpm and washed with 80 mL of 0.2 N H2SO4 solution, water, hot DMF, and methanol to remove excess unreacted APERT ligand, as the ligand has limited solubility in organic solvents. After washing, the purple-violet material was vacuum dried, designated as nano-SiO2@APERT. Subsequently, this material (nano-SiO2@APERT) was refluxed with 4 g (40.79 mmol) of maleic anhydride and 2.1 g (8.54 mmol) of chloranil in 150 mL of xylene for 4 h. The reaction mixture was then hot filtered and washed with warm xylene, methanol, and chloroform 2-3 times before drying at 70 °C for 6 h. Lastly, the resulting material was refluxed with 1.5 g (11.26 mmol) of 2-amino benzimidazole in 150 mL of DMF at 130 °C for 18 h. After the reaction, the product was collected through centrifugation (8000 rpm, 3 min) washed with hot methanol and chloroform 2 times, and finally dried in an oven at 60 °C for 5 h to obtain 2.58 g of the desired product designated as the final material nano-Silica@BAPERTOL. The final material was then subjected to detailed characterization using various analytical techniques and exploited for optical and removal applications.3.5. Sensing studies
Photophysical studies for the determination of the optical parameters of the analytes were performed by preparing an aqueous dispersion of the material at a concentration of 4 mg per 15 mL. For each spectral record, the suspension was shaken well beforehand. The fluorescence selectivity experiments were conducted using the various nitro analytes: 3-nitrotoluene, 4-nitrotoluene, 2,6 dinitro toluene, 4-nitrocatechol, 2-nitrophenol, 3-nitrophenol, 4-nitrophenol, phenol, 4-tert-butoxy phenol, trinitrophenol, catechol, resorcinol and quinol; chloride salts of cations: Li+, Na+, K+, Cs+, Ca2+, Mg2+, Sr2+, Cr3+, Mn2+, Fe3+, Co2+, Ni2+, Zn2+, Hg2+, Pd2+, As3+, Cd2+. The entire UV-Vis spectra were taken from 200 to 800 nm, and fluorescence analysis scanning was done between 400 to 700 nm with excitation at 380 nm. The LOD and LOQ were calculated by employing 3σ and 10σ methods by adding the analytes incrementally during the titration.3.6. Adsorption studies
To investigate the material's adsorption capabilities towards specific analytes, a series of batch adsorption experiments were conducted. Initially, specific analyte (4-NC & TNP) solutions with varying concentrations (5–50 ppm) were prepared, and their UV-Vis spectra were recorded to create calibration plots. Then, 5 mg of the material was added separately to these solutions, and the sample tubes were agitated for 90 h. After the treatment phase, the tubes were centrifuged, and the UV-Vis spectra of the supernatant solutions were recorded. The calibration plot was used to determine the final concentration of these analytes. The final concentrations were determined using the calibration curves of absorbance versus concentration for specific nitro-analytes. Similarly, for Cu2+ and Ru3+ ions, the equilibrium adsorption capacity was evaluated using batch adsorption experiments by adding 5 mg of the material to sample tubes containing metal ion solutions with varying concentrations (20 to 200 ppm). The sample tubes were shaken for 90 h after the addition of the material. After the treatment, the samples were centrifuged followed by being washed three times with water to remove excess unadsorbed metal ions. Finally, the suspension was filtered using a 0.45-μm syringe filter and analyzed by ICP-MS analysis. The experiments were repeated three times to ensure accuracy and minimize experimental errors. The equilibrium adsorption capacity (Qe) was calculated from the adsorption isotherm using the formula Qe = (Ci − Ce)V/W, where Ci is the initial concentration, Ce is the final concentration, V is the volume, and W is the weight of the material. The experimental data were analyzed using the Langmuir and Freundlich adsorption isotherms to understand the adsorption behavior of the material.4. Conclusion
In conclusion, a hybrid material constituted from nano-silica as a substrate and perylene diimide derivative as a fluorescence probe for the selective detection and remediation of toxic analytes was developed. A high surface area bearing nano-silica was synthesized using a microemulsion biphasic system, which was subsequently functionalized with perylene diimide-derivative and bay functionalized to create binding sites for metal ions and nitroaromatics. The material enables precise, selective, and sensitive detection of 4-NC from the aqueous systems via optical fluorescence quenching (FRET) in the presence of various nitroaromatics. The material also exhibits a high adsorption capacity for the above NACs (4-NC) through strong hydrogen bonding and is recyclable. Therefore, this material represents a unique material for the simultaneous detection and removal of 4-nitrocatechol and has not been reported in the literature. Additionally, among cations, this material selectively detects and adsorbs Cu2+ and Ru3+ ions through coordination complexation reaction, facilitating easy recycling as supported by recyclability studies. The material's biosensing capabilities for Cu2+ and Ru3+ ions were also investigated using brine shrimp (Artemia nauplii), as an animal model. Furthermore, the quantification of specific metal ions in real samples was demonstrated using this probe material from fluorescence studies. Therefore, this material serves as a unified platform for dual functions with superior performances based on factors such as LOD, adsorption capacity, recyclability, and real sample applications compared to literature reports (Table S4, ESI†).Author contributions
The manuscript is a collective effort of all authors and each author has endorsed the final version. S. Yadav was involved in the investigation of the work, conceptualized and conducted the data analysis, and shaped the original draft. N. Choudhary contributed to data validation and reviewing drafts. A. T. Vasave contributed to data validation and analysis. V. Sonpal performed the biosensing experiments and data analysis. A. R. Paital was involved in the conceptualization, funding acquisition, supervision, and reviewing/editing of the final manuscript.Data availability
The data supporting this article have been included as part of the ESI.†Conflicts of interest
The author declares no financial interest that could influence the work presented in the manuscript.Acknowledgements
S. Y., N. C., A. T. V., V. S. & A. R. P. acknowledge the Council of Scientific and Industrial Research (CSIR), Govt. of India for the financial support. AcSIR and CSIR are acknowledged for the fellowship and PhD degrees. ADCIF division of CSIR-CSMCRI is acknowledged for providing analytical facilities. A CSIR-CSMCRI communication no. 173/2024.References
- W. Yang, J. Li, Z. Xu, J. Yang, Y. Liu and L. Liu, J. Mater. Chem. C, 2019, 7, 10297–10308 RSC.
- Z. Sun, H. Li, D. Guo, J. Sun, G. Cui, Y. Liu, Y. Tian and S. Yan, J. Mater. Chem. C, 2015, 3, 4713–4722 RSC.
- D. Kou, W. Ma and S. Zhang, Adv. Funct. Mater., 2021, 31, 2007032 CrossRef CAS.
- D. Dai, J. Yang, Y. Wang and Y. Yang, Adv. Funct. Mater., 2021, 31, 2006168 CrossRef CAS.
- S. Chatterjee and A. R. Paital, Adv. Funct. Mater., 2018, 28, 1704726 CrossRef.
- S. Yadav, N. Choudhary, V. Sonpal and A. R. Paital, Small, 2024, 20, 2307491 CrossRef CAS PubMed.
- R. Ciriminna, A. Fidalgo, V. Pandarus, F. Béland, L. M. Ilharco and M. Pagliaro, Chem. Rev., 2013, 113, 6592–6620 CrossRef CAS PubMed.
- S. Angelos, E. Johansson, J. F. Stoddart and J. I. Zink, Adv. Funct. Mater., 2007, 17, 2261–2271 CrossRef CAS.
- L.-Y. Yuan, L. Zhu, C.-L. Xiao, Q.-Y. Wu, N. Zhang, J.-P. Yu, Z.-F. Chai and W.-Q. Shi, ACS Appl. Mater. Interfaces, 2017, 9, 3774–3784 CrossRef CAS PubMed.
- S. Giret, Y. Hu, N. Masoumifard, J.-F. Boulanger, E. Juère, F. Kleitz and D. Larivière, ACS Appl. Mater. Interfaces, 2018, 10, 448–457 CrossRef CAS PubMed.
- Q. Lei, J. Guo, A. Noureddine, A. Wang, S. Wuttke, C. J. Brinker and W. Zhu, Adv. Funct. Mater., 2020, 30, 1909539 CrossRef CAS.
- Y. Yang, M. Zhang, H. Song and C. Yu, Acc. Chem. Res., 2020, 53, 1545–1556 CrossRef CAS PubMed.
- R. Gao, Q. Qiu and W. Dong, ACS Appl. Nano Mater., 2022, 5, 5631–5639 CrossRef CAS.
- D. Zhao, J. Feng, Q. Huo, N. Melosh, G. H. Fredrickson, B. F. Chmelka and G. D. Stucky, Science, 1998, 279, 548–552 CrossRef CAS PubMed.
- C. T. Kresge, M. E. Leonowicz, W. J. Roth, J. C. Vartuli and J. S. Beck, Nature, 1992, 359, 710–712 CrossRef CAS.
- L. Paul, S. Mukherjee, S. Chatterjee, A. Bhaumik and D. Das, ACS Omega, 2019, 4, 17857–17863 CrossRef CAS PubMed.
- C. Zhang, X. Ren, X. Cui, H. Bai, X. Zhang and H. Li, ACS Appl. Nano Mater., 2021, 4, 12137–12145 CrossRef CAS.
- P. Singh, S. Srivastava and S. K. Singh, ACS Biomater. Sci. Eng., 2019, 5, 4882–4898 CrossRef CAS PubMed.
- H. Kaur, S. Chaudhary, H. Kaur, M. Chaudhary and K. C. Jena, ACS Appl. Nano Mater., 2022, 5, 411–422 CrossRef CAS.
- S. Wolf and C. Feldmann, Angew. Chem., Int. Ed., 2016, 55, 15728–15752 CrossRef CAS PubMed.
- E. Da’na, W. S. Al-Arjan, S. Al-Saeed and M. R. El-Aassar, Nanomaterials, 2022, 12, 947 CrossRef PubMed.
- S. K. Rastogi, P. Pal, D. E. Aston, T. E. Bitterwolf and A. L. Branen, ACS Appl. Mater. Interfaces, 2011, 3, 1731–1739 CrossRef CAS PubMed.
- P. Garai, S. Ghosh and N. R. Jana, ACS Appl. Nano Mater., 2024, 7, 12207–12213 CrossRef CAS.
- S. Chen, Z. Xue, N. Gao, X. Yang and L. Zang, Sensors, 2020, 20, 917 CrossRef CAS PubMed.
- H.-J. Ben, X.-K. Ren, B. Song, X. Li, Y. Feng, W. Jiang, E.-Q. Chen, Z. Wang and S. Jiang, J. Mater. Chem. C, 2017, 5, 2566–2576 RSC.
- W. Zhou, G. Liu, B. Yang, Q. Ji, W. Xiang, H. He, Z. Xu, C. Qi, S. Li, S. Yang and C. Xu, Sci. Total Environ., 2021, 780, 146483 CrossRef CAS PubMed.
- J. T. Markiewicz and F. Wudl, ACS Appl. Mater. Interfaces, 2015, 7, 28063–28085 CrossRef CAS PubMed.
- P. S. Hariharan, J. Pitchaimani, V. Madhu and S. P. Anthony, J. Fluoresc., 2016, 26, 395–401 CrossRef CAS PubMed.
- Trends in Asian Water Environmental Science and Technology, ed. F. Kurisu, A. Ramanathan, A. A. Kazmi and M. Kumar, Springer International Publishing, Cham, 2017 Search PubMed.
- Z. Finewax, J. A. de Gouw and P. J. Ziemann, Environ. Sci. Technol., 2018, 52, 1981–1989 CrossRef CAS PubMed.
- C. Roman, C. Arsene, I. G. Bejan and R. I. Olariu, Atmos. Chem. Phys., 2022, 22, 2203–2219 CrossRef CAS.
- Z. Kitanovski, I. Grgić, F. Yasmeen, M. Claeys and A. Čusak, Rapid Commun. Mass Spectrom., 2012, 26, 793–804 CrossRef CAS PubMed.
- J.-P. Cornard Rasmiwetti and J.-C. Merlin, Chem. Phys., 2005, 309, 239–249 CrossRef.
- J.-P. Cornard, C. Lapouge and J.-C. Merlin, Chem. Phys., 2007, 340, 273–282 CrossRef CAS.
- C. Guo, A. C. Sedgwick, T. Hirao and J. L. Sessler, Coord. Chem. Rev., 2021, 427, 213560 CrossRef CAS PubMed.
- J. Wu, W. Liu, J. Ge, H. Zhang and P. Wang, Chem. Soc. Rev., 2011, 40, 3483 RSC.
- V. Anbazhagan, V. Kandavelu, A. Kathiravan and R. Renganathan, J. Photochem. Photobiol., A, 2008, 193, 204–212 CrossRef CAS.
- C. Manivannan, K. M. Sundaram, R. Renganathan and M. Sundararaman, J. Fluoresc., 2012, 22, 1113–1125 CrossRef CAS PubMed.
- Z. Li, Q. Liu, X. Lu, C. Deng, N. Sun and X. Yang, Talanta, 2019, 194, 329–335 CrossRef CAS PubMed.
- M. Wei, J.-J. Zhang, H. Liu and N.-Y. Zhou, Biodegradation, 2010, 21, 915–921 CrossRef CAS PubMed.
- A. B. Dalton and S. A. Nizkorodov, Environ. Sci. Technol., 2021, 55, 14586–14594 CrossRef CAS PubMed.
- Q. Zhong, H. Zhang, W. Bai, M. Li, B. Li and X. Qiu, J. Environ. Sci. Health, Part A: Toxic/Hazard. Subst. Environ. Eng., 2007, 42, 2111–2116 CrossRef CAS PubMed.
- D. Vasudevan and A. T. Stone, J. Colloid Interface Sci., 1998, 202, 1–19 CrossRef CAS.
- A. Owais, A. M. Djerdjev, J. M. Hook, A. Yuen, W. Rowlands, N. G. White and C. Neto, J. Mater. Chem. A, 2019, 7, 12713–12722 RSC.
- Y. Li, Y. Wen, L. Wang, J. He, S. S. Al-Deyab, M. El-Newehy, J. Yu and B. Ding, J. Mater. Chem. A, 2015, 3, 18180–18189 RSC.
- S. Yadav, N. Choudhary, S. Bhai, G. Bhojani, S. Chatterjee, B. Ganguly and A. R. Paital, ACS Appl. Bio Mater., 2021, 4, 6430–6440 CrossRef CAS PubMed.
- S. Yadav, N. Choudhary, M. Ranjan Dash and A. Ranjan Paital, Chem. Eng. J., 2022, 450, 138042 CrossRef CAS.
- S. Yadav, N. Choudhary, V. Sonpal and A. Ranjan Paital, Chem. Eng. J., 2023, 471, 144715 CrossRef CAS.
- S. Yadav, N. Choudhary and A. R. Paital, Carbon, 2023, 205, 527–539 CrossRef CAS.
- Z. Huang, X. Li, L. Mei, Y. Han, Y. Song, X. Fu, Z. Zhang, Z. Guo, J. Zeng, F. Bian, W. Wu, K. Hu and W. Shi, Adv. Funct. Mater., 2024, 34, 2404126 CrossRef CAS.
- R. K. Dubey, S. J. Eustace, J. S. van Mullem, E. J. R. Sudhölter, F. C. Grozema and W. F. Jager, J. Org. Chem., 2019, 84, 9532–9547 CrossRef CAS PubMed.
- Y. Huang, W. Zhang, H. Zhai and C. Li, J. Mater. Chem. C, 2015, 3, 466–472 RSC.
- A. Kumar, V. Kumar, S. Pandita, S. Singh, R. Bhardwaj, M. Varol and J. Rodrigo-Comino, J. Environ. Chem. Eng., 2023, 11, 109964 CrossRef CAS.
- F. Li and R. Sa, J. Mater. Chem. C, 2019, 7, 2443–2456 RSC.
- Y. Li, J. He, K. Zhang, T. Liu, Y. Hu, X. Chen, C. Wang, X. Huang, L. Kong and J. Liu, RSC Adv., 2019, 9, 397–407 RSC.
- H. S. Jung, P. S. Kwon, J. W. Lee, J. Il Kim, C. S. Hong, J. W. Kim, S. Yan, J. Y. Lee, J. H. Lee, T. Joo and J. S. Kim, J. Am. Chem. Soc., 2009, 131, 2008–2012 CrossRef CAS PubMed.
- S. Yadav, N. Choudhary and A. R. Paital, J. Mater. Chem. A, 2024, 12, 202–213 RSC.
- B. Wang, X.-L. Lv, D. Feng, L.-H. Xie, J. Zhang, M. Li, Y. Xie, J.-R. Li and H.-C. Zhou, J. Am. Chem. Soc., 2016, 138, 6204–6216 CrossRef CAS PubMed.
- Z. Zhou, H. Tang, S. Chen, Y. Huang, X. Zhu, H. Li, Y. Zhang and S. Yao, Food Chem., 2021, 343, 128513 CrossRef CAS PubMed.
Footnote |
| † Electronic supplementary information (ESI) available. See DOI: https://doi.org/10.1039/d4ma00862f |
| This journal is © The Royal Society of Chemistry 2024 |

