 Open Access Article
Creative Commons Attribution 3.0 Unported Licence
Optimization of a combined power plant CO2 capture and direct air capture concept for flexible power plant operation†
Edward J.
Graham
 a,
Moataz
Sheha
a,
Dharik S.
Mallapragada
*a,
Howard J.
Herzog
a,
Moataz
Sheha
a,
Dharik S.
Mallapragada
*a,
Howard J.
Herzog
 a,
Emre
Gençer
a,
Phillip
Cross
b,
James P.
Custer
Jr.
b,
Adam
Goff
b and
Ian
Cormier
b
a,
Emre
Gençer
a,
Phillip
Cross
b,
James P.
Custer
Jr.
b,
Adam
Goff
b and
Ian
Cormier
b
aMIT Energy Initiative, Massachusetts Institute of Technology, Cambridge, MA, USA. E-mail: dharik@mit.edu
b8 Rivers Capital, Durham, USA
First published on 15th May 2024
Abstract
Deployment of carbon capture and storage (CCS)-equipped fossil fuel power plants on the supply-side and direct air capture (DAC) technologies on the demand side can address the dual challenge of lower carbon emissions while providing grid flexibility. Here, we evaluate a flexible natural gas power plant concept with the potential for negative emissions that integrates calcium looping, membrane and cryogenic CO2 separation, and DAC. Process optimization is performed to determine the design and scheduling of the process for different scenarios of carbon prices, fuel prices and electricity prices. Positive net present values are achievable for the negative emissions power plant concept while retaining flexibility of the power plant and high capacity utilization of all CO2 capture related units, if the carbon price is at or above $150/tonne. In this case, we also substantiate the synergistic integration of the proposed concept, where: (a) the proposed process results in 52% higher NPV vs. a standalone calcium looping + DAC system and (b) 7% higher NPV, 3% higher negative emissions and 2% higher net power production vs. a decoupled process where the natural gas power plant flue gas is not used within the calcium looping + DAC system. Finally, we quantify the value of the proposed technology for power system decarbonization by analyzing its impact on the cost-optimal investment and operation of a stylized power system under different carbon prices. Results indicate that the inclusion of the proposed system at a carbon price of $150/tonne reduces system costs by 54% and CO2 emissions from 0.065 to −0.679 tonne CO2/MW h.
Broader contextVariable renewable energy (VRE) integration into the power grid and electrification of end-uses are key strategies for energy system decarbonization. These strategies, however, increase variability in energy supply and demand, which introduces operational challenges, thereby necessitating the role for operationally flexible, low-carbon grid-interactive technologies. In today's fossil fuel dominant grid, natural gas generators can operate flexibly to accommodate variability in supply from VRE and provide “firm” power to supply-constrained periods. In a decarbonized power system context, continued use of natural gas based power generation for “firm power” supply will require integration with flue gas carbon capture and sequestration (CCS) or emissions offsetting via approaches like direct air capture (DAC). Historically, CCS and DAC have been considered for deployment as standalone technologies without consideration to their operational flexibility and synergistic integration. Here we investigate CCS and DAC integration in the context of a flexible, low-carbon power generation process, using an integrated design and scheduling based optimization model. The modeling highlights how the proposed lime-based CCS system and lime-based DAC system could be cost-effective and provide system benefits (i.e. cost savings) under specific market conditions, characterized by electricity price, carbon price and natural gas prices. |
1 Introduction
Economy-wide decarbonization efforts are expected to heavily rely on wind and solar-based electricity generation to reduce CO2 emissions from the electric power sector as well as widespread electrification of many end-uses across transport, buildings and industry.1,2 Both these strategies will increase the spatial and temporal variability in electricity supply and demand that complicates system operations and requires enabling technologies to ensure cost-effective, low-carbon and reliable electricity supply. Recent studies evaluating deep decarbonization of power systems3–6 highlight the importance of relying on a broad suite of supply and demand-side technologies to provide flexibile system balancing and complement the low-marginal cost and intermittent nature of variable renewable energy (VRE) generation. On the supply side, this could include deployment of short and long-duration energy storage technologies, network expansion as well as deployment of firm low-carbon generation resources, such as carbon capture and storage (CCS) equipped fossil fuel power plants.On the demand-side, the deployment of distributed energy resources, demand flexibility and energy efficiency measures can be complemented by technologies capable of using electricity to reduce atmospheric CO2 emissions like direct air capture (DAC). Here, we evaluate the cost-effective design and operation of a power plant concept that combines flue gas CO2 capture with a DAC process in a way that enables flexible operation and negative emissions generation when integrated into a VRE-dominant power grid.
In general, integrating CO2 capture systems with a natural gas (NG) power plant changes power plant operating behavior by: (a) reducing plant energy efficiency due to energy consumption for CO2 capture7,8 and (b) potentially limiting the ability of the plant to adjust its output to respond to market signals, due to limited operational flexibility of CO2 capture systems and their often tight thermal coupling with power generation equipment.9 For instance, the state-of-the-art (SOA) CO2 capture approach based on amine-scrubbing is known to reduce power plant flexibility,10 and generally captures only 90% of the CO2 emissions. The design of flexible CCS-equipped fossil fuel power plants is therefore an important area of current research, whereby the capture system reacts to changes in the dispatch of the power plant (and consequently, inlet flue gas flow rate), and flexible operation leverages the variability in the electricity price to maximize profit. Typical methods proposed to facilitate flexible operation in the case of amine-based CO2 capture processes include solvent storage, exhaust gas venting (decoupling energy generation from CO2 capture at peak electricity prices), and time-varying solvent regeneration (accumulating CO2 in the solvent at peak electricity prices).11–14 The requirement for flexible carbon capture and storage (FLECCS) motivated the funding for a number of projects under the ARPA-E FLECCS program15 that enable power generators to be responsive to grid conditions in a high VRE penetration environment.16–18
The challenges of designing flexible CCS-based power generation schemes makes it interesting to consider DAC systems that, in principle, allow for separating the CO2 capture step and dispatchable power generation step across both space and time. As a standalone system, DAC could be operated in a baseload manner to utilize electricity from the grid to capture atmospheric CO2. In turn, the captured CO2 can be used to offset emissions from flexible and sparing operation of NG power plants in a VRE-dominant grid, and effectively achieve the same overall emissions outcomes. A major drawback of this approach, however, is that the CO2 is captured from a source with two orders of magnitude lower CO2 concentration than the flue gas exhaust of a modern NG combined cycle power plant (around 400 ppm vs. 4 vol% CO2 concentration), which is likely to substantially increase the cost of CO2 capture.
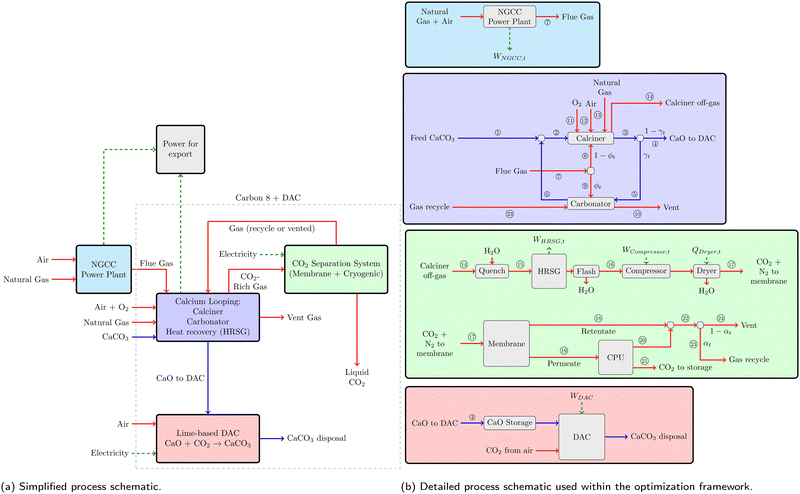
Here we explore the potential to integrate the DAC and power plant CO2 capture processes in a way that allows for balancing cost of CO2 capture while maintaining flexible power plant operations. Fig. 1a summarizes one manifestation of the concept, that combines commercially available Ca-looping technology and electricity based CO2 purification processes with emerging processes for lime-based DAC. The calcium loop is used to separate CO2 from the power plant flue gas exhaust, with CaO being the chemical sorbent, that has a relatively low energy penalty of CO2 capture and is a cheaper sorbent compared to alkanol-amines. The calciner produces CaO, which can be used in the DAC process (named Calcite) to capture CO2 from the atmosphere in a semi-batch manner with use of intermediate solid storage to maximize DAC capacity utilization. The O2 composition in the feed gases to the calciner is limited to below 30%, which enables the use of air-fired rotary kilns that are readily available at the current time and allows for the use of power plant flue gas as a primary source of O2 for combustion. Prior to sending it to DAC, CaO from the calciner is cycled a few times to capture CO2 from the process streams, which have a relatively high CO2 composition compared to air, in the carbonator at high temperatures (≈600C). The calciner off-gas, which contains CO2 from flue gas, natural gas combustion and feed limestone, has a relatively high concentration (>30%) and thus can be purified via electrically-driven membrane and cryogenic separation units to produce a high purity liquid suitable for sequestration and a vent gas stream that may be recycled for additional CO2 recovery. The major process units (DAC, calciner and separation system) in Fig. 1 can operate continuously to handle the feed CaCO3 even at zero NGCC plant loadings, meaning that the process can operate flexibly in response to variations in the flue gas feed. The unit operations for CO2 separation and purification rely on electricity rather than heat (via steam) as the primary energy input, which enables fully decoupling the CO2 capture stage from the power plant operations. This is in contrast to amine-based CO2 capture, where steam for amine regeneration is generally sourced from the Rankine cycle for power generation to maximize overall system efficiency. The advantages of using Ca-looping technology over the conventional alkanolamine-based processes are the relatively low energy penalty and relatively cheap sorbent. Finally, another advantage of integrating calcium looping with DAC is that lime hydration reverses sorption degradation that is known to occur with repeated looping,19 allowing for high CaO conversions within the DAC system independent of CaO degradation within the calcium loop.
The concept of integrating flexible calcium looping for CO2 capture in power plants, as explored in prior studies such as Criado et al.20 and Cheng et al.,21 modeling, provides foundational insights into CCS technologies' integration with power generation. In our work, the choice of calcium looping for flue gas CO2 capture is informed by these studies, but we introduce a novel aspect by employing an air-fired calciner. This choice is driven by the greater availability and technological readiness of air-fired systems compared to those requiring high-purity oxygen. However, using air in the calcination process necessitates a more complex membrane and cryogenic separation system to handle the resultant gas mixtures, as detailed in Sheha et al.22 Our approach, while presenting certain operational complexities, offers potential cost-effectiveness and feasibility benefits, especially when integrated with a DAC system. Previous work, such as the FlexiCal system discussed by Arias et al.,23,24 has demonstrated the economic viability of flexible calcium looping CO2 capture, where sorbent storage and thermal integration with power plants lead to significant cost reductions in CO2 avoidance. Moreover, the integration of calcium looping with cement production, as seen in studies by Lena et al.,25 Dean et al.26 and Rodriguez et al.27 presents an innovative use of spent sorbents, further enhancing the economic attractiveness of the process. The known decrease in CaO sorption capacity with repeated calcination and carbonation cycles28 is a critical consideration in these systems. By utilizing these insights, our proposed system aims to optimize the balance between technological feasibility, economic viability, and environmental impact.
The process of Fig. 1 involves several potential heat and mass interaction between different unit operations that can be optimized to maximize profitability while simultaneously considering the effect of these interactions on the dynamic operation of the power plant in response to volatile electricity prices. Although there is extensive literature on techno-economic analysis of amine-based CO2 capture at power plants, several studies focus on analysis under steady-state plant operation29,30 which ignores the techno-economic impact of increased power plant cycling in grids dominated by VRE generation and rapidly changing electricity prices. Other techno-economic assessments of CCS-equipped power plants rely on a multi-period optimization approach to study the cost implications of flexible operation of various units as well as sizing decisions related to CO2 capture and power generation equipment under various electricity price, CO2 price and fuel price scenarios.12,31–33 Here, a common approach involves formulating an optimization model that evaluates operations over multiple time periods over the year with a given set of electricity prices to maximize profits. Zantye et al.13 conducted profit maximization on a flexible monoethanolamine-based carbon capture process, and considered uncertainty in the hourly electricity prices by formulating a multi-stage stochastic optimization problem. To balance accuracy against computational tractability, these studies and others focused on design of fuel production processes using electricity,34–36 make several approximations such as: (a) considering only a subset of design considerations as model decision variables,12,33 (b) simplified representation of operational dynamics of each unit in the process,12,32,36 (c) limiting number of operational periods evaluated within the optimization model31,37 and (d) developing surrogate models to reduce the computational complexity of the equations present in the optimization problem.13 To date, nearly all but one33 of the techno-economic studies on flexible CCS plant operations have focused on studying solvent-based CO2 capture processes and generally involve fewer design degrees of freedom as compared to the process of Fig. 1.
In this work we evaluate the optimal plant design and operational schedule of the proposed negative-emissions power plant concept with respect to different market scenarios38,39 corresponding to different combinations of natural gas prices, electricity price profiles and carbon prices, adapted from a recent U.S. department of energy research program on flexible carbon capture.15 Our analysis is based on developing a generalized design and scheduling based optimization framework that balances accuracy with computational tractability by incorporating: (a) nonlinear cost and performance characterization of key unit operations via developing surrogate models (b) consideration of alternative process integration schemes via a superstructure representation approach using binary variables and (c) representation of temporal variability in electricity prices, within the design optimization using a time-series clustering techniques. Through this framework, we find that the proposed negative-emissions power plant concept generally can achieve positive net present values under scenarios with carbon prices near or above $150/tonne, with the role of DAC and negative emissions growing with carbon price. Importantly, the optimized system is shown to be capable to adapt to time-varying electricity prices via maximizing power exports during times of high prices and becoming a net importer at times of low prices, all while maintaining high capacity utilization of the capital-intensive units downstream of the power plant. We also show the value of the synergistic integration between the DAC and CO2 capture system wherein the combined process has greater NPV than the process where flue gas from the NGCC plant is not used in the Ca-loop or the standalone DAC process.
In contrast to the fixed electricity price series optimization, we also use a capacity expansion model (CEM) based analysis40,41 to quantify the value of the proposed technology from a power systems perspective. This approach analyzes economic benefit of integrating the proposed system along with a stylized power system consisting of VRE generation (wind and solar), standalone NGCC, and battery storage. This method provides a more comprehensive understanding of the plant's performance in a dynamic energy market, considering not only variations in power demand but also VRE resource availability. In extending our analysis through a CEM framework, the integration of the proposed technology significantly lowers operational costs compared to scenarios without it at carbon prices above $100/tonne. It also enhances the efficiency of VRE utilization at specific carbon prices, evident in the reduction of curtailment rates at a carbon price of $150/tonne. Environmentally, the addition of the proposed technology leads to a transition from positive to negative emissions, highlighting its potential in climate change mitigation. Economically, a power system that includes the proposed technology becomes cost-competitive with a power system without the technology at a carbon price of $116/tonne, and subsequently begins generating net revenue at higher carbon prices, indicating its financial viability in carbon-priced markets. These outcomes emphasize the proposed technology's operational efficiency, environmental benefits, and economic feasibility in varying market scenarios.
The rest of the paper is structured as follows: Section 2 provides a description of the net-present value (NPV) maximization problem and the methods used in its construction, with details provided in the ESI.† Section 2.5 summarizes specific implementation details for the optimization problem. Section 2.6 provides a description of the market scenarios developed as part of the ARPA-E FLECCS program. Section 3 presents the optimal design and operational schedule of the plant under the different market scenarios and different operational constraints, as well as the performance of the proposed system when coupled with other energy generation and storage facilities. Finally, Section 4 summarizes the overall work and highlights the key findings.
2 Methods
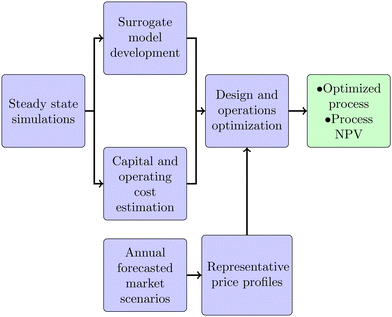
The design and scheduling optimization of the proposed process of Fig. 1 relies on the steady-state modeling of the process conducted by Sheha et al.,22 who developed an Aspen simulation of the process and identified a number of key operational degrees of freedom for the process. The overall workflow is summarized in Fig. 2, where details of each step are provided below and in the ESI.†2.1 Optimization model summary
Eqn (1) summarizes the overall optimization model, where the objective is to maximize the project net present value (NPV) of the proposed flexible carbon capture process for a given market scenario M.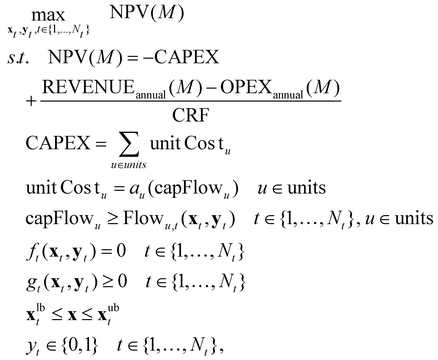 | (1) |
Process model constraints are described in ESI,† Section S1. The constraints relating the decision variables with the various terms of the net present value NPV objective are described in the ESI† (Section S2). Since the cost of each process unit can scale nonlinearly with respect to their corresponding capacity variables, a piecewise linear approximation is used to approximate the capital cost of each aggregated process unit as a function of its sizing variable, as described in ESI,† Section S2.1. Fig. 1b provides a more detailed schematic of the process model used within the optimization framework along with stream numbers.
2.2 Surrogate model for unit operations
For the purpose of global optimization, surrogate models are developed based on the detailed Aspen Plus model developed by Sheha et al.22 to describe unit-level operational constraints. In most cases, linear correlations are developed based on sensitivity analyses on the Aspen Plus model (e.g., the relationship between the flowrate of flue gas exhaust from natural gas power plant and the feed natural gas flowrate is described by eqn (S4) in the ESI†). As an example, for the membrane process unit (see Section S6 of the ESI†), reduced-order functions are generated using the ALAMO (automated learning of algebraic models) software.42 The surrogate model is developed from the membrane model, which employs the cross-plug flow assumption and consists of a set of coupled ordinary differential equations. An adaptive sampling functionality is employed in order to avoid over-fitting of the model outputs. As illustrated in Fig. 3, the reduced order model outputs regarding the mole fraction of CO2 in the retentate and permeate streams (yCO2,ret and yCO2,perm) and the stage cut (θ) compare well against the outputs of the system of differential equations describing the unit, over a broad range of independent variables (feed pressure P, dimensionless area![[small sigma, Greek, macron]](https://www.rsc.org/images/entities/i_char_e0d2.gif) and feed CO2 mole fraction yCO2,f). Moreover, the reduced-order models are quadratic in the independent variables (ESI,† eqn (S142) and (S143)) and are suitable for use within the global optimization problem due to their low numerical complexity.
and feed CO2 mole fraction yCO2,f). Moreover, the reduced-order models are quadratic in the independent variables (ESI,† eqn (S142) and (S143)) and are suitable for use within the global optimization problem due to their low numerical complexity.
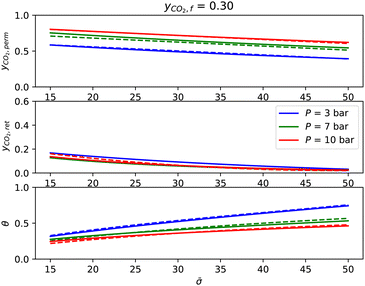 | ||
Fig. 3 Performance of the membrane surrogate model (dashed lines) with respect to the solution to the ordinary differential equation (ODE) model (continuous lines) at feed mole fraction yCO2,f = 0.3. yCO2,perm is the mole fraction of CO2 in the permeate, yCO2,ret is the mole fraction of CO2 in the retentate, θ is the stage cut, and ![[small sigma, Greek, macron]](https://www.rsc.org/images/entities/i_char_e0d2.gif) is the dimensionless membrane area divided by the feed pressure. See ESI,† Section S6 for further details. is the dimensionless membrane area divided by the feed pressure. See ESI,† Section S6 for further details. | ||
2.3 Modeling CaO degradation during Ca looping
As highlighted in the introduction, CaO degradation is an important phenomena to consider when modeling calcium looping processes. In Section S4 of the ESI,† we derive an analytic equation (ESI,† eqn (S128)) for the conversion of CaO within the carbonator as a function of the solids split fraction γ, where γ is the fraction of solids exiting the calciner that are sent to the carbonator (the other portion 1 − γ is sent to the direct air capture unit). This equation is developed based on experimental data28 for a particular limestone source and particle size. In ESI,† Fig. S2 we show how the average CaO conversion decreases nonlinearly with γ.2.4 Model temporal reduction
To reduce the number of operational time periods to be modeled to capture time-varying electricity prices, we model plant operations over representative days at an hourly resolution. For each electricity price scenario evaluated, the representative days are sampled using a k-means clustering algorithm43 that maps each day to a representative day. The methodology is described further in the ESI† (Section S5), where we also highlight how 30 representative days provide a good balance of accuracy and computational speed (see Fig. S3 in the ESI†). Example outputs from the k-means clustering algorithm applied to the electricity price profile in the MiNg $150 PJM and BaseCaseTax $60 market scenarios (explained in Section 2.6) is shown in Fig. S4 and S5 of the ESI,† respectively. Notice that the representative day selected and weights for the representative day are unique to each electricity price scenario.2.5 Implementation
The overall optimization problem (1) is a non-convex mixed-integer nonlinear program (MINLP), where all nonlinear terms in continuous variables are bilinear, and is solved to global optimality. In our optimization, Gurobi44 addresses bilinear terms through spatial branching, where it prioritizes branching on variables within violated bilinear constraints to reduce the McCormick relaxation volume. This strategy, combined with a selection of branching values that avoids numerical pitfalls, enhances the solver's efficiency in converging to a global optimum. The optimization problem is formulated in Pyomo,45,46 and Gurobi 9.5.244 is used as the global MINLP solver. Each optimization is run for 3 days on the MIT supercloud47 using 48 Intel Xeon Platinum 8260 cores. The presolved model consists of 93![[thin space (1/6-em)]](https://www.rsc.org/images/entities/char_2009.gif) 589 constraints (of which 14
589 constraints (of which 14![[thin space (1/6-em)]](https://www.rsc.org/images/entities/char_2009.gif) 400 are bilinear constraints), 37
400 are bilinear constraints), 37![[thin space (1/6-em)]](https://www.rsc.org/images/entities/char_2009.gif) 433 continuous variables and 1449 binary variables.
433 continuous variables and 1449 binary variables.
2.6 Overview of market scenarios
We evaluate the optimal process design and economic outlook for various market scenarios developed as part of a flexible carbon capture research program managed by U.S. Department of Energy (ARPA-E FLECCS‡). As described elsewhere, the market scenarios were developed based on outputs from electricity sector capacity expansion models for different regional, technology and policy scenarios.38,39 For example, one set of scenarios38 labeled MiNg (mid-natural gas price) consists of four energy market regions in the USA (CAISO, ERCOT, MISO-W, and PJM-W). A summary of the market scenarios evaluated in this work is presented in Table 2. In general, these different tax scenarios are representative of different energy market regions in the USA. We assume that our process is a price-taker in the energy market, i.e., the electricity prices are independent of the net power produced or consumed by the system. The electricity price profiles across the market scenarios, representative of future VRE-dominant grids, present a significant challenge in operating natural gas power plants with CCS profitably since there are numerous hours when the electricity price is zero, e.g., in the MiNg $150 ERCOT scenario the electricity price is approximately zero for 5178 out of 8760 hours (60%) of the year.3 Results
The results section is categorized as follows. In Section 3.1 we clarify the fixed parameters that are common amongst all case studies. In Section 3.2 we briefly discuss some key process optimization variables. In Section 3.3, we describe results for the various market scenarios and explain how the elements of the market scenario affect the net present value of the project. In Section 3.4, we isolate the impact of carbon prices on the model outcomes. In Section 3.5, we quantify the synergy of coupling DAC and flue gas CO2 capture, by comparing the economics of the coupled NGCC, Carbon8 and DAC case with a case where NGCC flue gases are not incorporated into the calcium loop, and a case where the Carbon8 and DAC system operates without an NGCC plant. Finally, in Section 3.6 we assess the value of the proposed technology by comparing its impact on the cost-optimal investment and operation for a stylized power system under different carbon prices.3.1 Fixed parameters
In all results presented here, we fix the NGCC power plant capacity to be 740 MW (WPP,CAP = 0.74 GW), ref ESI,† eqn (S2) and (S3) and bound the calciner capacity to be less than or equal to the design flow rate considered in the steady-state Aspen simulation model (i.e. capFlowmax,calciner ≤ 17 MMol/h), described elsewhere.22 These two assumptions ensure that the system does not reach infinite size at high carbon prices, and the flowrate is similar to that of a calcium looping system that does not produce CaO as a by-product.§ In all cases apart from those presented in Section 3.5, it is assumed that all flue gas enters the calcium loop (via either the calciner/carbonator). This ensures that the capture system is always built if the NGCC is operational. We implement a storage constraint for the DAC system, stipulating that storage levels must return to their initial state after each 24-hour period. This cyclical approach simplifies the representation of storage dynamics without losing the seasonal variations captured by the electricity price profile. Furthermore, we choose 30 representative days to provide a good balance between accuracy and computation time (see Fig. S3, ESI†).3.2 Overview of process decision variables
The main design variables, such as the fresh CaCO3 flow rate and flue gas fraction to the calciner, are crucial in determining the system's performance. Table 1 summarizes the potential operating ranges and significance of each key variable on the process. For a more detailed explanation of the effect of process decision variables, the reader is referred to our previous work.22| Design variable | Main effects on the process upon increasing its value |
|---|---|
| Fresh CaCO3 flow rate (stream 1 in Fig. 1b) | 1. Directly proportional to the CO2 capture from DAC. |
| 2. Increases the size of the calciner and the carbonator. | |
| 3. Increases the purity of CO2-rich gas before the membrane (stream 17 in (Fig. 1b)). | |
| 4. Increases the total power consumption of the system. | |
| Flue gas fraction to the calciner (ϕt in Fig. 1b) | 1. Decreases the oxidant and air requirements in the calciner (streams 11 and 12 in Fig. 1b, respectively). |
| 2. Increases the energy requirements for the separation system | |
| CaO fraction to the carbonator (γt in Fig. 1b) | 1. Decreases the size of the DAC system. |
| 2. Decreases the CaO conversion in the carbonator. | |
| Retentate and distillation gas recycle fraction (αt in Fig. 1b) | 1. Reduces CO2 emissions. |
| 2. Increases the size of the overall system. | |
3.3 Forecasted market scenarios
The optimal process NPVs for the 14 market scenarios are presented in Table 2. The carbon price in each scenario is applied as a tax on CO2 emissions (vented CO2) and a credit for DAC CO2 capture. The fuel price is fixed for each scenario and ranged from $1.12–2.94 MMBtu. Each scenario has a different electricity price profile, which is summarized by the average electricity price and percentage of zero electricity price hours. The correlations between NPV and specific market scenario parameters are shown in Table 3. Within these 14 scenarios, the carbon price has the strongest positive correlation with NPV (0.96). At a carbon price of $150/tonne, all scenarios have positive NPVs (MiNg $150 CAISO, MiNg $150 ERCOT, MiNg $150 NYISO and MiNg $150 PJM). This is promising since the 45Q enhancements in the US Inflation Reduction Act (IRA)48 indicates that a $180/tonne credit is applied for storage in saline geologic formations from DAC. Interestingly, zero electricity price is positively correlated with NPV (0.66). This is mainly due to the lower power-related operational expenditures for the capture plant, as explained in more detail in Section 3.4. Fuel price is negatively correlated with NPV as expected (−0.61).| Market scenario | Fuel price ($/MMBtu) | Average EP ($/MW h) | #Zero EP (% Zero EP) | NPV ($bn) | Rel. gap (%) |
|---|---|---|---|---|---|
| WinterNYTax $60 | 2.94 | 48.00 | 339 (3.9%) | −2.24 | 1.92 |
| BaseCaseTax $60 | 2.94 | 47.69 | 791 (9.0%) | −2.13 | 4.62 |
| HighSolarTax $60 | 2.94 | 45.43 | 1179 (13.5%) | −2.11 | 5.14 |
| HighWindTax $60 | 2.94 | 45.06 | 1605 (18.3%) | −2.08 | 4.49 |
| MiNg $100 ERCOT | 2.64 | 33.66 | 4048 (46.2%) | −1.77 | 0.88 |
| MiNg $100 MISO-W | 1.69 | 35.12 | 3300 (37.7%) | −1.10 | 1.29 |
| MiNg $100 PJM | 1.42 | 48.01 | 1352 (15.4%) | −0.56 | 0.49 |
| MiNg $100 CAISO | 2.26 | 52.97 | 2167 (24.7%) | −0.54 | 0.96 |
| MiNg $100 NYISO | 1.12 | 35.22 | 3161 (36.0%) | −0.48 | 1.25 |
| MiNg $150 ERCOT | 2.64 | 36.18 | 5178 (59.1%) | 1.06 | 3.14 |
| MiNg $150 MISO-W | 2.01 | 28.13 | 4560 (52.1%) | 1.44 | 0.86 |
| MiNg $150 CAISO | 2.26 | 45.35 | 2963 (33.8%) | 1.76 | 3.53 |
| MiNg $150 PJM | 1.43 | 49.81 | 2598 (29.7%) | 1.97 | 0.19 |
| MiNg $150 NYISO | 1.14 | 33.67 | 4472 (51.1%) | 2.26 | 2.01 |
| Parameter | Correlation with NPV |
|---|---|
| Carbon price ($) | 0.96 |
| Fuel price ($/MMBtu) | −0.61 |
| Average EP ($/MW h) | −0.28 |
| #Zero EP (% Zero EP) | 0.66 |
3.4 Sensitivity on carbon price
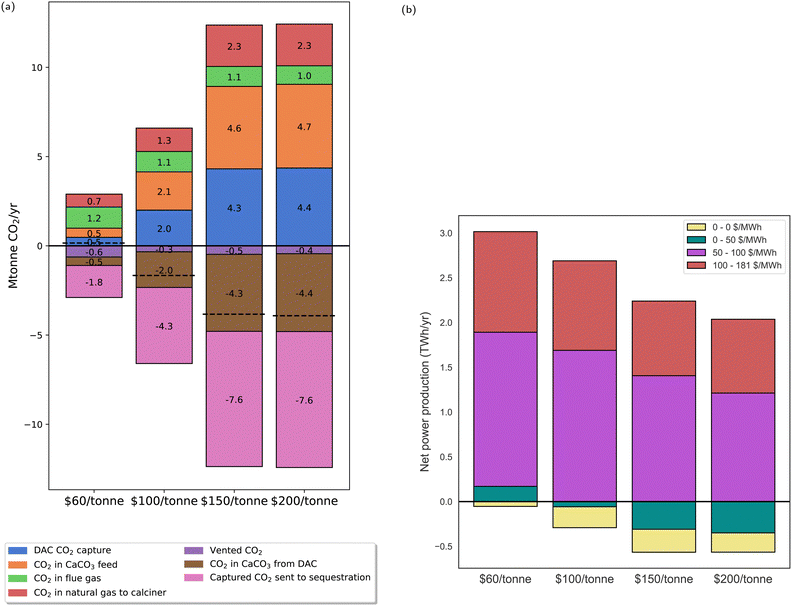
Carbon price was observed to have the strongest correlation to NPV for all market scenarios. Therefore, we elaborated on our analysis of the optimization model by varying the carbon price between 60, 100, 150 and $200/tonne while maintaining a fixed natural gas price ($1.43/MMBtu) and fixed electricity price profile (MiNG $150 PJM). In Fig. 4a, the NPV-optimal carbon balance for the overall system over yearly operation is shown. At $60/tonne, the system will not operate in a manner that yields negative CO2 emissions. The capture and DAC system reaches the capacity limit for total throughput at $150/tonne, indicating that the design and operation of the overall system will not change significantly at higher carbon prices. The relative proportion of sequestered CO2 to CO2 captured from the DAC unit at $150/tonne is 1.8, which is slightly above the range described in the DAC process developed by carbon engineering (1.3–1.5 tCO2 sequestered per tCO2 captured).49 As the carbon price increases, more CO2 enters the process as natural gas, calcium carbonate, and atmospheric CO2, while the amount of flue gas CO2 entering the process decreases only slightly. In Fig. 4b we show how the carbon price system influences the net power produced by the system in various electricity price bands. This illustrates that in general, power is produced when the electricity price is above $50/MW h, while it is consumed below $50/MW h. This cut-off price increases slightly with respect to the carbon price as reflected by the smaller amount of electricity generated in the $50–$100/MW h price band. At higher carbon prices, more power is consumed at low electricity prices (between 0 and $50/MW h), and less power is produced at high electricity prices (above $50/MW h). This is due to the increased power requirement of the various process units when processing larger amounts of feed CaCO3. In summary, our findings demonstrate a definitive shift in optimal process design when escalating the carbon price from $60 to $150/tonne. This shift notably deprioritizes power generation, instead favoring strategies that effectively generate negative emissions.Fig. 5 highlights the optimal plant dispatch at the different carbon prices. This is shown for four representative days to showcase the operational scenarios of full and partial loading of the NGCC plant. This is in contrast to the 30 representative days used in the NPV optimization problem, providing a more focused insight into the plant's operational behavior. As expected, the NGCC plant is operational at high electricity prices, off at low electricity prices, and operates at part-load at intermediate electricity prices (shown by the blue region in the power production subplot). At lower carbon prices of $60/tonne, the process power output varies from a maximum of 709 MW when the NGCC is operating at full capacity (740 MW) to a minimum of −13 MW when the NGCC is off. Thus, the CO2 capture results in 4% reduction in power plant output, which is in a similar range compared to other calcium looping processes that do not produce a large amount of spent CaO as a byproduct (6–8%50). This relatively low energy penalty of CO2 capture is due to the secondary source of power production in the HRSG after the calciner. Increasing the carbon price generally reduces the maximum power exported and increases the maximum power imported by the process due to increasing deployment of DAC for negative emissions generation. Consequently, the net power ranges from 663 (10% reduction in nameplate NGCC output) to −63 MW for the $100/tonne scenario and 609 MW (18% reduction vs. nameplate NGCC output) to −120 MW in the $150/tonne scenario. The reader is referred to Section S9 of the ESI,† for further information on this case study, including component flowrates for each stream corresponding to Fig. 1.
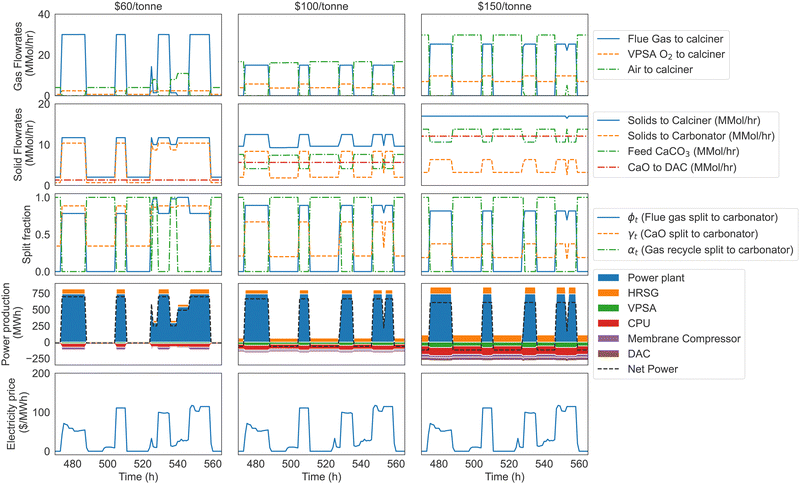 | ||
| Fig. 5 Optimal dispatch for the MiNG $150 PJM market scenario with varying carbon prices. The label at the top of each column refers to the carbon price. | ||
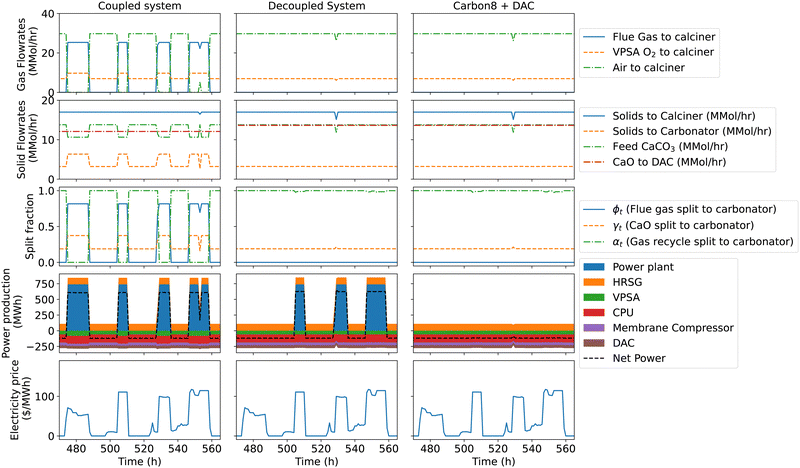
The subfigures labelled ‘split fraction’ in Fig. 5 show the optimal time trajectories of three process decision variables: (a) ϕ refers to the fraction of flue gas sent to the carbonator (the other portion 1 − ϕ enters the calciner), (b) γ refers to the fraction of CaO exiting the calciner that is recycled to the carbonator (the other portion 1 − γ enters the DAC unit) and (c) α refers to the fraction of gases exiting the membrane and cryogenic processing units that are recycled to the carbonator (the other portion 1 − α is vented). In the $100/tonne and $150/tonne carbon price scenarios, it is optimal to send approximately 80% of the flue gas to the carbonator (ϕ ≈ 0.8) when the NGCC is at full loading, while the remaining 20% of the flue gas is used as a high-temperature source of oxidant in the calciner. As the carbon price increases, the feed CaCO3 flowrate increases, driven by the increased negative emissions incentive. Thus, the extent of CaO recycling to the carbonator, reflected by γ, decreases with carbon price since a smaller proportion of CaO is required for CO2 capture in the carbonator. This effect is compounded by the decreased degradation of CaO at lower recycle rates (see ESI,† Fig. S2). In all cases, the recycled gases from the membrane and CPU units are vented at full NGCC loading (α = 0). This contrasts with optimal operation results reported for power generation with flexible carbon capture processes that are not coupled with DAC (see e.g., ref. 51), when at high carbon prices it becomes necessary to capture residual CO2 emissions. In this case, venting gases at full NGCC loading is more cost-effective than recycling them back to the carbonator since it reduces the overall CAPEX of the system, and it allows for a higher flowrate of CaO sent to the DAC unit, which offsets the emissions from vented CO2. An additional benefit of venting the recycled gases at full NGCC loading and recycling at zero NGCC loading is that there is less time variation in the solid and gas flowrates to the carbonator (see solid flow rate panels in Fig. 5). In Section S8 of the ESI,† we confirm that the NPV is lower when gases are recycled back to the carbonator during periods when the NGCC is off.
As shown in Fig. 5 and ESI,† Fig. S9, at carbon prices of $150/tonne and above, the input solids to the calciner is constant and equal to the fixed upper bound on the input flowrate of 17 MMol/h. The average capacity factors in the $150/tonne scenario for the calciner, carbonator, CPU, limestone mill, HRSG and DAC are 99%, 75%, 98%, 87%, 97% and 100% respectively over the yearly operation. Such high capacity factors are encouraging from a capital utilization perspective, since all units excluding the NGCC can be run continually regardless of the NGCC loading, with only small variations in unit operation. This is in contrast to the standard approaches to calcium looping operation that are typically load-following.52 In Fig. 5, the gas flowrates panel shows that flue gas to the calciner is substituted for air when the NGCC turns off. The oxygen stream from the VPSA is generated such that the inequality constraint on the maximum allowed oxygen concentration (0.3 mole fraction, ref. ESI,† eqn (S37)) of oxygen is binding at all times. This may imply that the process would be more profitable if the calciner design allowed for higher oxygen concentrations in the feed, thus reducing the cost of the downstream separation units.
Fig. 6b highlights the capital cost (CAPEX) and operating cost (OPEX) breakdown of the optimal process at different carbon prices, where it is clear that the calciner, NGCC plant, DAC, VPSA and compression before the membrane unit are the largest contributors to the total CAPEX under profitable operation. While the cost of standard units is approximated well, the cost of the DAC system is the most uncertain. Therefore, a further study was conducted to analyze the change in the project's net present value (NPV) when scaling the unit cost for the DAC system by ±20%. At a carbon price of $150/tonne, where the system is profitable, the change in capital investments for the DAC system would be ±53 million, equating to a 5.5% change in the NPV. Based on preliminary estimates of the specific land requirements of 0.6 km2 (MtCO2/year)−1,53 the total land requirement for the DAC system in this scenario is approximately 2.52 km2. Approximately 73% of the CAPEX for the direct air capture air contactor system are allocated to sorbent structuring. The remaining 27% covers material handling and the air contactor structure, including fans, conveyance, and buildings. In general, the cost of each unit increases with carbon price due to the increased processing of feed CaCO3. However, some units show a different trend due to nonlinearities present in the model. For example, the cost of the carbonator is highest in $60/tonne carbon price scenario due to a higher CaO conversion at lower CaO recycle rates.
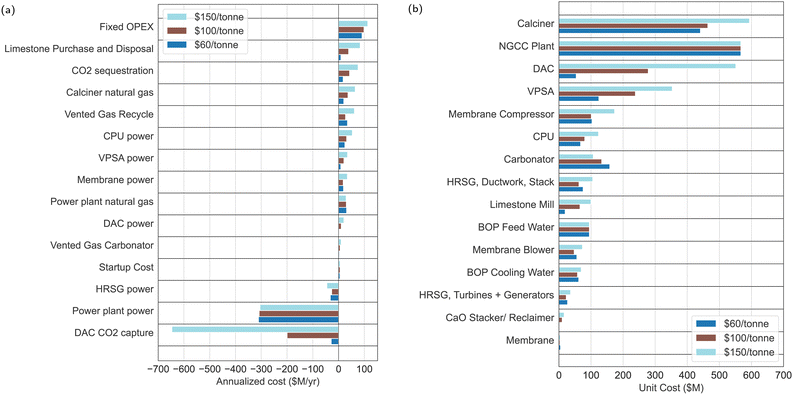 | ||
| Fig. 6 (a) Breakdown of OPEX for the MiNG $150 PJM market scenario with varying carbon prices. Negative values for annualized cost correspond to process revenues. (b) Breakdown of CAPEX for the MiNG $150 PJM market scenario with varying carbon prices. The unit costs shown here include not only the base cost for the equipment, but also direct labor, bare erect cost, engineering, construction management, home office & fees (Eng'g CM, H.O. & Fees). See Fig. S11 in the ESI,† for flowrates to each unit at maximum capacity. | ||
Fig. 6a shows that the cost of limestone purchase and disposal makes up a large proportion of the process OPEX. These costs could potentially be reduced by recycling CaCO3 exported from the DAC unit back into the process (recycling the CaCO3 disposal stream back to stream 1 in Fig. 1b). However, since the carbon price is relatively high compared to the purchase + disposal cost ($60–150/tonne vs. $8/tonne assumed in this work) this modification would result in a small difference in the process NPV, and would require further experimentation to determine how to incorporate the CaCO3 particles produced in the DAC unit into the calcium loop. Recycling CaCO3 from the DAC unit, however, may be become imperative in scenarios where there are constraints on the availability of feed CaCO3 at a given location. For example the optimal design of the MiNG $150 PJM scenario requires 10.5 Million metric tons per year of feed CaCO3 (see Table 4), which is around 1% of the North American limestone market volume in 2021 (1159.10 Mt54). Building on our previous work,22 which focused on the large-scale implementation and its potential implications, it is evident that the availability of fresh limestone and land area, particularly for the DAC system, are crucial factors affecting the scalability of such facilities. Our earlier study highlighted the need for a carbon credit of at least $170/tonne CO2 to ensure profitability under average US electricity prices, taking into account the incentives provided by policies like the US Inflation Reduction Act of 2022. The land utilization and logistics aspects, particularly the requirement for proximity to limestone sources and the role of transportation infrastructure, highlight the importance of strategic planning and location selection for such large-scale operations. This previous research complements the current findings by providing a broader perspective on the operational and logistical challenges faced when scaling up carbon capture technologies.
| Case study → carbon price | $/tonne | Coupled system | Decoupled system | Carbon8 + DAC | |||||||||
|---|---|---|---|---|---|---|---|---|---|---|---|---|---|
| 60 | 100 | 150 | 200 | 60 | 100 | 150 | 200 | 60 | 100 | 150 | 200 | ||
| a CO2 capture rate excluding DAC as a fraction of CO2 input to the system (the total CO2 that enters the system, including CO2 present in calcium carbonate and natural gas). Coupled system refers to the integrated NGCC Carbon 8 + DAC system with flue gas entering the calcium loop. Decoupled system refers to the NGCC Carbon 8 + DAC system where flue gas is vented. Carbon 8 + DAC refers to the standalone Carbon 8 + DAC system without the NGCC plant. b In these cases, both the CO2 emissions and net power are negative. | |||||||||||||
| Carbon8 + DAC deployed? | Yes | Yes | Yes | Yes | No | No | Yes | Yes | No | No | Yes | Yes | |
| NPV | $bn | −0.600 | −0.200 | 1.966 | 4.314 | 0.995 | 0.442 | 1.829 | 4.129 | 0 | 0 | 1.285 | 4.209 |
| Fraction of hours NGCC on | — | 0.552 | 0.521 | 0.516 | 0.489 | 0.531 | 0.520 | 0.491 | 0.460 | 0 | 0 | 0 | 0 |
| NGCC power | TWh/year | 3.472 | 3.362 | 3.286 | 3.053 | 3.419 | 3.363 | 3.167 | 2.977 | 0 | 0 | 0 | 0 |
| Net power | TWh/year | 3.214 | 2.764 | 2.205 | 1.967 | 3.419 | 3.363 | 2.166 | 1.952 | 0 | 0 | −1.001 | −1.025 |
| CO2 capture efficiencya | — | 0.740 | 0.927 | 0.940 | 0.945 | — | — | 0.994 | 0.992 | — | — | 0.994 | 0.992 |
| Net CO2 emissions | Mtonne/year | 0.155 | −1.663 | −3.832 | −3.918 | 1.159 | 1.139 | −3.727 | −3.830 | 0 | 0 | −4.801 | −4.838 |
| Feed CaCO3 | Mtonne/year | 1.170 | 4.876 | 10.496 | 10.645 | 0 | 0 | 11.814 | 11.908 | 0 | 0 | 11.814 | 11.908 |
| Specific CO2 emissions | kgCO2/MW h | 48 | −602 | −1738 | −1992 | 339 | 339 | −1721 | −1962 | — | — | 4796b | 4720b |
| Upper bound | $bn | −0.593 | −0.200 | 1.97 | 4.378 | 0.995 | 0.442 | 1.858 | 4.169 | 0 | 0 | 1.313 | 4.250 |
| Abs. gap | $bn | 0.007 | 0 | 0.004 | 0.064 | 0 | 0 | 0.029 | 0.041 | 0 | 0 | 0.029 | 0.041 |
| Rel. gap | (%) | 1.186 | 0 | 0.186 | 1.495 | 0 | 0 | 1.579 | 0.99 | — | — | 2.243 | 0.971 |
3.5 Synergy of coupling flue gas CO2 capture and DAC
To further explain the synergistic effect of coupling NGCC power production, flue gas CO2 capture and direct air capture, two further case studies are analyzed and compared to the “coupled system” used in Sections 3.3 and 3.4. The two other case studies are defined as follows:1. “Decoupled system”: in this scenario, the flue gases from the NGCC (as identified in stream 7, Fig. 1b) are released into the atmosphere, incurring a carbon price. This setup exemplifies a co-located arrangement where an NGCC power plant and a Carbon8 + DAC facility operate in proximity. While they are not integrated in terms of thermal or mass exchange, they are connected electrically. Consequently, the Carbon8 + DAC system is not subject to significant fluctuations in flue gas flow rates.
2. “Carbon8 + DAC system”: in this case, the system is simply the Carbon8 + DAC facility, that imports electricity from the grid to support operations. There is no NGCC but the carbonator still exists to capture CO2 from the Carbon 8 calciner via the CO2 recycle from the CPU.
Fig. 7 highlights the optimal plant dispatch for the three systems over 4 representative days under the MiNG $150 PJM market scenario. The operational dynamics of both the decoupled system and the Carbon8 + DAC system closely mirror those of the coupled system during periods of low electricity prices when the NGCC is inactive. However, a notable difference is observed in the coupled system: it exhibits a reduced CaO flow rate to DAC, attributable to a higher average CaO recycle rate to the carbonator. In the decoupled system and Carbon8 + DAC system, all sections of the capture plant operate at a constant rate regardless of the electricity price, which, from an operational perspective, is advantageous over the coupled system. Note that in the decoupled system, it is still optimal to build a carbonator in cases where no flue gases enter the system, in which case the carbonator only operates to capture recycled CO2 from the membrane and CPU units. In Table 4 we show a comparison of the optimized results for the three case studies. When modeling the decoupled system, the Carbon8 + DAC system is not built at carbon prices of $60/tonne and $100/tonne, and therefore the NPV decreases by 56% (0.995 to 0.442 $ bn) between carbon prices of $60/tonne and $100/tonne, primarily due to the increased cost of venting CO2 to the atmosphere. Similarly, the Carbon8 + DAC system is not deployed at carbon prices of $60/tonne and $100/tonne in the system without an NGCC plant. However, at a carbon prices of $150/tonne and above, the Carbon8 + DAC system is built in all cases (coupled system, decoupled system and Carbon8 + DAC system without NGCC). The NPV and process design outcomes for three process cases in Table 4 suggests that at carbon prices of $60/tonne and $100/tonne, it is optimal to operate the NGCC plant without CO2 capture (decoupled system without Carbon8 + DAC deployment), where the near 50% capacity utilization of the power plant makes it more economical to incur the penalty of CO2 emissions rather than investing the available CO2 capture technology. In contrast, at carbon prices of $150/tonne, the coupled system yields the maximum NPV which is $137 M higher compared to the decoupled system ($1.966 bn vs. $1.829 bn respectively) as well as $681 M higher than that of the system without NGCC. This quantifies the benefit of synergistic integration between the Carbon8 + DAC system and the NGCC plant. It is also interesting to note that coupled system results in 3.7% greater utilization of the NGCC power and 1.8% greater net power exports in the $150/tonne scenarios as compared to the decoupled system, while at the same time producing greater negative emissions. This result is a direct consequence of mass and thermal integration between the NGCC power plant and the Carbon8 + DAC system, notably in the use of flue gas rather than air for O2 supply for the calciner. When compared to the Carbon8 + DAC facility alone (“Carbon8 + DAC” in Table 4), the coupled system is able to reduce the average cost of energy requirement for DAC by avoiding power purchases during periods of high electricity prices.
The slightly lower NPV for the decoupled system compared to the coupled system in the $150/tonne carbon price scenario can be explained by a few competing effects, as shown in Fig. 8a and b. First, the decoupled system has a large carbon tax ($160 M/year) for venting CO2 to the atmosphere, but in the coupled system it is still economical to vent some of the recycled gases from the membrane and CPU separation systems, amounting to $60 M/year in tax for venting recycled gases. Second, the net amount of CO2 captured by the DAC facility in the decoupled system is higher in the coupled system since less CaO is recycled to the carbonator and hence more CaO is available for DAC. However, due to the higher amount of vented CO2, the decoupled system results in 3% smaller net negative CO2 emissions than the coupled system in the $150/tonne case. Third, the capital expenditure for the carbonator is higher in the coupled system due to the increased solids requirement for flue gas CO2 capture. Collectively, these factors explain the lower NPV for the decoupled system vs. the coupled system.
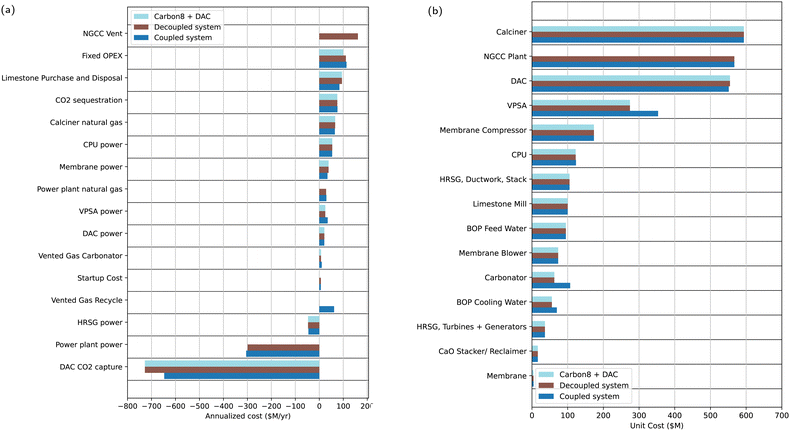 | ||
| Fig. 8 (a) Breakdown of OPEX for the MiNG $150 PJM market scenario with varying carbon prices. (b) Breakdown of CAPEX for the MiNG $150 PJM market scenario with varying carbon prices. The unit costs shown here include not only the base cost for the equipment, but also direct labor, bare erect cost, Eng'g CM, H.O. fees and project contingencies. The molar feed flowrate for each major unit operation at maximum capacity is shown in ESI,† Table S11. | ||
3.6 Power system based valuation
While the above analysis quantifies the value of the proposed technology, it has two main limitations: (a) the price-taker assumption (i.e. electricity prices are unaffected by operation or investment in the proposed technology) may not be reasonable when technology is deployed at scale and (b) the analysis does not provide a comparative view of the proposed technology with other grid resources relevant for decarbonization like energy storage and VRE generation. To address these limitations, here, we describe a capacity expansion model (CEM) based analysis of the proposed technology in the context of a stylized power system, defined loosely based on demand and VRE resource profiles from the PJM region in the US (see ESI,† Section S3 for more details). The CEM based analysis includes a portfolio of power generation technologies besides the proposed technology: wind, solar, stand-alone natural gas with combined cycle (NGCC), and battery storage. Formulated as a cost minimization problem, the CEM evaluates the cost-optimal sizing and operational deployment of each technology to satisfy a power demand curve in the PJM-West region. By solving the resulting CEM with and without the proposed technology for different carbon price scenarios, we are able to isolate its system value and competition vs. other grid resource relevant for decarbonization.The following key assumptions are used for this analysis:
• The demand curve, CAPEX and OPEX assumptions for the various technologies are for the PJM-West region with base year 2030.55
• Demand is scaled such that the maximum demand is 1 GW.
• In cases where our system (NGCC + Carbon8 + DAC) is included, the system is sized for a 740 MW NGCC power plant as used throughout the paper.
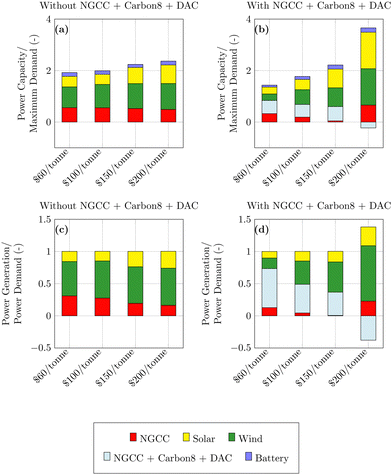
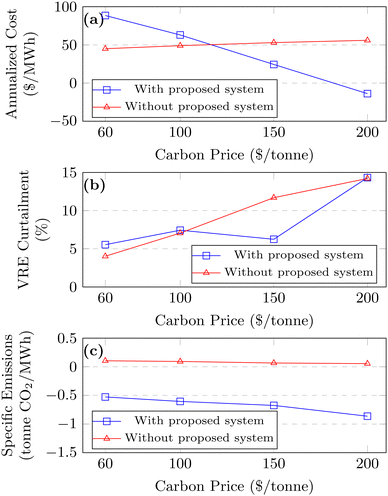
In Fig. 9, the comparative analysis delineates the influence of the NGCC + Carbon8 + DAC system on power capacity and generation under varying carbon price scenarios. Without the integrated system (Fig. 9(a) and (c)), there is a consistent rise in wind and solar contributions, reflecting the economic benefit of increasing renewable energy deployment upon rising carbon costs. As has been shown elsewhere,4,56 we also note that total installed capacity substantially exceeds peak demand, with the extent of “overbuilding” of VRE capacity increasing with carbon price owing to declining capacity value of VRE resources. The introduction of the proposed technology (Fig. 9(b) and (d)), however, reshapes the power system capacity and generation mix in the following ways. At a $60/tonne carbon price, the NGCC + Carbon8 + DAC integration decreases wind, solar and NGCC capacity, demonstrating the preference of deploying FLECCS system for the majority of the power generation (61%). As carbon pricing increases to $150/tonne, standalone NGCC is displaced almost entirely with the other generating technologies, with a small increase in battery storage capacity to deal with power fluctuations. This highlights the system's cost-efficiency and carbon capture effectiveness in a high carbon cost environment. Notably, from $150 to $200/tonne, there is an unexpected increase in standalone NGCC, wind, and solar capacities and generation. This adjustment is necessitated to maintain power supply whilst also driving the DAC system, which at $200/tonne carbon price, achieves a level of operation where it maximizes revenue through carbon tax credits, offsetting its costs and contributing to negative emissions. In effect, at $200/tonne, the integrated system deployment is primarily for its negative emissions value rather than its value as a power generator. This observation reflects the operational flexibility of the proposed technology, which not only supports the power grid with firm generation capacity but also is capable of serving as negative emissions resource at higher carbon prices. The integrated system thus emerges as a key enabler for balancing power generation needs with environmental imperatives, particularly in scenarios where carbon pricing heavily influences the market dynamics. These results are broadly consistent with those seen in the price-taker analysis described earlier, which highlighted increasing role of DAC at carbon prices above $150/tonne (Fig. 4a). Fig. 10 compares the power system cost, VRE curtailment and emissions intensity of the current CEM with and without the integrated technology. We first note that the annualized cost ($/MW h) of the system with the deployment of the proposed technology is only lower than the system cost without its deployment at carbon prices above $100/tonne (more specifically $116/tonne in Fig. 10(a)). This suggests that the proposed technology is cost-effective to deploy at above $100/tonne which is consistent with the findings from the price-taker analysis described in Table 4. Above $150/tonne, the system cost per MW h is substantially lower with the inclusion of the the integrated system – for example the system cost with and without the integrated system at $150/tonne are $24.4/MW h and $53.0/MW h, respectively. This reduced cost is a direct consequence of the additional carbon credit introduced by the proposed technology. At carbon prices near $180/tonne, the specific annualized cost of the power system becomes negative, indicating that the revenue from carbon credits exceeds operational and investment costs.
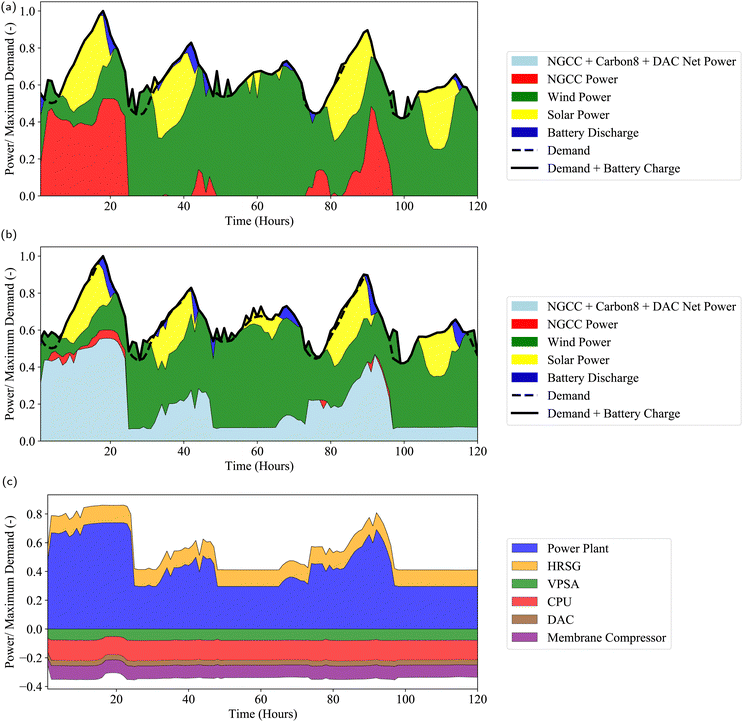
In Fig. 10(b) we show that the integrated system, when deployed, reduces VRE curtailment at a carbon price of $150/tonne (6.2% vs. 11.0%). This indicates better utilization of VRE resources in the system with deployment of the proposed technology. At the higher carbon price of $200/tonne, the NGCC + Carbon8 + DAC system is a net importer of power, and the reduction in curtailment is not seen due to an increased VRE capacity required to meet this extra power demand. From a emissions perspective, at higher carbon prices, when the proposed system reduces system cost, it also results in negative emissions intensity (see Fig. 10(c)) – for example achieving −0.679 tCO2/MW h vs. 0.065 tCO2/MW h in the $150/tonne case – indicating net carbon capture resulting from the DAC component of the proposed technology. The impact of the proposed technology on grid operations is illustrated in Fig. 11, where the enhanced flexibility of the proposed technology leads to limited reduced utilization of natural gas generation and marginally increases battery storage utilization. Comparing panel (a) with panel (b) in Fig. 11, we see the proposed technology replaces the majority of the power provided by the standalone NGCC plant. Further, Fig. 11c breaks down the power contributions of NGCC and Carbon8 + DAC within the integrated system. This granular view highlights that the NCC power plant ramps between its minimum loading of 40% and full loading, while the separation and DAC system is continually operational with a low temporal variation in power consumption.
4 Conclusions
In this work we determined the optimal design and operation of a novel negative emissions power plant concept that couples flue gas CO2 capture via calcium looping with lime-based DAC. The process is designed to respond flexibly to the highly volatile electricity price profiles expected in future variable renewable energy (VRE)-dominated electricity grids. At the same time, negative emissions are enabled in a synergistic manner. To evaluate such a concept, we propose a generalized design and operations framework that represents nonlinear physics and cost characterization of key unit operations as well as accounting for temporal variability in electricity prices in a computationally tractable manner. To determine the economic viability of the plant under different future market scenarios, net present value (NPV) maximizations were conducted under alternative market scenarios for electricity prices, carbon prices and natural gas prices.The findings highlight the opportunity for the process to be deployed under carbon prices at or near $150/tonne, which is consistent with recent policy initiatives, such as the inflation reduction act, to promote DAC technology deployment. Under market scenarios where the process is profitable, the optimal operation offers several advantages as compared to traditional schemes for natural gas power generation with carbon capture: (1) power is exported from the plant at high electricity prices and imported at low electricity prices, thus leveraging the variability in the electricity price to maximize profit. (2) Under market scenarios where the project is profitable, all process units (with the exception of the NGCC power plant and the vacuum pressure swing adsorption unit) run continuously with high capex utilization over yearly operation. The optimization results highlight the optimal time trajectories of some key process variables, the optimal sizing/capital expenditure for each process unit, and some key economic/sustainability metrics over yearly operation of the plant. These optimization results may be used to guide further design configurations and experiments.
The synergistic integration between the Carbon8 + DAC system and the NGCC plant is quantified by the observation of higher NPVs, higher negative emissions and higher power exports compared to involving co-located DAC and power plant where the flue gas is not captured via the calcium looping system. In addition, the integrated concept results in 53% greater NPV than standalone Carbon8 + DAC system producing only negative emissions by reducing the cost of energy input for DAC during periods of high grid electricity prices.
The integration of the proposed system within a diverse energy mix—comprising wind, solar, standalone NGCC, and battery storage—can lead to a significant reduction total system costs, CO2 emissions, and curtailment rates. Specifically, we observed a decrease in system costs from $53.0/MW h to $24.4/MW h, a reduction in VRE curtailment from 11.0% to 6.2% at a carbon price of $150 per tonne, and a significant shift in CO2 emissions from 0.065 tonne CO2/MW h to −0.679 tonne CO2/MW h under a $150/tonne carbon pricing scenario. Furthermore, the CEM based analysis highlights the economic benefits of integrating the proposed technology with existing energy generation and storage facilities. The economic viability of the system is further reinforced as it becomes cost-competitive to include the system at a carbon price of $116/tonne, eventually leading to negative costs regardless of the electricity selling price as revenues from carbon credits overcome system cost at a carbon price of $180/tonne. These outcomes collectively highlight the operational efficiency, environmental sustainability, and economic feasibility of the proposed system in a dynamic energy market.
While we have conducted NPV maximizations and power system cost minimizations for this particular process, the general approach to global optimization outlined in this work may be used as a template to analyze other processes where the optimal design and operational schedule may vary significantly with respect to a time-varying electricity prices. The process optimization shown here may be readily extended to consider different design considerations for the proposed FLECCS process. In particular, the impact of ambient temperature on the kinetics of batch based DAC process are not considered in this work. Thus, further amendments to the optimization may be required to consider ambient effects based on time and location. For this integrated system to keep operating, rather than heating the air contactor the generated calcium oxide can be stored during cold temperatures for later discharge. The current model already includes a stacker, reclaimer, and storage unit. Thus, the storage unit may need to be upscaled depending on the location's climate.
Author contributions
Edward J. Graham: conceptualization, data curation, formal analysis, investigation, methodology, software, validation, visualization, writing – original draft, writing – review & editing. Moataz Sheha: data curation, writing – review & editing, software. Dharik Mallapragada: conceptualization, supervision, funding acquisition, methodology, writing – review & editing. Howard Herzog: project administration, supervision, funding acquisition, writing – review & editing. Emre Gençer: supervision, funding acquisition, writing – review & editing. Phillip Cross: data curation, supervision, funding acquisition, writing – review & editing. James Custer: data curation, funding acquisition, writing – review & editing. Adam Goff: data curation, funding acquisition, writing – review & editing. Ian Cormier: data curation, funding acquisition, writing – review & editing.Conflicts of interest
8 Rivers is the inventor and developer of Carbon8 and Calcite Direct Air Capture Technologies.Acknowledgements
This research was funded by Advanced Research Projects Agency-Energy (ARPA-E). Grant Number DE-AR0001311.References
- S. J. Davis, N. S. Lewis, M. Shaner, S. Aggarwal, D. Arent, I. L. Azevedo, S. M. Benson, T. Bradley, J. Brouwer, Y.-M. Chiang, C. T. M. Clack, A. Cohen, S. Doig, J. Edmonds, P. Fennell, C. B. Field, B. Hannegan, B.-M. Hodge, M. I. Hoffert, E. Ingersoll, P. Jaramillo, K. S. Lackner, K. J. Mach, M. Mastrandrea, J. Ogden, P. F. Peterson, D. L. Sanchez, D. Sperling, J. Stagner, J. E. Trancik, C.-J. Yang and K. Caldeira, Science, 2018, 360(6396), eaas9793 CrossRef PubMed.
- J. E. Bistline, Joule, 2021, 5, 2551–2563 CrossRef.
- A. Mileva, J. Johnston, J. H. Nelson and D. M. Kammen, Appl. Energy, 2016, 162, 1001–1009 CrossRef.
- N. A. Sepulveda, J. D. Jenkins, F. J. de Sisternes and R. K. Lester, Joule, 2018, 2, 2403–2420 CrossRef.
- H. Daggash, C. Heuberger and N. M. Dowell, Int. J. Greenhouse Gas Control, 2019, 81, 181–198 CrossRef CAS.
- P. J. Heptonstall and R. J. K. Gross, Nat. Energy, 2020, 6, 72–83 CrossRef.
- K. Z. House, C. F. Harvey, M. J. Aziz and D. P. Schrag, Energy Environ. Sci., 2009, 2, 193 RSC.
- S. Vasudevan, S. Farooq, I. A. Karimi, M. Saeys, M. C. Quah and R. Agrawal, Energy, 2016, 103, 709–714 CrossRef CAS.
- G. G. Esquivel-Patiño, M. Serna-González and F. Nápoles-Rivera, Energy Convers. Manage., 2017, 151, 334–342 CrossRef.
- R. Domenichini, L. Mancuso, N. Ferrari and J. Davison, Energy Proc., 2013, 37, 2727–2737 CrossRef CAS.
- N. M. Dowell and N. Shah, Energy Proc., 2014, 63, 1525–1535 CrossRef.
- D. L. Oates, P. Versteeg, E. Hittinger and P. Jaramillo, Int. J. Greenhouse Gas Control, 2014, 27, 279–288 CrossRef CAS.
- M. S. Zantye, A. Arora and M. F. Hasan, Comput. Chem. Eng., 2019, 130, 106544 CrossRef CAS.
- M. S. Zantye, A. Arora and M. M. F. Hasan, Energy Environ. Sci., 2021, 14, 3986–4008 RSC.
- FLExible Carbon Capture and Storage (FLECCS), https://arpa-e.energy.gov/technologies/programs/fleccs, Accessed: 2022-11-23.
- P. Cheng, D. M. Thierry, H. Hendrix, K. D. Dombrowski, D. J. Sachde, M. J. Realff and J. K. Scott, Appl. Energy, 2023, 341, 121076 CrossRef CAS.
- F. B. Soepyan, M. Habib, Z. Zhang, L. R. Nemetz, M. E. Haque, A. M. Esquino, J. R. Rivero, D. Bhattacharyya, G. G. Lipscomb, M. S. Matuszewski and K. M. Hornbostel, Carbon Capture Sci. Technol., 2024, 10, 100165 CrossRef CAS.
- M. Realff, F. Boukouvala, C. Jones, R. Lively, J. Scott, K. Dombrowski and H. Hendrix, Positive Power with Negative Emission Flexible NGCC Enable by Modular Direct Air Capture (Final Report), 2022 Search PubMed.
- F.-C. Yu, N. Phalak, Z. Sun and L.-S. Fan, Ind. Eng. Chem. Res., 2011, 51, 2133–2142 CrossRef.
- Y. A. Criado, B. Arias and J. C. Abanades, Energy Environ. Sci., 2017, 10, 1994–2004 RSC.
- P. Cheng, D. M. Thierry, H. Hendrix, K. D. Dombrowski, D. J. Sachde, M. J. Realff and J. K. Scott, Appl. Energy, 2023, 341, 121076 CrossRef CAS.
- M. Sheha, E. J. Graham, E. Gençer, D. Mallapragada, H. Herzog, P. Cross, J. Custer, A. Goff and I. Cormier, Comput. Chem. Eng., 2024, 180, 108472 CrossRef CAS.
- B. Arias, M. Diego, A. Méndez, M. Alonso and J. Abanades, Fuel, 2018, 222, 711–717 CrossRef CAS.
- B. Arias, Y. A. Criado and J. C. Abanades, ACS Omega, 2020, 5, 4844–4852 CrossRef CAS PubMed.
- E. D. Lena, M. Spinelli, M. Gatti, R. Scaccabarozzi, S. Campanari, S. Consonni, G. Cinti and M. C. Romano, Int. J. Greenhouse Gas Control, 2019, 82, 244–260 CrossRef.
- C. C. Dean, J. Blamey, N. H. Florin, M. J. Al-Jeboori and P. S. Fennell, Chem. Eng. Res. Des., 2011, 89, 836–855 CrossRef CAS.
- N. Rodrguez, R. Murillo and J. C. Abanades, Environ. Sci. Technol., 2012, 46, 2460–2466 CrossRef PubMed.
- P. S. Fennell, R. Pacciani, J. S. Dennis, J. F. Davidson and A. N. Hayhurst, Energy Fuels, 2007, 21, 2072–2081 CrossRef CAS.
- E. Robert, D. Kearins, M. Turner, M. Woods, N. Kuehn and A. Zoelle, Cost and performance baseline for fossil energy plants volume 1: bituminous coal and natural gas to electricity, National energy technology laboratory (netl), pittsburgh, pa, morgantown, wv…technical report, 2019.
- E. S. Rubin and H. Zhai, Environ. Sci. Technol., 2012, 46, 3076–3084 CrossRef CAS PubMed.
- E. Mechleri, P. S. Fennell and N. M. Dowell, Int. J. Greenhouse Gas Control, 2017, 59, 24–39 CrossRef CAS.
- S. M. Cohen, G. T. Rochelle and M. E. Webber, Int. J. Greenhouse Gas Control, 2012, 8, 180–195 CrossRef.
- M. Yuan, H. Teichgraeber, J. Wilcox and A. R. Brandt, Int. J. Greenhouse Gas Control, 2019, 84, 154–163 CrossRef CAS.
- X. Peng, T. W. Root and C. T. Maravelias, AIChE J., 2018, 65, e16458 CrossRef.
- Q. Zhang, M. Martín and I. E. Grossmann, Comput. Chem. Eng., 2019, 122, 80–92 CrossRef CAS.
- D. S. Mallapragada, E. Gençer, P. Insinger, D. W. Keith and F. M. O'Sullivan, Cell Rep. Phys. Sci., 2020, 1, 100174 CrossRef.
- N. M. Dowell and N. Shah, Comput. Chem. Eng., 2015, 74, 169–183 CrossRef.
- S. Cohen and V. Durvasulu, NREL Price Series Developed for the ARPA-E FLECCS Program, 2021, https://www.osti.gov/servlets/purl/1838046/.
- S. C. Jesse and D. Jenkins, Summary Report of the GenX and PowerGenome runs for generating Price Series (for ARPA-E FLECCS Project), 2021, https://zenodo.org/record/5765798.
- F. J. de Sisternes, J. D. Jenkins and A. Botterud, Appl. Energy, 2016, 175, 368–379 CrossRef.
- D. S. Mallapragada, N. A. Sepulveda and J. D. Jenkins, Appl. Energy, 2020, 275, 115390 CrossRef.
- A. Cozad, N. V. Sahinidis and D. C. Miller, AIChE J., 2014, 60, 2211–2227 CrossRef CAS.
- D. S. Mallapragada, D. J. Papageorgiou, A. Venkatesh, C. L. Lara and I. E. Grossmann, Energy, 2018, 163, 1231–1244 CrossRef.
- Gurobi Optimization, LLC, Gurobi Optimizer Reference Manual, 2022, https://www.gurobi.com.
- M. L. Bynum, G. A. Hackebeil, W. E. Hart, C. D. Laird, B. L. Nicholson, J. D. Siirola, J.-P. Watson and D. L. Woodruff, Pyomo-optimization modeling in python, Springer Science & Business Media, 3rd edn, 2021, vol. 67 Search PubMed.
- W. E. Hart, J.-P. Watson and D. L. Woodruff, Math. Prog. Comput., 2011, 3, 219–260 CrossRef.
- A. Reuther, J. Kepner, C. Byun, S. Samsi, W. Arcand, D. Bestor, B. Bergeron, V. Gadepally, M. Houle, M. Hubbell, M. Jones, A. Klein, L. Milechin, J. Mullen, A. Prout, A. Rosa, C. Yee and P. Michaleas, 2018 IEEE High Performance extreme Computing Conference (HPEC), 2018, pp. 1–6 Search PubMed.
- Carbon Capture Provisions in the Inflation Reduction Act of 2022, https://cdn.catf.us/wp-content/uploads/2022/08/19102026/carbon-capture-provisions-ira.pdf, Accessed: 2022-11-23.
- D. W. Keith, G. Holmes, D. S. Angelo and K. Heidel, Joule, 2018, 2, 1573–1594 CrossRef CAS.
- X. Zhang and Y. Liu, Appl. Therm. Eng., 2014, 70, 13–24 CrossRef CAS.
- S. M. Cohen, G. T. Rochelle and M. E. Webber, Energy Proc., 2011, 4, 2604–2611 CrossRef.
- A.-M. Cormos and A. Simon, Appl. Therm. Eng., 2015, 80, 319–327 CrossRef CAS.
- X. LuJeremy, E. Fetvedt, B. A. Forrest, G. W. Brown JR, M. Rafati and S. T. Martin, Direct gas capture systems and methods of use thereof, 2020, https://patents.google.com/patent/US20200346165A1, US 2020/0346165 A1.
- North America Limestone Market: Industry Trends, Share, Size, Growth, Opportunity and Forecast 2022–2027, https://www.imarcgroup.com/north-america-limestone-market, Accessed: 2022-9-12.
- Documentation for EPA's Power Sector Modeling Platform v6: Using the Integrated Planning Model, https://www.epa.gov/power-sector-modeling/documentation-epas-power-sector-modeling-platform-v6-summer-2021-reference, 2021, Accessed: 2023-12-12.
- R. Armstrong, Y.-M. Chiang, H. Gruenspecht, F. Brushett, J. Deutch, S. Engelkemier, E. Gençer, R. Jaffe, P. Joskow, D. Mallapragada, E. Olivetti, R. Schmalensee, R. Stoner, C.-J. Yang, B. Brandtzaeg, P. Brown, K. Huang, J. Pfeifenberger, F. O’Sullivan, Y. Shao-Horn, M. Alsup, A. Badel, M. Barbar, W. Gao, D. Hernandez, C. Junge, T. M. Narayanan, K. Rodby and C. Wang, The Future of Energy Storage: An Interdisciplinary MIT Study, Massachusetts Institute of Technology, 2022 Search PubMed.
Footnotes |
| † Electronic supplementary information (ESI) available: Full model documentation and figures. See DOI: https://doi.org/10.1039/d4ee00309h |
| ‡ https://arpa-e.energy.gov/technologies/programs/fleccs. |
| § The molar flowrate of CO2 in the NGCC flue gas is 5.7 MMol h−1 at full loading. Considering the case of infinite recycle, the CaO conversion approaches 0.25 as the number of cycles approaches infinity (ref. ESI,† eqn (S128) and thus the molar flow rate to the carbonator (and calciner) at infinite recycle would be approximately 22 MMol h−1, assuming that all flue gas is fed to the carbonator and 95% of the CO2 is absorbed. Thus, the capacity bound of 17 MMol h−1 is similar to what we would expect from a typical calcium looping process where CaO is not produced as a major by-product. |
| This journal is © The Royal Society of Chemistry 2024 |

