
 Open Access Article
 This Open Access Article is licensed under a Creative Commons Attribution-Non Commercial 3.0 Unported Licence
Revealing the heterogeneous catalytic kinetics of PtRu nanocatalysts at the single particle level†
Bowei Zhangab,
Dezheng Zhangab,
Jinpeng Baoa,
Ce Han *a,
Ping Song*a and
Weilin Xu*ab
*a,
Ping Song*a and
Weilin Xu*ab
aState Key Laboratory of Electroanalytical Chemistry, Jilin Provincial Key Laboratory of Low Carbon Chemical Power, Changchun Institute of Applied Chemistry, Chinese Academy of Sciences, Changchun 130022, China
bSchool of Applied Chemistry and Engineering, University of Science and Technology of China, Hefei 230026, China. E-mail: hance@ciac.ac.cn; songping@ciac.ac.cn; weilinxu@ciac.ac.cn
First published on 2nd September 2024
Abstract
Comparison of the structural features and catalytic performance of bimetallic nanocatalysts will help to develop a unified understanding of structure–reaction relationships. The single-molecule fluorescence technique was utilized to reveal the differences in catalytic kinetics among PtRu bimetallic nanocatalysts and Pt and Ru monometallic nanocatalysts at the single particle level. The results show that bimetallic nanocatalysts have higher apparent rate constants and desorption rate constants relative to monometallic nanocatalysts, which leads to their higher catalytic activity. At the single particle level, bimetallic nanocatalysts have a wider distribution of apparent rate constants, suggesting that bimetallic nanocatalysts have higher activity heterogeneity relative to monometallic nanocatalysts. By investigating the relationship between the reaction rate and the rate of dynamic activity fluctuations, it was found that spontaneous surface restructuring and reaction-induced surface restructuring of nanoparticles occurred. The surface of bimetallic nanoparticles restructured faster, which made the bimetallic nanocatalysts more active. These findings provide new insights into the design of highly active bimetallic nanocatalysts.
Introduction
Bimetallic nanocatalysts are an important class of nanocatalysts in heterogeneous catalysis and show a variety of functionalities and outstanding catalytic activity compared to monometallic nanocatalysts.1–4 Despite extensive efforts in studying the mechanisms of bimetallic nanocatalysts, the reason for the better performance of bimetallic nanocatalysts compared with their corresponding monometallic counterparts remains unclear.5–8 PtRu bimetallic nanocatalysts are an important class of alloy materials with excellent catalytic properties in many fields.9–13However, most of the research on PtRu bimetallic nanocatalysts has focused on the ensemble level, where the average information is obtained from the simultaneous measurement of a large number of nanocatalysts.14–18 Adjusting the ratio of the metal elements for bimetallic nanocatalysts is an important method for tuning their catalytic activity. These nanocatalysts are highly heterogeneous, so the unique properties of individual nanoparticles are hidden from ensemble-averaged measurement.19–22 Therefore, in order to study the relationship between the activity of PtRu bimetallic nanocatalysts and composition, it is necessary to study the behavior of individual nanoparticles in catalysis. In the last decade, the single-molecule fluorescence technique (SMFT), with the ability to study the catalytic behavior of individual nanocatalysts at the single particle level, has become an important approach in catalysis.23–27 This technique provides new insights into the catalytic activity and enhances the understanding of nanocatalysis.28–32 SMFT is widely applied in the characterization of catalytic processes, such as the difference in behaviour between AuAg bimetallic nanocatalysts and Ag nanocatalysts in catalytic processes, and the visualisation of bimetallic activity enhancement on heteronuclear PdAu nanocatalysts at the single particle level.33,34 To the best of our knowledge, the study of PtRu bimetallic nanocatalysts has not been performed previously using the SMFT.
In this work, we synthesized PtRu bimetallic nanocatalysts with three different ratios, and compared them with monometallic Pt and Ru nanocatalysts as five control groups. The kinetic parameters of the five control groups were obtained by the SMFT using the hydrogen reduction of resazurin to the fluorescent product resorufin as a reaction model. By tracking their catalytic behaviors at the single particle level, we divided the catalytic process into product formation and desorption stages. The kinetic parameters of bimetallic and monometallic catalysts showed that the catalytic mechanisms all follow competitive adsorption. Moreover, it is demonstrated that bimetallic catalysts exhibit better performance compared to monometallic catalysts at the single particle level. These results further deepen the understanding of PtRu bimetallic and monometallic catalysts.
Results and discussion
The PtRu bimetallic nanocatalysts were synthesized by the contemporaneous reduction of RuCl3 and H2PtCl6 with NaBH4 as the reducing agent and citric acid as the capping agent.35 Pt and Ru monometallic nanocatalysts were synthesized using the same method with only one metal precursor. Detailed synthesis information is available in the (ESI†). The quantitative measurement results conducted by inductively coupled plasma atomic emission spectroscopy (ICP-AES) revealed that the components are Pt66Ru34, Pt76Ru24 and Pt39Ru61 for PtRu bimetallic nanocatalysts, respectively. Typical transition electron microscopy (TEM) images of Pt66Ru34 nanocatalysts are shown in Fig. 1a, indicating a uniform dispersion. As shown in Fig. 1b, the statistical analysis based on TEM images of Pt66Ru34 nanocatalysts indicates that the nanocatalysts have uniform diameters of 2.3 ± 0.03 nm. Meanwhile, the size distributions of other nanoparticles are shown in Fig. S1 (ESI†), which all indicate uniform dispersion with small sizes of less than 3 nm. In situ ultraviolet–visible absorbance spectroscopy (UV-vis) proves that five control groups catalyze the H2 (H) reduction of nonfluorescent resazurin (R) to the highly fluorescent product resorufin (P) at the ensemble level (Fig. S2a–e, ESI†). The absorption spectrum shows a decrease of resazurin absorption at 601 nm and an increase of resorufin absorption at 571 nm over time, indicating the persistence of the reduction reaction. The evolution of the absorbance of the five control groups at 601 nm and 571 nm over time is shown in Fig. 1c and d. Moreover, unchanged absorbance can be observed from the UV-vis tests performed in the absence of either H2 or nanoparticles, demonstrating a reaction process with reductive H2 catalyzed by metallic nanoparticles (Fig. S2f–k, ESI†). Therefore, this shows that the apparent reaction rate is as follows: Pt66Ru34 > Pt76Ru24 > Pt39Ru61 > Pt > Ru. The results demonstrate that the catalytic efficiencies of bimetallic nanocatalysts vary with different ratios, but they are all higher than those of monometallic catalysts. | ||
| Fig. 1 (a) TEM image of Pt66Ru34 nanocatalysts and (b) size distribution of Pt66Ru34 nanoparticles with an average of about 2.3 ± 0.03 nm. Dependence of (c) 601 nm and (d) 571 nm absorbance on time for nanocatalysts with different ratios. All of the experiments were carried out in a saturated H2 solution with the same nanoparticle concentration and resazurin concentration. | ||
Single particle experiments were conducted with a homemade flow cell (Fig. 2a). Briefly, nanocatalysts were immobilized sparsely on the surface of quartz coverslips. A H2-saturated solution was delivered with a syringe pump with varying resazurin concentrations (ranging from 1 to 10 nM) into microfluidic channels, where the reactions occur. The resorufin product was generated on the surface of nanoparticles under excitation with a 532 nm laser, and the fluorescence signal was captured using a total internal reflection fluorescence microscope (TIRFM) equipped with an electron-multiplying charge-coupled device camera. The camera was operated at 100 ms per frame to record movies, in which stochastic fluorescence bursts at numerous localized spots on the glass surface were shown with each point emitting fluorescence repeatedly. Each fluorescence burst was attributed to a single reaction in which a nanoparticle catalyzed the conversion of resazurin into the fluorescent product resorufin. The dissociated product molecules in the solution cannot be detected at our image speed due to their rapid diffusion.36 The movies were processed using a home-written Interactive Data Language program to obtain fluorescence burst trajectories at each location (as shown in Fig. 2b). These fluorescence trajectories revealed stochastic switching signals, with individual nanoparticle turnover trajectories characterized by two waiting times: τoff and τon. τoff is the waiting time before each product formation and τon is that for product desorption after its formation. The kinetic mechanism of catalytic product formation and product desorption reactions could be probed separately by resolving them. The values of τoff and τon are stochastic, but they have statistical regularities, such as averages and distributions, which can be effectively integrated with the reaction kinetics. In a statistical sense, 〈τoff〉−1 and 〈τon〉−1 (“〈 〉” represents the average value) represent the average reaction rate of the product formation and product desorption, respectively.
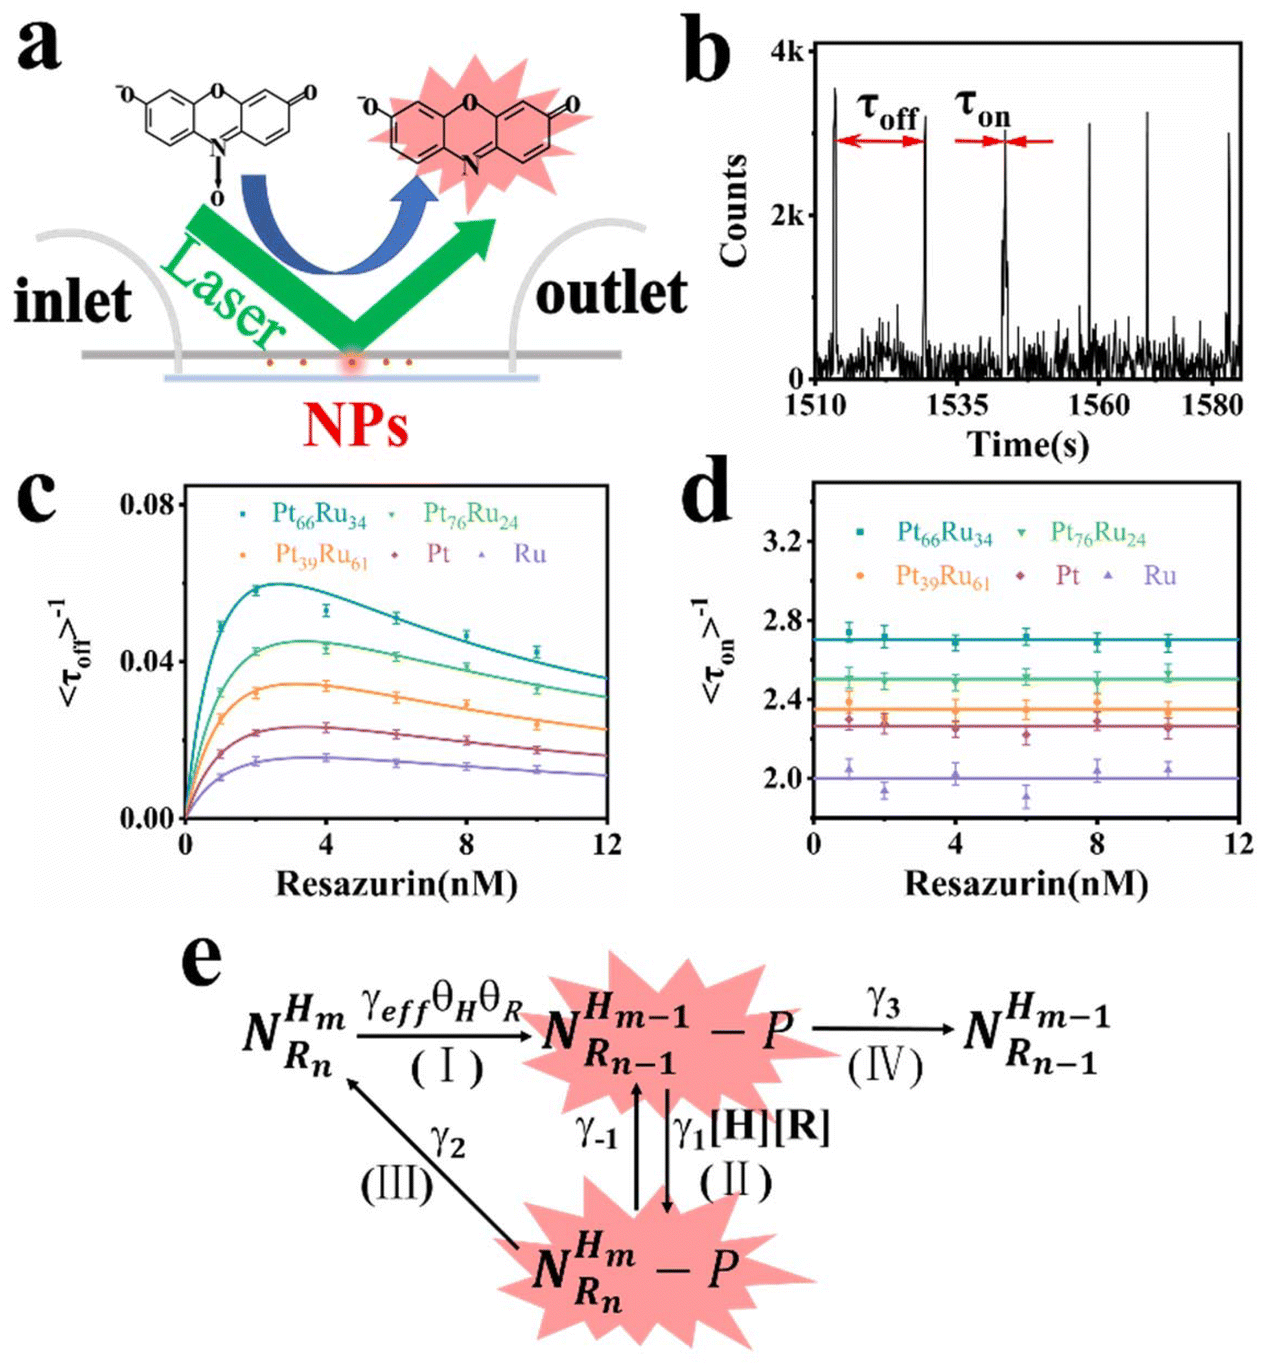 | ||
| Fig. 2 (a) The experimental setup of fluorescent catalytic reactions based on TIRFM. (b) A segment of the fluorescence turnover trajectory of a Pt66Ru34 nanocatalyst in saturated H2 of 10 nM resazurin. (c) and (d) represent the tendency of the dependence of resazurin concentration on product formation rates and product desorption rates. Each data point is averaged over the turnover trajectories of more than 80 nanoparticles (NPs). (e) Kinetic mechanism of the reduction reaction. The meaning of each symbol is described in detail in the ESI.† | ||
Through separately averaging turnover trajectories of nanocatalysts such as Pt66Ru34, Pt76Ru24, Pt39Ru61, Pt and Ru, the dependency of reaction rates on the resazurin concentration for the five types of nanocatalysts can be obtained (Fig. 2c and d). It can be clearly concluded that the product formation rate 〈τoff〉−1 initially increases with the increase in resazurin concentration and then declines at higher resazurin concentrations after reaching a maximum value. The variation in 〈τoff〉−1 is attributed to the competitive adsorption reaction of the reactants: resazurin and H2 co-adsorb onto the nanoparticle surface simultaneously.37 When the concentration of the substrate is very high, the other reactant will be unable to adsorb onto the nanocatalysts, leading to a decline after reaching maximum reaction rates. It is interesting that the desorption rates of the products from the control groups are independent of the resazurin concentration. It can be concluded that there are two pathways for desorption: the substrate-assisted desorption pathway and the direct product desorption pathway. When the resazurin concentration is low, the product directly desorbs. As the resazurin concentration increases, the product desorbs with the assistance of the substrate.
Based on these facts and the Langmuir–Hinshelwood mechanism, we proposed the reaction mechanism based on a bimolecular reaction model as shown in Fig. 2e. Herein, during the reaction process, the substrate and product maintain a rapid adsorption/desorption equilibrium on the surface of the nanoparticle. The dissociation process is of two types: substrate-assisted dissociation (reactions (II) and (III)) and direct desorption (reaction (IV)) of the products. Based on this mechanism, single particle kinetic analysis was performed. Single particle rate equations and some kinetic parameters were obtained. The mathematical expressions for 〈τoff〉−1 and 〈τon〉−1 are given by eqn (1) and (2), respectively (the detailed process is provided in the ESI†).38
 | (1) |
 | (2) |
As predicted by eqn (1), the forward reaction rates 〈τoff〉−1 of the five control groups exhibit an initial increase followed by a decrease with an increase in resazurin concentration, as shown in Fig. 2c. However, the five control groups show differences in reaction rates, with the catalytic rate Pt66Ru34 > Pt76Ru24 > Pt39Ru61 > Pt > Ru at any concentration, which is consistent with the UV-vis data. Eqn (1) and (2) are used to fit the experimental data, and the kinetic parameters for product generation and dissociation are obtained. The parameters of the data curves fitted with equations are listed in Table 1. The results indicate that bimetallic catalysts exhibit higher rate and adsorption constants, which demonstrates that they have stronger substrate adsorption ability and higher activity. The desorption rate of the product (〈τon〉−1), as shown in Fig. 2d, is independent of the substrate concentration. However, nanocatalysts of different metal element ratios show varying desorption rates, which are consistent with the trend obtained from 〈τoff〉−1. Based on the properties of the function in eqn (2), it can be inferred that if γ1 ≫ 0, then γ2 can be obtained from eqn (2). If γ1 ≈ 0, then γ2 = γ3 can be derived from eqn (2), resulting in γ2 for the five control groups. Although it cannot be confirmed which of these two assumptions is correct, γ2 could still be obtained, as listed in Table 1. Based on these facts, bimetallic catalysts exhibit stronger catalytic activity compared to monometallic catalysts. Additionally, the catalytic activities of bimetallic catalysts vary with different ratios of metal elements. The catalytic efficiency of catalysts could be changed by adjusting the ratios of metal elements.
![[thin space (1/6-em)]](https://www.rsc.org/images/entities/char_2009.gif) a
a
| γeff (s−1) | αH (mM−1) | αR (nM−1) | γ2 (s−1) | |
|---|---|---|---|---|
| a The values of the kinetic parameters are the average of many nanoparticles (>100). γ2 is obtained by fitting eqn (2).40,41 | ||||
| Pt66Ru34 | 0.58 ± 0.03 | 0.89 ± 0.08 | 0.64 ± 0.03 | 2.70 ± 0.10 |
| Pt76Ru24 | 0.52 ± 0.03 | 0.65 ± 0.04 | 0.45 ± 0.01 | 2.50 ± 0.09 |
| Pt39Ru61 | 0.44 ± 0.04 | 0.56 ± 0.04 | 0.46 ± 0.01 | 2.35 ± 0.07 |
| Pt | 0.40 ± 0.01 | 0.20 ± 0.01 | 0.38 ± 0.03 | 2.26 ± 0.04 |
| Ru | 0.30 ± 0.03 | 0.33 ± 0.01 | 0.35 ± 0.01 | 1.99 ± 0.03 |
Furthermore, static activity was also evaluated, which represents the static heterogeneity of rates among individual nanoparticles. The probability density function of the off-time is used to evaluate the static activity of the product generation, with the following equation (see the ESI†):
| foff(τ) = γappexp(−γappτ) | (3) |
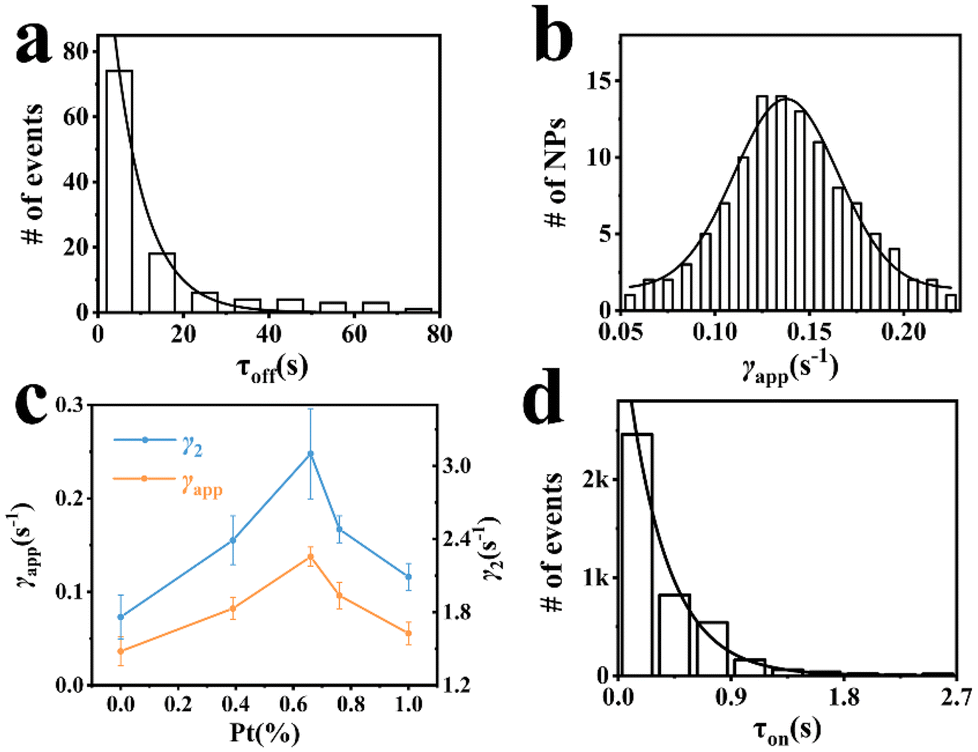 | ||
| Fig. 3 (a) Distributions of τoff from a single trajectory of a Pt66Ru34 nanoparticle at 10 nM resazurin; the solid line is a single exponential fit with the decay constant γapp = 0.13 ± 0.012 s−1. (b) Distribution of γapp of Pt66Ru34 nanocatalysts at 10 nM resazurin; the solid line is the Gaussian fit. (c) Dependences of γapp (orange)and γ2 (blue) on the percentage of Pt. (d) Distributions of τon from over 100 trajectories of Pt66Ru34 nanocatalysts at 10 nM resazurin; the solid line is a single exponential fit. All experiments are conducted in a H2-saturated solution of 10 nM resazurin. | ||
| xc (s−1) | FWHM | γ2 (s−1) | Tflu off (s) | Tflu on (s) | |
|---|---|---|---|---|---|
| a γ2 is obtained by fitting the probability density function using eqn (4).40,41 | |||||
| Pt66Ru34 | 0.137 | 0.065 ± 0.004 | 3.09 ± 0.18 | 33 ± 2 | 36 ± 2 |
| Pt76Ru24 | 0.096 | 0.073 ± 0.007 | 2.48 ± 0.20 | 45 ± 4 | 48 ± 5 |
| Pt39Ru61 | 0.082 | 0.072 ± 0.005 | 2.39 ± 0.14 | 64 ± 8 | 60 ± 8 |
| Pt | 0.056 | 0.036 ± 0.004 | 2.08 ± 0.11 | 97 ± 16 | 94 ± 15 |
| Ru | 0.036 | 0.028 ± 0.005 | 1.75 ± 0.11 | 136 ± 31 | 128 ± 28 |
For the product desorption process, when the substrate resazurin concentration is high enough, the probability density function can be simplified as follows (see the ESI†):
| fon(τ) = γ2exp(−γ2τ) | (4) |
There are differences in static catalytic activities among nanocatalysts, so it is necessary to study the variability of activity in an individual nanoparticle over time, i.e., the fluctuations of reaction rates. The variation in reaction rates over time for an individual nanoparticle is referred to as dynamic disorder in chemical kinetics.43 This fluctuation timescale, which corresponds to the timescale of underlying surface restructuring dynamics, can be measured using autocorrelation analysis of single-turnover waiting times, τoff and τon.44,45 At high substrate concentrations, the reaction rate limitations for the off-time and on-time are denoted by γeff and γ2, respectively. We use covariance to describe the dynamic variation of activity over time for a nanoparticle. The mathematical expression is as follows:46–48
 | (5) |
The insets in Fig. 4a and b depict the autocorrelation functions of the off-time and on-time of Pt66Ru34 nanocatalysts, respectively, both exhibiting exponential decay, indicating dynamic activity fluctuations during product formation and desorption processes. The autocorrelation functions of the other four control groups are plotted in the insets of Fig. S5 and S6 (ESI†), and their exponential decay functions similarly indicate dynamic activity fluctuations. The decay constants of Pt66Ru34 nanocatalysts are moff = 1.50 ± 0.32 and mon = 1.91 ± 0.27, respectively. The average turnover time of the trajectory is denoted as 17.2 s. Therefore, we convert the turnover exponent m of the reaction process into the turnover reaction time, fitted as Fig. 4a and b, respectively. The fitted fluctuation correlation times τoff and τon of the reactions are 26 ± 3 s and 33 ± 2 s, respectively. The fitted curves of the autocorrelation functions of the off-time and the on-time for the other four control groups are shown in Fig. S5 and S6 (ESI†). These two fluctuation times represent the timescales of fluctuations in γeff and γ2, which are rate-limiting in the τoff and τon reactions at high resazurin concentrations. The dynamic activity fluctuation was attributed to the dynamic surface restructuring on the individual nanoparticle surface. During catalysis, changes in adsorbate–surface interactions can induce dynamic surface restructuring, with kinetic disturbances due to the different activities of different surface structures.49,50 For the nanocatalysts here, dynamic surface restructuring can cause dynamic activity fluctuation by changing the rate constants (γeff or γ2) at each catalytic site. So, the rate of dynamic activity fluctuation (reciprocal of fluctuation correlation times) should increase with the reaction rate (rate of turnover). To support this attribution, we need to determine the dependence of the dynamic activity fluctuation rate on the reaction rate. We counted the decay constants of a large amount of Pt66Ru34 nanoparticles to obtain the average fluctuation correlation times Tflu,off (and Tflu,off), listed in Table 2. The average fluctuation correlation time of the other four control groups is also listed in Table 2. The relationship between the reaction rates and the activity fluctuation rates is illustrated in Fig. 4c and d. We found a positive correlation between the reaction rates and the activity fluctuation of an individual nanoparticle, suggesting that reactions indeed induce surface restructuring of nanocatalysts. Extrapolating activity fluctuation rates to zero, the intercepts provide approximate rates of spontaneous surface restructuring during the τoff and τon processes of nanocatalysts.29,51 The timescales of spontaneous surface restructuring (>200 s) are longer than that of the catalysis-induced surface restructuring process, indicating that surface restructuring of nanocatalysts is predominantly induced under catalytic conditions. In addition, the slope of bimetallic nanocatalysts is higher than that of monometallic nanocatalysts, showing a greater rate of fluctuation in the dynamic activity of bimetallic nanocatalysts and higher activity.
 | ||
| Fig. 4 Autocorrelation function Cτoff (t) (a) and Cτon (t) (b) of the reaction time τ from turnover trajectories of Pt66Ru34 nanocatalysts. Inset: autocorrelation function of the τoff (a) and τon (b) from the turnover trajectory of a single Pt66Ru34 nanoparticle; the solid line is a single exponential fit. Autocorrelation function Cτoff (t) (a) and Cτon (t) (b) of the reaction time τ from turnover trajectories of Pt66Ru34 nanocatalysts. The x-axis was converted from the turnover index m to real time using the average turnover time of each nanoparticle. The solid line is a single exponential fit. Dependence of the activity fluctuation rates of (c) τoff and (d) τon on the reaction rates. All experiments are conducted in a H2-saturated solution of 10 nM resazurin. | ||
Based on the above data obtained from the single-molecule fluorescence technique, the PtRu bimetallic catalysts exhibit enhanced catalytic performance compared to the monometallic Pt or Ru samples. The reason for this is inferred to be the accelerated catalytic kinetics arising from the regulated electron structure of active sites or the synergistic effect of diverse active sites. On the one hand, the electron structure of active sites can be tuned by the formation of alloys, which facilitates the sorption of reactive species and thus improves the catalytic kinetics.52 On the other hand, considering the presence of adjacent Pt and Ru sites, the synergistic effect, which is adsorbing different reactants on diverse active sites, may also be the reason for the enhanced activity of PtRu bimetallic catalysts.53
Conclusions
From a single particle perspective, we investigated the catalytic behaviors of bimetallic and monometallic catalysts. By studying the relationship between catalytic reaction rates and substrate concentrations, the reaction mechanisms of the five control groups all followed a competitive adsorption Langmuir–Hinshelwood model. By analyzing turnover trajectories during product formation, we discovered that bimetallic nanoparticles exhibit greater activity heterogeneity compared to monometallic nanoparticles. Autocorrelation analysis indicates dynamic fluctuations in activity during both product generation and desorption processes, with the rate of these fluctuations positively correlated with reaction rates. The high catalytic activity of the bimetallic catalyst is attributed to its high dynamic activity fluctuation rate. This work deepens understanding of the differences between bimetallic and monometallic catalysts and provides a good reference at the nanoscale for the design of metallic catalysts.Author contributions
Bowei Zhang: methodology, validation, formal analysis, investigation, data curation, writing – original draft, and visualization. Dezheng Zhang: investigation. Jinpeng Bao: investigation and supervision. Ce Han: conceptualization, supervision, and resources. Ping Song: conceptualization, supervision, and resources. Weilin Xu: conceptualization, resources, writing – review and editing, supervision, and funding acquisition.Data availability
The data supporting this article have been included as part of the ESI.†Conflicts of interest
The authors declare no competing financial interest.Acknowledgements
This work was supported by the National Natural Science Foundation of China (21925205, 22072145, 22372155, and 22102172).References
- S. Ashraf, Y. Y. Liu, H. J. Wei, R. F. Shen, H. H. Zhang, X. L. Wu, S. Mehdi, T. Liu and B. J. Li, Small, 2023, 19, 48 CrossRef PubMed.
- J. L. Liu, T. R. Zhang and G. I. N. Waterhouse, J. Mater. Chem. A, 2020, 8, 23142–23161 RSC.
- J. G. Smith, I. Chakraborty and P. K. Jain, Angew. Chem., Int. Ed., 2016, 55, 9979–9983 CrossRef CAS PubMed.
- K. D. Gilroy, A. Ruditskiy, H. C. Peng, D. Qin and Y. N. Xia, Chem. Rev., 2016, 116, 10414–10472 CrossRef CAS PubMed.
- L. C. Liu and A. Corma, Chem. Rev., 2023, 123, 4855–4933 CrossRef CAS PubMed.
- S. Q. Zhu, X. P. Qin, F. Xiao, S. L. Yang, Y. Xu, Z. Tan, J. D. Li, J. W. Yan, Q. Chen, M. S. Chen and M. H. Shao, Nat. Catal., 2021, 4, 711–718 CrossRef CAS.
- Y. Wang, G. W. Wang, G. W. Li, B. Huang, J. Pan, Q. Liu, J. J. Han, L. Xiao, J. T. Lu and L. Zhuang, Energy Environ. Sci., 2015, 8, 177–181 RSC.
- D. J. Chen and Y. Y. J. Tong, Angew. Chem., Int. Ed., 2015, 54, 9394–9398 CrossRef CAS PubMed.
- D. Strmcnik, M. Uchimura, C. Wang, R. Subbaraman, N. Danilovic, D. van der Vliet, A. P. Paulikas, V. R. Stamenkovic and N. M. Markovic, Nat. Chem., 2013, 5, 300–306 CrossRef CAS PubMed.
- L. Huang, X. P. Zhang, Q. Q. Wang, Y. J. Han, Y. X. Fang and S. J. Dong, J. Am. Chem. Soc., 2018, 140, 1142–1147 CrossRef CAS PubMed.
- H. S. Liu, C. J. Song, L. Zhang, J. J. Zhang, H. J. Wang and D. P. Wilkinson, J. Power Sources, 2006, 155, 95–110 CrossRef CAS.
- J. M. Wang, B. X. Zhang, X. Z. Zheng, X. R. Liu, W. Guo, Z. X. Luo, Y. F. Liu, M. X. Gao, J. Chen, Z. B. Zhuang, H. G. Pan and W. P. Sun, Nano Res., 2024, 17, 6147–6156 CrossRef CAS.
- S. Yin, K. N. Zong, L. S. Ban, H. M. Yin, X. Z. Liu and Y. Ding, Inorg. Chem. Front., 2024, 11, 3633–3642 RSC.
- T. Iwasita, H. Hoster, A. John-Anacker, W. F. Lin and W. Vielstich, Langmuir, 2000, 16, 522–529 CrossRef CAS.
- E. Antolini and F. Cardellini, J. Alloys Compd., 2001, 315, 118–122 CrossRef CAS.
- H. N. Dinh, X. M. Ren, F. H. Garzon, P. Zelenay and S. Gottesfeld, J. Electroanal. Chem., 2000, 491, 222–233 CrossRef CAS.
- S. L. Gojkovic, T. R. Vidakovic and D. R. Durovic, Electrochim. Acta, 2003, 48, 3607–3614 CrossRef CAS.
- Y. C. Wei, X. X. Wu, Y. L. Zhao, L. Wang, Z. Zhao, X. T. Huang, J. Liu and J. M. Li, Appl. Catal., B, 2018, 236, 445–457 CrossRef CAS.
- J. K. Norskov, F. Abild-Pedersen, F. Studt and T. Bligaard, Proc. Natl. Acad. Sci. U. S. A., 2011, 108, 937–943 CrossRef CAS PubMed.
- W. T. Yu, M. D. Porosoff and J. G. G. Chen, Chem. Rev., 2012, 112, 5780–5817 CrossRef CAS PubMed.
- X. G. Guo, G. Z. Fang, G. Li, H. Ma, H. J. Fan, L. Yu, C. Ma, X. Wu, D. H. Deng, M. M. Wei, D. L. Tan, R. Si, S. Zhang, J. Q. Li, L. T. Sun, Z. C. Tang, X. L. Pan and X. H. Bao, Science, 2014, 344, 616–619 CrossRef CAS PubMed.
- D. Kim, J. Resasco, Y. Yu, A. M. Asiri and P. D. Yang, Nat. Commun., 2014, 5, 8 Search PubMed.
- P. Chen, X. C. Zhou, N. M. Andoy, K. S. Han, E. Choudhary, N. M. Zou, G. Q. Chen and H. Shen, Chem. Soc. Rev., 2014, 43, 1107–1117 RSC.
- P. Chen, X. C. Zhou, H. Shen, N. M. Andoy, E. Choudhary, K. S. Han, G. K. Liu and W. L. Meng, Chem. Soc. Rev., 2010, 39, 4560–4570 RSC.
- K. P. F. Janssen, G. De Cremer, R. K. Neely, A. V. Kubarev, J. Van Loon, J. A. Martens, D. E. De Vos, M. B. J. Roeffaers and J. Hofkens, Chem. Soc. Rev., 2014, 43, 990–1006 RSC.
- G. De Cremer, B. F. Sels, D. E. De Vos, J. Hofkens and M. B. J. Roeffaers, Chem. Soc. Rev., 2010, 39, 4703–4717 RSC.
- J. Cao, D. Z. Zhang and W. L. Xu, Curr. Opin. Electrochem., 2023, 41, 8 Search PubMed.
- R. Ye, X. C. Sun, X. W. Mao, F. S. Alfonso, S. Baral, C. M. Liu, G. W. Coates and P. Chen, Nat. Chem., 2024, 16, 10 CrossRef PubMed.
- W. L. Xu, J. S. Kong, Y. T. E. Yeh and P. Chen, Nat. Mater., 2008, 7, 992–996 CrossRef CAS PubMed.
- X. D. Liu, X. Ge, J. Cao, Y. Xiao, Y. Wang, W. Zhang, P. Song and W. L. Xu, Proc. Natl. Acad. Sci. U. S. A., 2022, 119, 7 Search PubMed.
- B. Dong, Y. C. Pei, F. Zhao, T. W. Goh, Z. Y. Qi, C. X. Xiao, K. C. Chen, W. Y. Huang and N. Fang, Nat. Catal., 2018, 1, 135–140 CrossRef.
- R. Hao, Y. S. Fan, M. D. Howard, J. C. Vaughan and B. Zhang, Proc. Natl. Acad. Sci. U. S. A., 2018, 115, 5878–5883 CrossRef CAS PubMed.
- G. Q. Chen, N. M. Zou, B. Chen, J. B. Sambur, E. Choudhary and P. Chen, ACS Cent. Sci., 2017, 3, 1189–1197 CrossRef CAS PubMed.
- X. D. Qu, B. L. Zhao, W. S. Zhang, J. H. Zou, Z. X. Wang, Y. W. Zhang and L. Niu, J. Phys. Chem. Lett., 2022, 13, 830–837 CrossRef CAS PubMed.
- Y. Shimazaki, Y. Kobayashi, S. Yamada, T. Miwa and M. Konno, J. Colloid Interface Sci., 2005, 292, 122–126 CrossRef CAS PubMed.
- X. C. Zhou, N. M. Andoy, G. K. Liu, E. Choudhary, K. S. Han, H. Shen and P. Chen, Nat. Nanotechnol., 2012, 7, 237–241 CrossRef CAS PubMed.
- G. A. Somorjai, J. Phys. Chem. B, 2000, 104, 2969–2979 CrossRef CAS.
- W. L. Xu, J. S. Kong and P. Chen, J. Phys. Chem. C, 2009, 113, 2393–2404 CrossRef CAS.
- T. Chen, Y. W. Zhang and W. L. Xu, Phys. Chem. Chem. Phys., 2016, 18, 22494–22502 RSC.
- P. Chen, W. L. Xu, X. C. Zhou, D. Panda and A. Kalininskiy, Chem. Phys. Lett., 2009, 470, 151–157 CrossRef CAS.
- Y. Xiao, J. Hong, X. Wang, T. Chen, T. Hyeon and W. L. Xu, J. Am. Chem. Soc., 2020, 142, 13201–13209 CrossRef CAS PubMed.
- S. Alayoglu, A. U. Nilekar, M. Mavrikakis and B. Eichhorn, Nat. Mater., 2008, 7, 333–338 CrossRef CAS PubMed.
- W. L. Xu, J. S. Kong and P. Chen, Phys. Chem. Chem. Phys., 2009, 11, 2767–2778 RSC.
- S. L. Yang and J. S. Cao, J. Phys. Chem. B, 2001, 105, 6536–6549 CrossRef CAS.
- S. L. Yang and J. S. Cao, J. Chem. Phys., 2002, 117, 10996–11009 CrossRef CAS.
- H. P. Lu, L. Y. Xun and X. S. Xie, Science, 1998, 282, 1877–1882 CrossRef CAS PubMed.
- S. C. Kou, B. J. Cherayil, W. Min, B. P. English and X. S. Xie, J. Phys. Chem. B, 2005, 109, 19068–19081 CrossRef CAS PubMed.
- M. J. Schnitzer and S. M. Block, Nature, 1997, 388, 386–390 CrossRef CAS PubMed.
- R. Imbihl and G. Ertl, Chem. Rev., 1995, 95, 697–733 CrossRef CAS.
- D. A. King, Surf. Rev. Lett., 1994, 01, 435–442 CrossRef CAS.
- P. Chen, W. L. Xu, X. C. Zhou, D. Panda and A. Kalininskiy, Chem. Phys. Lett., 2009, 470, 151–157 CrossRef CAS.
- K. W. Park, J. H. Choi, B. K. Kwon, S. A. Lee, Y. E. Sung, H. Y. Ha, S. A. Hong, H. Kim and A. Wieckowski, J. Phys. Chem. B, 2002, 106, 1869–1877 CrossRef CAS.
- L. X. Huo, C. Q. Jin, J. L. Tang, X. H. Xu, K. Jiang, L. Y. Shang, Y. W. Li, J. Z. Zhang, L. Q. Zhu, J. H. Chu and Z. G. Hu, ACS Appl. Energy Mater., 2022, 5, 15136–15145 CrossRef CAS.
Footnote |
| † Electronic supplementary information (ESI) available: Experimental details; characterization and single-molecule kinetic equations. See DOI: https://doi.org/10.1039/d4an01017e |
| This journal is © The Royal Society of Chemistry 2024 |