
Mg2+-modified LiBaF3:Ni2+ perovskite single crystals with broadband long wavelength near-infrared emission for imaging human vascular structures
Di
Wei
a,
Haiping
Xia
 *a,
Lizhi
Fang
*b,
Liangbi
Su
b,
Xu
Chen
c and
Hongwei
Song
d
*a,
Lizhi
Fang
*b,
Liangbi
Su
b,
Xu
Chen
c and
Hongwei
Song
d
aKey Laboratory of Photo-electronic Materials, Ningbo University, Ningbo, Zhejiang 315211, China. E-mail: hpxcm@nbu.edu.cn
bCAS Key Laboratory of Transparent and Opto-Functional Inorganic Materials, Synthetic Single Crystal Research Center (SSCRC), Shanghai Institute of Ceramics, Chinese Academy of Sciences, Shanghai 201899, China. E-mail: lizhifang123flz@163.com
cKey Laboratory of Materials Physics of Ministry of Education School of Physics and Microelectronics, Zhengzhou University, Zhengzhou, 450052, China
dState Key Laboratory on Integrated Optoelectronics, College of Electronic Science and Engineering and College of Physics, Jilin University, Changchun, Jilin 130012, China
First published on 10th October 2024
Abstract
Near-infrared (NIR) luminescence materials are ideal candidates for applications in three-dimensional biomedical imaging and night vision. Here, we constructed an ultra-broadband NIR material based on LiBaF3:Ni2+ single crystals with NIR emission at 1400 nm and a full width at half maximum (FWHM) of 254 nm from 1100 to 1700 nm wavelengths, covering the NIR-II and NIR-III regions. Through the activation of inactive Mg2+, the NIR emission could be improved by a factor of two, and the FWHM enhanced to 273 nm. This is ascribed to the lattice distortion by the addition of Mg2+ as well as the charge asymmetry between the Mg2+ and Li+ ions. The prepared Ni2+/Mg2+-doped NIR perovskite single crystals were packaged with a commercial high-efficiency near-ultraviolet LED chip (@395 nm) to construct NIR single-crystal LEDs, and their promising applications with high efficiency were demonstrated in NIR night-vision monitoring and vein non-destructive imaging.
1 Introduction
In recent times, near-infrared (NIR) spectroscopy has confirmed its capability to image live tissues non-destructively and non-invasively with high sensitivity and quick response. This technology enables real-time visualization of structural intricacies and biochemical information, which could be beneficial for clinical diagnosis and treatment.1–5 The near-infrared spectrum is typically categorized into NIR-I (650–900 nm), NIR-II (1000–1350 nm), and NIR-III (1300–1700 nm) regions.6,7 The light in NIR-II and NIR-III has better transmittance, lower scattering and absorption within biological tissues, and less auto-fluorescence compared with that in NIR-I due to its longer wavelength, enabling deep tissue penetration and superior image resolution.8,9In recent decades, several NIR light sources, such as high-power fiber-pumped sulfide or fluoride lasers, have been devised to attain high-definition images.10,11 However, they suffered from large sizes, complex designs, and high manufacturing costs, severely hindering their implementation.12,13 Very recently, near-infrared LED technology based on NIR conversion crystals has led to a new generation of near-infrared light sources, which can simplify the packaging of NIR devices, and have strong points of low power usage, superior efficiency, long life, compact design and excellent stability.14,15 So far, most reports have primarily concentrated on near-infrared broadband emission in the NIR-I or NIR-II region below 1600 nm of phosphors and optical devices,16–20 and there is scarce research on broadband, long-wavelength near-infrared emitting materials and light sources of LEDs that covers the NIR-III region.
Generally, active ion-doped solid crystals are favorable materials for NIR conversion under LED excitation due to their high chemical stability and high efficiency.21 The active ions for near-infrared emission can be broadly categorized into trivalent lanthanide ions and transition metal ions. Trivalent lanthanide ions (Er3+, Pr3+, Yb3+, Tm3+, and Nd3+) exhibit narrow-band near-infrared emission characteristics and have low luminous efficiency due to the suppression of the 4f–4f spin transition. On the other hand, transition metal ions such as Mn2+, Fe3+, Cr3+, Cr4+, and Ni2+ produce broadband near-infrared emission by allowing the 3d–3d spin transition. Previous investigation has indicated that Ni2+ in an octahedral lattice emits a broad near-infrared emission spanning from 1100 to 1700 nm by the transition from 3T2g(F) to 3A2g(F) and the spectrum is intricately linked to the crystal structure of the matrix.22,23
The LiBaF3 single crystal is well known for its exceptional characteristics such as high transparency, high thermal stability, low matrix phonon energy, and optical uniformity spanning from ultraviolet to mid-infrared wavelengths. This crystal features an inverted perovskite structure and comprises octahedral lattice ions Li+ and dodecahedron Ba2+, making it a suitable candidate for doping with Ni2+ ions to generate broadband long-wavelength near-infrared emission.16,19,24 In this work, a novel Ni2+-doped LiBaF3 perovskite single crystal with modified Mg2+ ions, exhibiting strong long-wavelength NIR-III emission, was successfully synthesized using the Bridgeman method. Introduction of Mg2+ ions into LiBaF3 single crystals aims to improve the luminescence efficiency of Ni2+ ions by modifying the crystal structure. An LED device capable of emitting long-wavelength near-infrared luminescence by integrating the optimized LiBaF3:Ni2+ single crystal onto a UV LED chip was fabricated.
2 Experiments and characterization
2.1 Preparation of samples
Powders of chemical material of 5 N purity, i.e. BaF2, LiF, MgF2 and NiF2, were employed for growing LiBaF3 single crystals using the Bridgman method. The seed crystal was obtained after multiple spontaneous nucleation growth processes in a completely closed platinum crucible. The growth direction is along the c-axis. The molar compositions of the feed materials are given (in mol%) as follows:LiF![[thin space (1/6-em)]](https://www.rsc.org/images/entities/char_2009.gif) :BaF2 = 60:40
:BaF2 = 60:40
LiF:BaF2:NiF2 = 60:39.8:0.2
LiF:BaF2:NiF2 = 60:39.5:0.5
LiF:BaF2:NiF2 = 60:39:1
LiF:BaF2:NiF2 = 60:38.5:1.5
LiF:BaF2:NiF2 = 60:37:3
LiF:BaF2:NiF2:MgF2 = 60:36.5:3.0:0.5
LiF:BaF2:NiF2:MgF2 = 60:36:3.0:1
These eight samples are successively abbreviated as BN, BN0, BN1, BN2, BN3, BN4, BNM1 and BNM2, respectively. The prepared crystals exhibited transparency and appeared with a light green hue under natural light. The crystals were thinly sliced and polished specimens were measured. Fig. 2(f) shows a crystal sample of diameter 10 mm and length of 45 mm with the burnished slice having a thickness of ∼2 mm.
2.2 Measurements and characterization
A Bruker D8 Advance model X-ray diffractometer was employed to record the X-ray diffraction (XRD) patterns in order to analyze the phase of the samples in the testing range of 20° to 90°. A Horiba Fluorlog 3-111 model fluorescence spectrometer was utilized to record the emission spectrum, excitation spectrum and fluorescence lifetime of the single crystals. A Kratos Axis Ultra DLDX model X-ray photoelectron spectroscope (XPS) was used to detect information on the valence state of Ni ions in the samples. A long-wavelength NIR perovskite crystal LED device was assembled using the optimized LiBaF3:3.0 Ni2+/1.0 Mg2+ single crystal, which was uniformly blended with epoxy resin, applied to a commercial near-ultraviolet LED GaN chip (@395 nm), purchased from San'an Optoelectronics Co, and subsequently heated at 398 K for a duration of 10–15 minutes. The following details the steps for LED encapsulation.The first step is the preparation stage. Before starting the LED encapsulation, we need to prepare the luminescent material and light curing glue. First, mix the luminescent material and glue according to a certain proportion to ensure that the material is fully dispersed in the glue. Then, remove the air bubbles in the mixture through a defoamer to ensure the homogeneity and stability of the mixture. The second step is the coating stage. After the mixture is defoamed, we coat it onto the LED wafer. This process requires the use of professional coating equipment to ensure that the glue evenly covers the surface of the wafer. After coating, the wafer is put into the curing equipment and cured according to the set temperature and time.
All experiments where blood vessels in human hands are observed were performed in compliance with relevant laws and institutional guidelines, and the institutional committee of Shuidi Technology Co., Shenzhen City approved the experiments. We obtained informed consent from the human participants.
3 Results and discussion
3.1 Analysis of the crystal structure
Fig. 1(a) and (b) illustrate the structure of the LiBaF3 single crystal. The crystal exhibits a reverse perovskite cubic lattice structure with the Pm3m space group.25 As known from Fig. 1(b), the Ba2+ ion occupies the vertex position and each Ba2+ is associated with eight unit cells of LiBaF3. On the other hand, the Li+ ion occupies a central position, with each LiBaF3 unit cell sharing a single Li+ ion. Specifically, the Li+ ion coordinates with six F− ions to generate an octahedron, whereas Ba2+ is encircled by twelve F− ions to form a dodecahedron. | ||
| Fig. 1 (a and b)Diagrams of the LiBaF3 crystal structure. (c) Schematic diagram of Ni2+/Mg2+ ions replacing Li+ ions. | ||
The probable lattice sites for Ni2+ ions are Li+ octahedra and Ba2+ dodecahedra. According to Davolos et al., in order to achieve successful ion doping, the permissible radius discrepancy between the substituted sites and dopants should ideally be below 30%.26 The radii of the Ni2+ octahedron, Li+ octahedron and Ba2+ dodecahedron are 0.69 Å, 0.76 Å, and 1.61 Å, respectively. It can be confirmed that Ni2+ ions tended to replace the Li+ octahedra due to the radii differences between Ni2+ octahedra and Li+ octahedra (9.2%) rather than between Ni2+ octahedra and Ba2+ dodecahedra (57.1%). Additionally, when Mg2+ ions are introduced into LiBaF3 single crystals, they also replace Li+ ions due to the smaller radii difference between Mg2+ octahedra and Li+ octahedra (5.3%) than that between Mg2+ octahedra and Ba2+ dodecahedra (55.3%). The charge defects are formed due to the difference in valence states between Li+ and Ni2+/Mg2+ ions. The charge compensation process may involve neighboring Li+ vacancies or the presence of interstitial F− ions in the nearby region. The process of Ni2+/Mg2+ ions replacing Li+ ions is shown schematically in Fig. 1(c).
Fig. 2(a) shows the XRD diffractograms of crystal samples BN0, BN1, BN2, BN3, BN4, BNM1, and BNM2 as well as that of a standard LiBaF3 single crystal. Remarkably, these diffraction patterns exhibit alignment with the corresponding data from the LiBaF3 standard card (PDF#77-0715), showing no additional peaks originating from impurities being found. This indicates that the incorporation of Ni2+ and Mg2+ ions has little impact on the LiBaF3 crystal structure. Fig. 2(b) highlights the strongest plane (100), in which the positions of the corresponding diffraction peaks are shifted towards a smaller angle as the concentration of Mg2+ ions increases from 0 to 1.0 mol%. This shows the successful doping of Mg2+ ions into the crystals and its effect on the crystal structure.
 | ||
| Fig. 2 (a) XRD diffractograms of LiBaF3:α Ni2+ (α = 0.2–3.0% mol) and LiBaF3:3.0 Ni2+/β Mg2+ (α = 0.5 and β = 1.0% mol). (b) Magnified XRD at the (100) crystal face. (c) Variation of lattice parameters following the increase of Ni2+ content. (d and e) Rietveld refinement diagrams for LiBaF3:3.0 Ni2+ and LiBaF3:3.0 Ni2+/1.0 Mg2+ single crystals. (f) Photograph of a single crystal and polished slice of LiBaF3. | ||
The variations in the unit cell volume, and Ba–F and Li–F bond lengths, with different contents of Ni2+ incorporated according to the results of XRD, are shown in Fig. 2(c). As seen Fig. 2(c), an increase in the Ni2+ concentration from 0 to 3.0 mol% leads to a gradual decrease in the average Li–F bond length, while the mean Ba–F bond length remains relatively stable. Ni2+ ions replacing Li+ ions results in a reduction in the unit cell volume. These observations offer additional support to the notion that Ni2+ and Mg2+ ions primarily substitute Li+ lattices rather than Ba2+. In order to determine the structures of LiBaF3 single crystals in detail, Rietveld structure refinement was performed. Table 1 displays the outcomes of the primary refinement parameters following the Rietveld refinement. The results of Rietveld structure refinement for LiBaF3:3.0 mol% Ni2+ and LiBaF3:3.0 mol% Ni2+/1.0 mol% Mg2+ crystals using XRD are depicted and compared in Fig. 2(d) and (e) to investigate the impact of Mg2+ ions on the crystals directly. It is clear from Table 1, and Fig. 2(d) and (e) that doped Ni2+ and Mg2+ ions both affect the cell volume and make the cell parameters smaller, which is consistent with the outcomes of XRD. The refined results of all samples were all less than 10% with the maximum profile coefficient (Rp) = 8.92% and weighted profile coefficient (Rwp) = 7.09%. Furthermore, chi-square (χ2) values less than 4.21 validate the credibility and reliability of the results obtained. The refined outcomes suggest that the majority of Mg2+ and Ni2+ ions have been incorporated into the Li+ sites.
| Sample | Space group | a = b = c(Å) | V (Å3) | R p (%) | R wp (%) | χ 2 (%) |
|---|---|---|---|---|---|---|
| a, b, and c are the axial lengths of the crystal cells, respectively, V is the volume of the crystal cell, Rp is the profile coefficient, Rwp is the weighted profile coefficient and χ2 is the goodness of fit. | ||||||
| BN0 |
Fm![[3 with combining macron]](https://www.rsc.org/images/entities/char_0033_0304.gif) m m |
3.99607 | 63.692 | 5.15 | 7.09 | 2.81 |
| BN1 |
Fmm |
3.99533 | 63.451 | 4.58 | 5.44 | 4.18 |
| BN2 |
Fmm |
3.99357 | 63.195 | 4.09 | 5.93 | 3.52 |
| BN3 |
Fmm |
3.99261 | 62.651 | 8.38 | 5.42 | 3.07 |
| BN4 |
Fmm |
3.99088 | 62.042 | 8.92 | 4.38 | 3.41 |
| BNM1 |
Fmm |
3.98992 | 61.937 | 6.67 | 5.11 | 4.21 |
| BNM2 |
Fmm |
3.98917 | 61.822 | 7.51 | 4.89 | 2.98 |
3.2 Luminescence properties
Fig. 3(a) displays the absorption spectra of samples BN, BN4 and BNM2 spanning from 250 to 2000 nm. The absorption spectra reveal peaks at 395 nm, 809 nm and 1397 nm corresponding to the transitions from 3A2(F) to 3T1(P), 3T1(F), and 3T2(F) of the activator Ni2+ ions.27 As shown in Fig. 3(a), the addition of Mg2+ ions makes no impact on the absorption spectra. It is noteworthy that the 395 nm absorption band ranging from 360 to 420 nm aligns effectively with that of commercial UV LEDs, suggesting that the related Ni2+-doped single crystals can be effectively stimulated by UV LEDs. The absorption diagrams of LiBaF3:3.0 mol% Ni2+ and LiBaF3:3.0 mol% Ni2+/1.0 mol% Mg2+ samples near 395 nm are depicted as in Fig. 3(b). As can be seen in Fig. 3(b), the intensity of the absorption coefficient is enhanced by about 0.08 cm−1 after doping with Mg2+ ions, and the half peak width of the absorption at 395 nm is increased from 82.7 nm to 85.5 nm. In summary, Mg2+ ion doping enhances the absorption coefficient of the crystal. | ||
| Fig. 3 (a) Absorption spectra of BN, BN4 and BNM2 single crystals. (b) Absorption spectra of BN4 and BNM2 single crystals near 395 nm. | ||
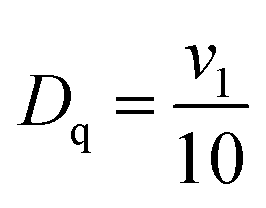
Fig. 4(a) depicts the XPS data obtained from the BN4 single crystal. As can be seen in Fig. 4(a), the XPS spectrum includes signals of F, C, Li, Ba and Ni ions. However, the low concentration of Ni in the crystal led to the weaker intensity of Ni 2p. Fig. 4(b) shows the XPS spectrum with the high resolution of the 2p orbital for Ni. The binding energies at 876.2 eV are detected, which can be attributed to Ni2+ 2p1/2, while those observed at 857.3 eV can be ascribed to Ni2+ 2p3/2.28 This clearly suggests the incorporation of Ni2+ ions within the LiBaF3 crystal. Fig. 4(c) depicts the XPS data obtained from the BNM2 single crystal. Compared to Fig. 4(a), the XPS spectrum of Fig. 4(c) also includes signals for Mg ions, which proves the presence of Mg2+ ions in the BNM2 single crystal sample. However, the doping concentration of Mg2+ in the crystal is only 1% mol, resulting in weak intensity of Mg 1s. Fig. 4(d) presents the XPS spectrum with the high resolution of the 1s orbital for Mg. The binding energies at 1304.5 eV are detected, which can be attributed to Mg2+ 1s.29–31 This clearly suggests the incorporation of Mg2+ ions within the BNM2 single crystal.
 | ||
| Fig. 4 (a) XPS survey spectrum of LiBaF3:3.0 Ni2+. (b) The high resolution XPS spectrum of Ni 2p. (c) XPS survey spectrum of LiBaF3:3.0 Ni2+/1.0 Mg2+. (d) The high resolution XPS spectrum of Mg 1s. | ||
Fig. 5(a) shows the NIR emission spectra of LiBaF3:α Ni2+ (α = 0.2, 0.5, 1.0, 1.5, 3.0 mol%) single crystals excited by 395 nm near-ultraviolet light. The emitted NIR light covers a broad spectrum from 1100 to 1700 nm, with a peak at around 1400 nm and an FWHM of approximately 254 nm, effectively spanning the NIR-III band. This emission behavior is due to the permitted transition from the 3T2(F) to 3A2(F) level of Ni2+ ions within the LiBaF3 crystals. These data clearly indicate that as the doping content of Ni2+ ions increases, their light-emitting intensity gradually increases. The present doping concentration of 3.0 mol% Ni2+ ions in the LiBaF3 single crystal has not shown a decreasing trend in the luminescence intensity, indicating that the doping level of Ni2+ ions could not cause concentration quenching effects. Our many experiments have shown that further increasing the doping concentration of Ni2+ ions can easily result in the cracking of the single crystal, making it difficult to obtain large-sized single crystals with high quality.
 | ||
| Fig. 5 (a) NIR light-emitting spectra of the LiBaF3:α Ni2+ (α = 0.2–3.0 mol%) single crystal. (b) NIR emission spectra of the LiBaF3:3.0 Ni2+/β Mg2+ (β = 0, 0.5, 1.0 mol%) single crystal. (c) Normalized light-emitting intensity of various single-crystal samples. (d) The value of FWHM of various single-crystal samples. | ||
Fig. 5(b) shows the NIR light-emitting spectra of the single crystals of LiBaF3 with fixed 3.0 mol% Ni2+ doping and 0.5 mol% and 1.0 mol% Mg2+ co-doping. As revealed in Fig. 5(b), the addition of Mg2+ ions did not lead to a noticeable shift in the emission peak positions. However, samples BNM1 and BNM2 after being modified by Mg2+ ions exhibited significant enhancement in emission intensity at 1400 nm compared with sample BN4.
Fig. 5(c) illustrates the variations in normalized fluorescence intensity at 1400 nm for single-crystal samples BN0, BN1, BN2, BN3, BN4, BNM1, and BNM2. In the Ni2+ single-doped samples, the emission intensity at 1400 nm increases as the doping content of Ni2+ increases from 0 mol% to 3.0 mol%. The light-emitting intensity of the BN4 sample at 1400 nm is approximately 1.9 times that of the BN0 sample. On further introduction of 1.0 mol% Mg2+ ions into sample BN4, the emission intensity at 1400 nm was promoted to approximately 2.3 times that of the BN0 sample.
Fig. 5(d) shows the effective NIR emission broadband of the single crystals. As displayed in Fig. 5(d), the FWHM of the NIR band progressively increases from 254 nm to 258 nm as the single doping concentration of Ni2+ ions increases from 0.2 mol% to 3.0 mol%. It can be noted that the subsequent introduction of Mg2+ ions results in a significant enhancement of FWHM, expanding from 258 nm to 273 nm. The wide broad spectrum meets the wavelength selectivity needs of various applications and is fit for special optical devices.
The impact of Mg2+ ions on the spectra of the single crystals may be explained through the following main aspects. First, the addition of Mg2+ ions increases the asymmetry of the unit cell due to replacing the Li+ lattice sites, leading to lattice distortion, which is reflected in the results of Rietveld refinement listed in Table 1. This distortion, along with the alteration in local crystal field symmetry due to differences in ion radius, helps overcome the limitations of the 3d electronic transition of rare earth elements, thereby enhancing the radiative transition efficiency of Ni2+ ions. Additionally, the charge asymmetry between Mg2+ and Li+ ions can induce changes in the crystal's local structure and cause significant distortion of the unit cell. Finally, the addition of Mg2+ ions enhances the absorption coefficients of the crystals, which enhances the luminescence intensity of the Ni2+ ions. The effects of the above factors significantly impact the NIR emission spectra of the single crystals.
To further gain deeper understanding of the impact of Ni2+/Mg2+ ions on optical spectra, the decay curves of the Ni2+:3T2 level at 1400 nm upon excitation using a 395 nm laser of LiBaF3:α Ni2+ (α = 0.2, 0.5, 1.0, 1.5, 3.0 mol%) and LiBaF3:3.0 Ni2+/β Mg2+ (β = 0.5, 1.0 mol%) are shown in Fig. 6(a). The lifetime curves fit the single exponential function. As shown in Fig. 6(a), as the Ni2+ concentration increases from 0.2 mol% to 3.0 mol%, the fluorescence lifetime increases from 2.91 ms to 3.49 ms. Notably, the fluorescence lifetime is significantly enhanced after the addition of 1.0 mol% Mg2+ ions, reaching up to 4.02 ms.
 | ||
| Fig. 6 (a) Decay curves and the average lifetimes of the Ni2+: 3A2 → 3T2 level under 395 nm wavelength excitation of LiBaF3:α Ni2+ (α = 0.2–3.0% mol) and LiBaF3:3.0 Ni2+/β Mg2+ (α = 0.5 and β = 1.0% mol). (b) Tanabe–Sugano diagram of Ni2+/Mg2+ in the octahedral crystal field of LiBaF3:3.0 Ni2+/1.0 Mg2+single crystals. | ||
The Tanabe–Sugano energy level diagram is instrumental in illustrating the splitting state of the 3d8 energy levels for Ni2+ ions within an octahedral crystal field. When Ni2+ (3d8) ions are positioned in an octahedral coordination environment, their crystal field strength can be effectively characterized using the Tanabe–Sugano theory. The values for the crystal field strength parameter Dq and the Racah parameter B can be determined using the following equations:32,33
 | (1) |
 | (2) |
316.46 cm−1], 809 nm [3A2g(F) → 3T1g(F), 12360.94 cm−1], and 1379 nm [3A2g(F) → 3T2g(F), 7251.63 cm−1], respectively. As depicted in Fig. 6(b), the x-axis represents the ratio of Dq/B. Similarly, the y-axis corresponds to the transition energy normalized by B, thus illustrating the energy scale relative to the Racah parameter. Fig. 6(b) depicts the obtained Tanabe–Sugano diagram for the d8 electron (Ni2+) configuration in an octahedral crystal field. As seen in Fig. 6(b), the boundary distinguishing between weak and strong crystal field regimes can be recognized by the intersection of the first spin-singlet 1Eg(D) state and the 3T2g(F) states. Specifically, this intersection delineates the regions where the first excited state, 3T2, is associated with the same 3F term as the 3A2 ground state, indicative of a weak crystal field, and where the first excited state, 1E, stems from the 1D term, which is characteristic of a strong crystal field environment.34 Based on the given parameters, the calculated value of Dq/B is 0.905 (<1), suggesting that the Ni2+ ion is located in a weak crystal field setting.
In addition, thermal stability is an important index to evaluate the practical value of NIR LEDs. To investigate the luminescence thermal stability of LiBaF3:Ni2+ and LiBaF3:Ni2+/Mg2+ near-infrared crystals, the emission spectra of the single crystals at different temperatures from 293 to 473 K were recorded. As shown in Fig. 7(a) and (b), it is obvious that the emission intensity of the crystal decreases gradually with increasing temperature. As shown in Fig. 7(c), at 473 K, the NIR emission intensity of the crystal is only 39.4% of the emission intensity at room temperature. However, after doping with Mg2+ ions, the NIR emission intensity of the crystals at 473 K is 62.9% of the emission intensity at room temperature. This value is better than that of most current NIR LEDs, such as the NIR emission intensity of the MGTOB:Ni2+ phosphor at 420 K, which is 47% of the emission intensity at room temperature while the NIR emission intensity of the MgGa2O4:Cr3+,Ni2+ phosphor at 483 K is only 40% of the emission intensity at room temperature.35,36 In addition, the thermal activation energy of the crystals before and after Mg2+ ion doping was calculated by the Arrhenius equation, and the activation energy values of the luminescent crystals can be calculated using the function as follows:37,38
 | (3) |
 | ||
| Fig. 7 (a) Temperature-dependent emission spectra of LiBaF3:3.0 Ni2+ (λex = 395 nm). (b) Temperature-dependent emission spectra of LiBaF3:3.0 Ni2+/1.0 Mg2+ (λex = 395 nm). (c) The dependence of normalized intensity on temperature. (d) The dependence of ln (I0/IT − 1) on (1/kT). The solid line is the fitted line. | ||
Fig. 8(a) shows an NIR perovskite single-crystal LED device fabricated by blending the BNM2 long-wavelength NIR single crystal with epoxy resin in a precise ratio and coating this onto a near-UV GaN chip (@395 nm). Upon application of a driving current, the device emitted a robust broadband NIR light (spanning 1100–1700 nm) alongside a faint emission at approximately 395 nm. As shown in Fig. 8(b), in the driving current-dependent NIR spectra, the intensity of the NIR light emitted by the NIR perovskite single-crystal LED intensified as the driving current increased from 20 to 200 mA. It can be seen from Fig. 8(c) that the electroluminescence (EL) conversion efficiencies of the device change as the driving current increases such that the measured EL conversion efficiency of the 395 nm near-UV GaN chip-driven NIR perovskite single-crystal LED under various chip-driving currents was 2.62% at 20 mA, which reduced to 1.02% as the current was raised to 200 mA (Fig. 8c). The noticeable “efficiency decline” phenomenon of the near-UV GaN chip resulted in comparatively reduced power and luminous efficiency of the LED lighting device. The optimum photoelectric conversion efficiency of the prepared LiBaF3:Ni2+/Mg2+ crystal LED is 2.62%, which is better than that of most of the current NIR LEDs, such as MGTOB:Ni2+ (1.4%) and MgTa2O6:Ni2+ (0.99%).36,39
 | ||
| Fig. 8 (a) Light-emitting spectrum of the synthesized NIR perovskite single-crystal LED fabricated by combining a near-ultraviolet LED chip (@395 nm) and LiBaF3:3.0 Ni2+/1.0 Mg2+ single crystal. The inset images are of the as-obtained NIR perovskite crystal LED and the NIR perovskite single-crystal LED device when it is on with and without the filter added, respectively. (b) The driving current-dependent NIR emission spectra. (c) Electroluminescence conversion efficiencies of the NIR perovskite single-crystal LED device varies with driving current ranging from 20 to 200 mA. (d and e) The fabricated NIR perovskite single-crystal LED device utilized for night vision illumination and for capturing optical images of blood vessels in human hands. | ||
As is well known, NIR illumination is renowned for its ability to penetrate biological tissues, and long-wavelength NIR light is absorbed and scattered much less compared to visible light. The employment of NIR-LEDs for night vision and biological imaging applications is depicted in Fig. 8(d) and (e), respectively. The morphologies of fruits and human hands are plainly captured by an NIR camera utilizing NIR LEDs as lighting sources. Additionally, as displayed in Fig. 8(e), the intricate pattern of veins within a finger is distinctly visible when illuminated by NIR LEDs, demonstrating the ability of NIR light to penetrate certain biological tissues without causing damage. The imaging resolution is an important parameter for assessing the imaging capability. The imaging resolution of the images in Fig. 8(d) and (e) is 6000 × 4000 pixels, which is much larger than that of the CQD filter (128 × 128 pixels) and exceeds that of most other commercially available NIR display pixels.40 The outcome suggests that the BNM2 broadband long-wavelength NIR perovskite single-crystal LED holds significant promise for applications in NIR biomedical imaging.
4 Conclusions
In summary, Ni2+ ions can be doped efficiently in LiBaF3 perovskite single crystals, and the crystals exhibit long wavelength near-infrared broadband emission with a spectral coverage that ranges from 1100 to 1700 nm under ultraviolet 395 nm light excitation. After doping with Mg2+ ions, the fluorescence intensity can be increased by 2 times and the FWHM increased from 254 nm to 273 nm. The introduction of non-active Mg2+ ions leads to local lattice distortion and charge asymmetry of the Ni2+ ions, ultimately enhancing the optical performance of the crystals as inferred from the changes of crystal structure and near-infrared optical properties. Optimized LiBaF3:Ni2+/Mg2+ single crystals were chosen to prepare an NIR perovskite single-crystal LED device with a near-ultraviolet chip (@395 nm), which emits broad-band long-wavelength near-infrared light and shows effective tissue penetration capability and superior clarity in imaging the deep tissue of human hands. This research broadens the range of the near-infrared spectral bandwidth for potential applications in near-infrared optical imaging.Author contributions
The manuscript was written through contributions of all authors. All authors have given approval to the final version of the manuscript.Data availability
The data are available from the corresponding author on reasonable request.Conflicts of interest
The authors declare no competing financial interest.Acknowledgements
The work was supported by the National Natural Science Foundation of China (No. 62275133) and the Natural Science Foundation of Zhejiang Province (No. LY22E020002).References
- Z. W. Pan, Y. Y. Lu and F. Liu, Sunlight-activated long-persistent luminescence in the near-infrared from Cr3+-doped zinc gallogermanates, Nat. Mater., 2012, 11, 58–63 CrossRef CAS
.
- G. S. Hong, S. Diao, J. L. Chang, A. L. Antaris, C. X. Chen, B. Zhang, S. Zhao, D. N. Atochin, P. L. Huang, K. I. Andreasson, C. J. Kuo and H. J. Dai, Through-skull fluorescence imaging of the brain in a new near-infrared window, Nat. Photonics, 2014, 8, 723–730 CrossRef CAS
- L. X. Shi, J. J. Shao, X. H. Jing, W. W. Zheng, H. Liu and Y. Zhao, Autoluminescence-Free Dual Tumor Marker Biosensing by Persistent Luminescence Nanostructures, ACS Sustainable Chem. Eng., 2020, 8, 686–694 CrossRef CAS
- P. Si, E. Yuan, O. Liba, Y. Winetraub, S. Yousefi, E. D. SoRelle, D. W. Yecies, R. Dutta and A. de la Zerda, Gold Nanoprisms as Optical Coherence Tomography Contrast Agents in the Second Near-Infrared Window for Enhanced Angiography in Live Animals, ACS Nano, 2018, 12, 11986–11994 CrossRef CAS
- N. M. Israelsen, C. R. Petersen, A. Barh, D. Jain, M. Jensen, G. Hannesschläger, P. Tidemand-Lichtenberg, C. Pedersen, A. Podoleanu and O. Bang, Real-time high-resolution mid-infrared optical coherence tomography, Light: Sci. Appl., 2019, 8, 11 CrossRef
- A. M. Smith, M. C. Mancini and S. M. Nie, BIOIMAGING Second window for in vivo imaging, Nat. Nanotechnol., 2009, 4, 710–711 CrossRef CAS
- L. A. Sordillo, Y. Pu, S. Pratavieira, Y. Budansky and R. R. Alfano, Deep optical imaging of tissue using the second and third near-infrared spectral windows, J. Biomed. Opt., 2014, 19, 056004 CrossRef
- J. F. de Boer, C. K. Hitzenberger and Y. Yasuno, Polarization sensitive optical coherence tomography - a review Invited, Biomed. Opt. Express, 2017, 8, 1838–1873 CrossRef
- N. Ozaki, D. T. D. Childs, J. Sarma, T. S. Roberts, T. Yasuda, H. Shibata, H. Ohsato, E. Watanabe, N. Ikeda, Y. Sugimoto and R. A. Hogg, Superluminescent diode with a broadband gain based on self-assembled InAs quantum dots and segmented contacts for an optical coherence tomography light source, J. Appl. Phys., 2016, 119, 083107 CrossRef
- Z. Y. Lei, W. L. Zhang, B. Li, G. Q. Guan, X. J. Huang, X. Peng, R. J. Zou and J. Q. Hu, A full-spectrum-absorption from nickel sulphide nanoparticles for efficient NIR-II window photothermal therapy, Nanoscale, 2019, 11, 20161–20170 RSC
- B. Qu, R. Moncorgé, Z. P. Cai, J. L. Doualan, B. Xu, H. Y. Xu, A. Braud and P. Camy, Broadband-tunable CW laser operation of Pr3+:LiYF4 around 900 nm, Opt. Lett., 2015, 40, 3053–3056 CrossRef CAS
- V. Lupei, A. Lupei, C. Tiseanu, S. Georgescu, C. Stoicescu and P. M. Nanau, High-resolution optical spectroscopy of YAG-Nd - a test for structural and distribution models, Phys. Rev. B: Condens. Matter Mater. Phys., 1995, 51, 8–17 CrossRef CAS
- M. H. Fang, Z. Bao, W. T. Huang and R. S. Liu, Evolutionary Generation of Phosphor Materials and Their Progress in Future Applications for Light-Emitting Diodes, Chem. Rev., 2022, 122, 11474–11513 CrossRef CAS
- Y. Q. Sun, L. S. Ge, L. J. Dai, C. S. Cho, J. F. Orri, K. Y. Ji, S. J. Zelewski, Y. Liu, A. J. Mirabelli, Y. C. Zhang, J. Y. Huang, Y. S. Wang, K. Gong, M. C. Lai, L. Zhang, D. Yang, J. D. Lin, E. M. Tennyson, C. Ducati, S. D. Stranks, L. S. Cui and N. C. Greenham, Bright and stable perovskite light-emitting diodes in the near-infrared range, Nature, 2023, 615, 830–835 CrossRef CAS
- L. Zhu, H. Cao, C. Xue, H. Zhang, M. C. Qin, J. Wang, K. C. Wen, Z. W. Fu, T. Jiang, L. Xu, Y. Zhang, Y. Cao, C. Tu, J. Zhang, D. W. Liu, G. B. Zhang, D. C. Kong, N. Fan, G. Q. Li, C. Yi, Q. M. Peng, J. Chang, X. H. Lu, N. N. Wang, W. Huang and J. P. Wang, Unveiling the additive-assisted oriented growth of perovskite crystallite for high performance light-emitting diodes, Nat. Commun., 2021, 12, 5081 CrossRef CAS
- B. M. Liu, X. X. Guo, L. Y. Cao, L. Huang, R. Zou, Z. Zhou and J. Wang, A High-efficiency blue-LED-excitable NIR-II-emitting MgO:Cr3+,Ni2+phosphor for future broadband light source toward multifunctional NIR spectroscopy applications, Chem. Eng. J., 2023, 452, 139313 CrossRef CAS
- J. W. Qiao, S. Zhang, X. Q. Zhou, W. B. Chen, R. Gautier and Z. G. Xia, Near-Infrared Light-Emitting Diodes utilizing a Europium-Activated Calcium Oxide Phosphor with External Quantum Efficiency of up to 54.7%, Adv. Mater., 2022, 34, 2201887 CrossRef CAS
- G. L. Yu, W. R. Wang and C. Jiang, Linear tunable NIR emission via selective doping of Ni2+ion into ZnX2O4 (X = Al, Ga, Cr) spinel matrix, Ceram. Int., 2021, 47, 17678–17683 CrossRef CAS
- L. F. Yuan, Y. H. Jin, D. Y. Zhu, Z. F. Mou, G. M. Xie and Y. H. Hu, Ni2+-Doped Yttrium Aluminum Gallium Garnet Phosphors: Bandgap Engineering for Broad-Band Wavelength-Tunable Shortwave-Infrared Long-Persistent Luminescence and Photochromism, ACS Sustainable Chem. Eng., 2020, 8, 6543–6550 CrossRef CAS
- C. P. Wang, Y. X. Zhang, X. Han, D. F. Hu, D. P. He, X. M. Wang and H. Jiao, Energy transfer enhanced broadband near-infrared phosphors: Cr3+/Ni2+ activated ZnGa2O4-Zn2SnO4 solid solutions for the second NIR window imaging, J. Mater. Chem. C, 2021, 9, 4583–4590 RSC
- J. H. Li, D. C. Zhou, Y. Liu, Y. Chen, J. Y. Chen, Y. Yang, Y. Gao and J. B. Qiu, Engineering CsPbX3 (X = Cl, Br, I) Quantum Dot-Embedded Borosilicate Glass through Self-Crystallization Facilitated by NaF as a Phosphor for Full-Color Illumination and Laser-Driven Projection Displays, ACS Appl. Mater. Interfaces, 2023, 15, 22219–22230 CrossRef CAS
- J. Y. Chen, Y. Gao, J. L. Chen, X. R. Lu, M. D. Tan and J. B. Qiu, Designing and controlling the Ni2+-activated (Zn, Mg)Al2O4 spinel solid-solution for phosphor-converted broadband near-infrared illumination, J. Mater. Chem. C, 2023, 11, 2217–2228 RSC
- F. Liu, Y. J. Liang, Y. F. Chen and Z. W. Pan, Divalent Nickel-Activated Gallate-Based Persistent Phosphors in the Short-Wave Infrared, Adv. Opt. Mater., 2016, 4, 562–566 CrossRef CAS
- C. Q. Ma, H. H. Liu, F. Ren, Z. Liu, Q. Sun, C. J. Zhao and Z. Li, The Second Near-Infrared Window Persistent Luminescence for Anti-Counterfeiting Application, Cryst. Growth Des., 2020, 20, 1859–1867 CrossRef CAS
- Q. P. Qiang, W. B. Chen, X. L. Ma and Y. H. Wang, The crystal structure and upconversion properties of Yb3+, Er3+/Ho3+ codoped BaLiF3 microcrystals with different morphologies, Dalton Trans., 2015, 44, 6242–6248 RSC
- A. M. Pires and M. R. Davolos, Luminescence of europium(III) and manganese(II) in barium and zinc orthosilicate, Chem. Mater, 2001, 13, 21–27 CrossRef CAS
- Q. Q. Zhang, D. J. Liu, Z. N. Wang, P. P. Dang, H. Z. Lian, G. G. Li and J. Lin, LaMgGa11O19:Cr3+,Ni2+ as Blue-Light Excitable Near-Infrared Luminescent Materials with Ultra-Wide Emission and High External Quantum Efficiency, Adv. Opt. Mater., 2023, 11, 2202478 CrossRef CAS
- Z. W. Fu, J. T. Hu, W. L. Hu, S. Y. Yang and Y. F. Luo, Quantitative analysis of Ni2+/Ni3+ in Li NixMnyCoz O2 cathode materials: Non-linear least-squares fitting of XPS spectra, Appl. Surf. Sci., 2018, 441, 1048–1056 CrossRef CAS
- J. P. Meng, L. H. Xu, D. H. Wang, K. Xue, L. P. Luo and X. Z. Shi, The activation mechanism of metal ions on spodumene flotation from the perspective of in situ ATR-FTIR and ToF-SIMS, Miner. Eng., 2022, 182, 107567 CrossRef CAS
- S. M. Zhang, J. Q. Xiahou, X. D. Sun and Q. Zhu, Incorporation of Mg2+/Si4+ in ZnGa2O4:Cr3+ to Generate Remarkably Improved Near-Infrared Persistent Luminescence, Coatings, 2022, 12, 1239 CrossRef CAS
- H. H. Li, J. Z. Liang, R. Z. Li and C. K. Chang, Enhanced orange persistence in Sr3Al2O5Cl2:Eu2+, Dy3+ phosphor by Mg2+ substitution in Sr2+ lattice site, J. Alloys Compd., 2022, 910, 164896 CrossRef CAS
- L. F. Yuan, Y. H. Jin, H. Y. Wu, K. Y. Deng, B. Y. Qu, L. Chen, Y. H. Hu and R. S. Liu, Ni2+-Doped Garnet Solid-Solution Phosphor-Converted Broadband Shortwave Infrared Light-Emitting Diodes toward Spectroscopy Application, ACS Appl. Mater. Interfaces, 2022, 14, 4265–4275 CrossRef CAS
- H. Shigemura, M. Shojiya, R. Kanno, Y. Kawamoto, K. Kadono and M. Takahashi, Optical property and local environment of Ni2+ in fluoride glasses, J. Phys. Chem. B, 1998, 102, 1920–1925 CrossRef CAS
- Y. Tanabe and S. Sugano, On the absorption spectra of complex ions II, J. Phys. Soc. Jpn., 1954, 9, 766–779 CrossRef CAS
- S. H. Miao, Y. J. Liang, R. Q. Shi, W. L. Wang, Y. F. Li and X. J. Wang, Broadband Short-Wave Infrared-Emitting MgGa2O4:Cr3+, Ni2+ Phosphor with Near-Unity Internal Quantum Efficiency and High Thermal Stability for Light-Emitting Diode Applications, ACS Appl. Mater. Interfaces, 2023, 15, 32580–32588 CrossRef CAS
- L. M. Fang, L. P. Lu, L. L. Zhang, H. Wu, H. J. Wu, G. H. Pan, Z. D. Hao and J. H. Zhang, Ni2+ activated broadband near-infrared II germanate phosphor for pc-LED applications, J. Alloys Compd., 2024, 1003, 175743 CrossRef CAS
- L. N. Cao, W. Li, B. Devakumar, N. Ma, X. Y. Huang and A. F. Lee, Full-Spectrum White Light-Emitting Diodes Enabled by an Efficient Broadband Green-Emitting CaY2ZrScAl3O12:Ce3+ Garnet Phosphor, ACS Appl. Mater. Interfaces, 2022, 14, 5643–5652 CrossRef CAS
- Y. Zhang, S. H. Miao, Y. J. Liang, C. Liang, D. X. Chen, X. H. Shan, K. N. Sun and X. J. Wang, Blue LED-pumped intense short-wave infrared luminescence based on Cr3+-Yb3+-co-doped phosphors, Light: Sci. Appl., 2022, 11, 136 CrossRef CAS
- F. M. Zhu, Y. Gao, B. M. Zhu, L. Huang and J. B. Qiu, Ni2+-doped MgTa2O6 phosphors capable of near-infrared II and III emission under blue-light excitation, Chem. Eng. J., 2024, 479, 147568 CrossRef CAS
- H. Y. Meng, Y. Gao, X. H. Wang, X. Y. Li, L. L. Wang, X. Zhao and B. Q. Sun, Quantum dot-enabled infrared hyperspectral imaging with single-pixel detection, Light: Sci. Appl., 2024, 13, 121 CrossRef CAS
| This journal is © the Partner Organisations 2024 |