 Open Access Article
Protein flexibility reduces solvent-mediated friction barriers of ligand binding to a hydrophobic surface patch†
Christopher
Päslack
a,
Lars V.
Schäfer
 *a and
Matthias
Heyden
 *b
*b
aTheoretical Chemistry, Faculty of Chemistry and Biochemistry, Ruhr University Bochum, D-44780 Bochum, Germany. E-mail: lars.schaefer@ruhr-uni-bochum.de; Fax: +49 234 3214045; Tel: +49 234 3221582
bSchool of Molecular Sciences, Arizona State University, Tempe, AZ 85287-1604, USA. E-mail: heyden@asu.edu; Tel: +1 480 965-3980
First published on 25th February 2021
Abstract
Solvent fluctuations have been explored in detail for idealized and rigid hydrophobic model systems, but so far it has remained unclear how internal protein motions and their coupling to the surrounding solvent affect the dynamics of ligand binding to biomolecular surfaces. Here, molecular dynamics simulations were used to elucidate the solvent-mediated binding of a model ligand to the hydrophobic surface patch of ubiquitin. The ligand's friction profiles reveal pronounced long-time correlations and enhanced friction in the vicinity of the protein, similar to idealized hydrophobic surfaces. Interestingly, these effects are shaped by internal protein motions. Protein flexibility modulates water density fluctuations near the hydrophobic surface patch and smooths out the friction profile of ligand binding.
1 Introduction
Water plays an important role in molecular recognition and receptor–ligand binding.1,2 The properties of water in the hydration shell of biomolecules such as proteins and membranes as well as the couplings between them have been the subject of numerous studies.3–15 Altered solvent dynamics were found to be important for ligand binding by mediating the interactions between receptor and ligand.16–22 In addition, near hydrophobic protein surfaces or in confinement, “dewetting” and capillary fluctuations were shown to contribute to driving forces of self-assembly and association,23,24i.e., the partial dewetting (or desolvation) of a binding site contributes to the thermodynamics and kinetics of binding. Protein vibrations and conformational fluctuations have also been shown to bear the potential for non-trivial contributions to ligand binding, for example due to changes in the protein conformational entropy that have been probed in pioneering NMR relaxation experiments as well as in molecular simulations.25–28 The relationship between protein conformational fluctuations and binding dynamics has been studied in the context of the solvent viscosity, which led to the concept of solvent slaving29 that is an active field of debate.30,31 However, more direct correlations between protein flexibility and the dynamics of ligand binding have not yet been studied in detail.The role of solvent fluctuations in idealized hydrophobic cavity–ligand systems was investigated computationally by Setny et al.32 The stochastic motion of the ligand is intimately coupled to the wet/dry oscillations of the hydrophobic binding cavity, which introduces long-time correlations in the random force auto-correlation function. Dry ligand-binding cavities were also observed in proteins using magnetic relaxation dispersion,33 and Mössbauer and neutron scattering experiments showed that solvent fluctuations in a protein hydration shell can control protein motion and function.34 Furthermore, it was shown how proteins can use hydrophobicity to shape biomolecular interactions by driving solvated binding sites away or towards the wet state depending on their chemistry and topology,35 thereby rendering the hydration shells susceptible to perturbations.36
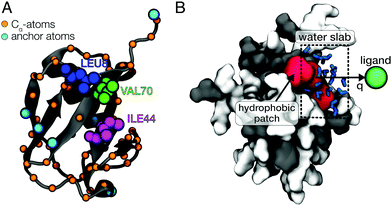
In this work, we use all-atom molecular dynamics (MD) simulations to characterize the atomic-level details of the coupling of ligand motion to solvent fluctuations in a protein–ligand system. Ubiquitin (UBQ) was used as a model protein to investigate the impact of protein flexibility on the dynamics of ligand binding to a hydrophobic protein surface patch. The residues Leu-8, Ile-44 and Val-70 are known as the hydrophobic patch (HP) of UBQ (Fig. 1A), which is essential for proteosomal degradation.37 The model ligand used in this study was a single van der Waals sphere with a moderate binding free energy to the HP (simulation details can be found in ESI†). Our simulations reveal that protein flexibility can facilitate ligand binding by reducing the solvent-mediated friction on the ligand and altering the water density fluctuations near the HP surface.
2 Methods
2.1 Simulation protocol
All simulations were performed using the GROMACS software package (version 4.6.1).38 The CHARMM2739 protein force field and the TIP4P/2005 water model40 were used. Our specific choice of the TIP4P/2005 water model was motivated by its realistic description of dynamical properties such as the water self-diffusion.40 The Lennard-Jones (12,6) potential parameters for the spherical model ligand were σ = 4 Å and ε = 0.025 kJ mol−1, while its mass was set to 39.95 g mol−1. The protein was placed in a large 80 Å × 80 Å × 80 Å cubic box and was solvated with 16![[thin space (1/6-em)]](https://www.rsc.org/images/entities/char_2009.gif) 545 water molecules. Umbrella sampling41 was then performed in the canonical ensemble (NVT) at 300 K using 15 windows with 1 Å-spacings of the ligand position on the reaction coordinate q, which was defined as the distance between the ligand and the center of mass (COM) of the amino acid residues forming the HP with a negative offset of 3 Å (i.e., surface contact for q = 0 Å). The ligand was positioned on a vector perpendicular to the HP surface and the system was oriented to align this vector with the x-axis (see Fig. 1B). The force constant of the harmonic biasing potential was 1000 kJ mol−1 nm−2 and the ligand was restrained by harmonic restraining potentials in the orthogonal directions (y, z) with force constants of 1500 kJ mol−1 nm−2. Each umbrella window was simulated for 2.1 ns (10 ns for the frozen protein). These simulation times are sufficient to sample picosecond timescale hydration water dynamics and, at the same time, short enough to minimize protein side-chain fluctuations and other conformational changes. Slow protein conformational dynamics – on multi-nanosecond timescales and beyond – are not expected to dynamically couple to intermolecular vibrations and picosecond processes in hydration water due to the separation of timescales. Dynamical coupling, such as correlated vibrational motion in the protein and its hydration shell, primarily occurs on the sub-picosecond and picosecond timescale and was analyzed in previous work.13,42 The first 100 ps of all production simulations were considered additional equilibration time and were therefore excluded from the subsequent analyses. We verified the convergence by performing longer simulations (4.2 ns, with the first 200 ps omitted from analysis) for a few selected umbrella windows. For a detailed description of the methods, see ESI.†
545 water molecules. Umbrella sampling41 was then performed in the canonical ensemble (NVT) at 300 K using 15 windows with 1 Å-spacings of the ligand position on the reaction coordinate q, which was defined as the distance between the ligand and the center of mass (COM) of the amino acid residues forming the HP with a negative offset of 3 Å (i.e., surface contact for q = 0 Å). The ligand was positioned on a vector perpendicular to the HP surface and the system was oriented to align this vector with the x-axis (see Fig. 1B). The force constant of the harmonic biasing potential was 1000 kJ mol−1 nm−2 and the ligand was restrained by harmonic restraining potentials in the orthogonal directions (y, z) with force constants of 1500 kJ mol−1 nm−2. Each umbrella window was simulated for 2.1 ns (10 ns for the frozen protein). These simulation times are sufficient to sample picosecond timescale hydration water dynamics and, at the same time, short enough to minimize protein side-chain fluctuations and other conformational changes. Slow protein conformational dynamics – on multi-nanosecond timescales and beyond – are not expected to dynamically couple to intermolecular vibrations and picosecond processes in hydration water due to the separation of timescales. Dynamical coupling, such as correlated vibrational motion in the protein and its hydration shell, primarily occurs on the sub-picosecond and picosecond timescale and was analyzed in previous work.13,42 The first 100 ps of all production simulations were considered additional equilibration time and were therefore excluded from the subsequent analyses. We verified the convergence by performing longer simulations (4.2 ns, with the first 200 ps omitted from analysis) for a few selected umbrella windows. For a detailed description of the methods, see ESI.†
2.2 Potentials of mean force
To obtain the potential of mean force (PMF) of ligand binding, umbrella sampling (US) simulations were performed in which the ligand motion was restricted to a one-dimensional reaction coordinate q roughly normal to the HP surface (Fig. 1B). The PMFs were computed from the umbrella sampling simulations using the weighted histogram analysis method (WHAM).43,44 The effect of protein flexibility was studied by performing three independent sets of simulations with (1) a completely frozen protein (frozen), (2) harmonic restraining potentials applied to all Cα-atoms of UBQ (restrained) and (3) position restraints only applied to 6 selected anchoring Cα-atoms of UBQ that are far away from the HP (flexible). Fig. 1A shows the restrained atoms. In case of the flexible protein, the restraining potentials eliminated overall rotation and translation of the protein but affected protein flexibility only marginally. This was verified by a comparison of the root mean square fluctuations (RMSF) of the flexible protein with those of an entirely unrestrained protein (see Fig. S1, ESI†).2.3 One-body friction profiles
The friction profiles of the ligand along the reaction coordinate were computed from the fluctuations of the random force, as described by Setny et al.32 The instantaneous random force Rq(t) was obtained by subtracting the mean force and the biasing force due to the umbrella potential from the total force on the reaction coordinate, Rq0(t) = Fq(t) + kumb(q(t) − q0) + ∂PMF(q)/∂q, where Fq is the total force on the ligand (stored every 10 fs). According to the second fluctuation–dissipation theorem,45 static one-body friction profiles ξ(q) of the ligand can be straightforwardly obtained from the time auto-correlation of the random force, CRR(t) = 〈Rq0(t0 + t)Rq0(t0)〉t0. The integration was carried out until the integrals converged to a pseudo-plateau.46
2.4 Solvent fluctuations
Solvent fluctuations near the hydrophobic patch of UBQ were analyzed in terms of the instantaneous number of water molecules, Nwat(t), that are within a distance of 4.5 Å from the residues Ile-44 or Val-70 (Fig. 1A). The density fluctuations in the vicinity of the HP surface were calculated as a function of the ligand position on the reaction coordinate (Fig. 1B). Semi-logarithmic representations of the probability distributions Pv(Nwat) provide useful visual comparisons of the water density fluctuations between distinct simulations. For bulk water and near hydrophilic surfaces, Pv(Nwat) is typically Gaussian-shaped. However, near hydrophobic surfaces it can either become non-Gaussian, i.e., having an increased probability for low values of Nwat, or the entire distribution can be shifted towards lower occupation numbers, and both cases are markers for desolvation.35,36 Furthermore, average occupancy fluctuations were analyzed via the reduced local compressibility χr = 〈δN2〉/〈N〉, where δN(t) = N(t) − 〈N〉.47,48 This reduced compressibility quantifies the magnitude of solvent fluctuations of confined water molecules. The timescale of solvent fluctuations was estimated using the time auto-correlation function of δN(t), CδNδN(t) = 〈δN(τ)·δN(τ + t)〉τ/〈δN2〉. The correlation times τδN were estimated from double-exponential fits A![[thin space (1/6-em)]](https://www.rsc.org/images/entities/i_char_2009.gif) exp[−t/τA] + B
exp[−t/τA] + B![[thin space (1/6-em)]](https://www.rsc.org/images/entities/char_2009.gif) exp[−t/τB] to account for multiple timescales. For validation purposes, τδN was also estimated directly as CδNδN(τδN) = 1/e, i.e., without fitting to an (assumed) exponential form. Reference data for bulk water were obtained from separate simulations of a pure water box by selecting water molecules in a similar volume V.
exp[−t/τB] to account for multiple timescales. For validation purposes, τδN was also estimated directly as CδNδN(τδN) = 1/e, i.e., without fitting to an (assumed) exponential form. Reference data for bulk water were obtained from separate simulations of a pure water box by selecting water molecules in a similar volume V.
3 Results and discussion
3.1 Protein dynamics modulate the binding free energy landscape
Fig. 2 shows the PMF for the flexible (green), restrained (red) and frozen (blue) proteins (convergence tests are shown in Fig. S2, ESI†). In all cases, there is a pronounced free energy minimum very close to the protein surface. For the restrained protein, the minimum is located around q ≈ 0.5 Å with a depth of −6.5 kJ mol−1. In case of the flexible protein, the minimum is located at q ≈ 1.0 Å and has a depth of −8.0 kJ mol−1. Interestingly, the barrier at around 4 Å is roughly twice as high for the restrained protein compared to the flexible case, indicating that protein flexibility facilitates the binding of the ligand. Finally, for the frozen protein the energy barrier is even higher than for the restrained protein, and the energy minimum has a smaller depth of around −3.0 kJ mol−1. This less pronounced minimum indicates that the frozen protein is unable to respond to the presence of the ligand in order to optimize its interactions, which is allowed in simulations with a flexible protein and to a lesser degree for the restrained protein.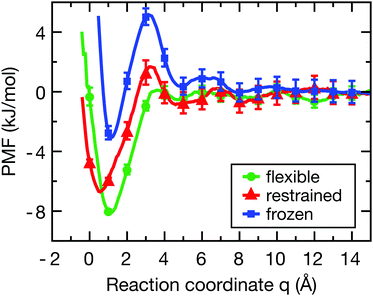 | ||
| Fig. 2 Potentials of mean force of ligand-binding to the HP for the flexible (green), restrained (red) and frozen (blue) proteins along the reaction coordinate q, which can be directly interpreted as the width of the solvation region separating the ligand and the protein surface. Error bars were estimated from a bootstrap analysis.49 The histograms of ligand positions (Fig. S3, ESI†) show sufficient overlap between the distributions to properly sample the reaction coordinate. | ||
Although the frozen protein is an artificial, or even unphysical system (zero kinetic energy, violation of Newton's third law), it was included here as an extreme case in order to study the influence of protein dynamics. Furthermore, a fully rigid system was also used by Setny et al. in their studies of an idealized hydrophobic model cavity,32,50 and thus the frozen protein simulations facilitate the comparison of our results with the literature. As also shown below, the results for the frozen protein are qualitatively similar to those for the restrained protein, but the observed effects are somewhat more pronounced. Taken together, the differences in the binding free energy profiles between the flexible, restrained, and frozen proteins are expected to affect both the dynamics of the ligand and the layers of hydration water around the HP, which shall be investigated next.
3.2 Protein flexibility reduces friction barriers
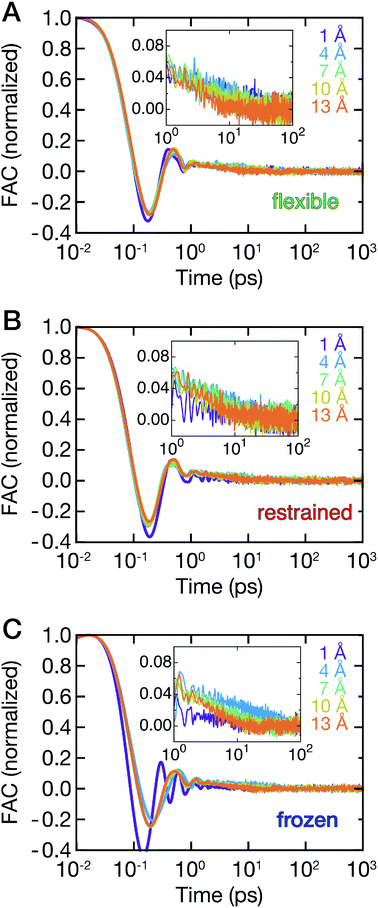
The ligand dynamics can be described based on PMFs shown in Fig. 2 combined with information on the friction experienced by the ligand as it approaches the protein along the reaction coordinate. The latter was probed via fluctuations of the time-dependent random force Rq0(t) for each reference position q0. Specifically, the time auto-correlation functions of the random force (FAC) were computed to assess the degree of non-Markovian motion, which are shown in Fig. 3 for selected ligand positions q.For large separations (q ≥ 10 Å, i.e., ligand in bulk-like water), the FACs oscillate on the sub-ps timescale and decay exponentially within 10 ps. Interestingly, the FACs exhibit additional long-time decays for short protein–ligand distances (q < 10 Å), similar to the observations made by Setny et al.32 for an idealized and rigid hydrophobic model cavity. The change of timescales is most obvious for the frozen protein at short distances, likely due to strongly retarded water dynamics in the first hydration shell around the frozen protein. The long-time decay can be traced back to the distributions of the random force presented in Fig. S4–S6 (ESI†). Especially for short separation distances, the distributions are non-Gaussian, displaying the non-Markovianity of the ligand's motion.
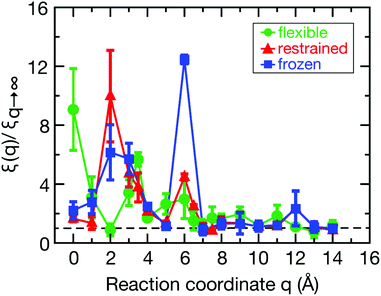
The spatial dependence of ligand dynamics with respect to protein flexibility was assessed through the friction profiles of the ligand along the reaction coordinate. To this end, static one-body friction profiles ξ(q) were computed from the FACs as described above. The friction profiles ξ(q) were obtained for the flexible, restrained and frozen proteins, respectively, and are shown in Fig. 4. All data were normalized by the value at q = 14 Å for the restrained protein (ξq→∞), which is nearly identical for the three systems. Fig. 4 reveals that for a more rigid protein, i.e., restrained and frozen, the ligand experiences substantially enhanced friction upon approaching the protein surface at short distances before reaching the bound state (see minimum of the corresponding PMF in Fig. 2). The friction is increased by a factor of around 8–13 compared to large distances, with two distinct maxima at around 2–4 Å and 6 Å distance to the HP. Notably, the separations between the maxima correspond to the size of a single hydration layer, supporting the notion that the friction enhancement is related to the step-wise removal of hydration layers from the binding site. This assumption is supported by an analysis of the average number of water molecules near the HP surface. 〈Nwat〉 was determined within 4.5 Å, 6.0 Å, and 7.0 Å of the HP surface (Fig. S7, ESI†). When taking more than one hydration shell into account (i.e., 6–7 Å), the data show that there is a variation of the water count in line with variations of the friction along the reaction coordinate. Increased friction is also observed for the flexible protein, but the enhancement is less pronounced than for the restrained and frozen proteins. We do not go beyond this qualitative comparison, because the correlation functions (Fig. 3) are oscillatory and somewhat noisy, which is also reflected in the FAC integral (Fig. S8, ESI†). However, the distinction between the flexible protein (small friction enhancement) and the restrained/frozen proteins (large friction enhancement) is significant. The convergence of the friction profiles was verified by repeating the analysis for longer, 4 ns trajectories for selected positions, yielding values that differed by no more than 8% from those of the shorter, 2 ns trajectories. This low variation is understandable, because the force fluctuations occur on the ps timescale. Overall, protein flexibility is found to reduce the solvent-mediated friction acting on the ligand during binding, which may be a general mechanism to facilitate binding in large and flexible biomolecular systems.
3.3 The dynamic hydration shell shapes ligand binding dynamics
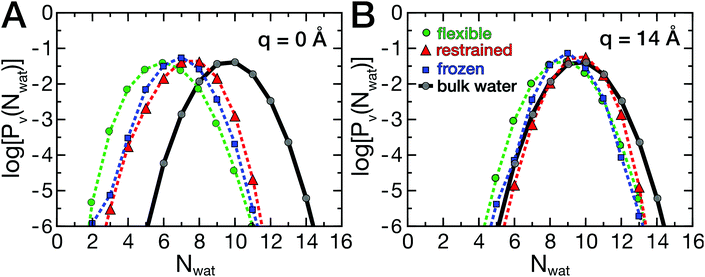
As described above, the ligand binding involves removal of water molecules from the HP, which may be underlying the friction barriers. Therefore, the dynamics of the hydration water around the HP was investigated. As described by Patel and co-workers,35,36 the probability distribution Pv(Nwat) provides information on the sensitivity of water molecules to external perturbations, such as the presence of a ligand or a protein. In fact, bulk water at ambient conditions is close to a liquid–vapor phase transition, which leads to the well known capillary evaporation near hydrophobic, concave binding pockets.18,51 Here, deviations from the bulk water distribution, which are expected in the hydration shell of a protein, were analyzed as a function of ligand position and compared between flexible and rigid proteins. The probability distributions Pv(Nwat) are shown in Fig. 5A and B.The data are shown in a semi-logarithmic representation, therefore a parabolic shape for bulk water is found (Fig. 5, gray curves), as reported earlier.35,36 In Fig. 5, log[Pv(Nwat)] is shown for two ligand positions, q = 0 Å (A) and q = 14 Å (B). At large protein–ligand distances, the distributions deviate only moderately from those of bulk water, with a slightly smaller mean water number 〈Nwat〉 than in bulk due to the presence of the protein. At short distances, the ligand induces the partial desolvation of the HP, which is most pronounced for the flexible protein (green curve). The protein's hydrophobic surface shifts the distributions to smaller values and changes the width asymmetrically, favoring lower water occupancies.
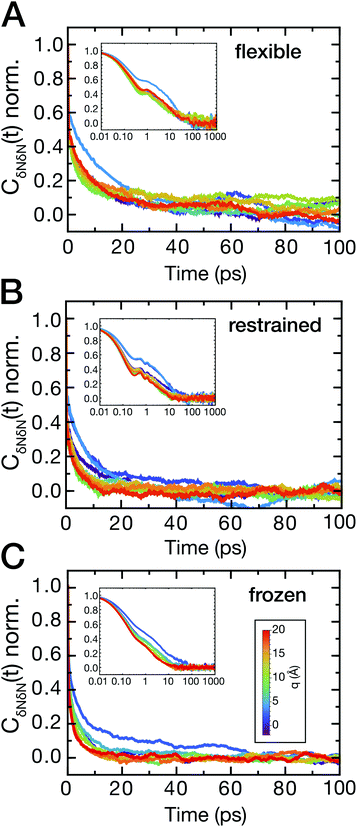
The sensitivity to perturbations, as displayed by the altered shape of log[Pv(Nwat)] compared to bulk water, is seen in both the magnitude and the timescale of solvent fluctuations. To analyze the timescales, the time auto-correlation functions CδNδN(t) were computed (Fig. 6A–C). Generally, the correlation functions have a long-time decay on a timescale of several tens of picoseconds for short protein–ligand distances. In addition, fast oscillations on the sub-picosecond timescale can be observed for all protein–ligand separation distances for simulations of the flexible and restrained protein, which are absent in simulations of the frozen protein. These oscillations indicate a coupling of low-frequency protein vibrations to water dynamics and resulting density fluctuations near the hydrophobic binding site.
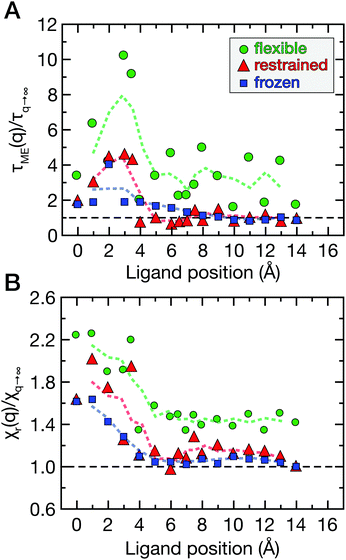
Fig. 7A shows the correlation times τδN obtained from the correlation functions in Fig. 6 as a function of q. Overall, the double-exponential fits yielded one ps-decay and one very fast decay on the fs timescale; the former are in good agreement with the correlation times directly obtained from CδNδN(τδN) = 1/e. Therefore, we focus on the picosecond dynamics, which is also in accordance with data for purely hydrophobic cavities.32 The correlation time of solvent occupancy fluctuations in bulk water is τδN ≃ 0.4 ps (analyzed in a similar volume element V as was used for the hydration water around the HP, see above). To reveal ligand effects on the solvent dynamics, all data in Fig. 7A are normalized with respect to the “ligand-in-bulk” value, i.e., normalized by the value at q = 14 Å for the restrained protein (τq→∞ ≃ 0.9 ps). The value for the frozen protein is also τq→∞ ≃ 0.9 ps, and for the flexible protein it is τq→∞ ≃ 1.7 ps.
For ligand positions of 2–4 Å distance to the restrained protein (Fig. 7A, red data points), where the ligand expels the final layers of hydration water from the HP upon binding, the solvent fluctuations are slowed down by a factor of up to 5 compared to large distances. This retardation coincides with the position of the free energy barrier (Fig. 2), indicating the onset of partial desolvation. For the frozen protein (Fig. 7A, blue data points), the ligand does not seem to affect the fluctuation timescale as much, even for short distances. On the contrary, for the flexible protein (Fig. 7A, green data points) the correlation times are slower than for the restrained and frozen proteins, and the slow-down of water fluctuations near the HP surface at short protein–ligand distances (q < 6 Å) is up to around 10-fold compared to the reference value obtained for large protein–ligand distances in the restrained system. Again, the removal of water molecules upon protein–ligand binding coincides with the free energy barrier (Fig. 2).
Finally, the magnitude of the solvent fluctuations was determined via the reduced local compressibility χr(q) of the water molecules in the volume element V close to the HP (Fig. 1B). The reference compressibility of bulk water is χr = 0.25. The reduced local compressibility χr(q) depends both on the size and shape of the volume element V used for the analysis, even for bulk systems. Only in the thermodynamic limit, χr(q) equals the local compressibility χ(q) = ρ(q)−1(∂ρ(q)/∂P)T,V.47 Again, the data were normalized by the ligand-in-bulk value, i.e., at large separation distances. The compressibilities obtained for the restrained and frozen proteins are almost identical (χq→∞ = 0.18), and for the flexible protein it is χq→∞ = 0.25. The reduced local compressibility χr(q) of water molecules near the HP as a function of ligand position is shown in Fig. 7B.
For the restrained and frozen proteins (Fig. 7B, red and blue data points, respectively), the χr(q) profiles are similar. Notably, for the flexible protein (green data points), the solvent fluctuations are overall more strongly enhanced even for large separation distances between the ligand and the HP surface. At short protein–ligand distances (q<5 Å), χr(q) is about twofold larger than for large q. When the ligand approaches the HP, the partial desolvation increases the magnitude of solvent fluctuations, in line with the observed changes of the probability distributions Pv(Nwat) (see Fig. 5).
4 Conclusions
In this study, we analyzed the influence of protein flexibility on the dynamics of ligand binding to a hydrophobic surface patch of ubiquitin. Our results indicate that increased protein flexibility not only enhances the ligand binding affinity, but also lowers free energy barriers associated with the dewetting of the binding interface. The reduced free energy barriers upon binding to the flexible protein are rationalized by the simultaneous observation of enhanced water density fluctuations in the vicinity of the binding site in the presence of the ligand, which feature longer relaxation times but result in an increased local compressibility that facilitates dewetting. Friction profiles computed along the binding coordinate from random force correlations further indicate reduced friction and thus faster binding dynamics in simulations of a fully flexible protein compared to simulations with a restrained or fully frozen protein.Previous research has focused on idealized hydrophobic model surfaces17,32,35,50 and on small proteins.36,52 In biological protein–ligand systems, the complete dewetting observed for hydrophobic model cavities18,24,51 usually reduces to a partial desolvation of a binding site, which is also observed here.
Our study provides atomic-level insights into the dynamic coupling between a protein, its hydration shell and nearby ligands and how this coupling can facilitate binding processes. These observations are particularly interesting in the context of correlated protein–water vibrations, which we found in previous work to persist up to distances of 10–25 Å from the protein.13,42,53 The explicit consideration of vibrational modes in the receptor at frequencies compatible to intermolecular vibrations in the water hydrogen bond network may complement previous observations from simulations with rigid binding site models.32 The results of the present study could thus open the way for future work aiming to quantify the effects of receptor flexibility on ligand binding for more realistic ligand-receptor pairs. Further it will be of interest to deduce the detailed mechanisms behind these effects and the mechanistic roles of correlated and/or collective dynamics and vibrations.
Conflicts of interest
There are no conflicts to declare.Acknowledgements
Funded by the Deutsche Forschungsgemeinschaft (DFG, German Research Foundation) under Germany's Excellence Strategy – EXC 2033 – 390677874 – RESOLV.Notes and references
- D. Chandler, Nature, 2005, 437, 640–647 CrossRef CAS PubMed.
- G. Hummer, Nat. Chem., 2010, 2, 906–907 CrossRef CAS PubMed.
- S. K. Pal, J. Peon, B. Bagchi and A. H. Zewail, J. Phys. Chem. B, 2002, 106, 12376–12395 CrossRef CAS.
- B. Bagchi, Chem. Rev., 2005, 105, 3197–3219 CrossRef CAS PubMed.
- M. Chaplin, Nat. Rev. Mol. Cell Biol., 2006, 7, 861–866 CrossRef CAS PubMed.
- J. C. Rasaiah, S. Garde and G. Hummer, Annu. Rev. Phys. Chem., 2008, 59, 713–740 CrossRef CAS PubMed.
- J. Qvist, E. Persson, C. Mattea and B. Halle, Faraday Discuss., 2009, 141, 131–144 RSC.
- J. T. King and K. J. Kubarych, J. Am. Chem. Soc., 2012, 134, 18705–18712 CrossRef CAS PubMed.
- M.-C. Bellissent-Funel, A. Hassanali, M. Havenith, R. Henchman, P. Pohl, F. Sterpone, D. van der Spoel, Y. Xu and A. E. Garcia, Chem. Rev., 2016, 116, 7673–7697 CrossRef CAS PubMed.
- O. Fisette, C. Päslack, R. Barnes, J. M. Isas, R. Langen, M. Heyden, S. Han and L. V. Schäfer, J. Am. Chem. Soc., 2016, 138, 11526–11535 CrossRef CAS PubMed.
- D. Laage, T. Elsaesser and J. T. Hynes, Chem. Rev., 2017, 117, 10694–10725 CrossRef CAS PubMed.
- V. Pattni, T. Vasilevskaya, W. Thiel and M. Heyden, J. Phys. Chem. B, 2017, 121, 7431–7442 CrossRef CAS PubMed.
- C. Päslack, L. V. Schäfer and M. Heyden, Phys. Chem. Chem. Phys., 2019, 21, 15958–15965 RSC.
- C. Päslack, J. C. Smith, M. Heyden and L. V. Schäfer, Phys. Chem. Chem. Phys., 2019, 21, 10370–10376 RSC.
- S. Mukherjee, S. Mondal and B. Bagchi, Phys. Rev. Lett., 2019, 122, 058101 CrossRef CAS PubMed.
- Y. Levy and J. N. Onuchic, Annu. Rev. Biophys. Biomol. Struct., 2006, 35, 389–415 CrossRef CAS PubMed.
- S. N. Jamadagni, R. Godawat and S. Garde, Annu. Rev. Chem. Biomol. Eng., 2011, 2, 147–171 CrossRef CAS PubMed.
- R. Baron, P. Setny and F. Paesani, J. Phys. Chem. B, 2012, 116, 13774–13780 CrossRef CAS PubMed.
- R. Baron and J. A. McCammon, Annu. Rev. Phys. Chem., 2013, 64, 151–175 CrossRef CAS PubMed.
- M. S. Bodnarchuk, R. Viner, J. Michel and J. W. Essex, J. Chem. Inf. Model., 2014, 54, 1623–1633 CrossRef CAS PubMed.
- G. Gerogiokas, M. Southey, M. Mazanetz, A. Hefeitz, M. Bodkin, R. Law and J. Michel, Phys. Chem. Chem. Phys., 2015, 17, 8416–8426 RSC.
- S. M. Gopal, F. Klumpers, C. Herrmann and L. V. Schäfer, Phys. Chem. Chem. Phys., 2017, 19, 10753–10766 RSC.
- B. J. Berne, J. D. Weeks and R. Zhou, Annu. Rev. Phys. Chem., 2009, 60, 85–103 CrossRef CAS PubMed.
- P. Setny, R. Baron and J. A. McCammon, J. Chem. Theory Comput., 2010, 6, 2866–2871 CrossRef CAS PubMed.
- L. Zdek, M. V. Novotny and M. J. Stone, Nat. Struct. Biol., 1999, 6, 1118–1121 CrossRef PubMed.
- A. Bhowmick and T. Head-Gordon, Structure, 2015, 23, 44–55 CrossRef CAS PubMed.
- J. A. Caro, K. W. Harpole, V. Kasinath, J. Lim, J. Granja, K. G. Valentine, K. A. Sharp and A. J. Wand, Proc. Natl. Acad. Sci. U. S. A., 2017, 114, 6563–6568 CrossRef CAS PubMed.
- M. L. Verteramo, O. Stenström, M. M. Ignjatović, O. Caldararu, M. A. Olsson, F. Manzoni, H. Leffler, E. Oksanen, D. T. Logan and U. J. Nilsson, et al. , J. Am. Chem. Soc., 2019, 141, 2012–2026 CrossRef CAS PubMed.
- P. W. Fenimore, H. Frauenfelder, B. H. McMahon and F. G. Parak, Proc. Natl. Acad. Sci. U. S. A., 2002, 99, 16047–16051 CrossRef CAS PubMed.
- L. Zhao, W. Li and P. Tian, PLoS One, 2013, 8, e60553 CrossRef CAS PubMed.
- M.-C. Bellissent-Funel, A. Hassanali, M. Havenith, R. Henchman, P. Pohl, F. Sterpone, D. Van Der Spoel, Y. Xu and A. E. Garcia, Chem. Rev., 2016, 116, 7673–7697 CrossRef CAS PubMed.
- P. Setny, R. Baron, P. M. Kekenes-Huskey, J. A. McCammon and J. Dzubiella, Proc. Natl. Acad. Sci. U. S. A., 2013, 110, 1197–1202 CrossRef CAS PubMed.
- J. Qvist, M. Davidovic, D. Hamelberg and B. Halle, Proc. Natl. Acad. Sci. U. S. A., 2008, 105, 6296–6301 CrossRef CAS PubMed.
- P. W. Fenimore, H. Frauenfelder, B. H. McMahon and R. D. Young, Proc. Natl. Acad. Sci. U. S. A., 2004, 101, 14408–14413 CrossRef CAS PubMed.
- A. J. Patel, P. Varilly, S. N. Jamadagni, M. F. Hagan, D. Chandler and S. Garde, J. Phys. Chem. B, 2012, 116, 2498–2503 CrossRef CAS PubMed.
- N. B. Rego, E. Xi and A. J. Patel, J. Am. Chem. Soc., 2019, 141, 2080–2086 CrossRef CAS PubMed.
- C. T. Archer and T. Kodadek, Nucleic Acids Res., 2009, 38, 789–796 CrossRef PubMed.
- S. Pronk, S. Páll, R. Schulz, P. Larsson, P. Bjelkmar, R. Apostolov, M. R. Shirts, J. C. Smith, P. M. Kasson, D. van der Spoel, B. Hess and E. Lindahl, Bioinformatics, 2013, 29, 845–854 CrossRef CAS PubMed.
- B. R. Brooks, C. L. Brooks, A. D. Mackerell, L. Nilsson, R. J. Petrella, B. Roux, Y. Won, G. Archontis, C. Bartels, S. Boresch, A. Caflisch, L. Caves, Q. Cui, A. R. Dinner, M. Feig, S. Fischer, J. Gao, M. Hodoscek, W. Im, K. Kuczera, T. Lazaridis, J. Ma, V. Ovchinnikov, E. Paci, R. W. Pastor, C. B. Post, J. Z. Pu, M. Schaefer, B. Tidor, R. M. Venable, H. L. Woodcock, X. Wu, W. Yang, D. M. York and M. Karplus, J. Comput. Chem., 2009, 30, 1545–1614 CrossRef CAS PubMed.
- J. L. F. Abascal and C. Vega, J. Chem. Phys., 2005, 123, 234505 CrossRef CAS PubMed.
- G. M. Torrie and J. P. Valleau, J. Comput. Phys., 1977, 23, 187–199 CrossRef.
- M. Heyden and D. J. Tobias, Phys. Rev. Lett., 2013, 111, 218101 CrossRef PubMed.
- S. Kumar, J. M. Rosenberg, D. Bouzida, R. H. Swendsen and P. A. Kollman, J. Comput. Chem., 1992, 13, 1011–1021 CrossRef CAS.
- J. S. Hub, B. L. de Groot and D. van der Spoel, J. Chem. Theory Comput., 2010, 6, 3713–3720 CrossRef CAS.
- R. Kubo, Rep. Prog. Phys., 1966, 29, 255 CrossRef CAS.
- R. Vogelsang and C. Hoheisel, J. Stat. Phys., 1987, 47, 193–207 CrossRef.
- H. Acharya, S. Vembanur, S. N. Jamadagni and S. Garde, Faraday Discuss., 2010, 146, 353–365 RSC.
- R. Evans and M. C. Stewart, J. Phys.: Condens. Matter, 2015, 27, 194111 CrossRef CAS PubMed.
- B. Efron, Ann. Stat., 1979, 7, 1–26 Search PubMed.
- P. Setny, Z. Wang, L.-T. Cheng, B. Li, J. A. McCammon and J. Dzubiella, Phys. Rev. Lett., 2009, 103, 187801 CrossRef CAS PubMed.
- R. Baron, P. Setny and J. A. McCammon, J. Am. Chem. Soc., 2010, 132, 12091–12097 CrossRef CAS PubMed.
- S. Sarupria and S. Garde, Phys. Rev. Lett., 2009, 103, 037803 CrossRef PubMed.
- M. Heyden, J. Chem. Phys., 2014, 141, 22D509 CrossRef PubMed.
Footnote |
| † Electronic supplementary information (ESI) available: MD simulation protocol, protein RMSF, details on the analysis procedures, PMF convergence tests, and extended water occupancy analyses. See DOI: 10.1039/d1cp00181g |
| This journal is © the Owner Societies 2021 |

