
 Open Access Article
 This Open Access Article is licensed under a
 Creative Commons Attribution 3.0 Unported Licence
Stoichiometry of lanthanide(III) complexes with tripodal aminophosphonic ligands – a new solution to an old problem†
Rafał
Janicki
*a,
Joanna
Gałęzowska
*b and
Anna
Mondry
a
aFaculty of Chemistry, University of Wrocław, F. Joliot-Curie 14, 50-383 Wrocław, Poland. E-mail: rafal.janicki@chem.uni.wroc.pl
bDepartment of Inorganic Chemistry, Wrocław Medical University, Borowska 211A, 50-556 Wrocław, Poland. E-mail: joanna.galezowska@umed.wroc.pl
First published on 15th May 2017
Abstract
The Eu3+ and Gd3+ complexes with an N-(methylene-2-pyridine)-N,N-di(methylenephosphonate) ligand (H4NP2py), an analogue of nitrilotri(methylphosphonic) acid (H6NTP), were synthesized and structurally characterized by X-ray single crystal diffraction. The determined crystal structures ([C(NH2)3]5[Ln(NP2py)2]·12H2O) are the first example of a monomeric Ln3+ complex encapsulated by two tripodal aminophosphonic ligands. Each of the NP2py anions coordinates to Ln3+ through two oxygen atoms from each monodentate phosphonic group, amine nitrogen and pyridine nitrogen atoms, filling thus 8 coordination sites of Ln3+. The luminescence properties of [C(NH2)3]5[Eu(NP2py)2]·12H2O crystals were studied and compared with those of Eu–NP2py complexes in solution. Speciation analysis of Ln–NP2py complexes (Ln![[thin space (1/6-em)]](https://www.rsc.org/images/entities/char_2009.gif) :NP2py = 1:2), performed by luminescence and potentiometric methods, showed that both [Ln(NP2py)]− and [Ln(NP2py)2]5− species may exist in solution. However, the formation of the latter one occurs in alkaline solutions at pH as high as 8. By implementing the Specific Ion Interaction Theory (SIT) it was possible to calculate the thermodynamic stability constants of the [Eu(NP2py)]− and [Eu(NP2py)2]5− complexes. The corresponding logβ0Eul and
:NP2py = 1:2), performed by luminescence and potentiometric methods, showed that both [Ln(NP2py)]− and [Ln(NP2py)2]5− species may exist in solution. However, the formation of the latter one occurs in alkaline solutions at pH as high as 8. By implementing the Specific Ion Interaction Theory (SIT) it was possible to calculate the thermodynamic stability constants of the [Eu(NP2py)]− and [Eu(NP2py)2]5− complexes. The corresponding logβ0Eul and  values are 16.3 ± 0.11 and 19.5 ± 0.15, respectively.
Introduction
The chemistry of metal-phosphonates has attracted increasing attention over the last few decades due to the variety of properties that can be introduced via a phosphonic moiety.1 (Poly)aminopolyphosphonates are very strong complexing agents for alkaline earth, transition and rare earth metal ions.2 Owing to the high basicity of the oxygen atoms,3,4 phosphonates interact with cations more strongly than their carboxylic analogues and are able to create more stable complexes.5,6 Phosphonate complexes with luminescent, paramagnetic lanthanide ions7,8 play a significant role as promising phosphors for new technologies and potential contrast agents in magnetic resonance imaging (MRI)9 as well as paramagnetic shift reagents for biologically important cations (e.g. Na+).10 Owing to its good pharmacokinetics, biodistribution and bone-seeking properties the 153Sm-EDTP complex,1a,6e–h known as QUADRAMET®, was approved by the US FDA for use of painful skeletal metastases in humans.1d,11In general, polyaminopolyphosphonic acids are the analogues of the nitrilotris(methylenephosphonic) acid (hereinafter referred to as NTP). To date the NTP ligand has found many applications12 driven in many cases by coordination properties of this ligand in Ln3+ complexes.13 Because the majority of its applications are related to the NTP properties in aqueous solution, it seems particularly important to study its properties in this medium. However, the formation of the Ln3+ complexes with ligands of the NTP type in solution remains still not fully understood. For example it is unclear whether bis(nitrilotris(methylenephosphonato))lanthanide complexes are formed in solution at all.14–16 Moreover no crystal structures of monomeric Ln3+ complexes with tripodal aminophosphonic ligands have been reported so far. The high negative charge of the NTP ligand (−6) and the presence of rather bulky phosphonic groups are probably the main factors destabilizing the [Ln(NTP)2]9− complexes in solution.
The aim of this paper is to study the chemical properties of a modified NTP ligand – N-(methylene-2-pyridine)-N,N-di(methylenephosphonic) acid (hereinafter referred to as NP2py – Scheme 1) to establish finally whether, [Ln(NP2py)2]5− complexes may be indeed formed in solution.17
 | ||
| Scheme 1 Chemical structure of N-(methylene-2-pyridine)-N,N-di(methylenephosphonis acid) – H4NP2py. | ||
We have focused our attention on the stoichiometry and stability of species in the solution of the Ln–NP2py system by implementing various physical methods such as X-ray crystallography, luminescence spectroscopy, potentiometry as well as a theoretical approach based on Specific Ion Interaction Theory (SIT).18 Because coordination of aminopolyphosphonates to Ln3+ cations has not been completely clear, we believe that the presented data may be helpful in understanding the interaction of this important class of ligands with lanthanide ions in solution, in general.
Results and discussion
Crystal structures
The crystal structures of compounds of the following formula [C(NH2)3]5[Ln(NP2py)2]·12H2O (Ln = Eu or Gd) were determined. The crystals of both compounds are isostructural and belong to the P![[1 with combining macron]](https://www.rsc.org/images/entities/char_0031_0304.gif) space group. The asymmetric unit comprises one [Ln(NP2py)2]5− complex anion, five guanidinium cations out of which one is disordered and twelve water molecules out of which two are disordered. The monomeric [Ln(NP2py)2]5− complex anions are completely deprotonated and their negative charge is compensated by [C(NH2)3]+ cations.
space group. The asymmetric unit comprises one [Ln(NP2py)2]5− complex anion, five guanidinium cations out of which one is disordered and twelve water molecules out of which two are disordered. The monomeric [Ln(NP2py)2]5− complex anions are completely deprotonated and their negative charge is compensated by [C(NH2)3]+ cations.
Two anionic [NP2py]4− ligands are bound to the Ln3+ cation. Each of them is linked with the Ln3+ by two oxygen atoms from both monodentate phosphonic groups, one tertiary nitrogen atom and one pyridine nitrogen atom, filling thus four coordination sites of the Ln3+ cation. The molecular structure of the [Eu(NP2py)2]5− complex is presented in Fig. 1. The selected Ln–L bond lengths are presented in Table 1.
 | ||
| Fig. 1 Molecular structure of the [Eu(NP2py)2]5− complex; the H atoms are omitted for clarity. | ||
| Bond lengths | Eu | Gd |
|---|---|---|
| Ln–O21 | 2.315(2) | 2.308(5) |
| Ln–O13 | 2.337(2) | 2.328(5) |
| Ln–O15 | 2.319(2) | 2.316(5) |
| Ln–O24 | 2.353(2) | 2.347(5) |
| Ln–O (aver.) | 2.331(18) | 2.325(17) |
| Ln–N12(am) | 2.770(3) | 2.764(7) |
| Ln–N21(am) | 2.751(3) | 2.744(7) |
| Ln–N (am aver.) | 2.761(13) | 2.754(14) |
| Ln–N11(py) | 2.596(3) | 2.592(7) |
| Ln–N22(py) | 2.657(3) | 2.634(6) |
| Ln–N (py aver.) | 2.626(43) | 2.613(29) |
As is seen the Eu–L and Gd–L bond lengths are similar within the error of bond length estimation. The Ln–L bond lengths increase in the order Ln–O < Ln–N(py) < Ln–N(am) which reflects the sequence of ligand donor properties.19
The coordination polyhedron of the Ln3+ cation may be described as a distorted prism (Fig. 2). The Ln3+ cation lies in the general position, but the approximate symmetry of the complex anion is Ci, as shown in Fig. 2.
 | ||
| Fig. 2 The coordination polyhedra of Eu3+ in the [Eu(NP2py)2]5− complex anion. | ||
The [Ln(NP2py)2]5− complexes are held together by a network of hydrogen bonds and electrostatic interactions. Owing to the high negative charge of the anionic [Ln(NP2py)2]5− complex the distance between the neighbouring anions is large and the anionic complexes are well separated from each other; the shortest Eu⋯··Eu’ and Gd⋯··Gd’ distances are 10.47(7) Å and 10.37(7), respectively.
Luminescence spectra of the [C(NH2)3]5[Eu(NP2py)2]·12H2O crystal
Out of Ln3+ the Eu3+ f–f transitions are characterized by a simple and informative spectral pattern that is why we have chosen this cation for detailed spectroscopic studies.The luminescence spectra of the [C(NH2)3]5[Eu(NP2py)2]·12H2O crystal were observed when the Eu3+ was excited into f–f transitions as well as into ligand states. The luminescence excitation spectrum of the crystals under study is presented in Fig. 3.
 | ||
| Fig. 3 Luminescence excitation spectrum (λem = 592.35 nm) of the [C(NH2)3]5[Eu(NP2py)2]·12H2O crystals. | ||
Narrow peaks attributed to the f–f transitions of the Eu3+ and broad band of the ligand (1π → 1π*, 1n → 1π*) are observed in the spectrum. The presence of the latter band indicates that the energy transfer from the ligand to the Eu3+ states occurs. The luminescence spectrum of the [C(NH2)3]5[Gd(NP2py)2]·12H2O complex indicates that the position of the triplet state of the ligand is centered at ∼437 nm, Fig. 1S.†20 The luminescence spectrum of the [C(NH2)3]5[Eu(NP2py)2]·12H2O crystal excited into the ligand band is shown in Fig. 4. The emission intensities of the 5D0 → 7FJ transitions in relation to the 5D0 → 7F1 one are also included in this figure.
 | ||
| Fig. 4 Luminescence spectrum of the crystal under study (λex = 276 nm). | ||
Five bands attributed to the electronic transitions from the excited 5D0 to the lower lying 7F0,1,2,3,4 states are observed in the spectrum. All these transitions are induced electric dipole (ED) transitions, except for the 5D0 → 7F1, which is of magnetic dipole (MD) character. Thus the 5D0 → 7F1 transition may be used as a reference since its intensity does not depend on the chemical surrounding of Eu3+.21 The 5D0 → 7F0 and 5D0 → 7F3 transitions are forbidden due to the selection rules. For this reason, the intensities of these transitions are usually very low as compared with those of 5D0 → 7F1,2,4 transitions. Since the ground 7F0 and the emitting 5D0 states are nondegenerate, the 5D0 ↔ 7F0 transitions consist of a single unsplit line for the given Eu3+ surrounding. Therefore there is a one to one correspondence between the number of lines in the spectrum of this transition and the number of chemically distinct environments of the Eu3+ ion. The energy levels of the 7F1,2,3,4 multiplets and their crystal field (e) as well as vibronic (v) components found in the RT spectra are presented in Table 2.
| 2S+1LJ | E/cm−1 | 2S+1LJ | E/cm−1 | ||
|---|---|---|---|---|---|
| 7F1 | 180 | e | 7F3 | 1800 | e |
| 452 | e | 1880 | e | ||
| 512 | e | 1979 | v | ||
| Δ CFS | 332 | 2131 | e | ||
| Δ CFS | 331 | ||||
| 7F2 | 889 | e | 7F4 | 2577 | e |
| 919 | e | 2717 | v | ||
| 967 | v | 2901 | e | ||
| 1050 | v | 2935 | e | ||
| 1145 | v | 3007 | v | ||
| 1259 | v | 3064 | e | ||
| 1287 | v | 3144 | e | ||
| 1440 | e | 3256 | e | ||
| 1585 | v | 3269 | e | ||
| Δ CFS | 550 | Δ CFS | 692 | ||
Because 5D0 → 7F0,2,3,4 transitions are strictly forbidden in centrosymmetric systems, the presence of these transitions in the luminescence spectrum indicates that the Ci symmetry of the [Eu(NP2py)2]5− complex in the crystal is approximate. The determined luminescence lifetime of the 5D0 state at RT is 1840 μs.
The next step of our studies was the analysis of the spectroscopic properties of the Eu–NP2py complex in aqueous solution.
Luminescence spectra of the Eu–NP2py and Tb–NP2py systems in solution
![[thin space (1/6-em)]](https://www.rsc.org/images/entities/b_char_2009.gif) :1.
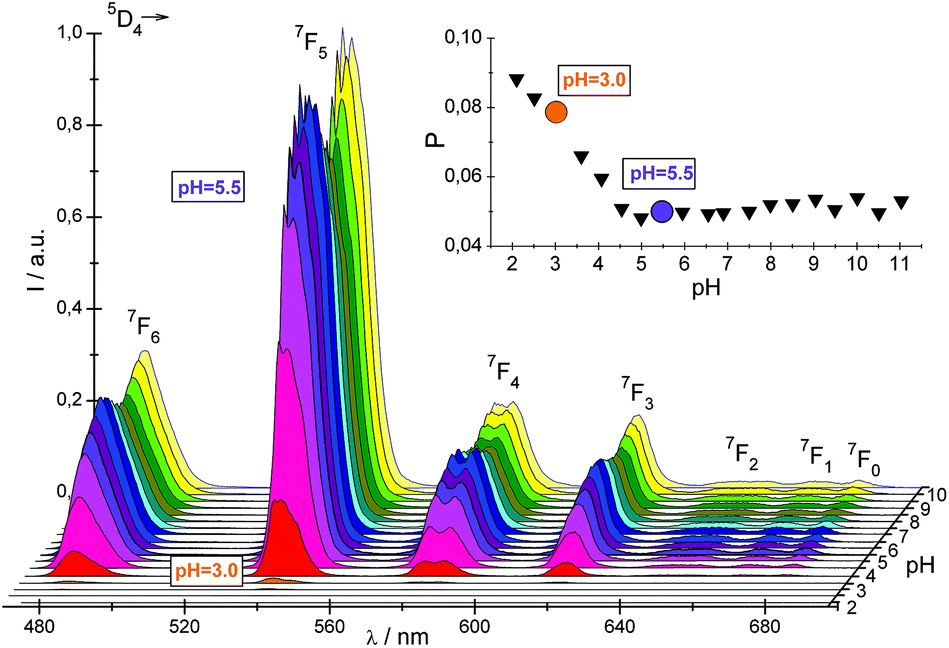
Taking into account Eu–L bond lengths it may be reasonably assumed that the encapsulation of the Ln3+ cation by the NP2py ligand is achieved by the coordination of phosphonic and pyridine groups. The binding of the N(imino) atom to the Ln3+ is forced by the former ones. In this context, it seems to be important to indicate how the coordination of phosphonate and pyridine groups depends on the pH of a solution. In order to find the binding mode of the NP2py ligand and the stoichiometry of the formed Ln–NP2py species, the luminescence spectra of Eu–NP2py and Tb–NP2py complexes in aqueous solution were recorded. The selected luminescence spectra of the Eu–NP2py complex at different pH are presented in Fig. 5.
:1.
Taking into account Eu–L bond lengths it may be reasonably assumed that the encapsulation of the Ln3+ cation by the NP2py ligand is achieved by the coordination of phosphonic and pyridine groups. The binding of the N(imino) atom to the Ln3+ is forced by the former ones. In this context, it seems to be important to indicate how the coordination of phosphonate and pyridine groups depends on the pH of a solution. In order to find the binding mode of the NP2py ligand and the stoichiometry of the formed Ln–NP2py species, the luminescence spectra of Eu–NP2py and Tb–NP2py complexes in aqueous solution were recorded. The selected luminescence spectra of the Eu–NP2py complex at different pH are presented in Fig. 5.
 | ||
| Fig. 5 Luminescence spectra of the Eu–NP2py complex (λex = 393 nm, Eu:NP2py = 1:1) in aqueous solution at different pH. | ||
At pH 2.26 the intensity of the hypersensitive 5D0 → 7F2 transition (1.08) is similar to that of the magnetic dipole 5D0 → 7F1 transition and higher than the relative intensity for the aqua ion (0.68). The increase of pH brings about an increase of the relative intensity of the 5D0 → 7F2 transition from 1.08 (pH = 2.26) to 2.74 (pH = 10.5). It means that the NP2py ligand starts to coordinate at pH ∼2.26. Under these conditions competing reactions undergo between the protonation and coordination of phosphonate groups to the Eu3+.
The protonation of the Npy atom at low pH prevents the Eu–Npy interaction and consequently may hinder the L–Eu energy transfer. Therefore the question arises whether the efficiency of an antenna effect as a function of pH may serve as a coordination probe for establishing the binding of pyridine to the Eu3+. In general the Tb3+ compounds are more convenient to study the energy transfer process in comparison with those of Eu3+ for which the ligand band may be imposed on the L–M charge transfer spectra of Eu3+.22 Accordingly, to find the pH range in which the coordination of the pyridyl group to the Ln3+ occurs, the luminescence spectra of the Tb–NP2py complex at various pH with an excitation wavelength of 266 nm were recorded (Fig. 6). The oscillator strengths of the 1π → 1π*, 1n → 1π* transition calculated from absorption spectra versus pH are also presented in the insert of this figure.
 | ||
| Fig. 6 Luminescence spectra of the Tb–NP2py 1:1 complex at different pH. The plot of the oscillator strengths of the 1π → 1π*, 1n → 1π* transition versus pH is shown in the insert. | ||
As can be seen the largest increase of the luminescence intensity of all f–f transitions is observed between pH 3 and 5.5. Simultaneously the oscillator strength of the ligand band monotonically decreases. These results indicate that the changes of the efficiency of the antenna effect may be used to study the coordination modes of chromophore groups to the Tb3+. The determined values of luminescence quantum yields ΦTb3+ of the Tb:NP2py 1:1 and 1:2 systems (Fig. 2S†) may confirm this conclusion.
It is also worth considering the changes of the energy of the ligand centered transitions, caused by coordination of the NP2py ligand to the Tb3+ (Fig. 3S†). Because the 1π → 1π*, 1n → 1π* transitions are particularly sensitive to the interaction of the N pyridine atom with the metal cation, a remarkable bathochromic shift of the ligand band (∼550 cm−1) is observed in the spectra of the Tb–NP2py complex at pH above 6 as compared with the spectra of the free ligand (see Fig. 3S). The observed changes of the f–f and ligand bands above pH ∼ 3 support the conclusion that the coordination of the pyridyl group to the Tb3+ occurs at pH between 3.0 and 5.5. The coordination of the NP2py ligand is completed above pH = 6.
:2.
The luminescence spectra of the Eu–NP2py system with the Eu:L = 1:2 in solutions at different pH are presented in Fig. 7.
 | ||
| Fig. 7 Luminescence spectra of the crystal and solutions of Eu3+:NP2py = 1:2 and 1:1. The bands attributed to the [Eu(NP2py)]− species are marked with asterisks. | ||
As can be seen in Fig. 7 the spectral pattern of f–f bands strongly depends on pH. A qualitative comparison between the spectra of the crystal and solutions of the Eu:NP2py = 1:2 complex demonstrates that at pH = 10.5 [Eu(NP2py)2]5− is a predominant species. As the pH decreases, the CF components of individual multiplets of the [Eu(NP2py)2]5− complex vanish and below pH 8 they completely disappear. It may suggest that the formation of the [Eu(NP2py)2]5− complex starts at pH ∼ 8. The presence of additional bands (marked with an asterisk in the spectra in Fig. 7) may indicate that the other species, different to that found in the crystal, also exist in solution.
Owing to the simplicity of the 5D0 → 7F0 spectrum it was used to monitor the changes in the nearest coordination sphere of the Eu3+ cation. The luminescence spectra of the 5D0 → 7F0 transition of solutions and the crystal are presented in Fig. 8.
 | ||
| Fig. 8 Luminescence spectra of the 5D0 → 7F0 transition of the Eu–NP2py complexes in the crystal and in solutions at pH = 10.5. | ||
Two well separated 5D0 → 7F0 peaks in the spectrum of the solution of the Eu:NP2py = 1:2 system at pH 10.5 are observed. The comparison of the energy of these peaks with those in the crystal and the solution of Eu:NP2py = 1:1 at pH = 10.5 enabled us to attribute the higher energy peak at 17330 cm−1 to the [Eu(NP2py)2]5− species, while the lower energy peak centered at 17286 cm−1 to the [Eu(NP2py)]− species. Both 5D0 → 7F0 peaks are separated by 56 cm−1. This difference is probably caused by the change of the number of donor atoms and/or number of water molecules coordinated to the Eu3+ (see section “Number of coordinated H2O molecules to the Eu3+ cation” in the ESI†).
| [Eu(NP2py)]− + NP2py4− ⇆ [Eu(NP2py)2]5− | (1) |
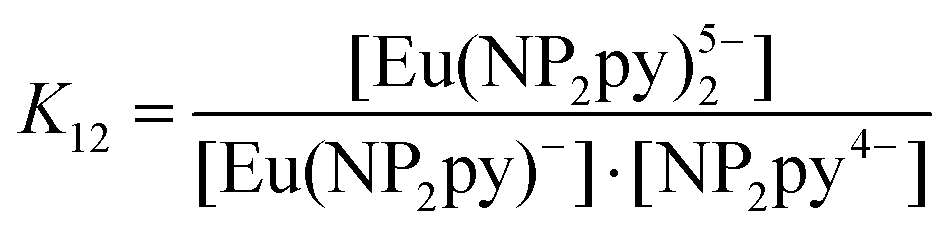 | (2) |
To determine the K12 constant we used the method based on the fitting of the spectra of the crystals to those of solutions.23 The spectrum of the crystal under study served us as a model of 1:2 species while the spectrum of Eu–NP2py 1:1 at pH = 10.5 was used as the spectrum of a pure 1:1 complex. However owing to the dynamic effects,23,24 the spectra of f–f transitions in the solution are broadened in comparison to the spectra of the crystal. For this reason the simulated spectra of the [Eu(NP2py)2]5− species derived from the spectra of the crystal were artificially broadened. The equation that was used to calculate the simulated spectrum of the [Eu(NP2py)2]5− species in solution is as follows:
 | (3) |
J calc – intensity at a given value of λ;
z – the number of peaks for the given 5D0 → 7FJ transition;
J max – the maximum intensity of the peak;
λ max – the wavelength of the peak maximum;
Δλ – the half-width of a peak;
A 12 and B12 are adjustable parameters connected with artificial broadening of bands.
The final set of parameters used to calculate the simulated spectrum of the [Eu(NP2py)2]5− species is presented in Table 1S (ESI†). The simulated and experimental spectra of compounds under study are shown in Fig. 9.
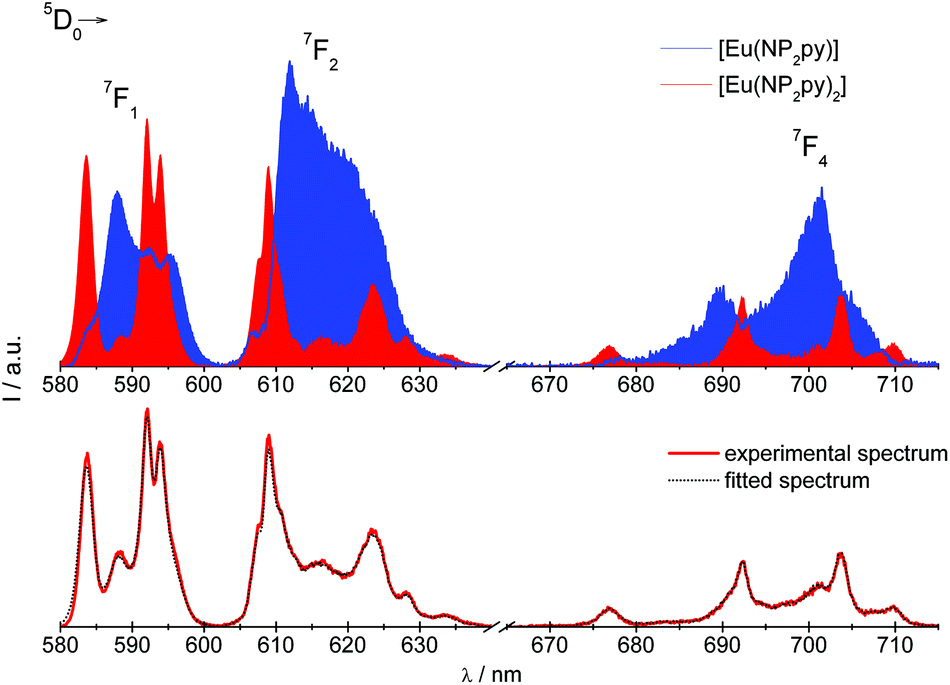 | ||
| Fig. 9 Simulated spectra of the [Eu(NP2py)2]5− (red) and [Eu(NP2py)]− (blue) species. The fitted and experimental spectra of the Eu:NP2py 1:2 system at pH 10.5. | ||
Next, the simulated spectra of the 5D0 → 7F1,2,4 transitions were used to calculate the molar fractions χ of [Eu(NP2py)]− and [Eu(NP2py)2]5− species (Table 3).
| Transition | χ [Eu(NP2py)]− | χ [Eu(NP2py)2]5− | logK12 |
|---|---|---|---|
| 5D0 → 7F1 | 25% ± 10% | 75% ± 10% | 4.2 ± 0.5 |
| 5D0 → 7F2 | 18% ± 10% | 82% ± 10% | 4.5 ± 0.5 |
| 5D0 → 7F4 | 15% ± 10% | 85% ± 10% | 4.6 ± 0.5 |
| Average | 19(5) | 81(5) | 4.4 ± 0.5 |
The average molar fractions of [Eu(NP2py)2]5−and [Eu(NP2py)]− species are ∼81% and ∼19%, respectively. These results are consistent, within the error of experimental limits (±10%), regardless of the transition taken for the calculation. The estimated averaged value of logK1–2 for the reaction (1) is about 4.4 ± 0.5.
It should be noted that the presented speciation analysis for the case of f-elements is not always feasible, because the complexes existing in equilibrium are usually characterized by similar spectral patterns as it was shown previously by Horrocks et al. for the case of lanthanide complexes with NTP.15
To support the presented results the analysis was extended by potentiometric measurements.
Potentiometric study
K5 and logK6 values were determined previously by the NMR method.17 Measurements in different ionic strengths (KCl): 0.075 M, 0.1 M, 0.2 M, 0.5 M, 1 M and 2 M were also performed. The calculated logKn values are listed in Table 4.
| I [M] | logK1 (HL) |
logK2 (H2L) |
logK3 (H3L) |
logK4 (H4L) |
|
|---|---|---|---|---|---|
| 0.1 | NaClO4 | 10.63(2) | 6.74(6) | 5.61(8) | 2.23(9) |
| 0.075 | KCl | 10.87(1) | 6.55(2) | 5.47(2) | 2.17(2) |
| 0.1 | KCl | 10.83(1) | 6.61(2) | 5.29(2) | 1.60(6) |
| 0.2 | KCl | 10.78(1) | 6.41(2) | 5.37(2) | 2.00(3) |
| 0.5 | KCl | 10.59(1) | 6.27(2) | 5.25(2) | 1.60(6) |
| 1 | KCl | 10.50(1) | 6.17(2) | 5.26(2) | 2.01(4) |
| 2 | KCl | 10.51(1) | 6.19(2) | 5.27(2) | 1.60(8) |
The most basic constant logK1 = 10.63(2) (Table 4) corresponds to the protonation of the nitrogen of the tertiary amino group and is two logarithmic units higher than that of H6NTP acid.14,25–27 The values of this constant for NTP, determined by potentiometric methods in 0.1 M ionic strengths in different electrolytes at 25 °C were found to be: 12.7(1),14 12.8(2),25 12.20(6),26 12.5.27 Such a decrease of the highest protonation constant of H4NP2py is clearly caused by substitution of one of the phosphonic groups by the pyridine moiety. The same phenomenon has been noticed by Kurzak et al.28 in N-3-picolyliminodi(methylenephosphonic) acid (NP3py); the logK value of the tertiary amine was found to be 10.40(1) in 0.2 M KCl. The following deprotonation steps of H4NP2py release the protons from both phosphonic groups; logK2 = 6.74(4), logK4 = 2.23(5) and the pyridine moiety; logK3 = 5.61(4) (Table 4). Such deprotonation of H4NP2py is consistent with 31P NMR results17 and based on those data it was concluded that the third and fourth dissociation steps occur at pH between 2 and 3 (logK4) and 4–7 (logK3, logK2) and deprotonation of phosphonic groups is completed at pH above 8.2. The observed changes for the chemical shifts of pyridyl protons suggested that deprotonation of pyridine nitrogen occurs between pH 5 and 6, thus the pK3 value was assigned to pyridine nitrogen. This conclusion is confirmed by the observed changes in the UV-vis spectra of the NP2py ligand. The spectrophotometric titration curve is shown in Fig. 10.
 | ||
| Fig. 10 Spectrophotometric titration curve of the NP2py ligand. | ||
As was mentioned above, the 1π → 1π* and 1n → 1π* band observed in the UV spectrum of the NP2py ligand is particularly sensitive to the protonation of pyridine N (Fig. 3S†). A remarkable decrease of the ε value is observed between pH 5 and 7. This unequivocally confirms the attribution of logK3 to the protonation of the pyridine moiety.
The minimalization of the sum equal to  by using eqn (4) enabled us to determine the βn values which are converted into Kn values (Table 5).
 | (4) |
ε exp, εcalc – experimental and calculated absorption molar coefficients (M−1 cm−1) at λ = 259.6 nm;
ε L–εHnL – absorption molar coefficients of individual species;
β n – cumulative protonation constant.
| 31P NMR17 | UV-vis | Potentiometry | |
|---|---|---|---|
| logK (HL) |
10.9(9) | 11.0(9) | 10.63(2) |
| logK2 (H2L) |
6.7(9) | 6.6(9) | 6.74(6) |
| logK3 (H3L) |
5.5(9) | 5.6(9) | 5.61(8) |
| logK4 (H4L) |
2.3(9) | 2.7(9) | 2.23(9) |
| logK5 (H5L) |
0.98(5) | — | — |
| logK6 (H6L) |
0.70(5) | — | — |
As is seen from Table 5 the values of the respective logKn determined from different methods are the same, within the experimental error. Finally the calculated values of logKn were used to determine the speciation distribution curve, which is presented in Fig. 6S.†
:NP2py molar ratios 1:1 and 1:2. The calculated stability constants of LnL = [Ln(NP2py)]− and LnL2 = [Ln(NP2py)2]5− complexes (at 25 °C, INaClO4 = 0.1 M) are collected in Table 3S† and selected values are shown in Table 6.
:NP2py molar ratios of 1:1 and 1:2, at 25 °C, I = 0.1 mol dm−1 (NaClO4)
| Ln:NP2py |
1:1 |
1:2 |
|
|---|---|---|---|
| logβLnL |
logβLnL |
logβLnL2 |
|
| Sm3+ | 11.87(6) | 11.83(5) | 16.99(8) |
| Eu3+ | 12.85(8) | 12.85(6) | 18.44(9) |
| Gd3+ | 12.32(10) | 12.45(6) | 17.88(7) |
| Tb3+ | 13.36(7) | 13.47(10) | 17.86(9) |
The species distribution curves are depicted in Fig. 7S.† The potentiometric measurements of Eu:NP2py = 1:1 and 1:2 systems at different ionic strengths (KCl) were also performed and the determined stability constants are given in Table 4S.†
Based on potentiometric data it was possible to calculate logK12 for reaction 2, which is equal to 5.27 and similar within the limit of experimental error to that estimated from the spectroscopic data (4.4 ± 0.5).
The determined stability constants for Eu–NP2py systems were used to calculate the average ligand number (![[n with combining macron]](https://www.rsc.org/images/entities/char_006e_0304.gif) ) as a function of pH (Fig. 11). The data for the Eu–NTA (1:2) complex (where NTA is nitrilotriacetic acid) are also included in this figure for comparison purposes.29a
) as a function of pH (Fig. 11). The data for the Eu–NTA (1:2) complex (where NTA is nitrilotriacetic acid) are also included in this figure for comparison purposes.29a
 | ||
| Fig. 11 The average ligand number as a function of pH for Eu–NTA (1:2 ratio) as well as for Eu–NP2py complexes (1:2 and 1:1 ratios). | ||
As is seen in Fig. 11 the coordination of the NP2py ligand to the Eu3+ starts at about pH 3 for 1:1 and 1:2 complexes. In the case of the Eu:NP2py 1:2 system the formation of the [Ln(NP2py)2]5− complex starts at about pH 8 and it is consistent with the spectroscopic data described above. The difference between Eu–NTA and Eu–NP2py complexes with the molar ratio 1:2 is clearly seen. The coordination of two NTA ligands occurs at low pH ∼ 229 and is completed at pH ∼ 6. As far as Eu–NP2py of the 1:2 system is concerned, the [Eu(NP2py)]− complex is a predominating species within the pH range 3–9 and the formation of the [Eu(NP2py)2]5− complex takes place at pH above 8. This may be explained qualitatively by considering the formal charge of reacting species. In the case of the Ln–NTA system the neutral LnNTA complex reacts with the HnNTA ligand to form finally [Ln(NTA)2]3− species with the formal charge −3. The formal charge of the Ln(NP2py)2 complex is −5 and the formed complex is not as stable as [Ln(NTA)2]3−. Out of the considered complexes, the [Ln(NTP)2]9− one is the most negatively charged, therefore this may suggest that the stability of the complexes should change in the following order: Ln(NTA)2 > Ln(NP2py)2 > Ln(NTP)2. Such an assumption is consistent with potentiometric results derived from Sawada et al.14 These authors have shown that only the [Ln(NTP)]3− complex is formed in solution, on the other hand Kozlovski et al.16 assumed the existence of both – [Ln(NTP)]3− and [Ln(NTP)2]9− species.
Extrapolation of [Eu(NP2py)]− and [Eu(NP2py)2]5− stability constants to zero ionic strength
The SIT approach (Specific Ion Interaction Theory)18 was used for the extrapolation and correction of equilibrium data to the infinite dilution standard state. This simple method provides good estimations of activity coefficients and is recommended for use by the OECD Nuclear Energy Agency.30 The extrapolation of the formation constants to ionic strength equal to zero requires the estimation of activity coefficients of all species that participated in chemical reactions. This may be performed by the SIT model. For the reactions:| L4− + nH+ ⇄ HnL−4+n | (5) |
| Eu3+ + mL5− ⇄ [EuLm]−4m+3. | (6) |
βn(I) are related to the corresponding logarithms of thermodynamic constants β0n by the following equations: | (7) |
 | (8) |
The logγj of the j-species may be calculated by using the following formula:
 | (9) |
z – charge of the j-species;
I m – ionic strength of solution expressed in mol kg−1;
ε j – the interaction coefficient of ion pairs.
Combining eqn (8) or (9) with (10), the following equations are derived:
 | (10) |
 | (11) |
Δz2 = ∑z2products − ∑z2substrates;
Δε2 = ∑ε2products − ∑ε2substrates.
Linear regressions of eqn (10) and (11), using the experimental values of logβ(Im) and Im give the thermodynamic values of  and
and  (Table 7).
β0AB of compounds under study at the zero ionic strength at 25 °C
| AB | logβ0AB |
Δε | R 2 |
|---|---|---|---|
| HL | 11.8 ± 0.05 | −0.31 ± 0.05 | 0.92 |
| H2L | 19.0 ± 0.05 | −0.48 ± 0.04 | 0.98 |
| H3L | 24.6 ± 0.11 | −0.88 ± 0.10 | 0.96 |
| H4L | 26.9 ± 0.26 | −0.76 ± 0.25 | 0.76 |
| EuL | 16.3 ± 0.11 | −0.82 ± 0.11 | 0.95 |
| EuL2 | 19.5 ± 0.15 | −0.46 ± 0.15 | 0.77 |
In general, these data may be useful in finding a reliable, thermodynamic model of the complexation reaction of aminophosphonic ligands with lanthanides particularly that, to the best of our knowledge, there are no stability constants of lanthanide/actinide phosphonates extrapolated to the zero ionic strength. This is the reason for which we are unable to refer our data to other ones.
Summary and conclusions
The compounds of the formula [C(NH2)3]5[Ln(NP2py)2]·12H2O (where Ln = Eu, Gd) with new tripodal NP2py ligands were synthesized and their crystal structure was determined. The crystal comprises monomeric [Eu(NP2py)2]5− anions. Both ligands are bonded with the Eu3+ cation by two oxygen atoms from monodentate phosphonic groups, one tertiary nitrogen atom and one pyridine nitrogen atom, filling thus the eight coordination sites of the Eu3+ cation. The approximate Ci symmetry of the [Eu(NP2py)2]5− complex is reflected in the luminescence spectra, in which the intensity of the magnetic dipole 5D0 → 7F1 transition dominates over the intensities of the remaining 5D0 → 7F0,2,3,4 transitions.The luminescence spectra of Eu–NP2py and Tb–NP2py complexes in aqueous solutions at different pH with various Ln:L ratios were studied in order to find the coordination mode of the NP2py ligand and the stoichiometry of complexes. The NP2py ligand starts to coordinate through phosphonic oxygen atoms with Ln3+ at pH ∼ 2. The coordination of the pyridyl group to the Tb3+ occurs at pH between 3.0 and 5.5. The binding of the NP2py ligand is completed above pH = 6.
This study has demonstrated that both [Ln(NP2py)]− and [Ln(NP2py)2]5− complexes exist in solution, however, the [Ln(NP2py)2]5− starts to form at pH as high as 8. The comparison of the luminescence spectra of the [C(NH2)3]5[Eu(NP2py)2]·12H2O crystals with those of Eu:NP2py (1:2) solutions enabled us to estimate the molar fraction of [Eu(NP2py)]− (∼19%) and [Eu(NP2py)2]5− (∼81%) complexes at pH = 10.5, and finally, to calculate the conditional formation constant of reaction [Eu(NP2py)]−+NP2py4− ⇄ [Eu(NP2py)2]5− (logK12 = 4.4 ± 0.5).
The potentiometric measurements were applied to determine the stability constants of complexes under study. The stability constants are between 11.83(5) for [Sm(NP2py)]− and 13.47(7) for [Tb(NP2py)]− and are slightly lower than those obtained for Ln–NTP complexes.16 Thus, the substitution of one phosphonic group by a pyridyl moiety slightly affects the stability of the [Ln(NP2py)]− complex in comparison with the [Ln(NTP)]3− one.16 On the other hand the  of the [Ln(NP2py)2]5− complexes are about 5–6 orders smaller in comparison with those reported for [Ln(NTP)2]9−.16 It should be noted, however, that the existence of [Ln(NTP)2] complexes in solution has not been proved unequivocally.14–16
Potentiometric titrations at various ionic strengths were also performed in order to find the thermodynamic stability constants of [Eu(NP2py)]− and [Eu(NP2py)2]5− complexes. Such data are, in principle, preferable as a basis for discussion on the factors governing the stabilities of the complexes. The extrapolation of the formation constants to zero ionic strength under standard conditions was performed by the SIT procedure. The estimated logβ0EuL and  values are 16.3 ± 0.11 and 19.5 ± 0.15, respectively. For lanthanide aminophosphonate complexes there are no thermodynamic quantities in the literature therefore we refer the obtained data to the well-known [Eu(NTA)] and [Eu(NTA)2]3− complexes, only.29 The latter are characterized by the thermodynamic stability constants: logβ0EuNTA = 13.34 and
  = 22.66.
Taking into account all these data one may conclude that the high negative charge of a ligand may stabilize the LnL complex, but simultaneously destabilizes the LnL2 one.
Experimental
Materials
All chemicals used were of analytical grade. The stock solutions of anhydrous Ln3+ chlorides (Aldrich) were standardized against EDTA using xylenol orange as an indicator. N-(methylene-2-pyridine)-N,N-di(methylenephosphonate) as a diammonium dihydrogen compound was synthesized as described previously.17Crystal preparation
The crystals of the formula [C(NH2)3]5[Ln(NP2py)2]·12H2O (Ln = Eu or Gd) were obtained in the following way:The suspension of 0.5 mmol Ln2O3 (Eu2O3 Stanford Materials 99.995%, Gd2O3 Stanford Materials 99.99%) and of 2.2 mmol (NH4)2H2NP2py salt in H2O were heated at 90 °C ± 5 °C. After dissolution of the reagents, the solution was alkalized by using [C(NH2)3]2CO3 to the final pH ∼ 10.5 and left for crystallization. The colourless crystals were formed after three months.
The luminescence quantum yields for solutions of the Tb3+-NP2py complexes were determined in relation to fluorescein in 0.1 M NaOH (Φ = 93%), by using eqn (13):
 | (13) |
X-Ray crystal analysis
The crystallographic measurements were performed on an Xcalibur, Sapphire2 four-circle diffractometer with graphite-monochromatized MoKα radiation. The data for the crystal were collected at 100(2) K using the Oxford Cryosystems cooler and were analytically corrected for absorption with the use of the CrysAlis RED program of the Xcalibur software. The structures were solved routinely by using Patterson synthesis. The C- and N-bonded hydrogen atoms were placed in positions calculated from the geometry. The final refinement was anisotropic for all non-H atoms. The computations were performed with the SHELXS9731 and SHELXL97 programs,32 and the molecular graphics was prepared with XP–Interactive Molecular Graphics.33 High residual peaks suggest that the C50 guanidine cation is partially distorted, however it was not possible to resolve this distortion. A summary of the conditions for the data collection and the structure refinement parameters is given in Table 8.| CCDC no. | CCDC 1541895 | CCDC 1541894 |
| Chemical formula | C21H74EuN19O24P4 | C21H74GdN19O24P4 |
| M r | 1252.83 | 1258.12 |
| Crystal system, space group | Triclinic, P |
Triclinic, P |
| Temperature (K) | 100(2) | 100(2) |
| a, b, c (Å) | 11.9255 (11), 14.1373 (12), 16.1417 (15) | 11.9496 (6), 14.1528 (7), 16.1651 (9) |
| α, β, γ (°) | 105.889 (8), 94.515 (7), 90.629 (7) | 105.710 (5), 94.360 (4), 90.901 (4) |
| V (Å3) | 2607.8 (4) | 2622.2 (2) |
| Z | 2 | 2 |
| μ (mm−1) | 1.39 | 1.48 |
| Crystal size (mm) | 0.45 × 0.07 × 0.04 | 0.27 × 0.05 × 0.02 |
| T min, Tmax | 0.709, 0.958 | 0.816, 0.979 |
| No. of measured, independent and observed [I > 2σ(I)] reflections | 51538, 25885, 19822 |
23976, 15463, 8529 |
| R int | 0.053 | 0.093 |
| (sin θ/λ)max (Å−1) | 0.851 | 0.737 |
| R[F2 > 2σ(F2)], wR(F2), S | 0.061, 0.147, 1.15 | 0.101, 0.184, 1.05 |
| No. of reflections | 25885 |
15463 |
| No. of parameters | 601 | 601 |
| No. of restraints | 6 | 6 |
| Δρmax,Δρmin(e Å−3) | 4.71, −2.10 | 1.26, −1.25 |
Spectroscopic measurements
Luminescence spectra and luminescence lifetimes were recorded on an Edinburgh Instruments FLS 920 spectrometer at RT. UV-vis absorption spectra were recorded on a Cary 500 UV/Vis/NIR spectrophotometer.Potentiometric titrations
The solution studies were carried out in double-distilled water. The titrations were performed using a MOLSPIN pH-meter system equipped with a Mettler Toledo InLab® Micro electrode filled with 3 M KCl and the automatic burette. The electrode was calibrated daily against hydrogen concentrations using HClO4 (Merck) or HCl (POCh) according to the procedure of Irving et al.34 The purity and exact concentration of the ligand were determined by the method of Gran.35 Alkali, carbonate-free, was standardized by titration with potassium hydrogen phthalate (Merck).Measurements in 0.1 M ionic strength:
The ionic strength was fixed at I = 0.1 M with NaClO4 (VWr). The ionic product of water under the used conditions was 10–13,77 mol2 dm−6. Alkali: 0.1 M sodium hydroxide solution (Aldrich).
Measurements in various ionic strengths:
The ionic strength was fixed at I = 0.075 M, 0.1 M, 0.2 M, 0.5 M, 1 M and 2 M with KCl (POCh). The ionic product of water under the used conditions was 10–13,78, 10–13,77, 10–13,72, and 10–13,75 mol2 dm−6, respectively.36 Alkali: 0.1 M potassium hydroxide solution (Aldrich).
All the titrations were carried out on 2.0–3.0 ml samples at 25 ± 0.2 °C under an atmosphere of Ar. SUPERQUAD37 and HYPERQUAD200838 computer programs that use non-linear least-squares methods39 were applied to calculate the stability constants. The results were obtained in the form of concentration overall stability constants βpqr = [MpHqLr]/[M]p[H]q[L]r, where M stands for metal, H is proton and L the deprotonated form of the ligand. They are, however, a good indication of the importance of a particular species in the equilibrium. Triplicate titrations of the free ligand (number of recorded points: 150–180) and the complexes were carried out at metal to ligand ratios 1:1 and 1:2 (number of recorded points: 180–210). Each time about 120–150 and 150–190 titration points have been used for the calculations, respectively. The ligand concentration was 0.7–1 × 10⁻³ mol dm−3 in all titrations. No precipitation was noticed in any titration. The distribution curve of the protonated species of L as a function of pH was calculated using the HySS2009 program.40
The ligand used for potentiometric measurements was in the form of a diammonium salt ((NH4)2H2NP2py); NP2py = [H6L]2+ in order to improve its solubility in water. Therefore two ammonium cations were also considered in the overall acid–base equilibrium calculations of the compound. The determined values of the protonation constants which belong to the ammonia logKNH4 vary within the range 8.98(1)–9.73(1) for different studied ionic strengths and are very close to those previously reported in the literature: logK = 9.38(1),41 logK = 9.50,42 logK = 9.10(3),43 (I = 0.1 M).
CAUTION! Although no problems were encountered in this work, transition metal perchlorate complexes are potentially explosive and should be handled with appropriate precautions.
Acknowledgements
This work was supported by MNiSW grant no 2273/M/WCH/12.References
- (a) W. A. Volkert and T. J. Hoffmann, Chem. Rev., 1999, 99, 2269–2292 CrossRef CAS PubMed; (b) E. Gumienna-Kontecka and J. Gałęzowska, Coord. Chem. Rev., 2012, 256, 105–124 CrossRef; (c) J. Goura and V. Chandrasekhar, Chem. Rev., 2015, 115, 6854–6965 CrossRef CAS PubMed; (d) J. A. Amoroso, I. A. Fallis and S. J. A. Pope, Coord. Chem. Rev., 2017, 340, 198–219 CrossRef; (e) A. D. G. Firmino, R. F. Mendes, M. M. Antunes, P. C. Barbosa, S. M. F. Vilela, A. A. Valente, F. M. L. Figueiredo, J. P. C. Tome and F. A. A. Paz, Inorg. Chem., 2017, 56, 1193–1208 CrossRef CAS PubMed.
- L. Lukeš, J. Kotek, P. Vojtisek and P. Hermann, Coord. Chem. Rev., 2001, 216–217, 287 CrossRef.
- (a) R. Janicki and P. Starynowicz, Acta Crystallogr., Sect. B: Struct. Sci., 2010, 66, 559–567 CAS; (b) R. Janicki, A. Kędziorki and A. Mondry, Phys. Chem. Chem. Phys., 2016, 18, 27808–27817 RSC.
- A. Mermer and P. Starynowicz, Acta Crystallogr., Sect. B: Struct. Sci., 2011, 67, 399–408 CAS.
- (a) T. Kiss, J. Balla, G. Nagy, H. Kozlowski and T. Jankowska, Inorg. Chim. Acta, 1987, 138, 25–30 CrossRef CAS; (b) T. Kiss and I. Lazar, in Aminophosphonic and Aminophosphinic Acids: Chemistry and Biological Activity, ed. P. V. Kukhar and H. R. Hudson, Wiley, NY, 2000, pp. 285–325 Search PubMed.
- (a) G. Ch. de Witt, P. M. May, J. Webb and G. Hefter, BioMetals, 1996, 9, 351–361 CrossRef; (b) A. D. Sherry, J. Ren, J. Huskens, E. Brücher, E. Tóth, C. F. C. G. Geraldes, M. M. C. A. Castro and W. P. Cacheris, Inorg. Chem., 1996, 35, 4604–4612 CrossRef CAS; (c) J. E. Bollinger and D. M. Roundhill, Inorg. Chem., 1993, 32, 2821–2826 CrossRef CAS; (d) J. Gałęzowska, R. Janicki, A. Mondry, R. Burgada, T. Bailly, M. Lecouvey and H. Kozlowski, Dalton Trans., 2006, 4384–4394 RSC; (e) A. Mondry and R. Janicki, Dalton Trans., 2006, 4702–4710 RSC; (f) R. Janicki and A. Mondry, Polyhedron, 2008, 27, 1942–1946 CrossRef CAS; (g) R. Janicki and A. Mondry, Eur. J. Inorg. Chem., 2013, 3429–3438 CrossRef CAS; (h) R. Janicki, M. Monteil, M. Lecouvey and A. Mondry, Opt. Mater., 2013, 36, 259–264 CrossRef CAS; (i) J. Gałęzowska, R. Janicki, H. Kozłowski, A. Mondry, P. Młynarz and Ł. Szyrwiel, Eur. J. Inorg. Chem., 2010, 1696–1702 CrossRef.
- (a) J. C. G. Bünzli and C. Piguet, Chem. Soc. Rev., 2005, 4, 1048–1077 RSC; (b) J. C. G. Bünzli and S. V. Eliseeva, Chem. Sci., 2013, 4, 1939–1949 RSC.
- J.-G. Mao, Coord. Chem. Rev., 2007, 251, 1493–1520 CrossRef CAS.
- (a) A. L. Tiwari, H. Ojha, A. Kaul, A. Dutta, P. Srivastava, G. Shukla, R. Srivastava and A. K. Mishra, Chem. Biol. Drug Des., 2009, 7, 87–91 Search PubMed; (b) É. Tóth, L. Helm and A. E. Merbach, in The Chemistry of Contrast Agents in Medical Magnetic Resonance Imaging, ed. A. E. Merbach, L. Helm and É. Tóth, Wiley, Chichester, UK, 2nd edn, 2013, pp. 25–76 Search PubMed; (c) S. Marinim, Y. Huang, D. Coman and F. Hyder, J. Biol. Inorg. Chem., 2014, 19, 1385–1398 CrossRef PubMed; (d) M. Elhabiri, S. Abada, M. Sy, A. Nonat, P. Choquet, D. Esteban-Gómez, C. Cassino, C. Platas-Iglesias, M. Botta and L. J. Charbonnière, Chem. – Eur. J., 2015, 21, 6535–6546 CrossRef CAS PubMed.
- A. D. Sherry and C. F. G. C. Geraldes, in Lanthanide Probes in Life, Chemical and Earth Sciences, Theory and Practice, ed. J. C. Bünzli and G. Choppin, Elsevier, Amsterdam, 1989, p. 93 Search PubMed.
- US FDA Approval for Quadramet, 28/09/97 (NDA) 020570.
- (a) H. Studnik, S. Liebsch, G. Forlani, D. Wieczorek, P. Kafarski and J. Lipok, New Biotechnol., 2015, 32(1), 1–6 CrossRef CAS PubMed; (b) B. Nowack, Water Res., 2002, 36, 4636–4642 CrossRef CAS PubMed.
- (a) P. Silva, F. Vieira, A. C. Gomes, D. Ananias, J. A. Fernandes, S. M. Bruno, R. Soares, A. A. Valente, J. Rocha and F. A. Almeida Paz, J. Am. Chem. Soc., 2011, 133, 15120–15138 CrossRef CAS PubMed; (b) R. F. Mendes, P. Silva, M. M. Antunes, A. A. Valente and F. A. Almeida Paz, Chem. Commun., 2015, 51, 10807–10810 RSC.
- K. Sawada, M. Kuribayashi, T. Suzuki and H. Miyamoto, J. Solution Chem., 1991, 20, 829–839 CrossRef CAS.
- R. C. Holz, G. E. Meister and W. Dew. Horrocks Jr., Inorg. Chem., 1990, 29, 5183–5189 CrossRef CAS.
- E. Kozlovski, S. Aleksandrov and L. Chesnokova, Zh. Neorg. Khim., 2002, 47, 1566–1568 Search PubMed.
- R. Janicki, J. Mol. Struct., 2013, 1036, 35–41 CrossRef CAS.
- (a) J. N. Brønsted, J. Am. Chem. Soc., 1922, 44, 877–898 CrossRef; (b) J. N. Brønsted, J. Am. Chem. Soc., 1922, 44, 938–948 CrossRef; (c) E. A. Guggenheim, Philos. Mag., 1935, 19, 588–643 CrossRef CAS; (d) G. Scatchard, Chem. Rev., 1936, 19, 309–327 CrossRef CAS.
- R. S. Dickins, D. Parker, J. I. Bruce and D. J. Tozer, Dalton Trans., 2003, 1264–1271 RSC.
- (a) M. Pan, X. L. Zheng, Y. Liu, W. S. Liu and C. Y. Su, Dalton Trans., 2009, 2157–2169 RSC; (b) Q. Y. Yang, K. Wu, J. J. Jiang, C. W. Hsu, M. Pan, J. M. Lehn and C. Y. Su, Chem. Commun., 2014, 50, 7702–7704 RSC; (c) B. B. Du, a Y. X. Zhu, M. Pan, M. Q. Yue, Y. J. Hou, K. Wu, L. Yin Zhang, L. Chen, S. Y. Yin, Y. N. Fana and C. Y. Su, Chem. Commun., 2015, 51, 12533–12536 RSC; (d) E. Kasprzycka, V. A. Trush, V. M. Amirkhanov, L. Jerzykiewicz, O. Malta, J. Legendziewicz and P. Gawryszewska, Chem. – Eur. J., 2017, 23, 1318–1330 CrossRef CAS PubMed.
- (a) C. Görller-Walrand, C. L. Fluyt, A. Ceulemans and W. T. Carnall, J. Chem. Phys., 1991, 95, 3099 CrossRef; (b) C. Görller-Walrand and K. Binnemans, in Handbook on the Physics and Chemistry of Rare Earths Vol. 25, ed. K. A. Gschneidner and L. Eyring, Elsevier, 1998, vol. 167, pp. 121–125 Search PubMed.
- (a) M. Latva, H. Takalo, V. M. Mukkala, C. Matachescu, J. C. Rodriguez-Ubis and J. Kankare, J. Lumin., 1995, 75, 149–169 CrossRef; (b) L. Smętek and A. Kędziorski, J. Lumin., 2010, 130, 1154–1159 CrossRef.
- (a) R. Janicki and A. Mondry, Phys. Chem. Chem. Phys., 2015, 16, 26823–26831 RSC; (b) R. Janicki and A. Mondry, Phys. Chem. Chem. Phys., 2015, 17, 29558–29565 RSC.
- K. Bukietyńska, A. Mondry, P. N. Thuy and P. Starynowicz, J. Alloys Compd., 1995, 225, 52–54 CrossRef.
- C. K. Sawada, T. Araki and T. Suzuki, Inorg. Chem., 1987, 26, 1199 CrossRef.
- G. Grossmann, K. A. Burkov, G. Hägele, L. A. Myund, S. Hermens, C. Verwey and S. M. Arat-ool, Inorg. Chim. Acta, 2004, 357, 797 CrossRef CAS.
- V. Deluchat, J.-C. Bolliner, B. Shepaud and C. Caullet, Talanta, 1997, 44, 897 CrossRef CAS PubMed.
- B. Kurzak, A. Kamecka, K. Kurzak, J. Jezierska and P. Kafarski, Polyhedron, 2000, 19, 2083 CrossRef CAS.
- (a) G. Anderegg, Pure Appl. Chem., 1982, 54, 2693–2758 CrossRef CAS; (b) K. Bukietyńska and A. Mondry, Inorg. Chim. Acta, 1987, 130, 271–276 CrossRef.
- I. Grenthe, F. Mompean, K. Spahiu and H. Wanner, Guidelines for the extrapolation to zero ionic strength, OECD Nuclear Energy Agency, Data Bank, 2013 Search PubMed.
- G. M. Sheldrick, SHELXS-97, program for structure solution, University of Göttingen, 1997 Search PubMed.
- G. M. Sheldrick, SHELXL-97, program for structure refinement, University of Göttingen, 1997 Search PubMed.
- 40 XP–Interactive Molecular Graphics, v. 5.1–Bruker Analytical X-ray Systems 1998.
- H. M. Irving, M. G. Miles and L. D. Pettit, Anal. Chim. Acta, 1967, 38, 475–488 CrossRef CAS.
- G. Gran, Acta Chem. Scand., 1950, 4, 559–577 CrossRef CAS; G. Gran, Analyst, 1952, 77, 661–671 RSC.
- F. H. Sweeton, R. E. Mesmer and C. F. Baes Jr., J. Solution Chem., 1974, 3(3), 191–214 CrossRef CAS.
- P. Gans, A. Sabatini and A. Vacca, J. Chem. Soc., Dalton Trans., 1985, 1195–1200 RSC.
- P. Gans, A. Sabatini and A. Vacca, Talanta, 1996, 43, 1739–1753 CrossRef CAS PubMed.
- P. Gans, Data Fitting in the Chemical Sciences, John Wiley & Sons, Chichester, 1992 Search PubMed.
- L. Alderighi, P. Gans, A. Ienco, D. Peters, A. Sabatini and A. Vacca, Coord. Chem. Rev., 1999, 184, 311–318 CrossRef CAS.
- N. Saha and H. Sigel, J. Am. Chem. Soc., 1982, 104, 4100 CrossRef CAS.
- S. Kim and R. Martin, J. Am. Chem. Soc., 1984, 106, 1707 CrossRef CAS.
- W. N. Perera and G. Senanayake, Inorg. Chem., 2004, 43, 3048 CrossRef CAS PubMed.
Footnote |
| † Electronic supplementary information (ESI) available: Table 1S. The fitting parameters for eqn (3), determined from the spectra of the 5D0 → 7F1,2,4 transitions of the [Eu(NP2py)2]5− complex in aqueous solution; Table 2S. Selected luminescent data of Eu–NP2py and Tb–NP2py systems; Table 3.The complex formation constants of NP2Py with Sm3+, Eu3+, Gd3+ and Tb3+ at 25 °C, I = 0.1 mol dm−3 (NaClO4), in 1:1 and 1:2 molar ratios Ln:L; Table 4S. Stability constants of NP2Py with Eu3+ at 25 °C in different ionic strengths (KCl); Fig. 1S. Phosphorescence spectrum of [C(NH2)3]5[Gd(NP2py)2]·12H2O crystals at 77 K; Fig. 2S. The plot of luminescence quantum yields of Tb:NP2py 1:1 and 1:2 systems versus pH; Fig. 3S. UV spectra of the NP2py ligand and Tb:NP2py complex at various pH; Fig. 4S. Plot of qH2Oversus pH of solution for the Eu–NP2py complex with Eu:NP2py ratios of 1:1 and 1:2. The ΔqH2O is the difference between qH2O for 1:1 and 1:2 solutions at the same pH; Fig. 5S. Plot of qH2Oversus pH of solution for the Tb–NP2py complex with Tb:NP2py ratios of 1:1 and 1:2; Fig. 6S. Species distribution curves of H6NP2py acid (L). Charges omitted for brevity; Fig. 7S. Species distribution curves for the Ln3+–N2Py complexes as a function of pH for a 1:1 Ln:L molar ratio (A) and 1:2 Ln:L (B). Equimolar complexes are marked in blue, biscomplexes in red color, I = 0.1 M NaClO4, 25 °C. CCDC 1541894 and 1541895. For ESI and crystallographic data in CIF or other electronic format see DOI: 10.1039/c7qi00191f |
| This journal is © the Partner Organisations 2017 |