 Open Access Article
Creative Commons Attribution 3.0 Unported Licence
How to tune luminescent Cu(I) complexes with strong donor carbenes towards TADF?†
Jasper
Guhl‡
 a,
Dragana
Sretenović‡
 b,
Philipp
Schmeinck
c,
Suren
Felekyan
 b,
Ralf
Kühnemuth
b,
Christian
Ganter
b,
Ralf
Kühnemuth
b,
Christian
Ganter
 *c,
Claus A. M.
Seidel
 *b,
Christel M.
Marian
 *a and
Markus
Suta
 *c
*c
aInstitute for Theoretical and Computational Chemistry, Faculty of Mathematics and Natural Sciences, Heinrich Heine University Düsseldorf, 40225 Düsseldorf, Germany. E-mail: christel.marian@hhu.de
bInstitute for Molecular Physical Chemistry, Faculty of Mathematics and Natural Sciences, Heinrich Heine University Düsseldorf, 40225 Düsseldorf, Germany. E-mail: claus.seidel@hhu.de
cInstitute for Inorganic and Structural Chemistry, Faculty of Mathematics and Natural Sciences, Heinrich Heine University Düsseldorf, 40225 Düsseldorf, Germany. E-mail: christian.ganter@hhu.de
First published on 17th June 2024
Abstract
Cu(I) carbene complexes are common emitters of current emerging interest for next-generation OLED technology based on their encountered thermally activated delayed fluorescence (TADF) properties. However, general molecular design principles for successfully observable TADF properties of such complexes usually rely on π-acidic N-heterocyclic carbene (NHC) ligands, while Cu(I) carbene complexes with purely σ-donating NHC ligands are still scarce. Based on a simple synthetic approach reported by us earlier that offers large-scale access to this class of Cu(I) carbene complexes, we aim to elucidate design principles to enhance their TADF properties. In this work, we combined temperature-dependent time-resolved luminescence spectroscopy on different time scales (ns, μs, ms) with high-level DFT/MRCI calculations on a number of representative Cu(I) NHC complexes with the anionic carbene An6DAC and additional pyridine-derived ligands. Good agreement between experiment and theory related to the electronic nature of the optical transitions, the energy levels of the electronic states and the kinetics of interconversion controlled by the respective energy gaps was found. We conclude that both the electron-rich or electron-poor nature of the pyridine ligands and the coordination geometry (linear, trigonal planar) play a significant role in the outcome of the optical properties of these complexes. While electron-rich pyridine moieties induce decoupled prompt fluorescence and phosphorescence with connected low photoluminescence quantum yields, electron-poor pyridine moieties enhance a “push–pull” effect mediated by Cu(I) that favours TADF properties so that the luminescence intensity is increased by 1–2 orders of magnitude if the complex is trigonal. In the trigonal formyl pyridine complex, theory predicts high MLCT contributions to the electronic wavefunctions, so that the T1 states should exhibit large spin–orbit coupling matrix elements (SOCMEs) with several excited singlet states. Indeed, in temperature dependent luminescence measurements, the electronic states behave as an intimately coupled ensemble. At 270 K, 56% of its luminescence can be attributed to TADF. However, while the luminescence of the trigonal complexes is brighter, their chemical Cu–pyridine bond is more labile. Overall, this study provides a detailed overview of the possibilities of targeted molecular design to selectively address desirable optical properties in organometallic compounds for potential applications in lighting.
Introduction
Since the pioneering work of Tang et al.1 on organic electroluminescent diodes in the 1980s, we have witnessed the evolution of four generations of small-molecule organic light-emitting diodes (OLEDs).2–5 Currently, there is still no end of this evolution in sight: the first generation was based on fluorescent emitters and can therefore exploit at most 25% of the electrically generated excitons. The second generation made use of heavy-metal complexes based on, e.g., Ir(III) or Pt(II) that enhance spin–orbit coupling by the heavy-atom effect and thus, lead to dominant phosphorescence. Due to ultrafast intersystem crossing from the excited singlet state to the triplet manifold, this approach harvests both singlet and triplet excitons and increased the theoretically expected internal quantum efficiency of electroluminescence (IQE) to 100%. The third (exploiting thermally activated delayed fluorescence, TADF) and fourth (hyperfluorescence, combination of a TADF emitter with a narrow-band emitting fluorescent emitter) generations use less expensive materials and can in principle achieve 100% IQE as well. Despite those promising features, there are still several shortcomings to be tackled. With typical electroluminescence decay times in the microsecond regime, phosphorescent OLEDs (PhOLEDs) and OLEDs based on TADF are prone to photochemical side reactions in the excited state, which are detrimental to the operational durability of the device.6 In particular, blue light emitting OLEDs are known to suffer from degradation of the emitter material.7 TADF emitters have the advantage over PhOLED emitters that their synthesis does not rely on any precious heavy metals but are composed of earth-abundant elements and thus, less expensive. Besides purely organic donor–acceptor systems, complexes of the coinage metals, in particular Cu(I), have been used.8–10 The preference for d10 elements in TADF emitting transition metal complexes is related to the lack of energetically accessible metal-centered (MC) d → d* excitations that are known to cause predissociation of metal–ligand bonds in phosphorescent Ir(III) and Pt(II) complexes,11 for example.The energetic proximity of metal-to-ligand charge transfer (MLCT), ligand-to-ligand charge-transfer (LLCT) and ligand-centered (LC) excitations in Cu(I) complexes is both bless and curse—a bless because it forms the basis for a rich photochemistry and photophysics,10 and a curse because low-lying 3LC states tend to act as dark traps for the excited state population with the tendency for non-radiative relaxation.12,13 Dependent on the particular case, the population of MLCT states can be advantageous or disadvantageous for the luminescence properties of Cu(I) complexes involving triplet states. On the one hand, the hole in the Cu d shell enhances spin–orbit coupling (SOC) and thus increases the probability of intersystem crossing (ISC) and reverse ISC (rISC) processes that are necessary for harvesting the triplet excitons in OLEDs.10,14,15 On the other hand, the pseudo Jahn–Teller effect on the d9 electronic structure in an MLCT state causes large geometrical displacements which can be detrimental to the electro- or photoluminescence quantum yields (ΦEL or ΦPL) of MLCT states and requires chemical ligand design strategies to sterically limit the distortion in the excited state.16–23 In cationic Cu(I) complexes carrying an N-heterocyclic carbene (NHC) and an aromatic ligand, moreover the torsional orientation of the carbene and π-systems has an impact on the S–T energy gap, ΔEST, and hence, the ability of these complexes to show phosphorescence or TADF.24,25 Generally, ΔEST tends to be larger for MLCT states than for LLCT states.19 For this reason, two-fold coordinated linear Cu(I) complexes with MLCT-type S1 and T1 states are often phosphorescent, whereas complexes with energetically low-lying LLCT states are more promising candidates for TADF if admixture of energetically close MLCT states is possible.
Among the linear coinage metal complexes, carbene metal amides stand out: depending on the π-acceptor strength of the carbene, the color of the LLCT emission can be tuned from blue to the NIR region and many of these complexes are TADF-active with high luminescence quantum yields.21–23,25–32 Their ISC and rISC mechanism have been studied in great detail revealing solvent reorganization as well as vibronic coupling effects.19,33–37 The direction of the CT is less obvious in cationic linear carbene Cu(I) complexes incorporating neutral aromatic imine ligands instead of an amide. Here, the carbene as well as the imine may adopt the role of the acceptor. Studies employing classical NHC and pyridine-based ligands revealed that the steric demand of the NHC and the presence of electron-withdrawing substituents in para-position of the pyridine ligand are important factors favoring luminescence involving the triplet state either directly or via TADF.12,38
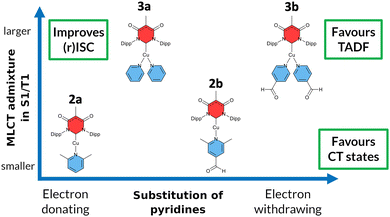
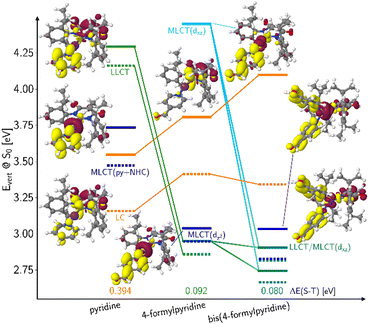
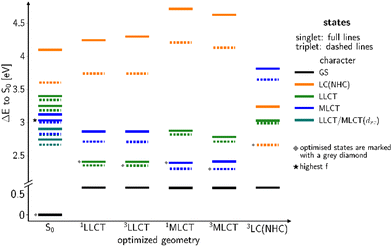
Another class of efficient OLED emitters are zwitterionic mixed carbene coinage metal complexes combining an anionic malonate-derived NHC unit and a classical neutral NHC. Such complexes were reported to show bluish-white phosphorescence.39 The overall charge neutrality of this class of compounds is advantageous for the fabrication of OLED devices due to their appreciable vapor pressure. Zwitterionic carbene Cu(I) units may alternatively be combined with neutral pyridine-based ligands and are also overall charge neutral. Specifically, in a recent paper we reported on a series of such complexes, comprising, inter alia, the linear derivatives 2a,b and the trigonal compounds 3a,b (Chart 1). In the present contribution we analyse the photophysical properties of these four complexes in depth with both, experimental and theoretical methods. The aim was to eventually establish a design principle for efficient TADF performance. Preliminary scans of the energy level scheme by quantum chemistry (Fig. 1) revealed that the acceptor properties of pyridine are insufficient for making the carbene-to-pyridine LLCT states the lowest singlet and triplet excited states.40 In the linear complex with unsubstituted pyridine, S1 and T1 arise predominantly from local excitations on the carbene ligand. With a ΔEST value of 0.394 eV, the singlet–triplet energy gap is too large enabling TADF at room temperature. Test calculations suggest that fluorination is not sufficient to increase the acceptor strength of the pyridine ligand, as F exerts a +M (mesomeric) effect in addition to a −I (inductive) effect. Possible substituents combining −I with −M effects are nitrile and formyl groups. Previous work on related cationic carbene pyridine Cu(I) complexes revealed, however, that a nitrile functionality in para-position of the pyridine ligand tends to coordinate to a Cu atom of a neighbouring linear complex, thus forming a coordination polymer.38 When a formyl group was employed as an electron-withdrawing substituent instead, this complication did not arise. In the present case, S1 and T1 adopt LLCT character if 4-formylpyridine is used as a ligand in the neutral linear copper carbene complex which reduces ΔEST to merely 0.092 eV (Fig. 1). Moreover, MLCT states are found energetically close-by, thus promoting SOC. Thus, this linear 4-formylpyridine Cu(I) complex with an anionic donor carbene could be considered an ideal candidate for an efficient TADF emitter if it were not for the known problem that sterically unprotected electron-deficient Cu centers are susceptible to bond formation with additional coordinating molecules.12,25,26,41,42 To prevent the accidental formation of trigonal complexes, we introduced methyl groups in ortho-position of the pyridine ring which increase the steric demand of the ligand, yielding the linear lutidine and 4-formyllutidine complexes 2a and 2b, respectively.43 An alternative approach to increase the “pull” effect is the introduction of a second acceptor ligand resulting in the bis(formylpyridine) complex 3b, for which lower energies of the LLCT and MLCT states in comparison to the LC states are calculated (Fig. 1). For the reasons outlined above, the four complexes 2a,b and 3a,b (Chart 1) were selected for our in-depth analysis of the photophysical properties.
According to the previously indicated guidelines, TADF is thus expectedly most prominent in a Cu(I) carbene complex with an electron-donating carbene and two strongly electron-withdrawing pyridine moieties to stabilize excited states with a strong LLCT character mediated by the redox-active Cu(I) central atom. In addition, a trigonal coordination pattern leads to an admixture of LLCT and MLCT character in the lowest electronically excited singlet and triplet states, resulting in larger mutual SOC compared to the respective linear complex (Fig. 1). These simple guidelines imply that the trigonal planar complex 3b (Chart 1) should be a promising candidate for TADF in this uncommon scheme exploiting an electron-rich NHC ligand. In contrast, the linearly coordinated heteroleptic Cu(I) carbene complex 2a should expectedly show prominent phosphorescence. It is the purpose of this work to combine advanced quantum chemical methods with time-resolved spectroscopy in suspensions of microcrystallites and the solid state in a temperature range between 10 K and 298 K to investigate whether these simple guidelines hold in practice to offer a possibility for targeted design of TADF emitters based on Cu(I) carbene complexes with strong donor carbenes. Due to chemical lability of the complexes in solution, the spectroscopy was carried out in cyclohexane suspensions of microcrystalline compounds. This method allowed for the preparation of sufficiently stable solid-state samples in standard cuvettes, thereby enabling absorption experiments, among other benefits. The validity of the collected data is supported by selected experiments on the neat powdered samples (see ESI,† Fig. S3).
Our synthesis started from the recently described moisture and air-stable one-dimensional coordination polymer [Cu(An6DAC)]n which, upon treatment with the appropriate pyridine ligand, provided the respective linear or trigonal complexes, dependent on the particular substitution pattern of the pyridine derivative (Chart 1).43 In addition to structural characterization of the synthesized compounds, excitation, absorption and steady-state emission spectra of four luminescent complexes were presented in that work, but the electronic nature of the emitting states, and their time-resolved luminescence properties with the corresponding temperature dependence had not yet been determined. This work is organized in a way that each complex is investigated in detail with respect to its energetic and dynamic properties. To characterize the relevant electronic states, we compared the experimental spectral properties with computed DFT/MRCI excited state energy levels. The coupling between those states was extracted from the temperature dependence of time-resolved luminescence data in distinct time regimes and thus obtained activation energies as well as rate constants are compared with the theoretically computed rate constants for emission and ISC. The results of each complex provide a reasonable data basis how structural design influences the optical properties in organometallic compounds (Chart 1). In this way, we demonstrate the possibilities and challenges of targeted molecular design in selectively addressing desirable optical properties in organometallic compounds.
Results and discussion
The linear lutidine complex 2a
In this complex, a strongly σ-donating, anionic electron-rich carbene is combined with a relatively electron-rich pyridine moiety. Consequently, CT-type emission is not readily expected in 2a and the luminescence should be governed by ligand-centred (LC) states. The excitation and emission spectra of this complex in Fig. 2 confirm this idea. At the excitation wavelength of the luminescence experiments (375 nm), primarily the S1 state is populated. The experimental optical steady-state spectroscopic parameters of all complexes in cyclohexane suspension at 298 K are compiled in Table 1. In addition, we analysed the time-resolved luminescence decays in distinct time regimes in a wide temperature range: nanoseconds to resolve prompt fluorescence, microseconds and milliseconds to characterize TADF and phosphorescence. Often, the decays were multi-exponential so that we listed the intensity-averaged luminescence lifetime, 〈τ〉I, of all complexes in Table 2 and the individual parameters of all components in Tables S1–S11 (ESI†). Our quantum chemical calculations indicate that its wavefunction is dominated by a 1LC(carbene) character with small 1LLCT(carbene-to-lutidine) contributions (vertical excitation wavelength 349 nm, oscillator strength f = 0.093). Below S1, the corresponding 3LC(carbene) and a 3MLCT(dz2-to-lutidine) state are found in the vertical energy spectrum, respectively. The latter state is practically degenerate with S1 in the Franck–Condon (FC) region, but does not play an essential role in the emission process. Occupation of the C–N-antibonding π* orbital in the S1 state leads to a substantial elongation of the carbene C–N bonds which stabilizes the LC(carbene) contributions to the S1 wavefunction. Blue emission with a maximum at λmax ≈ 450 nm is observed in the luminescence spectrum at room temperature. The excitation and emission spectra of the powdered samples are in excellent agreement with those measured in cyclohexane suspension (Fig. 2A). However, the measured excitation spectrum in cyclohexane suspension does not completely overlap with the absorption spectrum (Fig. 2B). This discrepancy is quantified by the ratio of excitation and absorption values, normalized at the excitation wavelength of 375 nm (Fig. 2B top). The normalized excitation/absorbance ratio at longer wavelengths indicates the presence of additional non-luminescent species in suspensions (Fig. 2). Despite the observed discrepancy, the theoretically predicted spectrum agrees well with the longest excitation band.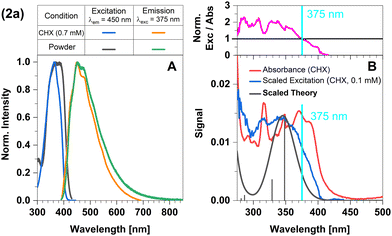 | ||
| Fig. 2 Spectra of compound 2a at 298 K (summary in Table 1). The measurements procedures are described in detail in Experimental and theoretical procedures. (A) Excitation and emission spectra in liquid cyclohexane (CHX) and powder. (B) For a qualitative comparison of the absorption properties, the excitation and the broadened DFT/MRCI spectrum were scaled to the experimental absorbance spectrum, which was corrected for baseline and scattering (eqn (3)). | ||
![[small nu, Greek, tilde]](https://www.rsc.org/images/entities/i_char_e0e1.gif) s), 0–0 energies (
s), 0–0 energies (![[small nu, Greek, tilde]](https://www.rsc.org/images/entities/i_char_e0e1.gif) 00) and emission band full widths at half maximum (FWHM emission), and normalized photoluminescence quantum yields (ΦnormPL) computed by normalization of the respective signals to the signal of compound 3b
00) and emission band full widths at half maximum (FWHM emission), and normalized photoluminescence quantum yields (ΦnormPL) computed by normalization of the respective signals to the signal of compound 3b
| Parameter at condition | Compound 2a | Compound 3a | Compound 2b | Compound 3b | ||||
|---|---|---|---|---|---|---|---|---|
| Powder | Cyclohexane | Powder | Cyclohexane | Powder | Cyclohexane | Powder | Cyclohexane | |
| λ exc,m [nm] | 369 | 363 | 364 | 368 | 407 | 386 | 490 | 395 |
| λ em,m [nm] | 451 | 449 | 504 | 502 | 527 | 521 | 591 | 590 |
Δ![[small nu, Greek, tilde]](https://www.rsc.org/images/entities/i_char_e0e1.gif) s [cm−1] s [cm−1] |
4615 | 5001 | 7605 | 7450 | 4170 | 4122 | 3400 | 3800 |
![[small nu, Greek, tilde]](https://www.rsc.org/images/entities/i_char_e0e1.gif) 00 [cm−1]
00 [cm−1] |
23![[thin space (1/6-em)]](https://www.rsc.org/images/entities/char_2009.gif) 987 987 |
24![[thin space (1/6-em)]](https://www.rsc.org/images/entities/char_2009.gif) 938 938 |
23![[thin space (1/6-em)]](https://www.rsc.org/images/entities/char_2009.gif) 403 403 |
24![[thin space (1/6-em)]](https://www.rsc.org/images/entities/char_2009.gif) 570 570 |
20![[thin space (1/6-em)]](https://www.rsc.org/images/entities/char_2009.gif) 786 786 |
21![[thin space (1/6-em)]](https://www.rsc.org/images/entities/char_2009.gif) 692 692 |
18![[thin space (1/6-em)]](https://www.rsc.org/images/entities/char_2009.gif) 477 477 |
19![[thin space (1/6-em)]](https://www.rsc.org/images/entities/char_2009.gif) 493 493 |
| FWHM emission [cm−1] | 7040 | 5651 | 5937 | 5240 | 5799 | 4687 | 3945 | 3607 |
| Φ normPL (λexc = 375 nm) | — | 0.08 | — | 0.01 | — | 0.02 | — | 1.00 |
| Powder | ||||||||
|---|---|---|---|---|---|---|---|---|
| Parameter at T [K] | Compound 2a | Compound 3a | Compound 2b | Compound 3b | ||||
| 298 | 80 | 298 | 80 | 298 | 80 | 298 | 80 | |
| a See Table S1 (ESI). b See Table S2 (ESI). c See Table S3 (ESI). d See Table S4 (ESI). e See Table S5 (ESI) (for 260 K, within error the emission presumably is the same as in microseconds). f See Table S6 (ESI). g See Table S7 (ESI). h See Table S8 (ESI) (for 260 K, within error the emission presumably is the same as in microseconds). i See Table S9 (ESI). j See Table S10 (ESI). k The detected emission in the millisecond time range (see Table S11, ESI) does not originate from the compound, but from its free ligand (for more details, see chapter 5.2. of the ESI). | ||||||||
| 〈τns〉I [ns] | 1.7 | 5.9 | No em. | No em. | 3.5 | 22.3 | No em. | No em. |
| 〈τμs〉I [μs] | No em. | No em. | No em. | No em. | 1.7 | No em. | 7.6 | 27.4 |
| 〈τms〉I [ms] | 1.2 | 2.2 | 0.4 | 1.3 | No em. | 0.04 | No em. | No em. |
| Solid cyclohexane suspension | ||||||||
| Parameter at T [K] | 260 | 60 | 260 | 60 | 260 | 60 | 260 | 60 |
| 〈τns〉I [ns] | 2.6a | 5.9a | 0.5c | 1.2c | 1.6f | 10.1f | 0.4i | 1.1i |
| 〈τμs〉I [μs] | No em. | No em. | 338.0d | 208.6d | 55.4g | 267.3g | 10.0j | 28.3j |
| 〈τms〉I [ms] | 2.4b | 14.2b | 0.6e | 9.0e | 0.18h | 4.5h | No em.k | No em.k |
Despite a mutual spin–orbit coupling matrix element (SOCME) below 1 cm−1 and an adiabatic S1–T1 energy separation ΔEST,adiab ≈ 0.65 eV, theoretically expected S1–T1 ISC appears to be competitive to prompt fluorescence (Table 3) and gives rise to a weak portion of phosphorescence. Time-resolved measurements of 2a in cyclohexane suspension were performed at four different temperatures (10, 60, 160, and 260 K) (Fig. 3) to verify this kinetic scheme experimentally. The measured intensity-averaged decay time 〈τns〉I of prompt fluorescence in the nanosecond regime agrees well with the estimate for the upper limit of the fluorescence lifetime of state (I), τ(i)PF,lim (Table 3), considering only kF and kISC. Thus, internal conversion (IC) is not a main modulator of the fluorescence properties, which holds true for most of the other compounds with the exception of 2b. From the resulting decay times and amplitudes, intensity-weighted averages, 〈τns〉I, have been generated. Their temperature dependence was approximated by a simple exponential behavior with temperature-independent activation energy EA and rate constants kA and kS [eqn (1)].
 | (1) |
| Parameter | Compound 2a | Compound 3a | Compound 2b | Compound 3b |
|---|---|---|---|---|
a Multiple entries indicate that more than one minimum was found on the S1 or T1 potential energy hypersurface, respectively. Adiabatic excitation energies and photophysical properties at these minima are given in the ESI.
b The 1LC state was optimised with the constrained inter-ligand dihedral angle of the 3LC state. It does not constitute a proper minimum on the S1 potential energy hypersurface. A proper minimum could not be obtained with the PBE0 functional.
c Estimate for the upper limit of the fluorescence lifetime of state (i) with several ISC channels to n triplet states:  based on the computed rate constants in this table. For this estimate, internal conversion is not considered. based on the computed rate constants in this table. For this estimate, internal conversion is not considered.
|
||||
| λ abs (S1) [nm] | 349 (LC/LLCT) | 329 (LLCT/MLCT(dxz)) | 412 (LLCT) | 452 (LLCT/MLCT(dxz)) |
| f abs (S1) | 0.09251 | 0.00916 | 0.03057 | 0.01507 |
| λ em,vert [nm] | 443 (1LC)b | 606 (1LC) | 563 (1LLCT) | 704 (1LLCT) |
| 664 (3LC) | 665 (3LC) | 591 (3LLCT) | 728 (3LLCT) | |
| 615 (3LC) | 707 (1MLCT) | |||
| 748 (3MLCT) | ||||
| k F [s−1] | 4.0 × 10⁷ (1LC) | 1.0 × 10⁷ (1LC) | 6.3 × 10⁶ (1LLCT) | 4.2 × 10⁵ (1LLCT) |
| 2.6 × 10⁶ (1MLCT) | ||||
| k ISC (298 K) [s−1] | 8.0 × 10⁷ (1LC–3LC) | 1.5 × 10⁹ (1LC–3LC) | 2.7 × 10⁶ (1LLCT–3LLCT) | 2.3 × 10⁷ (1LLCT–3LLCT) |
| 8.5 × 10⁵ (1LLCT–3LC) | 9.1 × 10¹⁰ (1LLCT–3MLCT) | |||
| 2.7 × 10¹⁰ (1MLCT–3MLCT) | ||||
| 2.8 × 10¹¹ (1MLCT–3LLCT) | ||||
| τ (i)PF,lim (298 K) [ns]c | 8.3 | 0.7 | 101.5 | 0.010 (1LLCT) |
| 0.004 (1MLCT) | ||||
| k rISC (298 K) [s−1] | — | 5.1 × 10⁻² (3LC–1LC) | 1.0 × 10⁵ (3LLCT–1LLCT) | 3.1 × 10⁵ (3LLCT–1LLCT) |
| 1.8 × 10³ (3LC–1LLCT) | 2.1 × 10⁹ (3MLCT–3LLCT) | |||
| 5.7 × 10⁸ (3MLCT–1MLCT) | ||||
| 2.4 × 10⁸ (3LLCT–1MLCT) | ||||
| k P (77 K) [s−1] | 1.1 × 101 (3LC) | 8.6 × 101 (3LC) | 7.6 × 101 (3LLCT) | 1.4 × 10⁴ (3LLCT) |
| 2.7 × 101 (3LC) | 7.9 × 10³ (3MLCT) | |||
| ΔEST,ad. [eV] | 0.645 (LC) | 0.464 (LC) | 0.046 (LLCT) | 0.058 (LLCT) |
| −0.001 (1LLCT–3LC) | 0.095 (MLCT) | |||
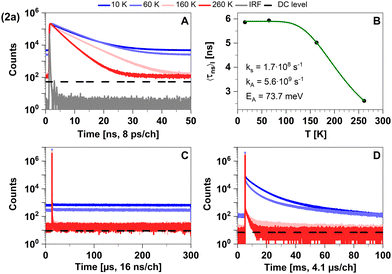 | ||
| Fig. 3 Time-resolved luminescence measurements of compound 2a in solid cyclohexane suspension at temperatures of 10 K, 60 K, 160 K, 260 K, in three distinct time regimes. (A) Decays in nanoseconds. (B) Temperature-dependence of the intensity-weighted prompt fluorescence lifetime 〈τns〉I. The green line represents the fit of the experimental data according to eqn (1). All fit results with their respective errors are shown in Table S12 (ESI†). (C) Microseconds with no decay component. (D) Decays in milliseconds. All luminescence decays exhibit multi-exponential behaviour. The intensity-averaged luminescence lifetimes 〈τ〉I are listed in Table 2, the individual decay times and species fractions are compiled in Tables S1 and S2 (ESI†). The excitation wavelength was at 375 nm, and the detection wavelength 460 nm. The counts that correspond to the dark count (DC) rate of the detector (95 Hz) are marked with a black dashed line. | ||
Possible temperature-dependent processes affecting singlet state lifetimes are internal conversion, intersystem crossing, diffusion-controlled quenching etc., but for the studied samples the assumption of one process was sufficient to fit the data within the experimental noise level (Fig. 3B). Fit results of all compounds in the nanosecond range are given in Table S12 (ESI†).
The computed vertical emission wavelength at the S1 minimum (443 nm) is also in good agreement with the experimental observations (λmax ≈ 450 nm). The vibronic progression frequency (Δ![[small nu, Greek, tilde]](https://www.rsc.org/images/entities/i_char_e0e1.gif) ≈ 1350 cm−1), observable in the emission spectrum of powdered 2a at 77 K (see Fig. S3, ESI†), is compatible with the coupling of the electronic transition to a C–N stretching vibration of the carbene moiety and indicates luminescence from a LC state. Due to the large S1–T1 energy gap of ΔEST ≈ 0.64 eV, delayed fluorescence is not detected in this compound within the regarded temperature range. The observed phosphorescence in the millisecond time regime (see Table S2, ESI†) is in line with the LC nature of the T1 excitation, associated with a low radiative rate constant (calculated value kP ≈ 101 s−1). As expected, phosphorescence becomes efficiently quenched at elevated temperatures (see Fig. 3D). Overall, the appearance of the photoluminescence spectra of the linear lutidine complex 2a can be interpreted as conventional fluorescence and energetically separated weak phosphorescence. The photoluminescence properties of powdered 2a agree very well with those measured in the cyclohexane suspension.
≈ 1350 cm−1), observable in the emission spectrum of powdered 2a at 77 K (see Fig. S3, ESI†), is compatible with the coupling of the electronic transition to a C–N stretching vibration of the carbene moiety and indicates luminescence from a LC state. Due to the large S1–T1 energy gap of ΔEST ≈ 0.64 eV, delayed fluorescence is not detected in this compound within the regarded temperature range. The observed phosphorescence in the millisecond time regime (see Table S2, ESI†) is in line with the LC nature of the T1 excitation, associated with a low radiative rate constant (calculated value kP ≈ 101 s−1). As expected, phosphorescence becomes efficiently quenched at elevated temperatures (see Fig. 3D). Overall, the appearance of the photoluminescence spectra of the linear lutidine complex 2a can be interpreted as conventional fluorescence and energetically separated weak phosphorescence. The photoluminescence properties of powdered 2a agree very well with those measured in the cyclohexane suspension.
The trigonal pyridine complex 3a
Like in complex 2a, the strongly σ-donating carbene ligand is combined with two slightly electron-rich pyridine moieties. This design is also not expected to readily give rise to TADF but rather conventional decoupled fluorescence and phosphorescence. The trigonal coordination pattern should, however, effectively decrease the S1–T1 energy gap ΔEST and also the energies of the lowest excited states compared to the energies in 2a. Previous experimental and quantum chemical studies on cationic NHC Cu(I) pyridine complexes12,13 had shown that association of a second pyridine ligand shifted the relative energies of LC, LLCT and MLCT states such that trapping of the photoexcitation in a long-lived 3LC state was suppressed. This effect enhances the luminescence efficiency of the complexes. In the present case, trigonal complexes are formed as well when the sterically less demanding pyridine instead of 2,6-lutidine is added to the zwitterionic NHC Cu(I) coordination polymer in excess.43The agreement between cyclohexane and powder spectral data is quite good (Fig. 4A). Although the apparent absorbances of 2a and 3a (Fig. 2 and 4), measured in cyclohexane suspensions of microcrystallites, and their excitation spectra slightly differ, their excitation maxima at around 367 nm are similar (Table 1). Remarkably, the peak width of the first excitation band of 3a is much narrower than the one of 2a. Simultaneously, the emission maximum of 3a is significantly red-shifted compared to that of 2a (Fig. 4). Among the four complexes, 3a exhibits the largest apparent Stokes shift of 7605 cm−1.43 Like in 2a, a vibronic progression (Δ![[small nu, Greek, tilde]](https://www.rsc.org/images/entities/i_char_e0e1.gif) ≈ 1200 cm−1) is observable in the emission spectrum of the powder at 77 K43 (Fig. S3, ESI†), which indicates an LC state as the emitting state.
≈ 1200 cm−1) is observable in the emission spectrum of the powder at 77 K43 (Fig. S3, ESI†), which indicates an LC state as the emitting state.
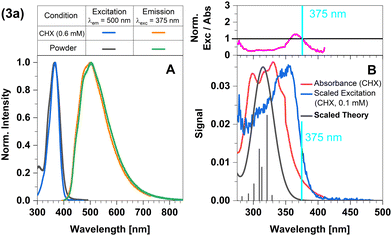 | ||
| Fig. 4 Spectra of compound 3a at 298 K (summary in Table 1). The measurements procedures are described in detail in Experimental and theoretical procedures. (A) Excitation and emission spectra in liquid cyclohexane (CHX) and powder. (B) For a qualitative comparison of the absorption properties, the excitation and the broadened DFT/MRCI spectrum were scaled to the experimental absorbance spectrum, which was corrected for baseline and scattering (eqn (3)). | ||
The predicted theoretical spectrum is clearly blue-shifted compared to the absorption and excitation spectra in cyclohexane (Fig. 4B). The deviations are particularly pronounced around the excitation wavelength of 375 nm. A quantum chemical analysis of the vertical excitation energies and electronic structures of the low-lying singlet and excited states in the FC region43 had shown that the LC(carbene) and MLCT(dz2) dominated states of 3a are blue shifted compared to their 2a congeners whereas the states exhibiting mainly LLCT(NHC-to-pyridine) or MLCT(dxz) character are stabilized by the coordination of a second pyridine ligand. The 1LC state, which was primarily excited in 2a, is hardly accessible in 3a at the excitation wavelength (λex = 375 nm) used to record the emission spectra. The lowest-lying excited singlet state rather possesses mixed 1LLCT and 1MLCT(dxz) character. The 3LC state is blue-shifted as well, but remains the lowest excited triplet state. Admixture of MLCT(dxz) contributions to the T1 wave function causes an untypically large oscillator strength of the T1 ← S0 absorption. Due to the strong SOC between the Cu dxz and dz2 orbitals,14 intensity is mainly borrowed from the spin-allowed S3 ← S0 transition exhibiting MLCT(dz2) character (for details, see Table S32, ESI†). Therefore, theory suggests that the long wavelength tail of the excitation spectrum stems from the spin-forbidden T1 absorption. This interpretation is in line with the observation that the origins of the excitation and phosphorescence emission spectra overlap (Fig. 4). According to the calculations, the emission of 3a is thus expected to have a dominant character of phosphorescence. Another intriguing experimental observation is the large Stokes shift of the emission of 3a (Fig. 4). Inspection of the energy schemes (Fig. S165, ESI†) reveals that the nuclear arrangement at the relaxed T1 geometry of 3a is very unfavourable for the S0 state. The observed large Stokes shift is thus a consequence of the simultaneous lowering of the T1 and steep rise of the S0 state potential energies. The normalized excitation/absorbance ratio at shorter wavelengths indicates the presence of additional non-luminescent species in suspensions (Fig. 4).
Quickly decaying fluorescence was observed in our time-resolved spectroscopy experiments of 3a in solid cyclohexane suspension alongside phosphorescence in the late microsecond and early millisecond time regime (Fig. 5).
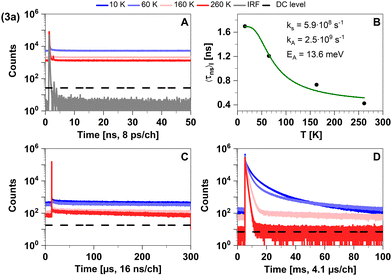 | ||
| Fig. 5 Time-resolved luminescence measurements of compound 3a in solid cyclohexane suspension at temperatures of 10 K, 60 K, 160 K, 260 K, in three distinct time regimes. (A) Decays in nanoseconds. (B). Temperature-dependence of the intensity-weighted prompt fluorescence lifetime 〈τns〉I. The green line represents the fit of the experimental data according to eqn (1). All fit results with their respective errors are shown in Table S12 (ESI†). (C) Decays in microseconds. (D) Decays in milliseconds. All luminescence decays exhibit multi-exponential behaviour. The intensity-averaged luminescence lifetimes 〈τ〉I are listed in Table 2, the individual decay times and species fractions are compiled in Tables S3–S5 (ESI†). The excitation wavelength was at 375 nm, and the detection wavelength 495 nm. The counts that correspond to the dark count (DC) rate of the detector (95 Hz) are marked with a black dashed line. | ||
This characterization agrees well with the time-resolved data in Tables 2 and 3. We attribute the apparent sub-nanosecond decay of the S1 population to a competition between fluorescence and efficient ISC due to MLCT contributions to the singlet and triplet wavefunctions. This agrees with the estimated upper limit of the fluorescence lifetime τ(i)PF,lim (298 K) = 0.7 ns (see Table 3). The MLCT admixture is reduced upon geometry optimization of the T1 state, resulting in a relatively low radiative rate constant (calculated value kP ≈ 102 s−1). This is compatible with measured phosphorescence decay times in the 100 μs–10 ms regime at ΦPL ≈ 2%.43 Like in 2a, the phosphorescence is efficiently thermally quenched by increasing temperature from 10 K to 260 K. Thus, the trigonally coordinated complex 3a is dominated by phosphorescence from a 3LC state in the regarded temperature range based on an efficient ISC from the excited S1 state.
The linear formyl lutidine complex 2b
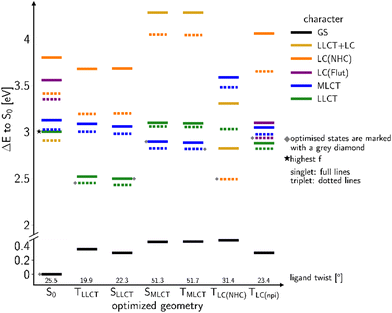
In order to favour TADF in the regarded Cu(I) complexes, electron-withdrawing lutidine or pyridine ligands are necessary that stabilize LLCT-type instead of LC states. For this purpose, we now consider a modified version of 2a with an electron-withdrawing formyl substituent in para position of the lutidine ligand that gives rise to the linear Cu(I) complex 2b. Moreover, the steric bulk of the methyl groups in ortho position limits the torsional flexibility in the formyl lutidine complex 2b. Considering the isolated complex, we only found one stable conformer with a ligand twist angle of approx. 26° in the electronic ground state in the calculations, compared to about 10° in a crystalline environment as determined by X-ray diffraction.43 According to our quantum chemical studies, the ligand twist angles at the excited-state minima range from about 20° for the lowest LLCT(NHC-to-formyl lutidine) states over 23° in the 3LC(formyl lutidine nπ*) and 31° in the LC (NHC) to about 51° in the MLCT(dz2-to-formyl lutidine) states. As intended, the S–T energy gaps of the LLCT and MLCT states are much smaller than for the LC(NHC) state (Fig. 6).Excitation with a wavelength of 375 nm (approx. 3.3 eV) addresses a mixture of LLCT and MLCT states which are energetically close at the ground-state geometry (Fig. 6). The 1LLCT state exhibits higher absorbance than 1MLCT and is therefore preferentially populated. The 1LC(NHC) state lies energetically much higher in the FC region and cannot be reached with the chosen excitation wavelength. The LLCT, LC (NHC) and MLCT(dz2) states of 2b form minima on the S1 or T1 potential energy surfaces, respectively (Fig. 6). The barrier separating the MLCT minima from the lower-lying LLCT minima is estimated to be 12 meV (see Fig. S164, ESI†) and hence easily overcome. Direct emission from the MLCT minima is therefore not likely to occur in this complex.
Quantum chemistry predicts larger displacements of the nuclear coordinates between the minimum structures of the 3LC and 3LLCT states, which are adiabatically nearly degenerate (Fig. 6). The 3LC(NHC) state is long-lived as the equilibration with the other triplet potential wells is kinetically hindered by high reorganization energies. Their populations are interconvertible at room temperature, but a small portion appears to get trapped in the 3LC potential well at lower temperatures and decays via3LC phosphorescence. These findings match the experimentally recorded low ΦPL ≈ 1%.43
The broad and structureless emission band (Fig. 7A) matches the predicted LLCT character of the emissive state. The absorption spectrum agrees well with that from theory (Fig. 7B). The normalized excitation/absorbance ratio at shorter wavelengths indicates small contributions of additional non-luminescent species in suspensions (Fig. 7 and 4).
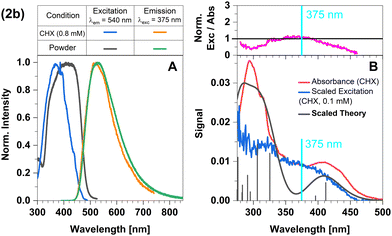 | ||
| Fig. 7 Spectra of compound 2b at 298 K (summary in Table 1). The measurements procedures are described in detail in Experimental and theoretical procedures. (A) Excitation and emission spectra in liquid cyclohexane (CHX) and powder. (B) For a qualitative comparison of the absorption properties, the excitation and the broadened DFT/MRCI spectrum were scaled to the experimental absorbance spectrum, which was corrected for baseline and scattering (eqn (3)). | ||
Vibronic coupling between the MLCT and LLCT states is expected to enhance the ISC and rISC between the 1LLCT and 3LLCT states. The small ΔEST value of the LLCT states and the admixture of small amounts of MLCT(dxz) character (Fig. S116 and S124, ESI†) suggest that thermally activated up-conversion to the corresponding singlet potential well is possible. Thus, we expect a multiexponential luminescence decay.
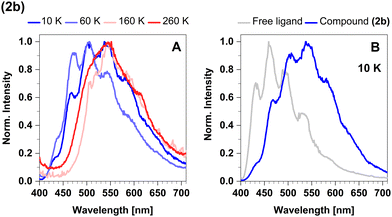
In the temperature range from 270 K to 100 K, the mean emission position red-shifts as phosphorescence takes over. However, as the temperature decreases below 100 K, we observe the opposite trend and the emission maximum shifts to shorter wavelengths (Fig. 8A). This probably occurs due to dissociation of small portions of the sample and consequent emission of the free ligand (4-formyl-2,6-lutidine). The spectrum of the free ligand was compared with the spectrum of the sample at 10 K (Fig. 8B).
In time-resolved measurements within the nanosecond time regime, we observe a significant increase of the offset fraction upon cooling. This observation implies slowly decaying emissive states at all temperatures (Fig. 9A). The temperature dependence of the slow components does not follow a simple single barrier model anymore as implied by eqn (1). To include the predicted fast equilibration of the LLCT and MLCT populations, we fitted the temperature-dependent behaviour of the delayed luminescence decay times to the following equation assuming Boltzmann thermalization among the involved states:
 | (2) |
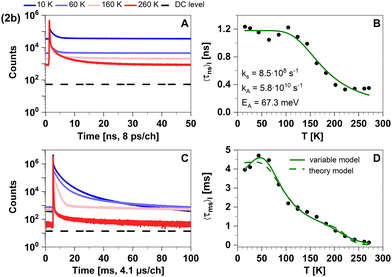 | ||
| Fig. 9 Time-resolved luminescence measurements of compound 2b in solid cyclohexane suspension at selected temperatures of 10 K, 60 K, 160 K, 260 K, in two distinct time regimes. Related decay components recorded in the temperature range from 10 K to 270 K are provided in Fig. S4 (ESI†). The excitation wavelength was 375 nm, and the detection emission wavelength 540 nm. (A) Decay curves in nanoseconds. (B) Temperature dependence of the intensity-weighted prompt fluorescence lifetime 〈τns〉I. The green line represents the fit of the experimental data according to eqn (1). All fit results with their respective errors are shown in Table S12 (ESI†). (C) Decays in milliseconds. (D) Temperature-dependence of the intensity-weighted luminescence lifetime 〈τms〉I with all parameters compiled in Tables S13 and S14 (ESI†). The green lines represent least-squares fits of eqn (2) to the experimental data. Solid line (variable model, Table S13, ESI†): E1 and E4 are free parameters while E2 and E3 are fixed to theoretically computed zero-point vibrational energy corrected adiabatic values of 28.5 meV and 52.2 meV, respectively. Dashed line (theory model, Table S14, ESI†): all energies are fixed to theoretically computed zero-point vibrational energy corrected adiabatic values (Table S15, ESI†). The intensity-averaged luminescence lifetimes 〈τμs〉I are listed in Table 2, the individual decay times and species fractions are compiled in Tables S6–S8 (ESI†). The counts that correspond to the dark count (DC) rate of the detector (95 Hz) are marked with a black dashed line. | ||
To further investigate the TADF properties, we measured time-resolved emission spectra (TRES) at 270 K, 220 K, 180 K, and 10 K (Fig. 10A–D). At the highest temperature (270 K), we observed that the spectra in the nanosecond and microsecond time regimes strongly overlap which can be attributed to the simultaneous presence of TADF and phosphorescence. As 2b is cooled down, the spectral overlap decreases and two separate emission bands can be resolved. The emission in the nanosecond time regime exhibits a blue shift from 535 nm to 520 nm, while the emission in the microsecond time regime shifts towards longer wavelengths and even overlaps with the emission in milliseconds. Furthermore, the emission in both the microsecond and millisecond time regimes feature vibronic fine structure at low temperatures, which is typical for LC-related emission. In contrast, the emission band in the ns time range is broad and barely shows any fine structure implying emission from CT-type states. This observation suggests that phosphorescence from a 3LC state is involved in the microsecond time range and becomes the dominant process at lower temperatures. Luminescence within the millisecond time range displays intricate multi-exponential characteristics (Fig. S8, ESI†). Upon careful spectral analysis, we deduced that the predominant source of luminescence arises from compound 2b, with a minor contribution originating from leached ligand (Fig. S10, ESI†).
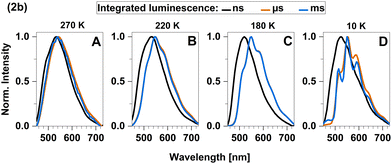 | ||
| Fig. 10 Time-resolved emission spectra (TRES) of 2b in solid cyclohexane suspension obtained at four different temperatures: (A) 270 K, (B) 220 K, (C) 180 K and (D) 10 K. | ||
In the temperature range from 100 K to 270 K, we observed a non-linear dependence of the logarithmic rate constant on the reciprocal temperature, which is indicative for limited thermal coupling in that temperature range. This implies that the rISC rate of 2b cannot compete with the decay rate of T1 in that temperature range yet and thus, must be at most of similar order of magnitude of kP. It also matches the fact that phosphorescence can be experimentally distinguished from fluorescence at low temperatures while TADF only becomes relevant at temperatures above 220 K. Overall, TADF in 2b is based on ISC and rISC between 1LLCT and 3LLCT states that admix with MLCT states. Additionally, the quasi-degeneracy between the 3LLCT and a 3LC state (Fig. 6) leads to the observation of phosphorescence with vibronic fine structure at low temperatures (T < 200 K, Fig. 10).
The trigonal formyl pyridine complex 3b
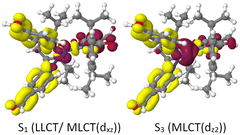
Replacement of the pyridine ligands in 3a with the electron-withdrawing 4-formylpyridine results in complex 3b. Similarly to 2b, this leads to an energetic stabilization of the LLCT and MLCT(dz2) states, with the easier accessibility of MLCT(dxz) states caused by the energetic increase of the corresponding ligand-field orbital due to the trigonal coordination. Consequently, TADF properties should also be expected in this case. In the FC region, the lowest excited singlet and triplet states emerge from an LLCT excitation with large contributions from an MLCT(dxz) configuration as may be clearly seen from the difference density of the S1 state plotted in Fig. 11 (left). The singlet and triplet MLCT(dz2) states (Fig. 11, right) only have marginally higher excitation energies at the ground state geometry. The S0 → S1 and S0 → S3 transitions both contribute to the excitation spectrum and should result in emission. With vertical singlet–triplet energy gaps of ΔEST ≈ 807 cm−1 (0.1 eV), S1 and S3 appear predestined for TADF, provided that their electronic structures and energy splittings do not change dramatically upon geometry relaxation. An overview over the energetic positions of the electronic states at various minimum geometries is provided in Fig. 12.The absorption maximum predicted by theory of compound 3b is at 405 nm and is related to the S3 ← S0 transition (Fig. 12). The respective S1 ← S0 transition is only observable as a shoulder (excitation spectrum) or weak band (absorbance spectrum) (Fig. 13B). However, the measured absorption and excitation spectra in cyclohexane are blue-shifted compared to the theoretically predicted spectrum (Fig. 13B). The normalized excitation/absorbance ratio at shorter wavelengths indicates the presence of additional non-luminescent species in suspensions (Fig. 13).
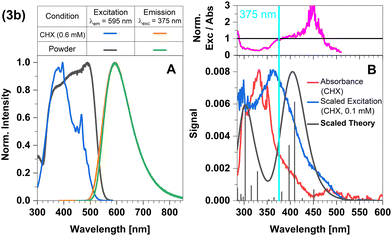 | ||
| Fig. 13 Spectra of compound 3b at 298 K (summary in Table 1). The measurements procedures are described in detail in Experimental and theoretical procedures. (A) Excitation and emission spectra in liquid cyclohexane (CHX) and powder. (B) For a qualitative comparison of the absorption properties, the excitation and the broadened DFT/MRCI spectrum were scaled to the experimental absorbance spectrum, which was corrected for baseline and scattering (eqn (3)). | ||
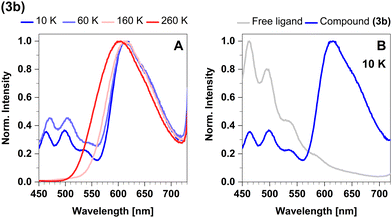
The emission spectra in cyclohexane and powder overlap completely (Fig. 13A). The maximum in the steady-state emission spectrum shows a blue-shift from 613 nm at 100 K to 599 nm at 270 K (Fig. 14A), which allows to estimate a value of ΔEST = 381 cm−1 (47 meV). At temperatures below 100 K, the maximum does not show any additional shift, but an additional band is observed. This band is assigned to luminescence of leached free ligand 4-formyl pyridine (Fig. 14B), which was dissociated from the surface of the microcrystals before freezing. Another confirmation of this interpretation is the absence of this band in the respective solid-state measurements, indicating that this process only occurs with measurable significance in suspension. Concerning the chemical stability of this compound, this is an expected observation, since complex 3b proved to be the least stable of the four investigated compounds.43
The energetic proximity of MLCT(dz2) and MLCT(dxz) states promises enhanced SOC. According to El-Sayed's rule,44 the rate of ISC is relatively large if the non-radiative transition involves a change of orbital type. Although this rule was originally formulated for heterocyclic organic compounds, it can be extended to include transition metal complexes as well.14 This extended version states that fast ISC is expected if the states are singly excited with respect to each other, the local orbital angular momentum l is conserved and the magnetic quantum number ml changes by 0, ±1 unless ml = 0 where Δml = ±1 is required. In the present context of 3b, this means that strong SOC is expected between MLCT(dz2) and MLCT(dxz) or MLCT(dyz) configurations with a common ligand acceptor orbital. The large calculated rate constants for the ISC and rISC transitions between these pairs of states (Fig. 15) suggest that their populations fully equilibrate at room temperature at higher rates than radiative decay, which, in turn, appears to be the rate-determining step (microseconds) in this complex. We therefore mainly expect delayed fluorescence under these conditions. Indeed, time-resolved spectroscopy measurements show that the prompt fluorescence of 3b decays at the sub-nanosecond time scale (Fig. 16A), which agrees well with the theoretical predictions. Presumably, a mixture of TADF and phosphorescence is observed in the microsecond time range. This assumption is confirmed by analysis of the temperature dependence of the luminescence decay times (Fig. 16D). Given the El-Sayed allowed ISC process in 3b, there is also an expectedly strong spin admixture between the 1LLCT and 3MLCT states, which should lead to radiative decay times in the order of microseconds. This qualitative line of argument proves true considering the values of the computed phosphorescence rate constants of the 3LLCT and 3MLCT states, which are both of the order of kP ≈ 104 s−1 (Table 3).
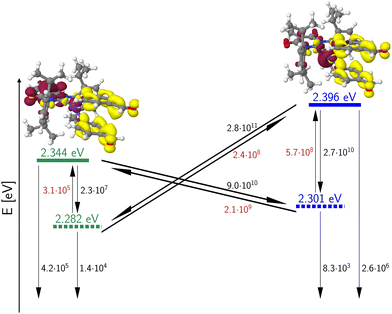 | ||
| Fig. 15 Calculated 0–0 energies of the LLCT/MLCT(dxz) (green) and MLCT(dz2) (blue) states of 3b. Singlet states are symbolized by solid line, triplet states by dashed lines. ISC and rISC rate constants [s−1] were determined in Condon approximation for a temperature of 298 K. Rate constants of thermally activated processes are given in red. The fluorescence and phosphorescence rate constants [s−1] were computed according to the Einstein formula and do not include FC factors. The insets depict difference densities (isovalues ±0.002) of the 1LLCT (left) and 1MLCT(dz2) states at their respective minimum geometries. For colour codes, see Fig. 11. | ||
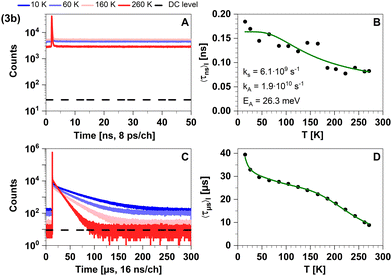 | ||
| Fig. 16 Time-resolved luminescence measurements of compound 3b in solid cyclohexane suspension at selected temperatures of 10 K, 60 K, 160 K, 260 K, in two distinct time regimes. Related decay components recorded in the temperature range from 10 K to 270 K are provided in Fig. S5 and S6 (ESI†). The excitation wavelength was at 375 nm, and the detection wavelength 595 nm. (A) Decay curves in nanoseconds. (B) Temperature-dependence of the intensity-weighted prompt fluorescence lifetime 〈τns〉I. The green line represents the fit of the experimental data according to eqn (1). All fit results with their respective errors are shown in Table S12 (ESI†). (C) Decays in microseconds. (D) Temperature-dependence of the intensity-weighted luminescence lifetime 〈τμs〉I with all parameters compiled in Table S16 (ESI†). The green line represents the fit of eqn (2) to the experimental data: E1 to E4 were fixed to the theoretically computed zero-point vibrational energy corrected adiabatic values and k0 to k4 were optimized. The intensity-averaged luminescence lifetimes 〈τμs〉I are listed in Table 2, the individual decay times and species fractions are compiled in Tables S9–S11 (ESI†). The counts that correspond to the dark count (DC) rate of the detector (95 Hz) are marked with a black dashed line. | ||
This expected time scale is experimentally confirmed. In the microsecond time regime, the decays are characterized by a multi-exponential fit function in the entire temperature range from 10 K to 270 K. The intensity-averaged decay times increases from 8.87 μs at 270 K to almost 40 μs at 10 K (Fig. 16D and Table S11, ESI†). We monitor three characteristic temperature regions: between 270–200 K (Fig. S6A, ESI†), the emission amplitude of delayed emission decreases, which is a characteristic observation for TADF. Between 200–100 K (Fig. S6B, ESI†), this amplitude remains constant. However, upon further cooling (between 100–10 K, Fig. S6C, ESI†), the amplitude rises again, indicating the presence of an alternative process distinct from TADF. The temperature dependence of the corresponding amplitudes and lifetimes is shown in Fig. S7 (ESI†). This observed behaviour is anticipated because the thermal energy is not sufficient to overcome the computed energy gap of ΔEST = 62 meV. This value is close to the one derived from the spectral shift observed in the steady-state data (47 meV). Additionally, the observed spectral red-shift in the steady-state emission spectra upon cooling provides further evidence of phosphorescence becoming the dominant emission source at lower temperatures. An important experimental hint for this tightly coupled ensemble of states (red box in Fig. 17) is the fit of the microsecond time domain temperature-dependent decay times to eqn (2). Using the theoretically predicted energy gaps between the relevant 1LLCT, 3LLCT, 1MLCT, and 3MLCT states of 3b and optimizing the five corresponding rate constants, the agreement between theory and experiment is striking. Notably, the fitted rate constants are close to the theoretically predicted values (Table S16, ESI†).
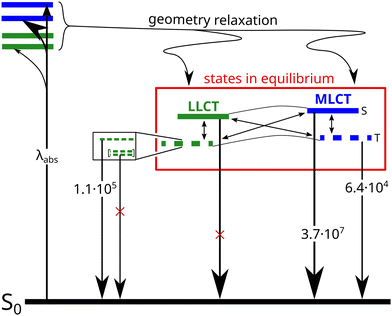 | ||
| Fig. 17 Kinetic scheme of the photo excitation decay of 3b. The rate constants of the radiative transitions were obtained by fitting the temperature-dependent decay times to eqn (2) using fixed theoretical energy separations. Solid horizontal lines indicate singlet states, dashed lines triplet states. The zero-field splittings of the triplet sublevels are not drawn to scale. | ||
Due to the high MLCT contributions to their electronic wavefunctions, the T1 states exhibit large SOCMEs with several excited singlet states with high oscillator strengths from which the spin-forbidden transitions borrow intensity. The calculated spin-component averaged phosphorescence rate constants are of the order of kP ≈ 104 s−1. Considering that only a small portion of the excited molecules radiatively decays (ΦPL = 0.13 was measured in the solid state at room temperature,43), these kinetic constants are consistent with the measured decay times of roughly 10–40 μs (Table S10, ESI†) for the slow component. All-in-all, complex 3b appears to be a promising starting point to synthesize derivatives with a more stable and rigid structure for harvesting singlet as well as triplet excitons in an OLED. In the solid state, it emits orange luminescence with a absolute photoluminescence quantum yield of ΦPL = 0.13, which is approximately 3 to 10 times higher than for the other three studied complexes. In suspensions, we could measure only normalized photoluminescence quantum yields ΦnormPL (see Table 1), which were computed by normalization of the respective signals to the signal of compound 3b. ΦnormPL allows us to quantify the photoluminescence yield of 3b with respect to the other complexes. In suspensions, the increase of the photoluminescence yield for 3b is more pronounced (12 to 100 times, Table 1). It should be noted, however, that 3b is chemically labile in solution unless 4-formylpyridine is added in excess. Thus, decomposition products might have slightly affected the determination of the normalized photoluminescence quantum yields in Table 1. Obviously, the formyl substituent in para position does not only increase the π-acceptor strength, it also reduces the σ-donor strength of the pyridine ligand. Thus, work is underway to synthesize trigonal complexes with two π-accepting ligands tethered together, which should enhance their chemical stability.
Summary and conclusions
The aim of this work was the design of electrically neutral linear or trigonal TADF emitting Cu(I) complexes with a strongly σ-donating anionic carbene ligand and one or two electron accepting ligands to enable thin-film processing of the emitter in OLED technologies. For this purpose, we have combined temperature-dependent time-resolved photoluminescence spectroscopy with DFT/MRCI calculations to shed light on the expected optical performance of a number of selected neutral Cu(I) complexes with pyridine-based acceptor ligands. They are easily accessible in large scales from a coordination polymer intermediate in a straightforward synthetic approach. All investigated complexes show luminescence in the visible range. A clear design pattern towards TADF properties can be extracted from our combined study. If the σ-donating carbene is combined with electron-rich pyridine-derived ligands, carbene ligand-centered states form the first excited singlet and triplet states with a substantial S–T energy gap, which rather leads to the observation of dominantly decoupled prompt fluorescence and phosphorescence (compounds 2a and 3a). In contrast, electron-poorer pyridine ligands in such a Cu(I) complex lead to an energetic stabilization of LLCT and MLCT states. The stabilization poses a leverage towards TADF (Fig. 18B and D) as observed in compounds 2b and 3b. In general, trigonal coordination strongly favours ISC and red shifts the emission band compared to the linearly coordinated analogue. With electron-poor pyridine ligands, trigonal coordination also greatly enhances the photoluminescence quantum yield but in the same instance, weakens the Cu–ligand bonds, which reduces the kinetic stability of such complexes in solution.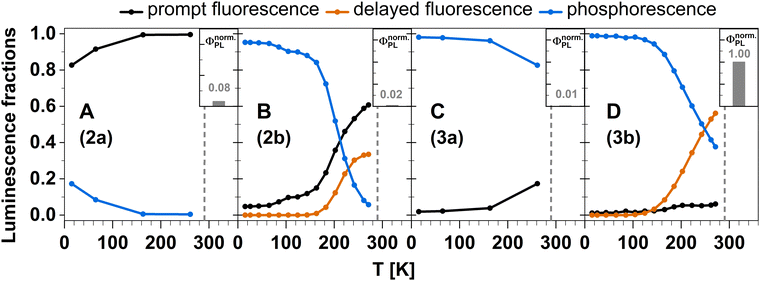 | ||
| Fig. 18 Temperature-dependent fractions of prompt (black), delayed (orange) fluorescence, and phosphorescence (blue) in the investigated Cu(I) complexes derived by integration of the nanosecond range decay curves and, for 2b and 3b, the fitting results of the delayed luminescence according to eqn (2). The insets depict the relative photoluminescence quantum yields of the Cu(I) carbene complexes normalized to the brightest complex 3b. For details, see Experimental and theoretical procedures. | ||
This sets a general limitation to the photoluminescence quantum yields. One strategy to circumvent this fundamental dilemma is to tether two π-accepting ligands together leading to a trigonal complex with enhanced chemical stability due to the chelate effect. Experiments in that direction are currently pursued in our laboratory. Overall, the present studies offer a detailed overview of the possibilities of targeted molecular design to selectively address desirable optical properties in organometallic compounds.
Experimental and theoretical procedures
Materials
Spectroscopy
 | (3) |
Due to partial dissociation of the ligands, the spectra of the suspensions contained, to a different degree, contributions by absorption of free ligand. In order to enable proper comparison with excitation spectra this contribution was compensated by subtraction of independently measured corresponding (baseline corrected) absorbance spectra of free ligand in cyclohexane. The respective spectral contribution of free ligand was estimated around 250 nm, where the complexes showed only small absorption. This correction was required for the trigonal complexes 3a (pyridine) and 3b (formyl pyridine).
For comparison to experiment in Fig. 2, 4, 7 and 13, DFT/MRCI line spectra were broadened with a Gaussian of 0.175 meV FWHM. Both the excitation spectrum in cyclohexane and the broadened DFT/MRCI line spectra are scaled to the absorbance spectrum for qualitative comparison. The ratio of excitation and absorbance is normalized at 375 nm.
Normalized photoluminescence quantum yields ΦnormPL of the complexes were determined in liquid cyclohexane suspensions at 298 K. Absorbance was measured on a Cary 4000 UV-Vis spectrophotometer and corrected as described above. The corrected luminescence spectra were recorded on a Horiba Fluorolog FL3-22 spectrofluorometer at an excitation wavelength of 375 nm. The photoluminescence quantum yields were determined as the ratio between the fluorescence integral and the corrected absorbance at 375 nm. Subsequently, the normalized photoluminescence quantum yields were computed by normalization of the respective photoluminescence quantum yields to that of compound 3b.
The averaged lifetimes thus derived for compounds 2b and 3b each in general consisted of one dominating component, justifying the assumption of approximate thermal equilibrium populations of the corresponding emissive states that were included in the averaging. Thermal equilibrium between multiple emissive states allows analysis of its temperature dependent luminescence lifetimes with well-established models,47,48 assuming that the individual emission rate constants ki are temperature independent. The resulting overall decay time under this condition is the inverse weighted sum of the individual emission rates of the contributing states [eqn (4)]:
 | (4) |
Adapted to our systems, we used a model for the excited states consisting of two low-lying triplets with two energetically close singlets. To account for the experimentally observed changes in τ at very low temperatures (indicating correspondingly small involved activation energies), for the lowest triplet state zero-field splitting was included [eqn (2)]. Fits were performed using OriginPro 8.6 (OriginLab Corporation, USA).
Prompt fluorescence as detected on the nanosecond (ns) time scale was analysed by a multiexponential model (up to 4 exponents) and a variable offset. The IRF was measured using scattered light from a Ludox® solution. To extract lifetime parameters, in-house Python scripts (ChiSurf49) were employed. From the resulting decay times and amplitudes photon-weighted averages have been generated. Their temperature dependence was approximated by a simple exponential process [eqn (1)].
In the context of the model for the millisecond and microsecond decays as discussed above, detection of nanosecond decays can only be possible when thermal equilibration is not fully established on that time scale. For 3b the measured singlet decay time (0.3–2.7 ns) is at least 10 times (compared to the fitted rate from the model above) or 100 times (compared to theory output) faster and therefore should not significantly affect the thermal equilibrium.
 | (5) |
Theory
Author contributions
Conceptualization: C. M. M. and M. S.; methodology: J. G., D. S., P. S., S. F., R. K., M. S.; validation: J. G., D. S., P. S.; formal analysis: J. G., D. S., P. S., S. F., R. K., M. S.; investigation: J. G., D. S., P. S. M. S; data curation: J. G., D. S., P. S., S. F., R. K.; writing – original draft preparation: J. G., D. S., P. S., C. M. M., M. S.; writing – review and editing: J. G., D. S., P. S., R. K., C. G., C. A. M. S., C. M. M., M. S.; visualization: J. G., D. S., P. S.; project administration: C. G., C. A. M. S., C. M. M., M. S.; funding acquisition: C. G., C. A. M. S., C. M. M., M. S.Data availability
The data supporting this article have been included as part of the ESI. Source data generated in this study, which are presented in the main text and ESI, are provided as Source Data Files via the Zenodo repository under the accession code https://doi.org/10.5281/zenodo.11917519.Conflicts of interest
There are no conflicts to declare.Acknowledgements
This work has been funded by the Deutsche Forschungsgemeinschaft (DFG, German Research Foundation), project numbers 396890929 (GRK 2482) and MA 1051/21-1. M. S. is grateful to a materials cost allowance of the Fonds der Chemischen Industrie e.V. and financial support by the “Young College” of the North Rhine-Westphalian Academy of Sciences, Humanities and the Arts. C. S. is grateful to the Strategic Research Fund (SFF) of the HHU Düsseldorf for financial support to acquire a ColdEdge cryostat.Notes and references
- C. W. Tang and S. A. Vanslyke, Appl. Phys. Lett., 1987, 51, 913–915 CrossRef CAS.
- M. A. Baldo, D. F. O’Brien, Y. You, A. Shoustikov, S. Sibley, M. E. Thompson and S. R. Forrest, Nature, 1998, 395, 151–154 CrossRef CAS.
- H. Uoyama, K. Goushi, K. Shizu, H. Nomura and C. Adachi, Nature, 2012, 492, 234–238 CrossRef CAS PubMed.
- H. Nakanotani, T. Higuchi, T. Furukawa, K. Masui, K. Morimoto, M. Numata, H. Tanaka, Y. Sagara, T. Yasuda and C. Adachi, Nat. Commun., 2014, 5, 4016 CrossRef CAS PubMed.
- G. Hong, X. Gan, C. Leonhardt, Z. Zhang, J. Seibert, J. M. Busch and S. Bräse, Adv. Mater., 2021, 33, 2005630 CrossRef CAS PubMed.
- C. Adachi and A. S. D. Sandanayaka, CCS Chem., 2020, 2, 1203–1216 CrossRef CAS.
- Y. Zhang, J. Lee and S. R. Forrest, Nat. Commun., 2014, 5, 5008 CrossRef CAS PubMed.
- R. Czerwieniec, M. J. Leitl, H. H. H. Homeier and H. Yersin, Coord. Chem. Rev., 2016, 325, 2–28 CrossRef CAS.
- E. Cariati, E. Lucenti, C. Botta, U. Giovanella, D. Marinotto and S. Righetto, Coord. Chem. Rev., 2016, 306, 566–614 CrossRef CAS.
- A. Steffen and B. Hupp, in Comprehensive Coordination Chemistry III, ed. E. C. Constable, G. Parkin and L. J. Que, Elsevier, 2021, pp. 466–502 Search PubMed.
- P. S. Wagenknecht and P. C. Ford, Coord. Chem. Rev., 2011, 255, 591–616 CrossRef CAS.
- A. Liske, L. Wallbaum, T. Hölzel, J. Föller, M. Gernert, B. Hupp, C. Ganter, C. M. Marian and A. Steffen, Inorg. Chem., 2019, 58, 5433–5445 CrossRef CAS PubMed.
- J. Föller, C. Ganter, A. Steffen and C. M. Marian, Inorg. Chem., 2019, 58, 5446–5456 CrossRef PubMed.
- C. M. Marian, Annu. Rev. Phys. Chem., 2021, 72, 617–640 CrossRef CAS PubMed.
- J. P. Zobel, A. M. Wernbacher and L. González, Angew. Chem., Int. Ed., 2023, 62, e202217620 CrossRef CAS PubMed.
- Z. A. Siddique, Y. Yamamoto, T. Ohno and K. Nozaki, Inorg. Chem., 2003, 42, 6366–6378 CrossRef CAS PubMed.
- L. Bergmann, G. J. Hedley, T. Baumann, S. Bräse and I. D. W. Samuel, Sci. Adv., 2016, 2, e1500889 CrossRef PubMed.
- M. Grupe, F. Bäppler, M. Theiß, J. M. Busch, F. Dietrich, D. Volz, M. Gerhards, S. Bräse and R. Diller, Phys. Chem. Chem. Phys., 2020, 22, 14187–14200 RSC.
- N. Lüdtke, J. Föller and C. M. Marian, Phys. Chem. Chem. Phys., 2020, 22, 23530–23544 RSC.
- J. Föller, M. Kleinschmidt and C. M. Marian, Inorg. Chem., 2016, 55, 7508–7516 CrossRef PubMed.
- R. Hamze, S. Shi, S. C. Kapper, D. S. M. Ravinson, L. Estergreen, M. C. Jung, A. C. Tadle, R. Haiges, P. I. Djurovich, J. L. Peltier, R. Jazzar, G. Bertrand, S. E. Bradforth and M. E. Thompson, J. Am. Chem. Soc., 2019, 141, 8616–8626 CrossRef CAS PubMed.
- R. Hamze, J. L. Peltier, D. Sylvinson, M. Jung, J. Cardenas, R. Haiges, M. Soleilhavoup, R. Jazzar, P. I. Djurovich, G. Bertrand and M. E. Thompson, Science, 2019, 363(6427), 601–606 CrossRef CAS PubMed.
- T. Y. Li, D. S. Muthiah Ravinson, R. Haiges, P. I. Djurovich and M. E. Thompson, J. Am. Chem. Soc., 2020, 142, 6158–6172 CrossRef PubMed.
- M. J. Leitl, V. A. Krylova, P. I. Djurovich, M. E. Thompson and H. Yersin, J. Am. Chem. Soc., 2014, 136, 16032–16038 CrossRef CAS PubMed.
- A. S. Romanov, D. Di, L. Yang, J. Fernandez-Cestau, C. R. Becker, C. E. James, B. Zhu, M. Linnolahti, D. Credgington and M. Bochmann, Chem. Commun., 2016, 52, 6379–6382 RSC.
- R. Hamze, R. Jazzar, M. Soleilhavoup, P. I. Djurovich, G. Bertrand and M. E. Thompson, Chem. Commun., 2017, 53, 9008–9011 RSC.
- D. Di, A. S. Romanov, L. Yang, J. M. Richter, J. P. H. Rivett, S. Jones, T. H. Thomas, M. A. Jalebi, R. H. Friend, M. Linnolahti, M. Bochmann and D. Credgington, Science, 2017, 356(6334), 159–163 CrossRef CAS PubMed.
- M. Gernert, L. Balles-Wolf, F. Kerner, U. Müller, A. Schmiedel, M. Holzapfel, C. M. Marian, J. Pflaum, C. Lambert and A. Steffen, J. Am. Chem. Soc., 2020, 142, 8897–8909 CrossRef CAS PubMed.
- R. Hamze, M. Idris, M. R. Daniel Sylvinson, M. Chul Jung, R. Haiges, P. I. Djurovich and M. E. Thompson, Front. Chem., 2020, 8, 401 CrossRef CAS PubMed.
- S. Shi, M. C. Jung, C. Coburn, A. Tadle, D. M. R. Sylvinson, P. I. Djurovich, S. R. Forrest and M. E. Thompson, J. Am. Chem. Soc., 2019, 141, 3576–3588 CrossRef CAS PubMed.
- J. Li, L. Wang, Z. Zhao, X. Li, X. Yu, P. Huo, Q. Jin, Z. Liu, Z. Bian and C. Huang, Angew. Chem., 2020, 132, 8287–8294 CrossRef.
- A. Ruduss, B. Turovska, S. Belyakov, K. A. Stucere, A. Vembris and K. Traskovskis, Inorg. Chem., 2022, 61, 2174–2185 CrossRef CAS PubMed.
- J. Föller and C. M. Marian, J. Phys. Chem. Lett., 2017, 8, 5643–5647 CrossRef PubMed.
- S. Thompson, J. Eng and T. J. Penfold, J. Chem. Phys., 2018, 149, 014304 CrossRef CAS PubMed.
- C. R. Hall, A. S. Romanov, M. Bochmann and S. R. Meech, J. Phys. Chem. Lett., 2018, 9, 5873–5876 CrossRef CAS PubMed.
- J. Eng, S. Thompson, H. Goodwin, D. Credgington and T. J. Penfold, Phys. Chem. Chem. Phys., 2020, 22, 4659–4667 RSC.
- X. F. Song, Z. W. Li, W. K. Chen, Y. J. Gao and G. Cui, Inorg. Chem., 2022, 61(20), 7673–7681 CrossRef CAS PubMed.
- T. Hölzel, A. Belyaev, M. Terzi, L. Stenzel, M. Gernert, C. M. Marian, A. Steffen and C. Ganter, Inorg. Chem., 2021, 60, 18529–18543 CrossRef PubMed.
- F. Chotard, A. S. Romanov, D. L. Hughes, M. Linnolahti and M. Bochmann, Eur. J. Inorg. Chem., 2019, 4234–4240 CrossRef CAS.
- J. Guhl, Master's thesis, Heinrich-Heine University, 2022 Search PubMed.
- M. Gernert, U. Müller, M. Haehnel, J. Pflaum and A. Steffen, Chem. – Eur. J., 2017, 23, 2206–2216 CrossRef CAS PubMed.
- O. Nolden, J. Kremper, W. Haselbach, M. Morshedi, J. Guhl, P. Schmeinck, C. M. Marian, C. Ganter and P. Gilch, ChemPhotoChem, 2023, 7(4), e202200231 CrossRef CAS.
- P. Schmeinck, D. Sretenović, J. Guhl, R. Kühnemuth, C. A. M. Seidel, C. M. Marian, M. Suta and C. Ganter, Eur. J. Inorg. Chem., 2023, e202300416 CrossRef CAS.
- M. A. El-Sayed, J. Chem. Phys., 1963, 38, 2834–2838 CrossRef CAS.
- V. César, C. Barthes, Y. C. Farré, S. V. Cuisiat, B. Y. Vacher, R. Brousses, N. Lugan and G. Lavigne, J. Chem. Soc., Dalton Trans., 2013, 42, 7373–7385 RSC.
- R. Graaff, J. G. Aarnoudse, J. R. Zijp, P. M. A. Sloot, F. F. M. de Mul, J. Greve and M. H. Koelink, Appl. Opt., 1992, 31, 1370–1376 CrossRef CAS PubMed.
- G. D. Hager and G. A. Crosby, J. Am. Chem. Soc., 1975, 97, 7031–7037 CrossRef CAS.
- T. Azumi, C. M. O’Donnell and S. P. McGlynn, J. Chem. Phys., 1966, 45, 2735–2742 CrossRef CAS.
- T. O. Peulen, O. Opanasyuk and C. A. M. Seidel, J. Phys. Chem. B, 2017, 121, 8211–8241 CrossRef CAS PubMed.
- M. J. Frisch, G. W. Trucks, H. B. Schlegel, G. E. Scuseria, M. A. Robb, J. R. Cheeseman, G. Scalmani, V. Barone, G. A. Petersson, H. Nakatsuji, X. Li, M. Caricato, A. V. Marenich, J. Bloino, B. G. Janesko, R. Gomperts, B. Mennucci, H. P. Hratchian, J. V. Ortiz, A. F. Izmaylov, J. L. Sonnenberg, D. Williams-Young, F. Ding, F. Lipparini, F. Egidi, J. Goings, B. Peng, A. Petrone, T. Henderson, D. Ranasinghe, V. G. Zakrzewski, J. Gao, N. Rega, G. Zheng, W. Liang, M. Hada, M. Ehara, K. Toyota, R. Fukuda, J. Hasegawa, M. Ishida, T. Nakajima, Y. Honda, O. Kitao, H. Nakai, T. Vreven, K. Throssell, J. A. Montgomery Jr., J. E. Peralta, F. Ogliaro, M. J. Bearpark, J. J. Heyd, E. N. Brothers, K. N. Kudin, V. N. Staroverov, T. A. Keith, R. Kobayashi, J. Normand, K. Raghavachari, A. P. Rendell, J. C. Burant, S. S. Iyengar, J. Tomasi, M. Cossi, J. M. Millam, M. Klene, C. Adamo, R. Cammi, J. W. Ochterski, R. L. Martin, K. Morokuma, O. Farkas, J. B. Foresman and D. J. Fox, Gaussian 16, Revision A.03, Gaussian Inc., Wallingford CT, 2016 Search PubMed.
- E. Cancès, B. Mennucci and J. Tomasi, J. Chem. Phys., 1997, 107, 3032–3041 CrossRef.
- B. Mennucci, E. Cancès and J. Tomasi, J. Phys. Chem. B, 1997, 101(49), 10506–10517 CrossRef CAS.
- S. Grimme and M. Waletzke, J. Chem. Phys., 1999, 111, 5645–5655 CrossRef CAS.
- C. M. Marian, A. Heil and M. Kleinschmidt, Wiley Interdiscip. Rev.: Comput. Mol. Sci., 2019, 9, e1394 Search PubMed.
- A. Heil, M. Kleinschmidt and C. M. Marian, J. Chem. Phys., 2018, 149, 164106 CrossRef PubMed.
- M. Kleinschmidt, J. Tatchen and C. M. Marian, J. Comput. Chem., 2002, 23, 824–833 CrossRef CAS PubMed.
- D. Figgen, G. Rauhut, M. Dolg and H. Stoll, Chem. Phys., 2005, 311, 227–244 CrossRef CAS.
- M. Etinski, J. Tatchen and C. M. Marian, J. Chem. Phys., 2011, 134, 154105 CrossRef PubMed.
- M. Etinski, J. Tatchen and C. M. Marian, Phys. Chem. Chem. Phys., 2014, 16, 4740–4751 RSC.
- M. Kleinschmidt, J. Tatchen and C. M. Marian, J. Chem. Phys., 2006, 124, 124101 CrossRef PubMed.
Footnotes |
| † Electronic supplementary information (ESI) available. See DOI: https://doi.org/10.1039/d4tc01487a |
| ‡ These authors contributed equally. |
| This journal is © The Royal Society of Chemistry 2024 |

