
 Open Access Article
 This Open Access Article is licensed under a
 Creative Commons Attribution 3.0 Unported Licence
Spatial and seasonal dynamics of gaseous elemental mercury concentrations over Switzerland observed by a passive air sampler network†
Stefan
Osterwalder
 *a,
Ron
Schibler
b,
Christoph
Hüglin
c,
Beat
Schwarzenbach
c,
Geoff
Stupple
d,
Katrina
MacSween
d,
Kevin
Bishop
e,
Christine
Alewell
b and
Nina
Buchmann
a
*a,
Ron
Schibler
b,
Christoph
Hüglin
c,
Beat
Schwarzenbach
c,
Geoff
Stupple
d,
Katrina
MacSween
d,
Kevin
Bishop
e,
Christine
Alewell
b and
Nina
Buchmann
a
aDepartment of Environmental Systems Science, Institute of Agricultural Sciences, ETH Zurich, 8092 Zurich, Switzerland. E-mail: stefan.osterwalder@usys.ethz.ch
bDepartment of Environmental Sciences, Environmental Geosciences, University of Basel, 4056 Basel, Switzerland
cEmpa, Swiss Federal Laboratories for Materials Science and Technology, 8600 Dübendorf, Switzerland
dAir Quality Research Division, Environment and Climate Change Canada, Toronto, ON M3H 5T4, Canada
eDepartment of Aquatic Sciences and Assessment, Swedish University of Agricultural Sciences, 75007 Uppsala, Sweden
First published on 3rd July 2024
Abstract
Mercury (Hg) is a threat to the environment and human health. As a consequence, the Minamata Convention on Mercury was adopted in 2013 to reduce Hg pollution by curbing anthropogenic emissions. Analysis of gaseous elemental Hg (Hg0) concentration trends in the atmosphere has been identified as a cost-effective means to evaluate progress on reducing Hg pollution. Therefore, spatial coverage of atmospheric Hg0 concentration measurements should be expanded. We established an atmospheric Hg0 concentration monitoring network with 22 sites across Switzerland, using the Mercury Passive Air Sampler (MerPAS®). The mean annual atmospheric Hg0 concentration in Switzerland was 1.34 ± 0.20 ng m−3 (August 22, 2022 – September 21, 2023), similar to current observations at European air monitoring stations. Mean atmospheric Hg0 concentrations were significantly lower at rural stations (1.25 ± 0.11 ng m−3) than at urban (1.37 ± 0.14 ng m−3) stations (Mann-Whitney U-test, p < 0.01). This concentration difference can be explained by more local Hg emissions at urban sites (e.g., by fuel combustion) throughout the year as well as by more pronounced stomatal Hg0 uptake at rural sites during spring and summer. We recommend continuing the Swiss Atmospheric Mercury Network to support the call from the Minamata Convention to monitor atmospheric Hg0 as a control on whether international efforts are successful in reducing Hg in the environment. Longer term records from such monitoring networks will also help improve the understanding of both regional and global Hg cycles.
Environmental significanceThe Minamata Convention on Mercury aims to reduce the threats from Hg pollution by curbing global anthropogenic Hg emissions to the environment. Analysis of gaseous elemental mercury (Hg0) concentration in the atmosphere is an efficient type of monitoring to evaluate the effectiveness of the Convention. In this study we established a Swiss Atmospheric Mercury Network using passive air samplers at 22 sites with different air pollution levels. We found that Hg0 concentration at urban sites was significantly higher (10%) compared to the rural sites. Higher urban Hg0 concentrations were likely driven by local anthropogenic Hg sources while lower rural Hg0 concentrations occurred mostly due to elevated plant Hg0 uptake in spring and summer. This finding underlines that vegetation drives seasonal dynamics of Hg0 at rural sites and makes the urban environment an area of concern for Hg pollution. Since global anthropogenic Hg emissions seem to increase again, monitoring infrastructures like the Swiss Atmospheric Mercury Network would promptly inform decision-makers about increasing atmospheric Hg0 concentrations that will raise Hg deposition rates to soil and water. |
1 Introduction
Since humans began utilizing mercury (Hg) four thousand years ago, anthropogenic emissions have increased atmospheric Hg seven-fold.1 Subsequently, Hg content in surface waters has tripled.2 The threat posed by Hg pollution is mainly related to bioaccumulation of methylmercury in the aquatic food chain3,4 and has united 148 countries in the UNEP Minamata Convention to curb Hg emissions and reduce human and wildlife exposure to Hg.5 Therefore, its Conference of the Parties is required to assess the effectiveness of the measures by monitoring Hg trends in air, biota, and humans (Article 22). Analysis of trends in air Hg concentrations has been identified as one of the primary and most appropriate types of monitoring to evaluate the effectiveness of the Minamata Convention.6,7Anthropogenic emissions of Hg occur as gaseous elemental Hg (Hg0), gaseous oxidized Hg, or particulate bound Hg. The dominant form of Hg in the atmosphere is Hg0 (>95%), which is relatively inert and transported globally.8 It has an atmospheric lifetime of 8–13 months,9 and is taken up by the oceans10 or deposited to terrestrial surfaces, where stomatal uptake by vegetation is a major deposition pathway.11 A part of the deposited atmospheric Hg is subject to re-emission as Hg0 back into the atmosphere.12–14 The preindustrial atmospheric Hg concentration was estimated between 0.2 and 0.4 ng m−3 and peaked in the 1970s at 3–4 ng m−3.15 Since then, northern hemispheric background Hg concentrations have been declining16,17 and typically range between 1 and 1.5 ng m−3 today.15 In North America and Europe, the decline in atmospheric Hg is largely attributed to the installation of air scrubbers to curb SO2 in the 1980s, measures that subsequently reduced Hg emissions from industrial processes.18 In Switzerland, anthropogenic Hg emissions have decreased by 90% from 1990 to 2015, halving the atmospheric Hg deposition.19 These emission and deposition estimates for Switzerland illustrate that local reductions in anthropogenic Hg emissions may not immediately result in proportional decreases in Hg deposition rates. The main reasons are that Hg0 is transported globally20 and that Hg0 re-emission from soil or water buffers the effect of curbing anthropogenic emissions.21 However, despite the efforts to reduce anthropogenic Hg emissions to the atmosphere, global anthropogenic Hg emissions are increasing again today, mostly due to both the economic growth in East and Southeast Asia and the expansion of Hg use in artisanal and small-scale gold mining.22 The increasing Hg emissions raise the hypothesis that these increased emissions will lead to increased atmospheric Hg0 concentrations, increased atmospheric deposition, and ultimately increased biota Hg concentrations.
To address this hypothesis, accurate and precise measurements are paramount to monitor trends of atmospheric Hg0 concentrations. The most frequently applied techniques are active monitoring instruments (e.g., Tekran® 2537 series instruments, Tekran Instruments Corp.) and passive air samplers (e.g., MerPAS®, commercially distributed by Tekran Instruments Corp.) which were developed at the University of Toronto by McLagan et al.23 The active and passive approaches to measuring Hg0 correspond within 10% during multiple side-by-side deployments.24,25 The Tekran® 2537 series instruments provide a recommended sampling interval of 2–15 min. This is sufficient to resolve diel changes in Hg0 concentrations, but the instruments require electricity and trained staff to maintain them (https://www.tekran.com). The MerPAS® only detects monthly to seasonal changes in Hg0 concentrations, but they are easy-to-deploy and require no electricity, maintenance or special expert knowledge when sampling.23 MerPAS® have been installed to monitor Hg0 at remote sites26 and in proximity of chemical factories that have been emitting Hg to the environment in the past.27,28 Others were placed inside to assess indoor air quality,29 and concurrent deployment of strategically placed arrays have identified Hg0 point sources30,31 as well as vertical Hg0 gradients.32–34 Air Hg0 concentrations were systematically measured using Tekran® 2537 instruments within the Atmospheric Mercury Network (AMNet) across the US from 2008–2010 (ref. 35) and within the Global Mercury Observation System (GMOS) between 2010 and 2015.36 Since 2019, the Canadian-led Global Atmospheric Mercury Passive Sampling network is monitoring air Hg0 concentrations using MerPAS® with 69 locations currently in operation around the world.37
This study presents atmospheric Hg0 concentrations obtained with MerPAS® from a Swiss Atmospheric Mercury Network at 22 sites distributed across the country. The objectives of the study were to (1) calculate a mean contemporary atmospheric Hg0 concentration for Switzerland, (2) characterize differences in atmospheric Hg0 concentration between rural and urban sites, and (3) identify seasonal dynamics of atmospheric Hg0 concentrations at rural and urban sites. The effort to obtain Hg0 concentration data along gradients from populated to remote places and from lowland to high altitude locations supports current initiatives such as the Global Observation System for Mercury (GOS4M; https://www.gos4m.org/) to assess the effectiveness of the Minamata Convention on Mercury.
2 Material and methods
2.1 The Mercury Passive Air Sampler
We measured atmospheric Hg0 concentrations using Mercury Passive Air Samplers (MerPAS®; i.e. MerPAS®-WJ configuration option). The MerPAS® contains sulfur-impregnated activated carbon (AC) as a sorbent for Hg0 (MerPAS® Bulk Carbon 90-HG410-40). The AC is retained in a stainless-steel mesh cylinder that is placed inside a radial diffusive barrier (Radiello®, Sigma Aldrich RAD120). The Radiello® is then attached to the inside of a blue protective shield. The diffusive uptake of Hg0 on the AC is controlled by the Radiello® and occurs at a specific sampling rate (SR) that is then temperature and wind speed adjusted.38 It is indeed only atmospheric Hg0 and no GOM or PBM that is collected on the AC.39 The MerPAS® have a precision-based uncertainty in detecting Hg0 concentrations of 3.6 ± 3.0%. This accuracy is similar to that achieved by active measurement techniques, and the mean normalized Hg0 concentration difference between active and passive systems was 8.7 ± 5.7% in the most comprehensive study to compare the active and passive techniques.242.2 Sampling design
We established a Swiss Atmospheric Mercury Network at 22 sites across the country to monitor atmospheric Hg0 concentrations (Fig. 1). It includes 16 stations of the National Air Pollution Monitoring Network (NABEL, https://www.empa.ch/web/s503/nabel) and six Swiss FluxNet sites (https://www.swissfluxnet.ethz.ch/). The 22 sites have been grouped into seven station types representing typical locations in Switzerland with potentially different air pollution levels:40 urban traffic, urban center, suburban, rural highway, rural sites below 1000 m a.s.l., rural sites above 1000 m a.s.l., and a high-altitude site (Table 1). Please note that the CH-FRU Swiss FluxNet station (982 m a.s.l.) was assigned to “rural high” because the site characteristics on the Zugerberg are more similar to the sites in that group than in the group “rural low”. The Davos-Seehornwald research site is part of both Swiss FluxNet (CH-DAV) and NABEL (DAV). In this study we refer to the site as DAV. To meet the objectives of the study, we further grouped the station types into “urban” (urban traffic, urban center, suburban) and “rural” (rural low, rural high). Duplicated MerPAS® plus one field blank were installed at each of the NABEL sites, and one MerPAS® with no field blank were deployed at each of the Swiss FluxNet sites (Sect. S1†). This resulted in three-month deployments of 54 MerPAS® (including 16 field blanks) during autumn (September – November 2022), winter (December 2022 – February 2023), spring (March – May 2023) and summer (June – August 2023). In total, we analyzed 216 MerPAS® and 64 field blanks. The measurement campaign started on 22.08.2022 at DUE and ended on 21.09.2023 at DAV (Table 1). The exchange with the new MerPAS® took place around 01.12.2022, 01.03.2023, and 01.06.2023. The mean deployment time was 91 days. To protect from ambient Hg0 exposure during transport and storage, we put a carbon sorbent drier bag inside the protective shield, sealed the MerPAS® with electrical tape, placed it inside two plastic bags, and finally in a 2 L clear glass jar with lid (IKEA, Korken). The glass jars with MerPAS® were transported to and from the sites in 8 L polypropylene containers (Utz RAKO case) (Fig. S2a–c in Sect. S2†). The field blanks were installed alongside the exposed MerPAS® and remained closed all the time. They also served as transport blanks. As an additional measure to avoid contamination of the MerPAS®, the glass jars were stored in 60 L polypropylene containers (Utz RAKO) purged with Hg-free air. | ||
| Fig. 1 Overview of National Air Pollution Monitoring Network (circle) and Swiss FluxNet (diamond) research stations, where atmospheric Hg0 concentrations were monitored. The map was created in QGIS (https://qgis.org/en/site/). | ||
| No. | Station type | Code | Station name | Start date | End date | Elevation (m a.s.l.) | Latitude/longitude | MerPAS® (m a.g.l.) |
|---|---|---|---|---|---|---|---|---|
| 1 | Urban traffic | BER | Bern-Bollwerk | 30.09.2022 | 30.08.2023 | 535 | 46°57′ N/7°26′ E | 1.7 |
| 2 | LAU | Lausanne-César-Roux | 25.08.2022 | 13.09.2023 | 538 | 46°31′ N/6°38′ E | 2.5 | |
| 3 | Urban center | LUG | Lugano-Università | 06.09.2022 | 05.09.2023 | 273 | 46°00′ N/8°58′ E | 2.2 |
| 4 | CH-BAS | Basel Klingelbergstr. | 31.08.2022 | 05.09.2023 | 283 | 47°33′ N/7°34′ E | 20 | |
| 5 | ZUE | Zürich-Kaserne | 13.09.2022 | 13.09.2023 | 408 | 47°23′ N/8°32′ E | 2 | |
| 6 | Suburban | BAS | Basel-Binningen | 14.09.2022 | 12.09.2023 | 316 | 47°32′ N/7°35′ E | 4.7 |
| 7 | DUE | Dübendorf-Empa | 22.08.2022 | 19.09.2023 | 432 | 47°24′ N/8°37′ E | 4.7 | |
| 8 | Rural highway | HAE | Härkingen-A1 | 13.09.2022 | 13.09.2023 | 430 | 47°19′ N/7°49′ E | 5 |
| 9 | CH-OE2 | Oensingen | 12.09.2022 | 05.09.2023 | 452 | 47°17′ N/7°44′ E | 1.5 | |
| 10 | SIO | Sion-Aéroport-A9 | 14.09.2022 | 13.09.2023 | 482 | 46°13′ N/7°20′ E | 4.8 | |
| 11 | Rural low (<1000 m a.s.l.) | MAG | Magadino-Cadenazzo | 06.09.2022 | 05.09.2023 | 203 | 46°10′ N/8°56′ E | 4.8 |
| 12 | CH-CHA | Chamau | 07.09.2022 | 12.09.2023 | 393 | 47°12′ N/8°24′ E | 1.5 | |
| 13 | PAY | Payerne | 21.09.2022 | 06.09.2023 | 490 | 46°49′ N/6°57′ E | 4.6 | |
| 14 | TAE | Tänikon | 31.08.2022 | 20.09.2023 | 539 | 47°29′ N/8°54′ E | 4.7 | |
| 15 | CH-LAE | Lägeren | 16.08.2022 | 16.09.2023 | 689 | 47°28′ N/8°21′ E | 2 | |
| 16 | BRM | Beromünster | 08.09.2022 | 06.09.2023 | 797 | 47°11′ N/8°11′ E | 4.6 | |
| 17 | Rural high (>1000 m a.s.l.) | CH-FRU | Früebüel | 07.09.2022 | 12.09.2023 | 982 | 47°07′ N/8°32′ E | 2.5 |
| 18 | RIG | Rigi-Seebodenalp | 07.09.2022 | 06.09.2023 | 1031 | 47°04′ N/8°28′ E | 1.5 | |
| 19 | CHA | Chaumont | 31.08.2022 | 30.08.2023 | 1136 | 47°03′ N/6°59′ E | 4.7 | |
| 20 | DAV | Davos-Seehornwald | 21.09.2022 | 21.09.2023 | 1637 | 46°49′ N/9°51′ E | 35.5 | |
| 21 | CH-AWS | Alp Weissenstein | 15.09.2022 | 16.09.2023 | 1978 | 46°35′ N/9°47′ E | 2.5 | |
| 22 | High altitude | JUN | Jungfraujoch | 25.08.2022 | 31.08.2023 | 3571 | 46°33′ N/7°59′ E | 10.5 |
2.3 Hg analysis
All MerPAS® were analyzed in the Hg laboratory of the Environmental Geosciences research group at University of Basel, using thermal decomposition, amalgamation and atomic absorption spectroscopy with a Milestone DMA-80 Mercury Analyzer (MWS GmbH, Au, SG, Switzerland; Fig. S2d in Sect. S2†). From each MerPAS®, we weighed the AC and placed it in two nickel boats (Fig. S2e, g and h in Sect. S2†). To ensure the nickel boats were free of Hg, they were baked in a muffle furnace at 500 °C for two hours prior to analysis. The boats were covered with sodium carbonate (Na2CO3) to prevent sulfur contamination of the catalyst tube.41 To further mitigate sulfur contamination, the catalyst tube was exchanged four times. Thus, the catalyst tube change was due after about 130 sampling boats filled with AC were burned. The AC analysis method included ramp heating to 570 °C for 2.5 minutes and constant combustion at 570 °C for 5 minutes. The nickel boats were only used once. Every morning, we checked the daily variation in the measurement performance (Cf) of the instrument by analyzing an instrument blank followed by three or more quartz boats filled with 50 to 100 μl of a liquid primary reference standard (PRS). The PRS was a solution of 100 ng g−1 NIST-3133 stabilized in 1% BrCl. The data were corrected if the Cf was within 0.9 to 1.1 of the expected value: | (1) |
![[thin space (1/6-em)]](https://www.rsc.org/images/entities/char_2009.gif) 0.3 ng. The recoveries of SRM (100.7 ± 3.3%, n = 44) and sorbent blank with PRS (101.6% ± 4.1%, n = 47) indicated sufficient analytical accuracy and precision. The mean Hg content in the instrument blank, method blank, and process blank was 0.01 ± 0.01 ng (n = 33), 0.08 ± 0.16 ng (n = 200) and 0.17 ± 0.08 ng (n = 58), respectively. After analysis, all components of the MerPAS® were cleaned (Fig S2f in Sect. S2†) following the cleaning protocol in Section S3.†
0.3 ng. The recoveries of SRM (100.7 ± 3.3%, n = 44) and sorbent blank with PRS (101.6% ± 4.1%, n = 47) indicated sufficient analytical accuracy and precision. The mean Hg content in the instrument blank, method blank, and process blank was 0.01 ± 0.01 ng (n = 33), 0.08 ± 0.16 ng (n = 200) and 0.17 ± 0.08 ng (n = 58), respectively. After analysis, all components of the MerPAS® were cleaned (Fig S2f in Sect. S2†) following the cleaning protocol in Section S3.†
2.4 Calculation of Hg0 concentration
The atmospheric Hg0 concentration (ng m−3) was calculated by dividing the field blank-adjusted mass of Hg (ng) by the product of the deployment time (days) and the SR (m3 per day). The SR of 0.111 m3 per day was derived after extensive testing by Tekran instruments42 and was adjusted for temperature and wind speed as described in McLagan et al.:38| SRadj = 0.111 m3 per day + (TA − 9.89 °C) × 0.0009 + (WS − 3.41 m s−1) × 0.003, | (2) |
| Code | Station type | Depl. (days) | AC (g) | Hg (ng) | TA (°C) | WS (m s−1) | SRadj. (m3 per day) | Hg0 (ng m−3) |
|---|---|---|---|---|---|---|---|---|
| BER | Urban traffic | 319 | 0.65 | 11.97 | 10.23 | 2.70 | 0.109 | 1.27 |
| LAU | 364 | 0.83 | 15.38 | 12.39 | 1.75 | 0.108 | 1.38 | |
| LUG | Urban center | 364 | 0.62 | 14.58 | 13.42 | 1.64 | 0.109 | 1.30 |
| CH-BAS | 370 | 0.61 | 15.47 | 13.01 | 2.10 | 0.110 | 1.36 | |
| ZUE | 365 | 0.65 | 17.17 | 12.22 | 2.26 | 0.110 | 1.51 | |
| BAS | Suburban | 363 | 0.65 | 16.59 | 11.33 | 1.91 | 0.108 | 1.40 |
| DUE | 393 | 0.65 | 16.07 | 12.23 | 2.05 | 0.109 | 1.35 | |
| HAE | Rural highway | 280 | 0.68 | 16.64 | 13.58 | 2.03 | 0.110 | 1.47 |
| CH-OE2 | 358 | 0.63 | 18.82 | 10.81 | 1.82 | 0.107 | 1.86 | |
| SIO | 364 | 0.64 | 15.60 | 11.08 | 2.03 | 0.108 | 1.42 | |
| MAG | Rural low (<1000 m a.s.l.) | 364 | 0.63 | 14.74 | 12.33 | 1.57 | 0.108 | 1.25 |
| CH-CHA | 370 | 0.67 | 13.88 | 10.59 | 1.04 | 0.105 | 1.26 | |
| PAY | 350 | 0.64 | 13.38 | 10.44 | 2.12 | 0.108 | 1.27 | |
| TAE | 386 | 0.65 | 15.38 | 10.09 | 1.57 | 0.106 | 1.30 | |
| CH-LAE | 324 | 0.62 | 11.39 | 12.02 | 2.15 | 0.109 | 1.19 | |
| BRM | 363 | 0.67 | 14.08 | 9.67 | 3.54 | 0.111 | 1.29 | |
| CH-FRU | Rural high (>1000 m a.s.l.) | 370 | 0.63 | 14.22 | 8.45 | 1.52 | 0.104 | 1.30 |
| RIG | 364 | 0.65 | 13.21 | 8.82 | 2.28 | 0.107 | 1.21 | |
| CHA | 364 | 0.66 | 14.40 | 7.43 | 2.95 | 0.107 | 1.34 | |
| DAV | 365 | 0.63 | 12.83 | 4.55 | 1.93 | 0.102 | 1.16 | |
| CH-AWS | 366 | 0.63 | 12.10 | 7.17 | 1.69 | 0.103 | 1.17 | |
| JUN | High altitude | 371 | 0.67 | 14.48 | −5.68 | 5.74 | 0.104 | 1.35 |
2.5 Auxiliary variables: air pollutants and traffic
Particulate matter (PM10) and nitrogen oxides (NOx) concentrations were provided by the Federal Office for Environment (FOEN) with a daily resolution. The data are publicly available at https://www.bafu.admin.ch/bafu/en/home/topics/air/state/data/data-query-nabel.html. The main causes of current air pollution in Switzerland are motorized traffic (NOx, PM10, VOC, soot), wood burning (PM10, VOC, soot), agriculture (PM10, NH3, VOC), and industry (PM10, NOx, VOC).40 A monthly evaluation of Swiss traffic data was provided by the Federal Roads Office FEDRO at https://www.astra.admin.ch/astra/en/home.html. The data allowed monitoring traffic trends at the urban traffic and rural highway sites.3 Results and discussion
3.1 Quality assurance and quality control
The overall average concentration in 58 field blanks was 1.59 ± 0.54 ng Hg per sampler. This corresponded to ca. 2.3 ng Hg g−1 AC. This value was within the range of 0.50–8.99 ng Hg g−1 AC reported from field blank deployments at 20 research sites across the globe.24 The NABEL samples were blank corrected using the site-specific field blanks. The Swiss FluxNet samples as well as the NABEL samples from sites where blanks were missing were corrected based on average Hg0 concentrations from field blanks obtained during the respective season. Three field blanks were lost: BER in autumn (stolen), HAE in winter, and HAE in summer (analysis failures). There were three field blanks deployed in summer 2023 with unusually high Hg content: BAS (3.2 ng per sampler), MAG (4.1 ng per sampler), and DAV (4.6 ng per sampler). Since there was no inconsistency in sampling and our strict procedure to protect all MerPAS® from contamination, we cannot explain these elevated field blanks. We therefore included them to correct the Hg0 concentration at the respective sites, but excluded them when calculating the overall method detection limit (MDL), the practical quantification limit (PQL), the limit of detection (LOD), and the limit of quantification (LOQ). The MDL and PQL were determined by three times and ten times the standard deviation of the mass of Hg in the field blanks, respectively and the LOD and LOQ were calculated by dividing the MDL and PQL by the product of SRadj. and deployment time.25 The average field blank percentage was 11%, and there was no significant difference (Mann-Whitney U-test [MWU], p > 0.01) between the field blanks at urban sites (1.71 ± 0.59 ng Hg per sampler, n = 26) vs. rural sites (1.66 ± 0.72 ng Hg per sampler, n = 44). A field blank percentage of 100% would equal the amount of Hg on the MerPAS® sampling Hg0. The MDL of 1.6 ng and the PQL of 5.4 ng were consistently below the analyzed mass of Hg. The lowest amount of Hg on the AC (8.6 ng) was measured at CH-AWS in summer 2023 (Table S4 in Sect. S4†). The LOD and the LOQ were 0.17 ng Hg0 m−3 and 0.57 ng Hg0 m−3, respectively. All measured Hg0 concentrations were above the LOD and LOQ, confirming that we were able to accurately measure atmospheric Hg0 concentrations at all sites. The mean relative percent difference of Hg0 concentrations between the duplicates was 8.1%. This value is higher than the 3.6% reported by McLagan et al.24 or 7.2% and 7.6% in Quant et al.,33 indicating lower replicate precision than those other studies reported.3.2 Atmospheric Hg0 concentrations across Switzerland
The annual mean Hg0 concentration across Switzerland was 1.34 ± 0.20 ng m−3 (Table 2). This value is consistent with total gaseous Hg concentrations of about 1.3 ng m−3 recorded at European air monitoring (EMEP) sites using active measurement techniques.15 The average Hg0 concentration at rural sites was 1.25 ± 0.11 ng m−3 (n = 44). This value was 17% lower compared to the northern hemispheric reference value of 1.5 ng Hg0 m−3 measured in 2015.36,43 The difference confirms the decreasing trend in Hg0 concentrations of about 2% per year in Western Europe.44The decreasing trend in Hg0 concentrations in Western Europe, however, is inconsistent with the observed actual increase in global anthropogenic Hg emissions.6,45–47 This under the assumption that the atmospheric lifetime of Hg0 of 8–13 months would be long enough for anthropogenic emissions to be completely mixed in the northern hemisphere. As suggested by Sonke et al.,15 the apparent paradox might be an effect of global change. Increased primary productivity of terrestrial vegetation48 could drive an increase in stomatal Hg0 uptake that outweighs the concurrent increase in anthropogenic emissions.49 Mean station type specific Hg0 concentrations decreased as follows: rural highway (1.60 ng m−3), urban center (1.39 ng m−3), suburban (1.38 ng m−3), high altitude (1.35 ng m−3), urban traffic (1.33 ng m−3), rural low (1.26 ng m−3), and rural high (1.24 ng m−3) (Fig. 2). The mean Hg0 concentrations measured close to the highway and urban centers were significantly different from those measured at station types rural low and rural high (MWU test, p < 0.01). The means of the other station types were not significantly different from each other (MWU test, p > 0.01). The significant difference in Hg0 concentrations between rural highway/urban center and rural low/rural high was likely driven by higher local anthropogenic Hg emissions close to highways and urban centers as well as more stomatal Hg0 uptake by vegetation at rural sites. Please note that atmospheric Hg0 concentrations are not only influenced by local anthropogenic Hg emissions (sources) and stomatal uptake of Hg0 (sinks) but also by atmospheric stability and regional to global atmospheric chemistry. In the following sections, however, we focus on the influence of local anthropogenic Hg emissions from combustion processes and the seasonality of stomatal Hg0 uptake by vegetation.
 | ||
| Fig. 2 Annual mean atmospheric Hg0 concentration at each station type across Switzerland. The blue bars indicate urban sites and the brown bars rural sites, respectively. The rural highway sites and the high altitude site (gray bars) were not assigned to either group. Error bars represent the standard deviation from the mean. The number of measurements is given for each station type. | ||
3.3 Atmospheric Hg0 concentrations at urban and rural sites
The mean Hg0 concentration at urban sites was 1.37 ± 0.14 ng m−3 and significantly higher compared to the rural sites (MWU test, p < 0.01) (Fig. 3). Similar measured urban Hg0 concentrations were reported from the state of New Jersey (NJ30) within the Atmospheric Mercury Network that is part of the National Atmospheric Deposition Program (https://nadp.slh.wisc.edu/networks/atmospheric-mercury-network/) as well as from the greater Toronto area. The mean Hg0 concentration was 1.41 ± 0.20 ng m−3 at NJ30 in 2022 and 1.42 ± 0.14 ng m−3 in the greater Toronto area in 2016.30 The 10% elevated Hg0 concentration measured at urban sites compared to rural sites is likely driven by local anthropogenic Hg sources such as motorized traffic, residential heaters, or power plants.50,51 In Switzerland, 76% of the Hg emissions to air originate from fuel combustion.52 The main emitters were municipal solid waste incineration and manufacturing industries of non-metallic minerals (e.g. cement production). About 5% of the Hg emitted from fuel combustion originates from motorized traffic. Industrial processes and product use (incl. dental amalgams) add 8%, and waste incineration where waste heat was not used to produce energy another 4% to the total Hg emissions. Other sources including building fires contribute 12% to the total anthropogenic Hg emission in Switzerland.52 More specifically, urban Hg0 emissions can originate from point sources and diffusive sources. Some Hg0 point sources have been identified in the greater Toronto area close to crematoria (1.58 ng m−3), waste/recycling centers (1.61 ng m−3), and dental facilities (1.63 ng m−3).30 In the city of Basel, however, Hg0 concentrations were not elevated close to such point sources.29 Diffusive urban Hg0 sources include indoor Hg emissions to the environment that may originate from a variety of household items such as fluorescent and compact fluorescent lamps, thermometers, barometers, electrical switches, relays or paints,29,53,54 or re-emission from buildings and surfaces.55,56 As reported in earlier studies, the total of these urban Hg0 emissions increased the Hg0 concentration at the urban sites Zurich-Kaserne (ZUE) and Basel-Klingelbergstrasse (CH-BAS) as well as at the suburban site Basel-Binningen (BAS).29,57 The median Hg0 concentration at ZUE measured by Tekran® 2537 instruments between December 2013 and December 2015 was 1.81 ng m−3 and 20% higher compared to the Hg0 measured at ZUE in this study (1.51 ng m−3).57 The decreasing trend in Hg0 concentration again corresponds to the annual decrease of about 2% in Western Europe44 and the 18% reduction of Hg emission from 2010–2021 in Switzerland.52 A strong decrease in Hg0 was observed in the Basel area when comparing concentrations measured with MerPAS® at BAS (2.34 ng m−3) and CH-BAS (2.44 ng m−3) between November 5 and December 7, 2018 (ref. 29) with the winter values obtained at BAS (1.41 ng m−3) and CH-BAS (1.45 ng m−3) in this study. This decline in winter Hg0 concentrations by about 40% might be explained by lower heat production from natural gas for district heating (−40%). The heat production from natural gas was 414.261 million kW h in 2018 compared to 294.526 million kW h in 2022.58 The Hg content of natural gas, that was treated to remove Hg, is typically below 1000 ng m−3.59 The lower heat production in 2022 of 119.7 million kW h was mainly a result of decreased overall heat consumption (−75.2 million kW h). At the same time heat production from waste incineration decreased (43.1 million kW h) but increased from wood and sludge burning (90.2 million kW h). | ||
| Fig. 3 Annual atmospheric Hg0 concentrations measured at urban (urban center, urban traffic, suburban) and rural (rural low, rural high) sites in Switzerland. The boxplots display the median (middle line) and the limits indicate the upper and lower quartiles. The whiskers represent 1.5 times the interquartile range. The circles indicate the mean values (based on n = 28 and n = 44 for urban and rural samples, respectively). | ||
We found that elevated atmospheric Hg0 concentrations were generally associated with high air pollution levels of NOx and PM10 caused by combustion processes. The mean NOx and PM10 concentrations measured over the course of our campaign (August 22, 2022 – September 21, 2023) were 28.5 ± 9.2 μg m−3 and 13.6 ± 1.6 μg m−3 at urban sites and 8.1 ± 5.2 μg m−3 and 9.1 ± 2.9 μg m−3 at rural sites, respectively. Thus, urban NOx was 3.5 times elevated and PM10 was 1.5 times elevated compared to the rural sites. The smaller difference between urban and rural Hg0 concentrations (factor of 1.1) compared to NOx and PM10 can be explained by the fact that NOx and PM10, unlike Hg0, have significant emission sources in urban environments. In addition, Hg0 has an atmospheric lifetime of about one year,9 while NOx and PM10 have an atmospheric lifetime of only a few weeks at most.60 The long atmospheric lifetime allows Hg0 to travel long distances before deposition, leading to more uniform global distribution.5 The highest average Hg0 concentrations (1.60 ± 0.36 ng m−3) were measured at the rural highway stations (HAE, SIO, CH-OE2). The Hg0 concentrations at SIO was lower than in HAE and CH-OE2, likely because there were only 46′679 vehicles compared to CH-OE2 and HAE where 92′071 and 97′384 vehicles were passing by, respectively (annual means from FEDRO61). In the exhaust of petrol- and diesel-driven vehicles, 3.8–16.8 ng Hg0 m−3 and 2.8–8.5 ng Hg0 ng m−3 are emitted to the atmosphere at driving modes.62 The total number of petrol-driven and diesel-driven passenger cars in Switzerland was 2′952′760 (62%) and 1′273′597 (27%) in 2023, respectively.63 All-electric vehicles in Switzerland represent 3.3% of all passenger cars. Elevated air pollution levels at HAE (46.0 μg NOx m−3, 13.5 μg PM10 m−3) and SIO (43.4 μg NOx m−3, 15.3 μg PM10 m−3) indicated that motorized traffic was a source for NOx, PM10 and likely also Hg0.
There are two main reasons why average Hg0 concentrations at rural sites were lower compared to urban sites. First, the local anthropogenic Hg emission is lower at rural sites. The lowest Hg0 concentrations at rural high sites were measured along with the lowest concentrations of the air pollutants NOx and PM10, indicating better air quality. The mean NOx and PM10 concentrations at RIG, CHA and DAV were 3.6 and 6.4 μg m−3, respectively. Second, the stomatal Hg0 uptake is higher at rural sites. The rural sites in Switzerland seem to act as a sink for atmospheric Hg0 that was emitted in urban areas on a national scale52 and, on a global scale, mainly from coal-fired power plants and artisanal small-scale gold mining.6 The hypothesis that stomatal Hg0 uptake drives lower Hg0 concentrations at rural sites is supported by the fact that Hg0 concentrations increased with elevation at rural sites located below 1031 m a.s.l. (Fig. S3a in Sect. S5†). The positive linear relationship between Hg0 concentration and elevation (R2 = 0.71, Fig. S3b in Sect. S5†) is likely driven by higher primary productivity and subsequently increased stomatal Hg0 uptake at lower elevations (e.g., higher daily daytime mean air temperatures) compared to higher elevations (e.g., lower daily daytime mean air temperatures). Such patterns in primary productivity, i.e. gross primary production (GPP), have repeatedly been observed at the flux sites within the Swiss FluxNet,64,65 also reflected in elevational gradients in the length of the growing seasons and ecosystem surface conductance values.65 Higher stomatal Hg0 uptake at lower elevations also corresponds to observed higher ratios of intercellular to ambient CO2 concentration (ci/ca) of foliage.66 Accordingly, Chang et al.67 reported that GPP of croplands, deciduous forests, coniferous forests and grasslands (major vegetated land use types in Switzerland) peak at daily daytime mean air temperatures of 26.7 °C, 22.3 °C, 20.0 °C and 17.7 °C, respectively. Thus, GPP was most likely larger at MAG (283 m a.s.l.) with daily daytime mean air temperatures of 15.4 °C compared to RIG (1031 m a.s.l.) with 9.9 °C.
3.4 Seasonal dynamics of atmospheric Hg0 concentrations
The mean autumn, winter, spring, and summer Hg0 concentrations across Switzerland were 1.33 ± 0.08 ng m−3, 1.31 ± 0.16 ng m−3, 1.40 ± 0.14 ng m−3, and 1.44 ± 0.14 ng m−3 at urban sites (Fig. 4a) and 1.31 ± 0.09 ng m−3, 1.28 ± 0.09 ng m−3, 1.20 ± 0.12 ng m−3, and 1.21 ± 0.09 ng m−3 at rural sites (Fig. 4b), respectively. The mean Hg0 concentrations at the urban sites are slightly higher in spring and summer compared to autumn and winter (MWU test, p < 0.05). These higher urban Hg0 concentrations in spring and summer could be explained by increased re-emission of Hg0 from streets55 and building surfaces56 due to elevated solar irradiation and increased surface temperatures. Re-emission of Hg0 from these urban surfaces was likely elevated because the summer of 2023 was the fifth warmest since 1864.68 In 2022, 57% of the residential buildings in Switzerland were heated by oil (39%) and natural gas (18%). Even though about five times more natural gas is consumed in Switzerland in January compared to July, Hg emissions from heating increased urban Hg0 concentrations in winter less than anthropogenic emissions and re-emission from urban surfaces in summer.69,70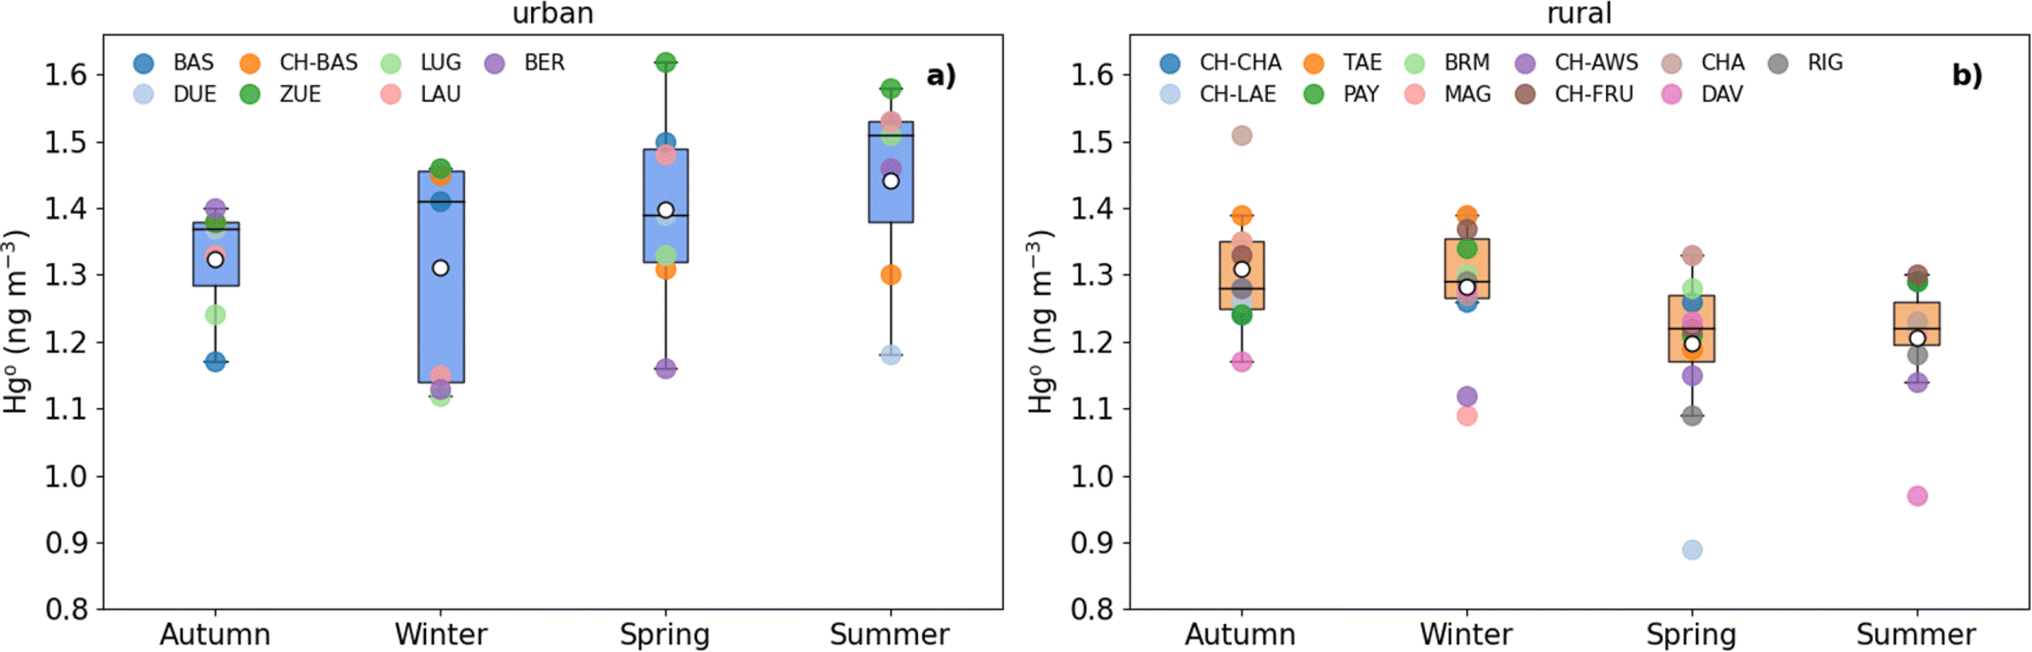 | ||
| Fig. 4 Seasonal variation in atmospheric Hg0 concentrations for urban (a) and rural (b) sites. Data obtained in autumn 2022, winter 2022/23, spring 2023 and summer 2023 are displayed for all urban and rural sites (color points). The circles indicate the mean values. See boxplot description in caption of Fig. 3. | ||
At the rural sites, there was a seasonal dynamic in Hg0 concentrations with lower Hg0 in spring and summer compared to autumn and winter (MWU test, p < 0.01). Assuming low local anthropogenic Hg0 emissions at all rural sites throughout the year, the seasonal Hg0 dynamic is likely driven by active vegetation periods, when primary productivity of terrestrial vegetation is high and stomatal uptake of Hg0 is elevated.11 This explanation is in concert with the finding that Hg0 concentrations at terrestrial sites in the Northern Hemisphere co-vary with photosynthetic activity of vegetation and CO2 concentrations.49 In Switzerland, the strongest uptake of CO2 from grassland and forests was typically in May and June.71–73 Thus, we expected the lowest atmospheric Hg0 concentrations at rural sites in the end of the spring campaign and in the beginning of the summer campaign. The slightly higher summertime Hg0 concentrations at many of the sites might be driven by drought conditions during 2023 associated with pronounced heatwaves that reduced stomatal Hg0 uptake.74 The same can be expected in forests, when CO2 assimilation is reduced during short-term extreme atmospheric dryness.75
While stomatal Hg0 uptake was likely a main driver of the seasonal Hg0 dynamics at rural sites, there were five Hg0 concentrations that were outside 1.5 times the interquartile range of the seasonally grouped data (Fig. 4b). These values were observed at CHA in autumn, CH-AWS, and MAG in winter, CH-LAE in spring, and DAV in summer. The elevated Hg0 concentrations at CHA in autumn might be explained by its proximity to the suburbs of Neuchâtel (i.e. Saint-Blaise, NE) at a distance of about 4 km. In autumn, CHA is typically located above a temperature inversion,76 trapping air pollutants below and leading to better air quality above. In autumn 2022, however, PM10 values were 10% elevated compared to the long-term mean PM10 concentrations in autumn (2012–2021), indicating weaker or less frequent temperature inversions. As a result, Hg0 concentrations at CHA were likely elevated in autumn 2022 due to urban Hg emission sources. The low Hg0 concentrations at CH-AWS in winter were a result of the great distance to potential anthropogenic Hg sources. This includes the absence of traffic, because the Albula Pass road that leads past the station is closed to all motor vehicles during winter. The Hg0 concentrations at MAG in winter were 15% lower compared to the mean of all rural stations in winter, even though the site is located relatively close to the village of Cadenazzo, some industrial businesses and the highway from Bellinzona to Lugano. Concentrations of Hg0 at MAG seemed representative for locations where neither local Hg sources (combustion processes) nor sinks (vegetation) are the major drivers of the seasonal Hg0 dynamics, but rather atmospheric stability and atmospheric chemistry are dominant controls. The low spring Hg0 concentrations measured within the CH-LAE deciduous forest in spring and the low summer Hg0 concentration above the spruce forest canopy at DAV indicated that forests can be local sinks for Hg0 during the growing season.77 The Hg0 concentrations in CH-LAE (0.89 ng m−3) and DAV (0.97 ng m−3) were the lowest values measured in this study. The low Hg0 concentration likely results from both highest stomatal Hg0 uptake of leaves and needles during spring and summer78 as well as the generally low air pollution indicated by NOx and PM10 at DAV, being 69% and 48% lower compared to the mean of all rural sites, respectively. The observed Hg0 concentrations at CH-LAE and DAV were similar to Hg0 concentrations measured during growing seasons in a coniferous forest in Maine, USA (0.99 ng m−3) and in a deciduous forest in Massachusetts, USA (1.10 ng m−3)77 as well as in a deciduous forest about 80 km north of Toronto, Canada (0.95 ng m−3) between July and August 2018.33
The highest recorded seasonal Hg0 concentration of 2.56 ng m−3 was measured at the rural highway site CH-OE2 in summer 2023 (Fig. S4 in Sect. S6†). This high value can be explained by the summertime peak of motor vehicles (+9% traffic volume compared to winter) and the generally heavily congested traffic in both directions. In 2022, traffic jams were recorded during 300 h in the direction of Bern and during 1000 h in the direction of Zurich. Moving further away from local anthropogenic Hg0 sources, up to the Jungfraujoch (JUN) on 3571 m a.s.l., the seasonality in Hg0 is driven by either advection of Hg0 from the free troposphere or the planetary boundary layer.79 Planetary boundary layer influenced air masses are more frequently present at JUN in the summer (80% of the time) compared to the winter (40% of the time).80 The air masses in the summer are typically enriched in air pollutants, leading to elevated Hg0 concentrations (1.41 ng m−3 in summer 2023; 1.06 ng m−3 in winter 2022/2023) and PM10 concentrations (6.6 μg m−3 in summer 2023; 0.7 μg m−3 in winter 2022/2023).
4 Conclusion
At the Fourth Conference of the Parties to the Minamata Convention on Mercury in 2022, the Swiss delegation advocated for a cost-efficient monitoring system to evaluate the effectiveness of the Minamata Convention. Here we established such a cost-efficient monitoring system for Switzerland using Mercury Passive Air Samplers (MerPAS®). We measured seasonally resolved atmospheric Hg0 concentrations at 22 sites, grouped in seven station types over the course of one year. The results from this Swiss Atmospheric Mercury Network showed that Hg0 concentration levels were very similar to the actual northern hemispheric background Hg0 concentration (1.3 ng m−3) and showed that urban Hg0 concentrations were 10% higher compared to rural Hg0 concentrations. This difference between urban and rural Hg0 concentrations was likely driven by higher Hg emissions from combustion processes in urban areas and higher stomatal Hg0 uptake by vegetation in rural areas. The hypothesis that stomatal Hg0 uptake decreases ambient air Hg0 levels at rural sites was supported by the finding that atmospheric Hg0 was significantly lower at rural sites in spring and summer when primary productivity is higher. Moreover, Hg0 concentrations increased with elevation at rural sites up to 1031 m a.s.l., because primary productivity as well as stomatal and surface conductances typically decrease with altitude. Additionally, at low elevation, growing season starts earlier and last longer. The seasonal dynamics at urban sites indicated slightly higher Hg0 in spring and summer than in autumn and winter, which is inconsistent with the hypothesis that anthropogenic Hg emission from combustion processes in residential heaters during the cold season leads to significantly higher atmospheric Hg0 concentrations. However, the elevated Hg0 concentrations make the urban environment an area of concern for Hg pollution. Reduction in anthropogenic Hg emissions to air, because of regulatory measures, would thus be observed in urban areas first. This highlights the importance of urban air Hg0 monitoring sites, which are often overlooked in long-term monitoring networks globally. The Swiss Atmospheric Mercury Network might represent a starting point for long-term monitoring of atmospheric Hg0 in Switzerland to test hypotheses, e.g., whether an increase in primary productivity increases atmospheric Hg0 uptake by vegetation. The network would also promptly inform decision-makers about increasing atmospheric Hg0 concentrations and subsequently elevated Hg deposition rates to soil and water.Data availability
Data for this article are available at ETH Zurich's Research Collection at https://doi.org/10.3929/ethz-b-000678965.Author contributions
Stefan Osterwalder: conceptualization, funding acquisition, formal analysis, methodology, investigation, data curation, visualization, writing – original draft, writing – review & editing. Ron Schibler: formal analysis, visualization, writing – original draft, writing – review & editing. Christoph Hüglin: resources, writing – review & editing. Beat Schwarzenbach: resources, writing – review & editing. Geoff Stupple: methodology, writing – review & editing. Katrina MacSween: methodology, writing – review & editing. Kevin Bishop: resources, supervision, writing – review & editing. Christine Alewell: resources, supervision, writing – review & editing. Nina Buchmann: resources, supervision, writing – review & editing.Conflicts of interest
There are no conflicts to declare.Acknowledgements
This study was funded by the Air Pollution Control and Chemicals Division of the Federal Office for the Environment (00.5100.PZ). We also acknowledge funding from the Swedish Research Council (2021-04168) and from the University of Basel Environmental Geosciences Group to cover a part of the analytical and equipment costs. We want to acknowledge the very helpful staff of the Ambient Air Pollution/National Air Pollution Network (NABEL) research unit of the Swiss Federal Laboratories for Materials Science and Technology (EMPA) for deploying and retrieving the MerPAS® at all NABEL sites. We thank the ETH Zurich Grassland Sciences Group (Institute of Agricultural Sciences) for deploying MerPAS® at the Swiss FluxNet sites. The Atmospheric Science Group of the University of Basel is acknowledged for providing CH-BAS temperature and wind speed data, and the Environmental Isotopes and Gases group of the University of Bern for providing wind speed data from Beromünster (BRM). We thank the Federal Office of Meteorology and Climatology (MeteoSwiss) for granting access to meteorological data of all research stations through the data portal for teaching and research (IDAweb). Finally, we acknowledge the support by Judith Kobler-Waldis of the University of Basel, Environmental Geosciences Group during Hg analysis in the laboratory.References
- H. M. Amos, D. J. Jacob, D. G. Streets and E. M. Sunderland, Legacy Impacts of all-time anthropogenic emissions on the global mercury cycle, Global Biogeochem. Cycles, 2013, 27, 410–421 CrossRef CAS.
- C. H. Lamborg, C. R. Hammerschmidt, K. L. Bowman, G. J. Swarr, K. M. Munson, D. C. Ohnemus, P. J. Lam, L.-E. Heimbürger, M. J. A. Rijkenberg and M. A. Saito, A global ocean inventory of anthropogenic mercury based on water column measurements, Nature, 2014, 512, 65–68 CrossRef CAS PubMed.
- D. Mergler, H. A. Anderson, L. H. Chan, K. R. Mahaffey, M. Murray, M. Sakamoto and A. H. Stern, Panel on health risks and toxicological effects of methylmercury. Methylmercury exposure and health effects in humans: a worldwide concern, Ambio, 2007, 36, 3–11 CrossRef CAS PubMed.
- A. T. Schartup, C. P. Thackray, A. Qureshi, C. Dassuncao, K. Gillespie, A. Hanke and E. M. Sunderland, Climate change and overfishing increase neurotoxicant in marine predators, Nature, 2019, 572, 648–650 CrossRef CAS PubMed.
- UNEP, Minamata Convention on Mercury: Text and Annexes, UNEP Chemicals Branch, Geneva, Switzerland, 2013, https://www.mercuryconvention.org, last access: 18 June 2024 Search PubMed.
- UNEP, Global mercury assessment. Sources, emissions, releases and environmental transport, UNEP Chemicals and Health Branch, Geneva, Switzerland, 2019, https://www.unenvironment.org/resources/publication/global-mercury-assessment-2018, last access: 18 June 2024 Search PubMed.
- UNEP, UNEP/MC/COP.4/INF/29 - Giving effect to article 22 of the Minamata Convention on Mercury: effectiveness evaluation, 2022, https://www.mercuryconvention.org/en/meeting-documents, last access: 23 April 2024 Search PubMed.
- M. S. Gustin, H. M. Amos, J. Huang, M. B. Miller and K. Heidecorn, Measuring and modeling mercury in the atmosphere: a critical review, Atmos. Chem. Phys., 2015, 15, 5697–5713 CrossRef CAS.
- A. Saiz-Lopez, S. P. Sitkiewicz, D. Roca-Sanjuán, J. M. Oliva-Enrich, J. Z. Dávalos, R. Notario, M. Jiskra, Y. Xu, F. Wang, C. P. Thackray, E. M. Sunderland, D. J. Jacob, O. Travnikov, C. A. Cuevas, A. U. Acuña, D. Rivero, J. M. C. Plane, D. E. Kinnison and J. E. Sonke, Photoreduction of gaseous oxidized mercury changes global atmospheric mercury speciation, transport and deposition, Nat. Commun., 2018, 9, 4796, DOI:10.1038/s41467-018-07075-3.
- M. Jiskra, L.-E. Heimbürger-Boavida, M.-M. Desgranges, M. V. Petrova, A. Dufour, B. Ferreira-Araujo, J. Masbou, J. Chmeleff, M. Thyssen, D. Point and J. E. Sonke, Mercury stable isotopes constrain atmospheric sources to the ocean, Nature, 2021, 597, 678–682 CrossRef CAS PubMed.
- J. Zhou, D. Obrist, A. Dastoor, M. Jiskra and A. Ryjkov, Vegetation uptake of mercury and impacts on global cycling, Nat. Rev. Earth Environ., 2021, 2, 269–284 CrossRef.
- H. M. Horowitz, D. J. Jacob, Y. Zhang, T. S. Dibble, F. Slemr, H. M. Amos, J. A. Schmidt, E. S. Corbitt, E. A. Marais and E. M. Sunderland, A new mechanism for atmospheric mercury redox chemistry: implications for the global mercury budget, Atmos. Chem. Phys., 2017, 17, 6353–6371 CrossRef CAS.
- K. Bishop, J. B. Shanley, A. Riscassi, H. A. de Wit, K. Eklöf, B. Meng, C. Mitchell, S. Osterwalder, P. F. Schuster, J. Webster and W. Zhu, Recent advances in understanding and measurement of mercury in the environment: terrestrial Hg cycling, Sci. Total Environ., 2020, 721, 137647, DOI:10.1016/j.scitotenv.2020.137647.
- S. N. Lyman, I. Cheng, L. E. Gratz, P. Weiss-Penzias and L. Zhang, An updated review of atmospheric mercury, Sci. Total Environ., 2020, 707, 135575, DOI:10.1016/j.scitotenv.2019.135575.
- J. E. Sonke, H. Angot, Y. Zhang, A. Poulain, E. Björn and A. Schartup, Global change effects on biogeochemical mercury cycling, Ambio, 2023, 52, 853–876 CrossRef CAS PubMed.
- C. I. Olson, H. Fakhraei and C. T. Driscoll, Mercury emissions, atmospheric concentrations, and wet deposition across the conterminous United States: changes over 20 years of monitoring, Environ. Sci. Technol. Lett., 2020, 7, 376–381 CrossRef CAS.
- K. MacSween, G. Stupple, W. Aas, K. Kyllönen, K. A. Pfaffhuber, H. Skov, A. Steffen, T. Berg and M. Nerentorp Mastromonaco, Updated trends for atmospheric mercury in the Arctic: 1995–2018, Sci. Total Environ., 2022, 837, 155802, DOI:10.1016/j.scitotenv.2022.155802.
- N. E. Selin, Global biogeochemical cycling of mercury: a review, Annu. Rev. Environ. Resour., 2009, 34, 43–63 CrossRef.
- FOEN, Use, disposal and environmental releases of mercury. An overview of the situation in Switzerland, Federal Office for the Environment, Bern, Switzerland, 2018, https://www.bafu.admin.ch/bafu/en/home/topics/chemicals/publications-studies/publications/use-disposal-environmental-releases-mercury.html, last access: 18 June 2024 Search PubMed.
- C. T. Driscoll, R. P. Mason, H. M. Chan, D. J. Jacob and N. Pirrone, Mercury as a global pollutant: Sources, pathways, and effects, Environ. Sci. Technol., 2013, 47, 4967–4983 CrossRef CAS PubMed.
- Y. Zhang, P. Zhang, Z. Song, S. Huang, T. Yuan, P. Wu, V. Shah, M. Liu, L. Chen, X. Wang, J. Zhou and Y. Agnan, An updated global mercury budget from a coupled atmosphere-land-ocean model: 40% more re-emissions buffer the effect of primary emission reductions, One Earth, 2023, 6, 316–325 CrossRef.
- UNEP, Technical Background Report to the Global Mercury Assessment 2018, UNEP Chemicals Branch, Geneva, Switzerland, 2019, https://www.unep.org/resources/publication/global-mercury-assessment-2018, last access: 18 June 2024 Search PubMed.
- D. S. McLagan, C. P. Mitchell, H. Huang, Y. D. Lei, A. S. Cole and A. Steffen, A high-precision passive air sampler for gaseous mercury, Environ. Sci. Technol. Lett., 2016, 3, 24–29 CrossRef CAS.
- D. S. McLagan, C. P. J. Mitchell, A. Steffen, H. Hung, C. Shin, G. W. Stupple, M. L. Olson, W. T. Luke, P. Kelley, D. Howard, G. C. Edwards, P. F. Nelson, H. Xiao, G.-R. Sheu, A. Dreyer, H. Huang, B. Abdul Hussain, Y. D. Lei, I. Tavshunskyad and F. Wania, Global evaluation and calibration of a passive air sampler for gaseous mercury, Atmos. Chem. Phys., 2018, 18, 5905–5919 CrossRef CAS.
- A. Naccarato, A. Tassone, M. Martino, S. Moretti, A. Macagnano, E. Zampetti, P. Papa, J. Avossa, N. Pirrone, M. Nerentorp, J. Munthe, I. Wängberg, G. W. Stupple, C. P. J. Mitchell, A. R. Martin, A. Steffen, D. Babi, E. M. Prestbo, F. Sprovieri and F. Wania, A field intercomparison of three passive air samplers for gaseous mercury in ambient air, Atmos. Meas. Tech., 2021, 14, 3657–3672 CrossRef CAS.
- C. Hoang, O. Magand, J. Brioude, A. Dimuro, C. Brunet, C. Ah-Peng, Y. Bertrand, A. Dommergue, Y. Duan Lei and F. Wania, Probing the limits of sampling gaseous elemental mercury passively in the remote atmosphere, Environ. Sci.: Atmos., 2023, 3, 268–281 CAS.
- T. Nováková, T. Navrátil, M. Schütze, J. Rohovec, Š. Matoušková, M. Hošek and T. M. Grygar, Reconstructing atmospheric Hg levels near the oldest chemical factory in Central Europe using a tree ring archive, Environ. Pollut., 2022, 304, 119215 CrossRef PubMed.
- T. Navrátil, J. Rohovec, J. Shanley, Š. Matoušková, T. Nováková, A. H. Šmejkalová and R. Prokeš, Atmospheric mercury and its deposition during the phasing out of an amalgam electrolysis plant: Temporal, seasonal, and spatial Patterns, Environ. Sci. Pollut. Res., 2023, 30, 123586–123602 CrossRef PubMed.
- L. Wohlgemuth, D. McLagan, B. Flückiger, D. Vienneau and S. Osterwalder, Concurrently measured concentrations of atmospheric mercury in indoor (household) and outdoor air of Basel, Switzerland, Environ. Sci. Technol. Lett., 2020, 7, 234–239 CrossRef CAS PubMed.
- D. S. McLagan, B. A. Hussain, H. Huang, Y. D. Lei, F. Wania and C. P. J. Mitchell, Identifying and evaluating urban mercury emission sources through passive sampler-based mapping of atmospheric concentrations, Environ. Res. Lett., 2018, 13, 074008, DOI:10.1088/1748-9326/aac8e6.
- D. S. McLagan, S. Osterwalder and H. Biester, Temporal and spatial assessment of gaseous elemental mercury concentrations and emissions at contaminated sites using active and passive measurements, Environ. Res. Commun., 2021, 3, 051004, DOI:10.1088/2515-7620/abfe02.
- B. Jeon and J. V. Cizdziel, Can the MerPAS Passive Air Sampler discriminate landscape, seasonal, and elevation effects on atmospheric mercury? A feasibility study in Mississippi, USA, Atmosphere, 2019, 10, 617, DOI:10.3390/atmos10100617.
- M. I. Quant, M. Feigis, S. Mistry, Y. D. Lei, C. P. J. Mitchell, R. Staebler, A. Di Guardo, E. Terzaghi and F. Wania, Using passive air samplers to quantify vertical gaseous elemental mercury concentration gradients within a forest and above Soil, J. Geophys. Res.: Atmos., 2021, 126, e2021JD034981, DOI:10.1029/2021JD034981.
- E. M. Roy, J. Zhou, F. Wania and D. Obrist, Use of atmospheric concentrations and passive samplers to assess surface-atmosphere exchange of gaseous mercury in forests, Chemosphere, 2023, 341, 140113, DOI:10.1016/j.chemosphere.2023.140113.
- X. Lan, R. Talbot, M. Castro, K. Perry and W. Luke, Seasonal and diurnal variations of atmospheric mercury across the US determined from AMNet monitoring data, Atmos. Chem. Phys., 2012, 12, 10569–10582 CrossRef CAS.
- F. Sprovieri, N. Pirrone, M. Bencardino, F. D'Amore, F. Carbone, S. Cinnirella, V. Mannarino, M. Landis, R. Ebinghaus, A. Weigelt, E.-G. Brunke, C. Labuschagne, L. Martin, J. Munthe, I. Wängberg, P. Artaxo, F. Morais, M. J. de Barbosa, J. Brito, W. Cairns, C. Barbante, M. del C. Diéguez, P. E. Garcia, A. Dommergue, H. Angot, O. Magand, H. Skov, M. Horvat, J. Kotnik, K. A. Read, L. M. Neves, B. M. Gawlik, F. Sena, N. Mashyanov, V. Obolkin, D. Wip, X. B. Feng, H. Zhang, X. Fu, R. Ramachandran, D. Cossa, J. Knoery, N. Marusczak, M. Nerentorp and C. Norstrom, Atmospheric mercury concentrations observed at ground-based monitoring sites globally distributed in the framework of the GMOS network, Atmos. Chem. Phys., 2016, 16, 11915–11935 CrossRef CAS PubMed.
- K. MacSween, G. Stupple, A. Steffen and F. Wania, A global picture of atmospheric mercury, Canada's global mercury passive sampling network study, AGU Fall Meeting, Chicago, IL, 2022, https://ui.adsabs.harvard.edu/abs/2022AGUFM.B13E.01M/abstract, last access: 18 June 2024 Search PubMed.
- D. S. McLagan, C. P. Mitchell, H. Huang, B. Abdul Hussain, Y. D. Lei and F. Wania, The effects of meteorological parameters and diffusive barrier reuse on the sampling rate of a passive air sampler for gaseous mercury, Atmos. Meas. Tech., 2017, 10, 3651–3660 CrossRef CAS.
- N. Szponar, D. S. McLagan, R. J. Kaplan, C. P. J. Mitchell, F. Wania, A. Steffen, G. W. Stupple, F. Monaci and B. A. Bergquist, Isotopic characterization of atmospheric gaseous elemental mercury by passive air sampling, Environ. Sci. Technol., 2020, 54, 10533–10543 CrossRef CAS PubMed.
- FOEN, Luftqualität 2022. Messresultate des Nationalen Beobachtungsnetzes für Luftfremdstoffe (NABEL), Federal Office for the Environment, Bern, Switzerland, 2023, https://www.bafu.admin.ch/uz-2316-d, last access: 18 June 2024 Search PubMed.
- D. S. McLagan, H. Huang, Y. D. Lei, F. Wania and C. P. J. Mitchell, Application of sodium carbonate prevents sulphur poisoning of catalysts in automated total mercury analysis, Spectrochim. Acta, Part B, 2017, 133, 60–62 CrossRef CAS.
- Tekran Instruments Corp, 2020, https://www.tekran.com/files/MerPAS-Config-Options.pdf, last access: 18 June 2024 Search PubMed.
- EMEP, European Monitoring and Evaluation Programme, 2016, https://www.emep.int/, last access: 18 June 2024 Search PubMed.
- Y. Zhang, D. J. Jacob, H. M. Horowitz, L. Chen, H. M. Amos, D. P. Krabbenhoft, F. Slemr, V. L. St Louis and E. M. Sunderland, Observed decrease in atmospheric mercury explained by global decline in anthropogenic emissions, Proc. Natl. Acad. Sci. U.S.A., 2016, 113, 526–531 CrossRef CAS PubMed.
- M. Muntean, G. Janssens-Maenhout, S. Song, A. Giang, N. E. Selin, H. Zhong, Y. Zhao, J. G. J. Olivier, D. Guizzardi, M. Crippa, E. Schaaf and F. Dentener, Evaluating EDGARv4.tox2 speciated mercury emissions ex post scenarios and their impacts on modelled global and regional wet deposition patterns, Atmos. Environ., 2018, 184, 56–68 CrossRef CAS.
- D. G. Streets, H. M. Horowitz, Z. Lu, L. Levin, C. P. Thackray and E. M. Sunderland, Five hundred years of anthropogenic mercury: Spatial and temporal release profiles, Environ. Res. Lett., 2019, 14, 084004, DOI:10.1088/1748-9326/ab281f.
- D. G. Streets, H. M. Horowitz, Z. Lu, L. Levin, C. P. Thackray and E. M. Sunderland, Global and regional trends in mercury emissions and concentrations, 2010–2015, Atmos. Environ., 2019, 201, 417–427 CrossRef CAS.
- C. Tian, X. Yue, H. Zhou, Y. Lei, Y. Ma and Y. Cao, Projections of changes in ecosystem productivity under 1.5 C and 2 C global warming, Glob. Planet. Change, 2021, 205, 103588, DOI:10.1016/j.gloplacha.2021.103588.
- M. Jiskra, J. E. Sonke, D. Obrist, J. Bieser, R. Ebinghaus, C. L. Myhre, K. A. Pfaffhuber, I. Wängberg, K. Kyllönen, D. Worthy, L. G. Martin, C. Labuschagne, T. Mkololo, M. Ramonet, O. Magand and A. Dommergue, A vegetation control on seasonal variations in global atmospheric mercury concentrations, Nat. Geosci., 2018, 11, 244–250 CrossRef CAS.
- E. G. Pacyna, J. M. Pacyna, K. Sundseth, J. Munthe, K. Kindbom, S. Wilson, F. Steenhuisen and P. Maxson, Global emission of mercury to the atmosphere from anthropogenic sources in 2005 and projections to 2020, Atmos. Environ., 2010, 44, 2487–2499, DOI:10.1016/j.atmosenv.2009.06.009.
- D. G. Streets, M. K. Devane, Z. Lu, T. C. Bond, E. M. Sunderland and D. J. Jacob, All-time releases of mercury to the atmosphere from human activities, Environ. Sci. Technol., 2011, 45, 10485–10491 CrossRef CAS PubMed.
- FOEN, Switzerland's Informative Inventory Report 2023 (IIR), Submission under the UNECE Convention on long-range transboundary air pollution, Federal Office for the Environment, Bern, Switzerland, 2023 Search PubMed.
- A. Carpi and Y. Chen, Gaseous elemental mercury as an indoor air pollutant, Environ. Sci. Technol., 2001, 35, 4170–4173 CrossRef CAS PubMed.
- G. Loupa, C. Polyzou, A. M. Zarogianni, K. Ouzounis and S. Rapsomanikis, Indoor and outdoor elemental mercury: a comparison of three different cases, Environ. Monit. Assess., 2017, 189, 72, DOI:10.1007/s10661-017-5781-1.
- C. S. Eckley and B. Branfireun, Gaseous mercury emissions from urban surfaces: Controls and spatiotemporal trends, J. Appl. Geochem., 2008, 23, 369–383 CrossRef CAS.
- M. Jiskra, N. Marusczak, K.-H. Leung, L. Hawkins, E. Prestbo and J. E. Sonke, Automated stable isotope sampling of gaseous elemental mercury (ISO-GEM): insights into GEM emissions from building surfaces, Environ. Sci. Technol., 2019, 53, 4346–4354 CrossRef CAS PubMed.
- B. Denzler, C. Bogdal, C. Kern, A. Tobler, J. Huo and K. Hungerbühler, Urban source term estimation for mercury using a boundary-layer budget method, Atmos. Chem. Phys., 2019, 19, 3821–3831, DOI:10.5194/acp-19-3821-2019.
- Statistical Office of the Canton of Basel-Stadt, Statistisches Jahrbuch des Kantons Basel-Stadt, Basel, Switzerland, 2023, https://www.statistik.bs.ch/zahlen/tabellen/8-energie.html, last access: 18 June 2024 Search PubMed.
- UNEP, UNEP/Hg/PAG.13.5 – UNEP Global Mercury Partnership Study Report on Mercury from Oil and Gas, UNEP Chemicals and Health Branch, Geneva, Switzerland, 2022, https://unep.org/globalmercurypartnership, last access: 18 June 2024 Search PubMed.
- J. H. Seinfeld, and S. N. Pandis, Atmospheric Chemistry and Physics: from Air Pollution to Climate Change, John Wiley & Sons, Hoboken, 2016 Search PubMed.
- FEDRO, Swiss automatic road traffic counts, Annual and monthly result, Federal Roads Office, Bern, Switzerland, 2023, https://www.astra.admin.ch/astra/en/home/documentation/data-and-information-products/traffic-data/data-and-publication/swiss-automatic-road-traffic-counts--sartc-/annual-and-monthly-results.html, last access: 18 June 2024 Search PubMed.
- J. H. Won, J. Y. Park and T. G. Lee, Mercury emissions from automobiles using gasoline, diesel, and LPG, Atmos. Environ., 2007, 41, 7547–7552 CrossRef CAS.
- FSO, Road vehicles - Stock, level of motorization, Federal Statistical Office, Bern, Switzerland, 2023, https://www.bfs.admin.ch/bfs/en/home/statistics/mobility-transport/transport-infrastructure-vehicles/vehicles/road-vehicles-stock-level-motorisation.html, last access: 18 June 2024 Search PubMed.
- S. Wolf, W. Eugster, C. Ammann, M. Häni, S. Zielis, R. Hiller, J. Stieger, D. Imer, L. Merbold and N. Buchmann, Contrasting response of grassland versus forest carbon and water fluxes to spring drought in Switzerland, Environ. Res. Lett., 2013, 8, 035007, DOI:10.1088/1748-9326/8/3/035007.
- M. Gharun, L. Hörtnagl, E. Paul-Limoges, S. Ghiasi, I. Feigenwinter, S. Burri, K. Marquardt, S. Etzold, R. Zweifel, W. Eugster and N. Buchmann, Physiological response of Swiss ecosystems to 2018 drought across plant types and elevation, Philos. Trans. R. Soc., A, 2020, B37520190521, DOI:10.1098/rstb.2019.052.
- M. Gharun, S. Klesse, G. Tomlinson, P. Waldner, B. Stocker, B. Rihm, R. Siegwolf and N. Buchmann, Effect of nitrogen deposition on centennial forest water-use efficiency, Environ. Res. Lett., 2021, 16, 114036, DOI:10.1088/1748-9326/ac30f9.
- Q. Chang, X. Xiao, R. Doughty, X. Wu, W. Jiao and Y. Qin, Assessing variability of optimum air temperature for photosynthesis across site-years, sites and biomes and their effects on photosynthesis estimation, Agric. For., 2021, 298–299, DOI:10.1016/j.agrformet.2020.108277.
- MeteoSwiss, Klimabulletin Sommer 2023, Federal Office for Meteorology and Climatology, Zürich, Switzerland, 2023, https://www.meteoschweiz.admin.ch/service-und-publikationen/publikationen.html#order=date-desc%26page=1%26pageGroup=publication%26type=reportOrBulletin%26category=climate, last access: 23 April 2024 Search PubMed.
- FSO, Buildings and Dwellings Statistics 2022, Federal Statistical Office, Bern, Switzerland, 2022, https://www.bfs.admin.ch/bfs/en/home/statistics/construction-housing/buildings.gnpdetail.2023-0442.html, last access: 18 June 2024 Search PubMed.
- SFOE, Analysis of Energy Consumption by Specific Use, Swiss Federal Office of Energy, Bern, Switzerland, 2023, https://www.bfe.admin.ch/bfe/en/home/supply/statistics-and-geodata/energy-statistics/analysis-of-energy-consumption-by-specific-use.html, last access: 18 June 2024 Search PubMed.
- S. Etzold, N. K. Ruehr, R. Zweifel, M. Dobbertin, A. Zingg, P. Pluess, R. Häsler, W. Eugster and N. Buchmann, The carbon balance of two contrasting mountain forest ecosystems in Switzerland: similar annual trends, but seasonal differences, Ecosystems, 2011, 14, 1289–1309 CrossRef CAS.
- I. Feigenwinter, L. Hörtnagl, M. J. Zeeman, W. Eugster, K. Fuchs, L. Merbold and N. Buchmann, Large inter-annual variation in carbon sink strength of a permanent grassland over 16 years: Impacts of management practices and climate, Agric. For., 2023, 340, 109613, DOI:10.1016/j.agrformet.2023.109613.
- J. Rogger, L. Hörtnagl, N. Buchmann and W. Eugster, Carbon dioxide fluxes of a mountain grassland: Drivers, anomalies and annual budgets, Agric. For., 2022, 314, 108801, DOI:10.1016/j.agrformet.2021.108801.
- S. Osterwalder, W. Eugster, I. Feigenwinter and M. Jiskra, Eddy covariance flux measurements of gaseous elemental mercury over a grassland, Atmos. Meas. Tech., 2020, 13, 2057–2074 CrossRef CAS.
- A. Shekhar, L. Hörtnagl, N. Buchmann and M. and Gharun, Long-term changes in forest response to extreme atmospheric dryness, Glob. Change Biol., 2023, 29, 5379–5396 CrossRef CAS PubMed.
- S. Brönnimann and U. Neu, A possible photochemical link between stratospheric and near-surface ozone on Swiss mountain sites in late winter, J. Atmos. Chem., 1998, 31, 299–319 CrossRef.
- J. Zhou, S. W. Bollen, E. M. Roy, D. Y. Hollinger, T. Wang, J. T. Lee and D. Obrist, Comparing ecosystem gaseous elemental mercury fluxes over a deciduous and coniferous forest, Nat. Commun., 2023, 14, 2722, DOI:10.1038/s41467-023-38225-x.
- L. Wohlgemuth, P. Rautio, B. Ahrends, A. Russ, L. Vesterdal, P. Waldner, V. Timmermann, N. Eickenscheidt, A. Fürst, M. Greve, P. Roskams, A. Thimonier, M. Nicolas, A. Kowalska, M. Ingerslev, P. Merilä, S. Benham, C. Iacoban, G. Hoch, C. Alewell and M. Jiskra, Physiological and climate controls on foliar mercury uptake by European tree species, Biogeosciences, 2022, 19, 1335–1353, DOI:10.5194/bg-19-1335-2022.
- B. Denzler, C. Bogdal, S. Henne, D. Obrist, M. Steinbacher and K. Hungerbühler, Inversion approach to validate mercury emissions based on background air monitoring at the High Altitude Research Station Jungfraujoch (3580 m), Environ. Sci. Technol., 2017, 51, 2846–2853 CrossRef CAS PubMed.
- N. Bukowiecki, E. Weingartner, M. Gysel, M. C. Coen, P. Zieger, E. Herrmann, M. Steinbacher, H. W. Gäggeler and U. Baltensperger, A review of more than 20 years of aerosol observation at the High Altitude Research Station Jungfraujoch, Switzerland (3580 m asl), Aerosol Air Qual. Res., 2016, 16, 764–788 CrossRef CAS.
Footnote |
| † Electronic supplementary information (ESI) available. See DOI: https://doi.org/10.1039/d4ea00052h |
| This journal is © The Royal Society of Chemistry 2024 |