 Open Access Article
Creative Commons Attribution 3.0 Unported Licence
The trials and triumphs of modelling X-ray absorption spectra of transition metal phthalocyanines†
Esma Birsen
Boydas
and
Michael
Roemelt
 *
*
Institut für Chemie, Humboldt-Universität zu Berlin, Brook-Taylor-Str. 2, D-12489 Berlin, Germany. E-mail: michael.roemelt@hu-berlin.de; Tel: +49 (0)30 2093 82700
First published on 10th July 2024
Abstract
This study explores the electronic structure of Co, Fe and Mn phthalocyanines (TMPcs) as well as their perfluorinated counterparts through a series of electronic structure calculations utilizing multireference methods and by simulating their metal L-edge and ligand (nitrogen and fluorine) K-edge X-ray absorption spectra (XAS) in an angle-resolved manner. Simulations targeting different ground-state symmetries, where relevant, have been conducted to observe changes in the N K-edge lineshape. The applicability of the quasi-degenerate formulation of n-electron valence state perturbation theory (QD-NEVPT2) for L-edge X-ray absorption spectroscopy (XAS) is evaluated, alongside the use of a restricted active space (RAS) formalism to describe the final-state multiplets generated by L-shell X-ray processes. Our findings provide valuable insights into the electronic properties of TMPcs, in particular with respect to the effect of fluorination, and demonstrate the broad applicability of various formulations of NEVPT2 in spectral simulations. Moreover, this study highlights the utility of manual truncation of the configuration spaces in order to allow for large active orbital spaces in aforementioned calculations.
1 Introduction
Transition metal phthalocyanines (TMPcs) are a class of cyclic coordination compounds widely explored across multiple domains of chemistry due to their distinct structural, electronic, and magnetic properties.1,2 These systems feature an 18-membered macrocycle composed of four isoindole units connected by carbon–carbon bonds. The first coordination shell of the central metal ion involves four nitrogen atoms, adopting a square planar configuration. Notably, TMPcs share structural similarities with porphyrins, essential components of biomolecules such as hemoglobin and chlorophyll.3 Both porphyrins and phthalocyanines are able to accommodate over 70 elements at their central cavity while providing a rather rigid and stable coordination environment.4TMPcs exhibit attractive electronic and magnetic characteristics owing to their extensive π-conjugation.5 This skeleton facilitates electron delocalization throughout the entire macrocycle, resulting in pronounced absorption in the visible and near-infrared regions of the electromagnetic spectrum.6 Such absorption properties render TMPcs appealing for diverse technological applications, including organic photovoltaics,7 organic light-emitting diodes,8 and sensors.9 Besides their electronic attributes, TMPcs can also exhibit magnetic behavior due to their generally open-shell 3d orbital manifold.10 This magnetic propensity positions TMPcs as pivotal constituents for novel materials and devices such as data storage and spintronics.11,12
Fluorinated metal–phthalocyanines (TMPcF16) are extensively employed across diverse applications.13 In contrast to conventional p-type semiconductors such as TMPcs, TMPcF16 functions as an n-type semiconductor in photovoltaics and light-emitting diodes.14 Furthermore, fluorination enhances the stability of these compounds, rendering them viable for operation in challenging environmental conditions.15,16 The distinct electronic structure of TMPcF16 facilitates efficient charge transport, a fundamental aspect for optimal performance in electronic devices.17
The complex coordination chemistry of metallophthalocyanines offers compelling opportunities for the tunability of the electronic structure by altering the central metal ion or adding functional groups to the macrocycle. This adaptability allows for precise adjustments tailored to specific applications. A fundamental step in this direction involves elucidating the electronic structure of isolated TMPcs. This requires a comprehensive understanding of the arrangement of frontier molecular orbitals, spin states, ground state symmetry, and the nature of near-degenerate states. For instance, in optimizing solar cell performance, it is crucial to thoroughly understand and adjust the energy levels of dye molecules.18
The electronic properties of first-row TMPcs have been extensively studied in the existing literature. Nickel and zinc phthalocyanines are commonly described as having a ground state electronic structure characterized by A1g symmetry in a singlet spin state, as evidenced by several studies.19–26 On the other hand, copper phthalocyanine is typically attributed to a 2B1g state.27–31 The consensus among these studies provides strong support for the ground state electronic structures of NiPc, ZnPc, and CuPc.
In contrast, a considerable disparity exists when it comes to the identity of the ground and low-lying excited states of the corresponding cobalt, iron, or manganese complexes. This discrepancy is evident across several studies.32–35 Specifically regarding MnPc, experimental observations suggest that differences in sample preparation can result in different spatial symmetries being assigned to the ground state, primarily varying between 4A2g and 4Eg states.35 The discrepancies concerning CoPc and FePc primarily revolve around the thermally accessible near-degenerate states.35–37
Considering the susceptibility of these complexes to various near-degenerate states, and the inconsistency often observed in DFT-based studies due to the choice of density functional, it is valuable to highlight previous studies that employed multiconfigurational wavefunction based methods. For example, Wallace et al. recently conducted a study scrutinizing the ground state electronic structure of TMPcs to assign state symmetries at a CASSCF and MRMP2 level.38 The active spaces in this study included metal 3d orbitals along with a small number of significant ligand orbitals. Structure optimizations were performed at the B3LYP/6-31G* level only for ZnPc, with its geometry then used as a model scaffold for the remaining TMPcs. This decision was based on previous X-ray diffraction data indicating no discernible differences in the first-coordination shell of TMPcs across the sequence from MnPc to ZnPc. In a subsequent study by Hobza et al., much larger active spaces, such as CASPT2/CASSCF (16e,15o) and DMRG(28e,36o), were employed to shed light on the spin-state of iron phthalocyanine.39 Here, a quintet ground state was found to be thermally stable for an isolated FePc moiety in the gas phase.
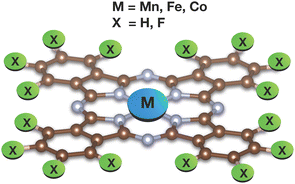
Building upon the extensive literature on TMPcs, this work aims to unravel the characteristics of the ground and low-lying excited states of multiple TMPcs utilizing transition metal L-edge and ligand K-edge X-ray absorption spectra as means of validation of the obtained results. The first part of this study concerns the local electronic structure of 5 TMPcs shown in Fig. 1, i.e. dominating electronic configurations are reported for all low-energy states as obtained from state-of-the-art multireference electronic structure methods. Then, computed nitrogen K-edge spectra are compared to the experimentally observed spectra. In this way, the results from the first part are validated and the observed features in the spectra can be assigned to electronic transitions. In a similar manner, the less well studied F K-edges of CoPcF16 and FePcF16 have been computed and analyzed. Finally, after having established confidence in the symmetry and spin state of the electronic ground state description, the complex task of modeling L-edge multiplets is effectively pursued. Here, the transition metal L-edge spectra have been modelled by means of Complete Active Space Configuration Interaction combined with strongly contracted n-electron valence perturbation theory (SC-NEVPT2) and its quasi-degenerate (QD-NEVPT2) variant.40–42 To accommodate larger active spaces while simulating the L-edges, a manual truncation of the final state multiplets has also been carried out. In some cases, the comparison between calculated and experimentally observed spectra indicates interesting features of the experimental setup, e.g. the presence or absence of significant chemical interactions between the investigated TMPc and the surface it has been adsorbed on.
2 Computational methodology
A series of simulations were conducted employing various theoretical levels, primarily utilizing the ORCA software package version 4.2.43 The subsequent paragraphs will describe these setups.2.1 Structure optimizations
Geometry optimizations were executed using the B3LYP global hybrid density functional44,45 alongside the def2-TZVP(-f) basis set,46 with numerical integration facilitated by a dense grid (ORCA Grid5). Acceleration of Coulomb and exchange integrals was achieved through the resolution of identity (RI) and chain-of-sphere (COSX) approximations, in conjunction with the def2/J basis set.47–52 Additionally, dispersion corrections were incorporated using the D3BJ method.53,542.2 Ligand K-edge
Nitrogen and fluorine K-edge XAS were simulated using time-dependent density functional theory (TD-DFT) calculations, permitting the excitation of electrons from molecular orbitals with a primary ligand 1s character.55 The N 1s orbitals were localized using the Pipek–Mezey scheme to simulate the underlying phenomena.56 The Tamm–Dancoff approximation (TDA) was employed in all TD-DFT calculations,57 and scalar relativistic effects were approximated using the zeroth-order regular approximation (ZORA).58–60 Simulated spectra were generated by convoluting the calculated transitions with Gaussian functions of 0.3 to 1.0 eV width. All computed spectra were shifted by around 12 eV to better align with experimental counterparts, a necessary adjustment to account for systematic errors introduced by the TD-DFT method and dependent on the chosen functional and basis set.552.3 Transition metal L-edge
The ASS1ST method generates a set of quasi-restricted natural orbitals for both internal and external orbital spaces. The correlation strength of these natural orbitals is determined by their associated natural orbital occupation numbers (NOONs), providing insights into whether to include or exclude them from the active space. Initially, the active space consisted solely of metal 3d orbitals.
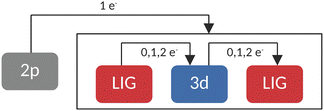
In RASCI part, the orbital optimization of valence excited states included the ligand-based a1g orbital, the doubly degenerate LUMOs of eg character, and the transition metal 3d orbitals in the active space. On these optimized orbitals, a configuration interaction (CI) calculation with manually selected configurations (CFGs) has been carried out. A schematic representation of the employed configurations can be seen in Fig. 2. This setup accounted for up to double excitations from (and to) the ligands in the final state multiplets. While resembling previous works by Lundberg et al., where a SA-RASSCF orbital optimization was followed by a RASPT2 treatment with appropriate ionization potential electron affinity (IPEA) shifts and imaginary shifts, our study employed a SA-CASSCF orbital optimization and a manually truncated selected configuration interaction step.
2.4 Comparison of simulated and experimental spectra
When comparing simulated and experimental X-ray spectra, one can employ various methods. These approaches usually involve examining the numbers, positions, and approximate heights or areas of calculated spectral features and comparing them with their counterparts in experimental spectra in a qualitative manner. Additionally, more quantitative techniques, such as direct least-squares comparison or similarity scores are commonly used. However, it's important to recognize that achieving perfect alignment between calculated and experimental spectra may be challenging due to difficulties in accurately modeling macroscopic effects such as hybridizations at the interface or bulk effects. Therefore, we opt not to use similarity or distance scores in our comparisons.The macroscopic effects mentioned earlier can appear in various ways in X-ray spectroscopy, especially when studying adsorbates on surfaces. To illustrate potential scenarios, consider the case of transition metal phthalocyanines (TMPcs) grafted onto a surface, as shown in Fig. 3. The primary focus of this work is on modeling an isolated phthalocyanine moiety (case A). However, in experimental setups, TMPcs are often attached to metallic or nonmetallic surfaces as thin films, which can vary in thickness. For instance, a monolayer (case B) may highlight surface–TMPc interaction effects, while thicker films (case C) predominantly reflect interactions among the TMPc layers themselves. It is crucial to recognize that achieving a one-to-one mapping between simulated and experimental spectra cannot ba achieved, especially when dealing with a reactive surface, such as Ag(111).72
 | ||
| Fig. 3 Schematic representation of isolated TMPcs and as adsorbates on metallic or nonmetallic surfaces. | ||
3 Results and discussion
The scrutinized systems maintain a planar structure with a D4h point group symmetry. Yet, symmetry was neither enforced nor utilized during any of the reported calculations. The metal ions are coordinated by four nitrogen atoms originating from pyrrole units. Additionally, these four pyrrole entities are linked to a tetradentate ligand via four additional nitrogen atoms located in meso positions. Consequently, two distinct groups of nitrogen atoms are discernible, denoted as Npyr and Naza (see Fig. 4). The nomenclature for these non-equivalent nitrogens is derived from a prior theoretical investigation on metal phthalocyanines (Pcs) by De Francesco et al.73 Additionally, for the fluorine K-edge calculations of fluorinated metallophthalocyanines, it is pertinent to distinguish between two different types of fluorine atoms: Finner and Fouter.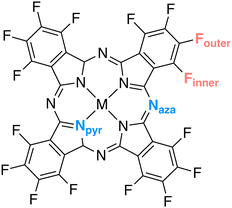 | ||
| Fig. 4 Schematic representation of Npyr, Naza in all tested molecules, and Finner and Fouter in fluorinated metallophthalocyanines. | ||
3.1 Ground state electronic structure
| Name | M–N | Npyr–C | Naza–C |
|---|---|---|---|
| CoPc | 1.93 | 1.38 | 1.32 |
| FePc | 1.94 | 1.37 | 1.32 |
| MnPc | 1.95 | 1.38 | 1.32 |
| CoPcF16 | 1.93 | 1.38 | 1.32 |
| FePcF16 | 1.94 | 1.39 | 1.32 |
| Metal ion | State symmetry | Main configuration |
|---|---|---|
| Mn | 4A2g | (dxy)2(dxz, dyz)1,1(dz2)1 |
| 4Eg | (dxy)1(dxz, dyz)2,1(dz2)1 | |
| 4B1g | (dxy)1(dxz, dyz)1,1(dz2)2 | |
| Fe | 3A1g | (dxy)2(dxz, dyz)1,1(dz2)2 |
| 3Eg | (dxy)2(dxz, dyz)2,1(dz2)1 | |
| 3B2g | (dxy)1(dxz, dyz)2,2(dz2)1 | |
| Co | 2A1g | (dxy)2(dxz, dyz)2,2 (dz2)1 |
| 2Eg | (dxy)2(dxz, dyz)2,1(dz2)2 | |
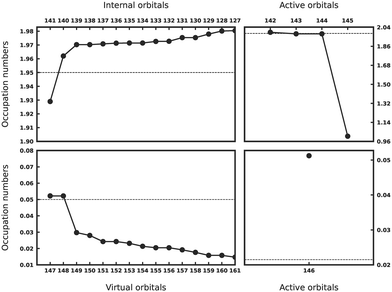
The ASS1ST scheme has been employed across all complexes to investigate the ground state correlation and observe changes in the electronic structure of TMPcs when different transition metals are incorporated. As described elsewhere in detail,70,71 ASS1ST predicts how strong orbitals are correlated by computing approximate natural orbital occupation numbers. The farther apart this number is from 2 or 0, the more correlated the corresponding orbital is. This approach also aids in selecting a suitable active space for these compounds. The starting point for all reported ASS1ST calculations was a minimal CAS comprising only metal 3d orbitals.
The results for CoPc are presented in Fig. 5. Metal 3d orbitals of (dxy)2(dxz, dyz)2,2 display an occupation of 2.0. In the case of CoPc, this configuration corresponds to the 2A1g state. Additionally, Gouterman-like orbitals from both internal (1.93, 1.96) and virtual subspaces (doubly-degenerate 0.05) are easily discernible. These results indicate that the desired 2A1g state has been successfully located through ASS1ST calculations.
The ASS1ST plots for FePc and MnPc are available in the ESI.† One of the most debated phthalocyanines, FePc, was found to be of 3Eg state, in line with the previous theoretical studies that utilized B3LYP, and experimental studies employing FePc thin films.76,77 For MnPc, the ASS1ST simulations predominantly point to the 4A2g state with a (dxy)2(dxz, dyz)1,1(dz2)1 configuration. Notably, orbitals with occupation numbers around 0.05 and 0.055 indicate a loss of degeneracy in the Gouterman-like orbitals from the virtual space due to Jahn–Teller (JT) distortion. This suggests involvement from the 4Eg state. A JT effect is not observed for the other molecules. Furthermore, there is an evident increase in the active orbital character when transitioning from Co to Mn, while the remaining orbitals from the internal subspaces maintain a similar character across this sequence.
ASS1ST results for the fluorinated phthalocyanines CoPcF16 and FePcF16 can be found in the ESI,† Fig. S1 and S4. Both CoPcF16 and FePcF16 exhibit a behavior similar to their non-fluorinated counterparts, CoPc and FePc, respectively, with one notable difference: the occupation numbers of the Gouterman-like virtual orbitals (also referred to as π-backbonding type ligands) are smaller in the fluorinated compounds. This difference can be attributed to the electron-withdrawing effect of fluorine substitution, which stabilizes the HOMO and destabilizes the LUMO.78 As a result, there is a weaker correlation of these orbitals in the ground state of the fluorinated compounds.
3.2 Ligand K-edges
3.2.1.1 Lineshape and origins. Nitrogen K-edge of CoPc, FePc and MnPc display three evident peaks in their π* region, as indicated in Fig. 6 by labels A, B, and C. CoPc and FePc exhibit similar lineshapes, while the experimental spectrum of MnPc is somewhat different. Noteworthy differences of MnPc include more pronounced shoulder features at peaks A and B, with peak B displaying a notable redshift in comparison to CoPc and FePc. Peak A originates from intense 1s-to-π* Gouterman orbital transitions, arising from either Naza or Npyr. This phenomenon can be attributed to the stabilization of π-backbonding-type eg orbitals in MnPc, which is also evident in the ground-state molecular orbital (MO) representation, as illustrated in Fig. 2 of ref. 38. The corresponding NDOs of the nitrogen K-edge simulations are detailed in ESI.†
3.2.1.2 CoPc. As mentioned previously, conflicting reports about the identity of the electronic ground state of CoPc can be found in the literature with the most prominent candidates being 2A1g, 2Eg or a mixture of both.82Fig. 6 presents the Co K-edge simulation for the 2A1g state, while the corresponding simulation for 2Eg state can be found in the ESI,† Fig. S6. Our results indicate the presence of a 2A1g ground state, as this provides better agreeement with the experimental nitrogen K-edge. The lineshape at the grazing angle for the 2Eg state shows a minor shift of peak B to lower energies. Additionally, the in-plane transitions are shifted to a higher energy regime due to the unavailability of the dz2 orbital.
3.2.1.3 FePc. The calculated N K-edge in Fig. 6, refers to a FePc of 3Eg symmetry, whereas the simulations from the 3A1g state are given in ESI,† Fig. S7. In this case, all experimentally observed features within the π*-range, along with the relative intensity of transitions, are successfully reproduced for both ground state symmetries.
3.2.1.4 MnPc. A remarkable agreement between calculations and the experiment is observed for MnPc. This is somewhat surprising as the presented calculations only take into account an isolated MnPc molecule and intermolecular interactions have been reported to considerably affect the electronic structure of MnPcs.83–85 The ground state symmetry employed herein is 4Eg with (dxy)1(dxz, dyz)2,1(dz2)1 configuration, which is also in line with previous XAS, MCD and UV-Vis measurements.33,86–88
The experimental F K-edge spectra of CoPcF16 and FePcF16 presented in Fig. 7 (CoPcF16) and ESI,† Fig. S9 (FePcF16) were obtained from previous studies conducted on Au(100) and Cu(111) surfaces, respectively.94,97 They show similar relative intensities for both the σ* and π* ranges. Additionally, a noticeable difference between the F K-edge spectra at 0.5 nm and 3.0 nm thicknesses is observed in the experiment, whereas the calculated spectra closely resemble that of the 3.0 nm thickness. This observation suggests significant hybridizations occurring at the interface. Despite the similarity in lineshape, it is evident from the spectra at 10 degrees and the calculated spectrum that the C–F bonds are not entirely parallel to the surface.94
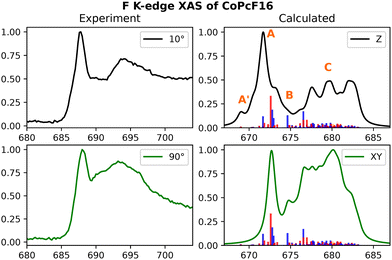 | ||
| Fig. 7 Experimental and calculated F K-edge spectra for CoPcF16. Only one 1s orbital per fluorine-type (Finner and Fouter) has been taking into account. The experimental results were adapted from a previous study on Au(100) surfaces.97 | ||
Referring to the origins of individual features, the low-energy small shoulder is denoted as A′, the mainline as A, the less-intense feature around 690 (675) in the experiment (calculated) as B, and the higher energy broad band as C. The low-energy shoulder A′ primarily consists of the ligand-centered eg-type acceptor orbitals mixing with the transition metal 3dxz and 3dyz orbitals in an anti-bonding fashion. For FePcF16, these transitions are found to be slightly more intense in the calculations. A closer look into the energetic positions of the aforementioned transitions can be found in ESI,† Fig. S10. The main feature at around 688 eV in the experiment stems from both π* and σ* based transitions. The NDO isodensity plots for the intense transitions are provided in ESI,† Fig. S16 (CoPcF16) and Fig. S17 (FePcF16).
3.3 Transition metal L-edges
Various approaches have been employed in prior research to simulate the L-edge region of metallophthalocyanines. For instance, Zhou and colleagues utilized ligand field multiplet calculations to focus on crystal field parameters for CoPc, determining its ground state symmetry to be 73% 2A1g 3d7 character and 27% 3d8![[L with combining low line]](https://www.rsc.org/images/entities/char_004c_0332.gif) component.75 Another study by Zhang et al. explored the structural anisotropy of CoPc films on Au(111) surfaces, employing multiplet ligand-field theory to analyze in-plane and out-of-plane transitions.82 Similar approaches have been applied to FePc simulations, where a 3E spin ground state is predominant.79,98 Recently, Lüder introduced a machine learning concept utilizing an artificial neural network (ANN) trained on a vast spectral database,99 while Carlotto et al. employed a DFT/ROCIS approach, suggesting ground state symmetries for MnPc and FePc based on DFT energetics from the BP86 functional.86
component.75 Another study by Zhang et al. explored the structural anisotropy of CoPc films on Au(111) surfaces, employing multiplet ligand-field theory to analyze in-plane and out-of-plane transitions.82 Similar approaches have been applied to FePc simulations, where a 3E spin ground state is predominant.79,98 Recently, Lüder introduced a machine learning concept utilizing an artificial neural network (ANN) trained on a vast spectral database,99 while Carlotto et al. employed a DFT/ROCIS approach, suggesting ground state symmetries for MnPc and FePc based on DFT energetics from the BP86 functional.86
In the present study, L-edge XAS was simulated using complete and restricted active space methods to accommodate the multiplets generated by 2p to 3d excitations. The valence active space consisted of metal-based 3d orbitals in a CASCI/NEVPT2 setup. In RAS calculations of FePc and MnPc, the active space was extended to include ligand-based HOMO, HOMO−1, and doubly degenerate LUMO orbitals.
| TMPc | Active space | Multiplicity | Nroots | SOCroots |
|---|---|---|---|---|
| CoPc | (13,8) | 4, 2 | 40, 115 | 390 |
| FePc | (12,8) | 5, 3, 1 | 35, 195, 170 | 930 |
| MnPc | (11,8) | 6, 4, 2 | 16, 174, 360 | 1512 |
3.3.1.1 CoPc. A comparison between experimental and calculated Co L-edge XAS spectra for CoPc is presented in Fig. 8. In addition to the strongly contracted variant of NEVPT2, the quasidegenerate formulation has also been examined, depicted in blue. The normalized total spectrum from calculations is compared with experimental data taken at an angle of 50 degrees. Features labeled (A–E) observed in the experiment at 90 degrees are marked in the subplot. The low-energy peak A at approximately 779 eV in the experiment intensifies as the beam angle transitions from 90 to 10 degrees, indicating contributions from both in-plane and out-of-plane components. Conversely, the intensity of peaks B and C decreases at grazing incidence angles. While the CASCI-based calculated spectrum provides a reasonable representation, the lineshapes suggest the need for energy refinement through dynamic electron correlation methods. Upon applying the strongly contracted version of NEVPT2, additional features emerge. Notably, all features observed in the experimental data are replicated in the spectra calculated using QD-NEVPT2. There exists a minor discrepancy in the intensity ratio of peaks B and C. However, considering that the experimental spectra involve a 3 nm thick film of CoPc while the calculation refers to an isolated CoPc molecule in the gas-phase, the agreement is astonishingly good.
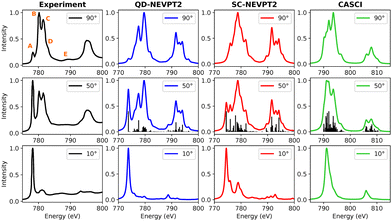 | ||
| Fig. 8 Experimental and calculated Co L-edge XAS for CoPc. The experimental results were adapted from a previous study on Ni(111) surfaces.100 | ||
The ground state identified at the CASCI level manifests as a spin quartet. However, following the NEVPT2 treatment, the 2A1g state emerges as the lowest energy state, underscoring the significance of dynamic electron correlation. In examining the excited states and their compositions contributing to peaks A–E, particular attention is given to the outcomes obtained with QD-NEVPT2, given its noteworthy alignment with experimental spectra. Notably, a single spin–orbit-coupled (SOC) transition in the low-energy range gives rise to peak A, comprising 80% 2px,y to dx2−y2 and 13% 2pz to dz2 excitations. The predominant in-plane character of this transition results in a high-intensity feature at grazing angles, while a weaker out-of-plane component is still discernible at 90 degrees. Features B–C–D encompass multiple out-of-plane transitions involving the dz2 orbital, exhibiting a notable decrease in intensity at grazing angles. Interestingly, feature E at higher energies is also successfully reproduced using a relatively minimal active space comprising solely 2p and 3d orbitals. These transitions are ascribed to SOC-coupled doublet + quartet type excitations characterized by various multiplet attributes.
3.3.1.2 FePc. The experimental and calculated Fe L-edge XAS spectra are depicted in Fig. 9. A Pc film thickness of 3 nm has been selected to rule out the interface hybridization effects (vide supra).72 Notably, features A–E are highlighted in the experimental spectra acquired at a 90-degree angle. Upon transitioning from a 90-degree to a 10-degree beam angle, feature A diminishes in intensity, while peak B assumes prominence as the mainline. Towards the higher energy range, features C–D–E exhibit reduced intensity at grazing angles.
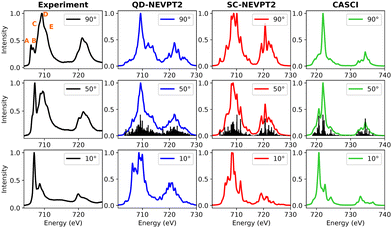 | ||
| Fig. 9 Experimental and calculated Fe L-edge XAS for FePc. Only the L3 edge is shown. The experimental results were adapted from a previous study by Peisert et al.72 | ||
Interestingly, a notable discrepancy between the experimental data and QD-NEVPT2 calculations is evident. Specifically, the calculated spectra at 50 and 10 degrees diverge significantly from their experimental counterparts. In contrast, the CASCI spectrum at 10 degrees bears a striking resemblance to the experimental data. This observation may suggest that while the valence active space captures crucial orbitals contributing to out-of-plane transitions, it may lack a comprehensive description of spectroscopically relevant in-plane orbitals.
The disparity observed between the experimental results and simulations may stem from various contributing factors. An irregular deposition of FePc moieties on the surface or significant hybridization between FePc layers could influence the observed spectra. Additionally, from a theoretical perspective, the size of the selected valence active space, crucial for characterizing the acceptor orbital manifold, is often a subject of debate. Consequently, to address these potential issues, a RASCI description incorporating additional ligand orbitals has been explored in Section 3.3.2.
3.3.1.3 MnPc. Manganese phthalocyanine (MnPc) stands out for having the highest number of available (unoccupied) 3d states among the considered set of TMPcs, leading to a multitude of final states upon excitation. Accordingly, the number of calculated roots is significantly higher than in the other cases (see Table 3) thereby prohibiting the application of the QD-NEVPT2 Ansatz owing to its high computational cost that scales quadratically with increasing number of roots.
In the experimental spectrum of MnPc, a broad L3 peak is evident at a beam angle of 90 degrees, as depicted in Fig. 10. The experimental data correspond to a 3.2 nm thick Pc layer and reveal three main features in the L3-edge, which reduce to two at grazing incidence. A similar trend is discernible in the spectra based on SC-NEVPT2, where features A and B intensify with a shift in the incidence of the synchrotron light from 90 to 10 degrees, albeit with slightly misaligned intensity ratios. Similar to the FePc case, the CASCI-based spectrum at 10 degrees provides a satisfactory representation at the grazing angle, yet the agreement is inadequate at 90 degrees of incidence. It is crucial to note the considerable variation in the L-edge spectra of MnPc, dependent on factors such as the thickness of the Pc layer and the surface used, thereby complicating the analysis. Hence, it is reiterated that a direct one-to-one mapping between the experiment and simulations may be impossible without taking into account the underlying surface.
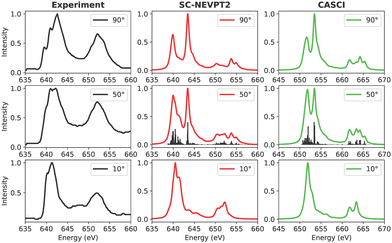 | ||
| Fig. 10 Experimental and calculated Mn L-edge XAS for MnPc. The experimental results were adapted from a previous study on Ag(111) surfaces.101 | ||
3.3.1.4 The effect of fluorination. In a study by Balle et al.,102 the L-edge XAS of fluorinated CoPc on Cu-intercalated surfaces was investigated. The thin film of CoPcF16, with a thickness of 3 nm, displayed spectral features similar to those of CoPc. A similar observation was made for FePcF16 on rutile TiO2 surfaces.103 Fig. S18, ESI† depicts the calculated L-edge XAS of CoPcF16, with the spectra for CoPc shown in grey for comparison. Despite minor variations in the relative intensities of the features, the calculated spectra did not reveal any additional peaks.
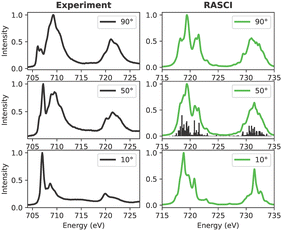 | ||
| Fig. 11 Experimental and calculated Fe L-edge XAS for FePc. The experimental results were adapted from a previous study by Peisert et al.72 | ||
4 Conclusions
This work provides an in-depth theoretical study of the electronic structure of a series of transition metal phtalocyanines with a particular emphasis on their ligand K-edge and transition metal L-edge absorption spectra. The different spectra for cobalt, iron, and manganese phthalocyanines have been simulated using tailored theoretical approaches, each designed for their respective spectral regions. Remarkable agreement between the TDDFT-calculated ligand K-shell spectra and experimental data is observed, particularly regarding their structural anisotropy. Different ground-state symmetries have been taken into account in the simulations where needed, and 2A1g, 3Eg and 4Eg states for Co, Fe and Mn centered phthalocyanines were found to be in agreement with the K-edge XAS of >2 nm thick films of TMPcs on various surfaces. The simulation of the fluorine K-edge of CoPcF16 and FePcF16, conducted for the first time, also showed success in reproducing the experiment, despite using only isolated metallophthalocyanines. While this spectral region for the TMPcF16 scaffold involves numerous transitions of both σ* and π* character within similar energy ranges, no noticeable difference in anisotropic characteristics across different transition metals was observed, except for the intensity ratio of the low-energy feature. This low-intensity shoulder present in the calculations shifted towards lower energy levels and exhibited increased intensity, particularly in the case of FePcF16. This difference constitutes the sole disparity noted within the experimental lineshape for the fluorine K-edge XAS.Modeling the L-edge XAS of TMPc molecules involved a CASCI and RASCI-based approach, depending on the need to include ligand orbitals in the active space. In the case of CoPc, employing a minimal active space comprising solely 2p and 3d orbitals proved adequate, resulting in significant concurrence, particularly when applying a quasi-degenerate formulation of second-order corrections. Nevertheless, the situation changed for MnPc and FePc, where all computed spectra notably exhibited deficiencies, particularly evident in in-plane transitions. To explore the influence of the active space configuration, the RASCI method was utilized, yielding the introduction of novel peaks in the simulated spectra, although the agreement was found to be still poor.
Despite extensive efforts to reproduce the L-edge spectra of FePc and MnPc, it remains unclear whether the observed discrepancies arise from employing rather minimal active spaces for the acceptor orbitals considering the extensive π-conjugation and the multitude of low-lying unoccupied ligand orbitals, or from the inability to model interface and bulk properties at an isolated substrate. Current findings, along with the previous works, suggest a conclusion that involves both reasons. To elucidate the influence of the surface on the computed spectra, theoretical studies of TMPcs on surface models as well as L-edge simulations with large active spaces are currently conducted in our lab and will be reported in due course.
5. Experimental spectra
• The K-edge experimental data for 2.2 nm thick CoPc layer on graphene/Pt(111) were taken from a study by Uihlein et al., with the title “Influence of Graphene on Charge Transfer between CoPc and Metals: The Role of Graphene-Substrate Coupling”.104 This article is an open access article distributed under the terms and conditions of the Creative Commons Attribution (CC BY) license (https://creativecommons.org/licenses/by/4.0/) Copyright © 2011, American Chemical Society.• The K-edge experimental curves of FePc on rutile TiO2(110) were adapted from a previous study of Karstens et al. with the title “FePc and FePcF16 on rutile TiO2(110) and (100): influence of the Substrate Preparation on the Interaction Strength”.103 Licensee MDPI, Basel, Switzerland. This article is an open access article distributed under the terms and conditions of the Creative Commons Attribution (CC BY) license (https://creativecommons.org/licenses/by/4.0/). Copyright © 2019 by the authors.
• The K-edge experimental spectra of a 3.3 nm thick MnPc layer on Ag(111) were taken from a previous study Petraki et al. with the title “Impact of the 3d Electronic States of Cobalt and Manganese Phthalocyanines on the Electronic Structure at the Interface to Ag(111)”.101 This article is an open access article distributed under the terms and conditions of the Creative Commons Attribution (CC BY) license (https://creativecommons.org/licenses/by/4.0/) Copyright © 2011, American Chemical Society.
• The fluorine K-edge experimental spectra of CoPcF16 were adapted from a previous study by Petraki et al. with the title “CoPc and CoPcF16 on gold: site-specific charge-transfer processes”.97 This is an Open Access article under the terms of the Creative Commons Attribution License (https://creativecommons.org/licenses/by/2.0), which permits unrestricted use, distribution, and reproduction in any medium, provided the original work is properly cited. The license is subject to the Beilstein Journal of Nanotechnology terms and conditions: (https://www.beilstein-journals.org/bjnano).
• The fluorine K-edge experimental spectra of FePcF16 were adapted from a previous study by Belser et al. with the title “Interaction Channels Between Perfluorinated Iron Phthalocyanine and Cu(111)”94 Copyright © 2018 Wiley-VCH Verlag GmbH & Co. KGaA, Weinheim.
• The L-edge experimental data for CoPc was taken from a previous article with the title “Communication: influence of graphene interlayers on the interaction between cobalt phthalocyanine and Ni(111)” by Uihlein et al.100 This is an Open Access article under the terms of the Creative Commons Attribution License (https://creativecommons.org/licenses/by/2.0), which permits unrestricted use, distribution, and reproduction in any medium, provided the original work is properly cited. The license is subject to the Beilstein Journal of Nanotechnology terms and conditions: (https://www.beilstein-journals.org/bjnano).
• The L-edge experimental results for FePc were adapted from a previous study on Ag(111) surfaces with the title “Charge transfer between transition metal phthalocyanines and metal substrates: the role of the transition metal” with permission from Elsevier.72 Copyright © 2015 Elsevier B.V. All rights reserved.
• The L-edge experimental data for MnPc was taken from a previous article with the title “Impact of the 3d Electronic States of Cobalt and Manganese Phthalocyanines on the Electronic Structure at the Interface to Ag(111)” by Petraki et al.101 This article is an open access article distributed under the terms and conditions of the Creative Commons Attribution (CC BY) license (https://creativecommons.org/licenses/by/4.0/) Copyright © 2011, American Chemical Society.
Author contributions
Esma B. Boydas: conceptualization; formal analysis; investigation; methodology; visualization; writing – original draft. Michael Roemelt: conceptualization; formal analysis; funding acquisition; resources; writing – review & editing.Data availability
The data supporting this article have been included as part of the ESI.†Conflicts of interest
There are no conflicts to declare.Acknowledgements
EBB thanks the Deutsche Forschungsgemeinschaft (DFG) for funding through Emmy-Noether grant RO 5688/1.Notes and references
- J. Xia, R. Cao and Q. Wu, RSC Adv., 2022, 1543–1550 Search PubMed.
- Z. Zhang, S. Yang, M. Dou, H. Liu, L. Gu and F. Wang, RSC Adv., 2016, 10808–10817 Search PubMed.
- M. O. Senge, N. N. Sergeeva and K. J. Hale, Chem. Soc. Rev., 2021, 1–32 Search PubMed.
- N. Lv, Q. Li, H. Zhu, S. Mu, X. Luo, X. Ren, X. Liu, S. Li, C. Cheng and T. Ma, Adv. Sci., 2023, 10, 2206239 CrossRef CAS PubMed.
- L. Milgrom, The Colours of Life: An Introduction to the Chemistry of Porphyrins and Related Compounds, Oxford University Press, 1997 Search PubMed.
- M. Wang and K. Ishii, Coord. Chem. Rev., 2022, 468, 214626 CrossRef CAS.
- M. V. Martínez-Díaz, G. de la Torre and T. Torres, Chem. Commun., 2010, 46, 7090–7108 RSC.
- S. Reineke, M. Thomschke, B. Lüssem and K. Leo, Rev. Mod. Phys., 2013, 85, 1245–1293 CrossRef CAS.
- D. Gounden, N. Nombona and W. E. van Zyl, Coord. Chem. Rev., 2020, 420, 213359 CrossRef CAS.
- Y. Wang, X. Li and J. Yang, Phys. Chem. Chem. Phys., 2019, 21, 5424–5434 RSC.
- J. Jiang and Ö. Bekaroğlu, Functional Phthalocyanine Molecular Materials, Springer, 2010 Search PubMed.
- S. Sanvito, Chem. Soc. Rev., 2011, 40, 3336–3355 RSC.
- O. I. Arillo-Flores, M. M. Fadlallah, C. Schuster, U. Eckern and A. H. Romero, Phys. Rev. B: Condens. Matter Mater. Phys., 2013, 87, 165115 CrossRef.
- H. Jiang, J. Ye, P. Hu, F. Wei, K. Du, N. Wang, T. Ba, S. Feng and C. Kloc, Sci. Rep., 2014, 4, 7573 CrossRef CAS PubMed.
- R. R. Cranston and B. H. Lessard, RSC Adv., 2021, 11, 21716–21737 RSC.
- M.-S. Liao, J. D. Watts, M.-J. Huang, S. M. Gorun, T. Kar and S. Scheiner, J. Chem. Theory Comput., 2005, 1, 1201–1210 CrossRef CAS PubMed.
- P. F. Siles, T. Hahn, G. Salvan, M. Knupfer, F. Zhu, D. R. T. Zahn and O. G. Schmidt, Nanoscale, 2016, 8, 8607–8617 RSC.
- M. Urbani, M.-E. Ragoussi, M. Nazeeruddin and T. Torres, Coord. Chem. Rev., 2019, 381, 1–64 CrossRef CAS.
- I. Bruder, J. Schöneboom, R. Dinnebier, A. Ojala, S. Schäfer, R. Sens, P. Erk and J. Weis, Org. Electron., 2010, 11, 377–387 CrossRef CAS.
- M.-S. Liao and S. Scheiner, J. Chem. Phys., 2001, 114, 9780–9791 CrossRef CAS.
- L. T. Ueno, C. C. Jayme, L. R. Silva, E. B. Pereira, S. M. de Oliveira and A. E. H. Machado, J. Braz. Chem. Soc., 2012, 23, 2237–2247 CrossRef CAS.
- G. A. Peralta, M. Seth and T. Ziegler, Inorg. Chem., 2007, 46, 9111–9125 CrossRef CAS PubMed.
- K. A. Nguyen and R. Pachter, J. Chem. Phys., 2001, 114, 10757–10767 CrossRef CAS.
- J. Mack and M. J. Stillman, J. Phys. Chem., 1995, 99, 7935–7945 CrossRef CAS.
- S. Krasnikov, A. Preobrajenski, N. Sergeeva, M. Brzhezinskaya, M. Nesterov, A. Cafolla, M. Senge and A. Vinogradov, Chem. Phys., 2007, 332, 318–324 CrossRef CAS.
- X. Wang, Y. Fu, D. Tranca, K. Jiang, J. Zhu, J. Zhang, S. Han, C. Ke, C. Lu and X. Zhuang, ACS Appl. Energy Mater., 2021, 4, 2891–2898 CrossRef CAS.
- J. E. Downes, C. McGuinness, P.-A. Glans, T. Learmonth, D. Fu, P. Sheridan and K. E. Smith, Chem. Phys. Lett., 2004, 390, 203–207 CrossRef CAS.
- F. Evangelista, A. Ruocco, R. Gotter, A. Cossaro, L. Floreano, A. Morgante, F. Crispoldi, M. G. Betti and C. Mariani, J. Chem. Phys., 2009, 131, 174710 CrossRef CAS PubMed.
- T. Schwieger, H. Peisert, M. S. Golden, M. Knupfer and J. Fink, Phys. Rev. B: Condens. Matter Mater. Phys., 2002, 66, 155207 CrossRef.
- N. Marom, X. Ren, J. E. Moussa, J. R. Chelikowsky and L. Kronik, Phys. Rev. B: Condens. Matter Mater. Phys., 2011, 84, 195143 CrossRef.
- M. V. Nardi, F. Detto, L. Aversa, R. Verucchi, G. Salviati, S. Iannotta and M. Casarin, Phys. Chem. Chem. Phys., 2013, 15, 12864–12881 RSC.
- I. Bidermane, I. Brumboiu, R. Totani, C. Grazioli, M. Shariati-Nilsson, H. Herper, O. Eriksson, B. Sanyal, B. Ressel, M. de Simone, L. Lozzi, B. Brena and C. Puglia, J. Electron Spectrosc. Relat. Phenom., 2015, 205, 92–97 CrossRef CAS.
- T. Kataoka, Y. Sakamoto, Y. Yamazaki, V. Singh, A. Fujimori, Y. Takeda, T. Ohkochi, S.-I. Fujimori, T. Okane, Y. Saitoh, H. Yamagami and A. Tanaka, Solid State Commun., 2012, 152, 806–809 CrossRef CAS.
- R. Kraus, M. Grobosch and M. Knupfer, Chem. Phys. Lett., 2009, 469, 121–124 CrossRef CAS.
- T. Kroll, R. Kraus, R. Schönfelder, V. Aristov, O. Molodtsova, P. Hoffmann and M. Knupfer, J. Chem. Phys., 2012, 137, 054306 CrossRef CAS PubMed.
- T. Kroll, V. Y. Aristov, O. V. Molodtsova, Y. A. Ossipyan, D. V. Vyalikh, B. Büchner and M. Knupfer, J. Phys. Chem. A, 2009, 113, 8917–8922 CrossRef CAS PubMed.
- T. Ichibha, Z. Hou, K. Hongo and R. Maezono, Sci. Rep., 2017, 7, 2011 CrossRef PubMed.
- A. J. Wallace, B. E. Williamson and D. L. Crittenden, Can. J. Chem., 2016, 94, 1163–1168 CrossRef CAS.
- D. Nachtigallova, A. Antalik, R. Lo, R. Sedlak, D. Manna, J. Tucek, J. Ugolotti, L. Veis, O. Legeza, J. Pittner, R. Zboril and P. Hobza, Chem. – Eur. J., 2018, 24, 13413–13417 CrossRef CAS PubMed.
- C. Angeli, R. Cimiraglia, S. Evangelisti, T. Leininger and J.-P. Malrieu, J. Chem. Phys., 2001, 114, 10252–10264 CrossRef CAS.
- C. Angeli, R. Cimiraglia and J.-P. Malrieu, J. Chem. Phys., 2002, 117, 9138–9153 CrossRef CAS.
- C. Angeli, S. Borini, M. Cestari and R. Cimiraglia, J. Chem. Phys., 2004, 121, 4043–4049 CrossRef CAS PubMed.
- F. Neese, Wiley Interdiscip. Rev.: Comput. Mol. Sci., 2018, 8, e1327 Search PubMed.
- A. D. Becke, Phys. Rev. A: At., Mol., Opt. Phys., 1988, 38, 3098–3100 CrossRef CAS PubMed.
- A. D. Becke, J. Chem. Phys., 1993, 98, 5648–5652 CrossRef CAS.
- F. Weigend and R. Ahlrichs, Phys. Chem. Chem. Phys., 2005, 7, 3297–3305 RSC.
- B. I. Dunlap, J. W. D. Connolly and J. R. Sabin, J. Chem. Phys., 1979, 71, 3396–3402 CrossRef CAS.
- O. Vahtras, J. Almlöf and M. W. Feyereisen, Chem. Phys. Lett., 1993, 213, 514–518 CrossRef CAS.
- F. Neese, J. Comput. Chem., 2003, 24, 1740–1747 CrossRef CAS PubMed.
- F. Neese, F. Wennmohs, A. Hansen and U. Becker, Chem. Phys., 2009, 356, 98–109 CrossRef CAS.
- R. Izsák and F. Neese, J. Chem. Phys., 2011, 135, 144105 CrossRef PubMed.
- R. Izsák, F. Neese and W. Klopper, J. Chem. Phys., 2013, 139, 094111 CrossRef PubMed.
- S. Grimme, J. Antony, S. Ehrlich and H. Krieg, J. Chem. Phys., 2010, 132, 154104 CrossRef PubMed.
- S. Grimme, S. Ehrlich and L. Goerigk, J. Comput. Chem., 2011, 32, 1456–1465 CrossRef CAS PubMed.
- S. DeBeer George, T. Petrenko and F. Neese, J. Phys. Chem. A, 2008, 112, 12936–12943 CrossRef CAS PubMed.
- J. Pipek and P. G. Mezey, J. Chem. Phys., 1989, 90, 4916–4926 CrossRef CAS.
- S. Hirata and M. Head-Gordon, Chem. Phys. Lett., 1999, 314, 291–299 CrossRef CAS.
- K. G. Dyall, J. Chem. Phys., 1994, 100, 2118–2127 CrossRef CAS.
- E. v Lenthe, E. J. Baerends and J. G. Snijders, J. Chem. Phys., 1993, 99, 4597–4610 CrossRef.
- E. van Lenthe, E. J. Baerends and J. G. Snijders, J. Chem. Phys., 1994, 101, 9783–9792 CrossRef CAS.
- A. Chantzis, J. K. Kowalska, D. Maganas, S. DeBeer and F. Neese, J. Chem. Theory Comput., 2018, 14, 3686–3702 CrossRef CAS PubMed.
- M. Roemelt, D. Manganas, S. DeBeer and F. Neese, J. Chem. Phys., 2013, 138, 204101 CrossRef PubMed.
- M. Douglas and N. M. Kroll, Ann. Phys., 1974, 82, 89–155 CAS.
- B. A. Hess, Phys. Rev. A: At., Mol., Opt. Phys., 1986, 33, 3742–3748 CrossRef CAS PubMed.
- L. Visscher and K. G. Dyall, At. Data Nucl. Data Tables, 1997, 67, 207–224 CrossRef CAS.
- W. A. de Jong, R. J. Harrison and D. A. Dixon, J. Chem. Phys., 2001, 114, 48–53 CrossRef CAS.
- N. B. Balabanov and K. A. Peterson, J. Chem. Phys., 2005, 123, 064107 CrossRef PubMed.
- N. B. Balabanov and K. A. Peterson, J. Chem. Phys., 2006, 125, 074110 CrossRef PubMed.
- G. L. Stoychev, A. A. Auer and F. Neese, J. Chem. Theory Comput., 2017, 13, 554–562 CrossRef CAS PubMed.
- A. Khedkar and M. Roemelt, J. Chem. Theory Comput., 2019, 15, 3522–3536 CrossRef CAS PubMed.
- A. Khedkar and M. Roemelt, J. Chem. Theory Comput., 2020, 16, 4993–5005 CrossRef CAS PubMed.
- H. Peisert, J. Uihlein, F. Petraki and T. Chassé, J. Electron Spectrosc. Relat. Phenom., 2015, 204, 49–60 CrossRef CAS.
- R. De Francesco, M. Stener and G. Fronzoni, J. Phys. Chem. A, 2012, 116, 2885–2894 CrossRef CAS PubMed.
- M. K. Engel, ChemInform, 2003, 34, 1–3 Search PubMed.
- J. Zhou, L. Zhang, Z. Hu, C. Kuo, H. Liu, X. Lin, Y. Wang, T.-W. Pi, J. Wang and S. Zhang, AIP Adv., 2016, 6, 035306 CrossRef.
- J. Laurent, J. Bozek, M. Briant, P. Çarçabal, D. Cubaynes, A. Milosavljević, R. Püttner, N. Shafizadeh, M. Simon, B. Soep and G. Goldsztejn, Phys. Chem. Chem. Phys., 2022, 24, 2656–2663 RSC.
- J. Fernández-Rodríguez, B. Toby and M. van Veenendaal, Phys. Rev. B: Condens. Matter Mater. Phys., 2015, 91, 214427 CrossRef.
- K. Liu, Y. Lei and G. Wang, J. Chem. Phys., 2013, 139, 204306 CrossRef PubMed.
- P. S. Miedema, M. M. van Schooneveld, R. Bogerd, T. C. R. Rocha, M. Hävecker, A. Knop-Gericke and F. M. F. de Groot, J. Phys. Chem. C, 2011, 115, 25422–25428 CrossRef CAS.
- M. Linares, S. Stafström, Z. Rinkevicius, H. Ågren and P. Norman, J. Phys. Chem. B, 2011, 115, 5096–5102 CrossRef CAS PubMed.
- E. B. Boydas, B. Winter, D. Batchelor and M. Roemelt, Int. J. Quantum Chem., 2021, 121, e26515 CrossRef CAS.
- T. Zhang, I. E. Brumboiu, V. Lanzilotto, J. Lüder, C. Grazioli, E. Giangrisostomi, R. Ovsyannikov, Y. Sassa, I. Bidermane, M. Stupar, M. de Simone, M. Coreno, B. Ressel, M. Pedio, P. Rudolf, B. Brena and C. Puglia, J. Phys. Chem. C, 2017, 121, 26372–26378 CrossRef CAS.
- B. Brena, B. Sanyal and H. C. Herper, J. Phys. Chem. C, 2020, 124, 27185–27193 CrossRef CAS.
- C. G. Barraclough, R. L. Martin, S. Mitra and R. C. Sherwood, J. Chem. Phys., 1970, 53, 1638–1642 CrossRef CAS.
- H. Yamada, T. Shimada and A. Koma, J. Chem. Phys., 1998, 108, 10256–10261 CrossRef CAS.
- S. Carlotto, M. Sambi, F. Sedona, A. Vittadini and M. Casarin, Nanomaterials, 2020, 11, 54 CrossRef PubMed.
- F. Petraki, H. Peisert, P. Hoffmann, J. Uihlein, M. Knupfer and T. Chassé, J. Phys. Chem. C, 2012, 116, 5121–5127 CrossRef CAS.
- S. Mitra, A. K. Gregson, W. E. Hatfield and R. R. Weller, Inorg. Chem., 1983, 22, 1729–1732 CrossRef CAS.
- F. Frati, F. de Groot, J. Cerezo, F. Santoro, L. Cheng, R. Faber and S. Coriani, J. Chem. Phys., 2019, 151, 064107 CrossRef.
- A. Banerjee, V. V. da Cruz, V. Ekholm, C. Såthe, J.-E. Rubensson, N. Ignatova, F. Gel'mukhanov and M. Odelius, Phys. Rev. A, 2023, 108, 023103 CrossRef CAS.
- J. Stierhof, S. Kühn, M. Winter, P. Micke, R. Steinbrügge, C. Shah, N. Hell, M. Bissinger, M. Hirsch, R. Ballhausen, M. Lang, C. Gräfe, S. Wipf, R. Cumbee, G. L. Betancourt-Martinez, S. Park, J. Niskanen, M. Chung, F. S. Porter, T. Stöhlker, T. Pfeifer, G. V. Brown, S. Bernitt, P. Hansmann, J. Wilms, J. R. Crespo López-Urrutia and M. A. Leutenegger, Eur. Phys. J. D, 2022, 76, 38 CrossRef CAS PubMed.
- G. Mangione, S. Carlotto, M. Sambi, G. Ligorio, M. Timpel, A. Vittadini, M. V. Nardi and M. Casarin, Phys. Chem. Chem. Phys., 2016, 18, 18727–18738 RSC.
- G. Mangione, M. Sambi, S. Carlotto, A. Vittadini, G. Ligorio, M. Timpel, L. Pasquali, A. Giglia, M. V. Nardi and M. Casarin, Phys. Chem. Chem. Phys., 2016, 18, 24890–24904 RSC.
- A. Belser, R. Karstens, P. Nagel, M. Merz, S. Schuppler, T. Chassé and H. Peisert, Phys. Status Solidi B, 2019, 256, 1800292 CrossRef.
- M. Klues, P. Jerabek, T. Breuer, M. Oehzelt, K. Hermann, R. Berger and G. Witte, J. Phys. Chem. C, 2016, 120, 12693–12705 CrossRef CAS.
- D. G. de Oteyza, A. Sakko, A. El-Sayed, E. Goiri, L. Floreano, A. Cossaro, J. M. Garcia-Lastra, A. Rubio and J. E. Ortega, Phys. Rev. B: Condens. Matter Mater. Phys., 2012, 86, 075469 CrossRef.
- F. Petraki, H. Peisert, J. Uihlein, U. Aygül and T. Chassé, Beilstein J. Nanotechnol., 2014, 5, 524–531 CrossRef PubMed.
- P. S. Miedema, S. Stepanow, P. Gambardella and F. M. F. de Groot, J. Phys.: Conf. Ser., 2009, 190, 012143 CrossRef.
- J. Lüder, Phys. Rev. B, 2021, 103, 045140 CrossRef.
- J. Uihlein, H. Peisert, M. Glaser, M. Polek, H. Adler, F. Petraki, R. Ovsyannikov, M. Bauer and T. Chassé, J. Chem. Phys., 2013, 138, 081101 CrossRef PubMed.
- F. Petraki, H. Peisert, F. Latteyer, U. Aygül, A. Vollmer and T. Chassé, J. Phys. Chem. C, 2011, 115, 21334–21340 CrossRef CAS.
- D. Balle, H. Adler, P. Grüninger, R. Karstens, R. Ovsyannikov, E. Giangrisostomi, T. Chassé and H. Peisert, J. Phys. Chem. C, 2017, 121, 18564–18574 CrossRef CAS.
- R. Karstens, M. Glaser, A. Belser, D. Balle, M. Polek, R. Ovsyannikov, E. Giangrisostomi, T. Chassé and H. Peisert, Molecules, 2019, 24, 4579 CrossRef CAS PubMed.
- J. Uihlein, M. Polek, M. Glaser, H. Adler, R. Ovsyannikov, M. Bauer, M. Ivanovic, A. B. Preobrajenski, A. V. Generalov, T. Chassé and H. Peisert, J. Phys. Chem. C, 2015, 119, 15240–15247 CrossRef CAS.
Footnote |
| † Electronic supplementary information (ESI) available. See DOI: https://doi.org/10.1039/d4cp01900h |
| This journal is © the Owner Societies 2024 |

