A metal–organic framework-based fluorescence resonance energy transfer nanoprobe for highly selective detection of Staphylococcus Aureus†
Jing
Qiao‡
 ,
Xuanbo
Chen‡
,
Xingliang
Xu
,
Ben
Fan
,
Ying-Shi
Guan
*,
Hong
Yang
* and
Quan
Li
,
Xuanbo
Chen‡
,
Xingliang
Xu
,
Ben
Fan
,
Ying-Shi
Guan
*,
Hong
Yang
* and
Quan
Li
 *
*
Institute of Advanced Materials and School of Chemistry and Chemical Engineering, Southeast University, Nanjing 211189, China. E-mail: gyshi412@seu.edu.cn; yangh@seu.edu.cn; quanli3273@gmail.com
First published on 9th August 2023
Abstract
Survival and infection of pathogenic bacteria, such as Staphylococcus aureus (S. aureus), pose a serious threat to human health. Efficient methods for recognizing and quantifying low levels of bacteria are imperiously needed. Herein, we introduce a metal–organic framework (MOF)-based fluorescence resonance energy transfer (FRET) nanoprobe for ratiometric detection of S. aureus. The nanoprobe utilizes blue-emitting 7-hydroxycoumarin-4-acetic acid (HCAA) encapsulated inside zirconium (Zr)-based MOFs as the energy donor and green-emitting fluorescein isothiocyanate (FITC) as the energy acceptor. Especially, vancomycin (VAN) is employed as the recognition moiety to bind to the cell wall of S. aureus, leading to the disassembly of VAN-PEG-FITC from MOF HCAA@UiO-66. As the distance between the donor and acceptor increases, the donor signal correspondingly increases as the FRET signal decreases. By calculating the fluorescence intensity ratio, S. aureus can be quantified with a dynamic range of 1.05 × 10³–1.05 × 10⁷ CFU mL−1 and a detection limit of 12 CFU mL−1. Due to the unique high affinity of VAN to S. aureus, the nanoprobe shows high selectivity and sensitivity to S. aureus, even in real samples like lake water, orange juice, and saliva. The FRET-based ratiometric fluorescence bacterial detection method demonstrated in this work has a prospect in portable application and may reduce the potential threat of pathogens to human health.
1. Introduction
Pathogenic bacteria-induced food contamination, infectious diseases, and surgical infections have seriously threatened human health.1–3 Among these pathogens, Staphylococcus aureus (S. aureus) is a typical foodborne and widespread Gram-positive bacterium, causing a wide range of infections, such as purulency, septicemia, pneumonia, and pericarditis.4,5 Classical approaches for S. aureus detection and identification include culture-based bacterial detection, polymerase chain reaction (PCR), and enzyme-linked immunosorbent assay (ELISA).6,7 Although these methods are fundamentally reliable, their sophisticated processes, long operation times, and high cost have limited their application. Therefore, developing a low-cost, rapid, and susceptible method for S. aureus detection is imperiously needed.Compared to traditional analytical methods for bacteria detection, fluorescent sensors present a promising outlook owing to their high signal-to-noise ratio, simplicity, rapidity, and low cost. Various fluorescent nanomaterials, including quantum dots, carbon nanoparticles, and metal nanoparticles, have been developed for bacteria detection and sensing.8–13 Metal–organic frameworks (MOFs) consist of metal ions (clusters) as nodes and organic ligands as linkers. Their high structure regularity, surface area, and porosity make them attractive candidates for diverse biological applications such as drug delivery, biocatalysts, and sensing.14–18 However, most of the existing MOF-based fluorescent nanoprobes utilize fluorescence enhancement or quenching at a single wavelength, which can be susceptible to external conditions such as probe concentrations, voltage fluctuations in the instrument, and test temperature.19–23 Ratiometric fluorescent probes, particularly based on fluorescence resonance energy transfer (FRET), can offer fluorescence intensity changes at two or more wavelengths of an excitation or emission spectrum, providing self-calibration without external interference and significantly improving detection reliability.24–29 The well-defined structure, ultrahigh surface area, and high porosity of MOFs make them promising platforms for integrating the FRET pairs.30–32 Although there have been some recent reports on MOF-based ratiometric fluorescence probes,33–35 their FRET-integrated design and further applications in bacteria detection are still in an immature primary stage. Designing high-performance MOF-based ratiometric sensors to achieve high sensitivity and specificity remains a challenge. Constructing a flexible and versatile FRET MOF scaffold remains formidable. A polymer/MOF hybrid material through self-assembly is a valuable alternative to introduce functional groups into MOFs to exploit efficient fluorescent sensors.
In this work, we report a MOF-based FRET ratiometric nanoprobe for detecting S. aureus. The blue-emitting 7-hydroxycoumarin-4-acetic acid encapsulated inside a zirconium (Zr)-based MOF (denoted as HCAA@UiO-66) and the green-emitting fluorescein isothiocyanate (FITC) are employed as the energy donor and acceptor, respectively. Especially, vancomycin (VAN) acts as a targeting ligand, covalently linked to the FITC-modified polyethylene glycol (denoted as VAN-PEG-FITC). As illustrated in Scheme 1, VAN-PEG-FITC can assemble on the surface of HCAA@UiO-66 to obtain the nanoprobe VAN-PEG-FITC/HCAA@UiO-66. Without S. aureus, the green fluorescence of FITC at 520 nm can be observed from VAN-PEG-FITC/HCAA@UiO-66 due to the energy transfer from HCAA to FITC. While in the presence of S. aureus, VAN can interact with bacteria cell walls by forming hydrogen bonds with the terminal D-alanyl-D-alanine (D-Ala-D-Ala) moieties,36 leading to the disassembly of VAN-PEG-FITC from MOF HCAA@UiO-66. As the distance between the donor and the acceptor increases, this FRET system will be disturbed, leading to the recovery of HCAA fluorescence. More importantly, highly selective detection of S. aureus over other representative interfering bacteria is also achieved because of the unique high affinity of VAN to S. aureus. Based on this system, a highly sensitive and selective ratiometric nanoprobe for S. aureus can be developed.
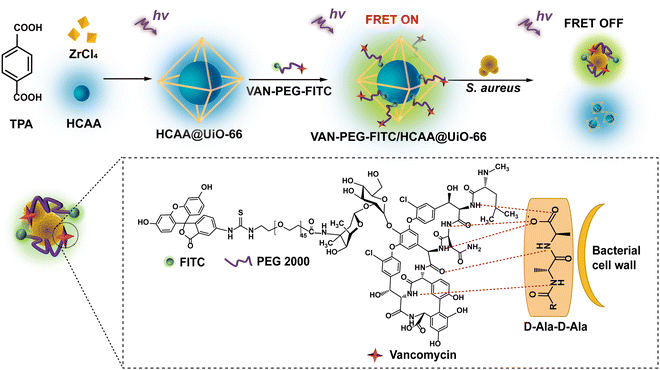 | ||
| Scheme 1 Schematic interpretation of the FRET ratiometric fluorescent detection of S. aureus using VAN-PEG-FITC/HCAA@UiO-66. | ||
2. Experimental
2.1. Materials and measurements
FITC-PEG-COOH (MW: 2000 Da) was obtained from MeloPEG Co. Ltd. Zirconium(IV) chloride (ZrCl4), terephthalic acid (TPA), 7-hydroxycoumarin-4-acetic acid (HCAA), 1-(3-dimethylaminopropyl)-3-ethylcarbodiimide hydrochloride (EDC·HCl), 1-hydroxybenzotriazole (HOBt) and vancomycin hydrochloride (VAN) were purchased from Sigma-Aldrich. Mueller-Hinton Agar (MHA) media and Mueller-Hinton Broth (MHB) media were supplied by Acmec Biochemical Co. Ltd. The other chemicals were purchased from Sinopharm Chemical Reagent Co. Ltd. All chemicals were used without further purification.
1H NMR spectra were recorded using a Bruker Advance 600 MHz spectrometer with dimethyl sulfoxide-d6 (DMSO-d6) as the solvent. Matrix-assisted laser desorption ionization-time of flight mass spectrometry (MALDI-TOF-MS) was obtained by Bruker autoflex maX. X-Ray diffraction (XRD) analysis was carried out using a RigakuD/Max-3c diffractometer. N2 adsorption isotherms and the pore size distribution were obtained by using an automatic surface area and porosity analyzer (Micromeritics TriStar II plus). UV-Vis spectra were recorded using a spectrophotometer (Shimadzu UV). Confocal laser scanning microscopy (CLSM) images were captured with Olympus FV3000. Transmission electron microscopy (TEM) was performed on a JEM-2100plus instrument with an acceleration voltage of 120 kV, and a scanning electron microscope (SEM) was performed on a Hitachi Regulus8100 equipped with acceleration voltage (20 kV). Particle size and Zeta potential were measured with a Zeta-sizer analyzer (NanoBrook Omni). Flow cytometry analysis was recorded on the ACEA NovoCyte Flow Cytometer with a 488![[thin space (1/6-em)]](https://www.rsc.org/images/entities/char_2009.gif) nm laser and emission filters for FITC.
nm laser and emission filters for FITC.
2.2. Preparation of HCAA@UiO-66
HCAA@UiO-66 was prepared according to the literature with little modifications.37 A mixture of ZrCl4 (200 mg, 0.86 mmol), TPA (200 mg, 0.88 mmol), and HCAA (300 mg, 1.36 mmol) in 30 mL N,N′-dimethylformamide (DMF) was stirred magnetically for 20 min. Subsequently, 3 mL of acetic acid was also added and stirred continuously for 10 minutes. The resulting mixture was transferred to a sealed 50 mL Teflon-lined stainless autoclave and maintained at 120 °C for 24 hours. Following centrifugation and washing with fresh DMF and methanol (MeOH), a pale-yellow powder was obtained. Finally, the product was dried at 80 °C for 5 h under vacuum. The same procedures were used to prepare the control sample of pure UiO-66 without adding HCAA.2.3. Synthesis of VAN-PEG-FITC
EDC·HCl (9.68 mg, 0.06 mmol) and HOBt (6.45 mg, 0.06 mmol) were added to a solution of FITC-PEG-COOH (120 mg, 0.05 mmol) in 5.0 mL of anhydrous dimethylsulfoxide (DMSO). The resulting mixture was then stirred in an ice bath for 30 min. Subsequently, vancomycin hydrochloride (111.4 mg, 0.075 mmol) was added, and the resulting mixture was stirred at room temperature for 48 h. The product was then precipitated with cold ether and redissolved in deionized (DI) water. Finally, the aqueous solution of the product was subjected to dialysis (MWCO: 1000 Da) against DI water to remove the free vancomycin and further lyophilized, ultimately obtaining the yellow solid of VAN-PEG-FITC.2.4. Optimization of donor to acceptor ratios
A suspension of 1 mL of HCAA@UiO-66 at a concentration of 1 mg mL−1 was combined with 1 mL of VAN-PEG-FITC aqueous solution at varying concentrations. The resulting mixtures were subjected to fluorescence spectroscopy with an excitation at 320 nm. To optimize the feed ratio of donor to acceptor, the emission intensity ratio at 440 and 520 nm (I440/I520) was calculated. The same procedures were applied to the control group of FITC-PEG-COOH.2.5. Preparation of VAN-PEG-FITC/HCAA@UiO-66
1 mL of VAN-PEG-FITC (1 mg mL−1) aqueous solution with 1 mL of HCAA@UiO-66 (5 mg mL−1) were mixed and stirred magnetically at room temperature for 40 min. Following centrifugation, the solid composite obtained was washed with DI water to remove the free VAN-PEG-FITC molecule and redispersed it in 5 mL of saline (pH = 7.2). The final composite suspension was diluted 2 and 4 times, and their emission spectra were measured to confirm the stability of VAN-PEG-FITC/HCAA@UiO-66. In addition, the absorbance of the supernatant was measured at 450 nm to evaluate the loading content of VAN-PEG-FITC on the MOF. The same procedures were employed with preparing PEG-FITC/HCAA@UiO-66, but VAN-PEG-FITC was replaced by PEG-FITC.2.6. Microbial culture
Staphylococcus aureus (S. aureus, ATCC 25923), Staphylococcus epidermidis (S. epidermidis, CMCC 26069), Pseudomonas aeruginosa (P. aeruginosa, ATCC 27853), Escherichia coli (E. coli, ATCC 25922), and Acinetobacter baumannii (A. baumannii, ATCC 19606) were obtained from the China General Microbiological Culture Collection Center. From the frozen stock solution (−80 °C), bacteria were inoculated into MHA plates under aerobic conditions at 37 °C for 24 h. A single bacterial colony was inoculated into the MHB media and grown to the stationary phase. The concentration of bacteria was monitored by calculating the optical density (OD) at a wavelength of 600 nm (OD600). In addition, the number of bacterial colony-forming units (CFUs) was determined using the plate counting method.2.7. Fluorescence assay of VAN-PEG-FITC/HCAA@UiO-66 with bacterial solutions
Typically, 0.25 mg mL−1 of VAN-PEG-FITC/HCAA@UiO-66 suspensions were mixed with varying concentrations of S. aureus, ranging from 0 to 1.05 × 10⁷ CFU mL−1, in a saline solution (pH = 7.2). The mixture was then incubated at 37 °C for 15 min. Subsequently, the fluorescence spectra of the mixtures were recorded upon 320 nm excitation. The concentration of S. aureus was calculated by using the emission intensity ratio I440/I520. To study the selectivity of this nanoprobe, 0.25 mg mL−1 of VAN-PEG-FITC/HCAA@UiO-66 was incubated with solutions of S. aureus, S. epidermidis, P. aeruginosa, E. coli, A. baumanni and bacterial mixture with OD600 = 0.01. The same procedures were employed with PEG-FITC/HCAA@UiO-66. All error bars represent standard deviations from three repeated experiments.2.8. Bacterial targeting of VAN-PEG-FITC/HCAA@UiO-66
The determination of bacterial targeting was carried out through the incubation of bacteria with VAN-PEG-FITC/HCAA@UiO-66. Bacterial cells were first inoculated in a 4 mL of MHB medium and allowed to grow to a stationary phase at 37 °C with shaking at 240 rpm. After incubation, bacteria were washed thrice by centrifugation (10![[thin space (1/6-em)]](https://www.rsc.org/images/entities/char_2009.gif) 000 rpm for 10 min) and resuspended in saline to the required concentration. The bacterial solution (OD600 = 0.1) was then mixed with the VAN-PEG-FITC/HCAA@UiO-66 suspension to a final concentration of 0.25 mg mL−1 and incubated for 15 min at 37 °C with shaking. The mixture was fixed with 4% paraformaldehyde solution for 15 min, then seeded on a poly-D-lysine coated confocal dish, washed twice, and imaged with CLSM. To achieve excitation of the HCAA fluorophore, a 405 nm laser was employed. Similarly, a 488 nm laser was utilized for the excitation of FITC. Procedures for mixed interference groups were the same, except that S. aureus was combined with solutions of P. aeruginosa, E. coli, and A. baumanni in equal proportions, separately. The control groups underwent the same procedures but with the substitution of PEG-FITC/HCAA@UiO-66 for VAN-PEG-FITC/HCAA@UiO-66. Flow cytometry analysis was also used to evaluate the interactions between VAN-PEG-FITC/HCAA@UiO-66 and bacteria. Bacterial solutions with an OD600 of 0.1 and VAN-PEG-FITC/HCAA@UiO-66 at a concentration of 0.25 mg mL−1 were incubated for 15 min and then fixed with 4% paraformaldehyde for 15 min. PEG-FITC/HCAA@UiO-66 treated and untreated groups were performed as the control. All samples were detected using flow cytometry with a 488 nm laser and emission filters for FITC.
000 rpm for 10 min) and resuspended in saline to the required concentration. The bacterial solution (OD600 = 0.1) was then mixed with the VAN-PEG-FITC/HCAA@UiO-66 suspension to a final concentration of 0.25 mg mL−1 and incubated for 15 min at 37 °C with shaking. The mixture was fixed with 4% paraformaldehyde solution for 15 min, then seeded on a poly-D-lysine coated confocal dish, washed twice, and imaged with CLSM. To achieve excitation of the HCAA fluorophore, a 405 nm laser was employed. Similarly, a 488 nm laser was utilized for the excitation of FITC. Procedures for mixed interference groups were the same, except that S. aureus was combined with solutions of P. aeruginosa, E. coli, and A. baumanni in equal proportions, separately. The control groups underwent the same procedures but with the substitution of PEG-FITC/HCAA@UiO-66 for VAN-PEG-FITC/HCAA@UiO-66. Flow cytometry analysis was also used to evaluate the interactions between VAN-PEG-FITC/HCAA@UiO-66 and bacteria. Bacterial solutions with an OD600 of 0.1 and VAN-PEG-FITC/HCAA@UiO-66 at a concentration of 0.25 mg mL−1 were incubated for 15 min and then fixed with 4% paraformaldehyde for 15 min. PEG-FITC/HCAA@UiO-66 treated and untreated groups were performed as the control. All samples were detected using flow cytometry with a 488 nm laser and emission filters for FITC.
2.9. Recovery tests in real samples
A demonstration of the practical application of this FRET-based nanoprobe was conducted to detect S. aureus in spiked samples of lake water, orange juice, and saliva. Real samples were initially diluted 10-fold with saline (pH = 7.2). Then, VAN-PEG-FITC/HCAA@UiO-66 (0.25 mg mL−1) suspensions were incubated with S. aureus suspensions in diluted real samples with final concentrations of 1 × 10⁴, 2 × 10⁵, and 5 × 10⁵ CFU mL−1. After 15 min of incubation, the emission spectra were recorded for quantifying S. aureus in spiked real samples.3. Results and discussion
3.1. Preparation and characterization of VAN-PEG-FITC/HCAA@UiO-66 nanoprobes
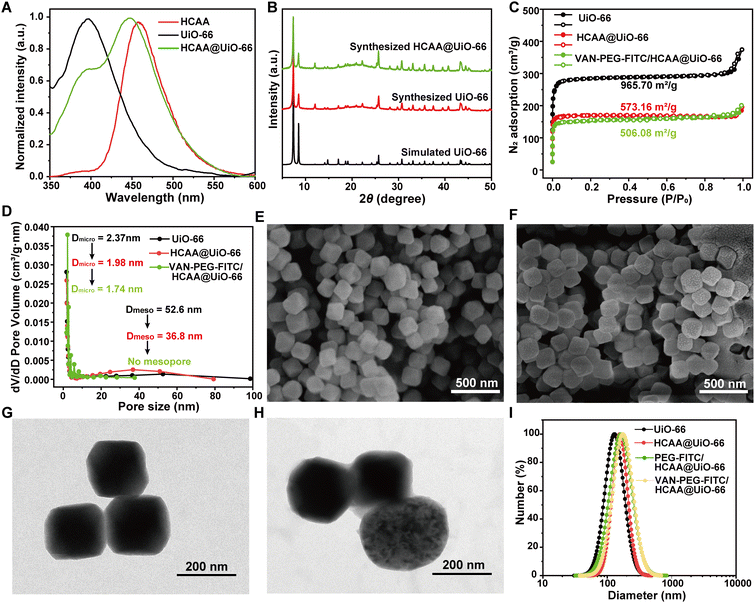
The FRET ratiometric nanoprobe includes the donor of HCAA@UiO-66 and the acceptor of VAN-PEG-FITC. The detailed preparation of HCAA@UiO-66 is presented in the Experimental Section. We have studied the fluorescence behavior of HCAA, UiO-66, and HCAA@UiO-66. As shown in Fig. 1A, the emission band of HCAA and UiO-66 is centered at 396 nm and 450 nm, respectively. The emission band of HCAA@UiO-66 exhibits a distinct contribution from HCAA and UiO-66 components, indicating the successful fabrication of HCAA@UiO-66. The loading content of HCAA in HCAA@UiO-66 could be measured according to the absorbance of HCAA and UiO-66 at 270 and 325 nm, respectively. With the calibration curves, the loading content of HCAA was determined to be 0.54% (Fig. S1–S2, ESI†). The powder X-ray diffraction (PXRD) was used to characterize the UiO-66. As shown in Fig. 1B, the experimental PXRD of UiO-66 is consistent with the simulated PXRD, exhibiting several distinct diffraction peaks at 7.4°, 8.5°, 25.7° and 30.7°. The PXRD of HCAA@UiO-66 shows negligible change compared to pure UiO-66, demonstrating that encapsulation of HCAA did not affect its crystallinity.VAN-PEG-FITC was synthesized by coupling FITC-PEG-COOH and VAN-NH2 (Fig. S5, ESI†) and confirmed by 1H NMR and MALDI-TOF-MS (Fig. S6 and S7A, ESI†). VAN-PEG-FITC was absorbed onto the surfaces of HCAA@UiO-66 nanoparticles through incubation in an aqueous solution. Then the excess polymer was removed to give the nanoprobe VAN-PEG-FITC/HCAA@UiO-66. The porosity and surface area of UiO-66 nanoparticles before and after modification were evaluated using N2 adsorption–desorption isotherms. The BET surface area of HCAA@UiO-66 decreases from 965.70 m2 g−1 to 573.16 m2 g−1 compared to neat UiO-66. Additionally, the micropore and mesopore distributions decrease from 2.37 nm and 52.6 nm to 1.98 nm and 36.8 nm, respectively (Fig. 1C and D). These results suggest that the encapsulation of HCAA was successful. Following the coating of VAN-PEG-FITC/HCAA, it has been observed that both the BET surface area and micropore distributions undergo a further decrease, resulting in values of 506.08 m2 g−1 and 1.74 nm, respectively. The FTIR spectra of polymer-coated HCAA@UiO-66 showed spectral changes corresponding to the formation of new bands at 2878 cm−1 (–CH2 stretching) and 1100 cm−1 (C–O–C stretching), which confirmed the VAN-PEG-FITC or PEG-FITC existence in the MOF-based composite (Fig. S7B, ESI†). It is worth noting that no mesopores were detected. SEM and TEM images (Fig. 1E–H) show that HCAA@UiO-66 has an octahedral structure and an average size of around 150 nm, with no significant changes with pure UiO-66 (Fig. S8, ESI†). As shown in Fig. 1F, the distinctive octahedral shape was retained after VAN-PEG-FITC coating. Furthermore, a polymer layer was uniformly covered on the HCAA@UiO-66 from the TEM images (Fig. 1H). DLS analysis also shows an increase in average particle size from 130 nm for UiO-66 to 156 nm for HCAA@UiO-66. Similarly, PEG-FITC and VAN-PEG-FITC coated HCAA@UiO-66 samples also show a slight increase in particle sizes to 160 nm and 173 nm, respectively (Fig. 1I). The DLS changes further indicate the successful adsorption of PEG-FITC or VAN-PEG-FITC on the HCAA@UiO-66 crystal surface.
3.2. Optimize the FRET Properties of VAN-PEG-FITC/HCAA@UiO-66 nanoprobe
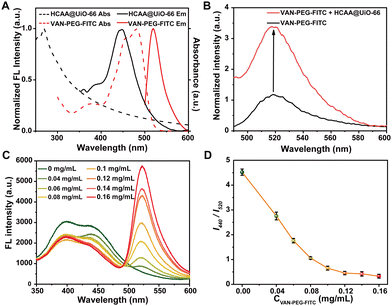
To verify whether FITC and HCAA in the VAN-PEG-FITC/HCAA@UiO-66 nanoprobe can form an efficient FRET system, we measured the absorption and emission spectra for both VAN-PEG-FITC and HCAA@UiO-66. As demonstrated in Fig. 2A, VAN-PEG-FITC displays obvious absorption in the range of 425–500 nm, which overlaps well with the emission band of HCAA@UiO-66. Compared with free VAN-PEG-FITC, the fluorescence intensity at 520 nm is 3.4 times enhanced by introducing HCAA@UiO-66 as the energy donor (Fig. 2B), suggesting that HCAA@UiO-66 and VAN-PEG-FITC can serve as a donor–acceptor pair to form an efficient FRET system. Furthermore, we measured the fluorescence lifetime of HCAA@UiO-66 before and after VAN-PEG-FITC absorbed on the surface of HCAA@UiO-66 (Fig. S9, ESI†). The fluorescence lifetime of 440 nm decreased from 2.62 ns (HCAA@UiO-66) to 1.69 ns (VAN-PEG-FITC/HCAA@UiO-66), confirming the energy transfer from HCAA to FITC in this nanoprobe system. Overall, the above results have clearly demonstrated the feasibility of UiO-66 as a scaffold to construct a self-assembled FRET system with HCAA as the energy donor and FITC as the energy acceptor.To prepare highly fluorescent particles, we then optimized the donor–acceptor ratio. We measured the fluorescence spectra of the VAN-PEG-FITC/HCAA@UiO-66 nanocomposite system upon the addition of increasing concentration of VAN-PEG-FITC to 0.25 mg mL−1 of HCAA@UiO-66 in aqueous solution at pH 7.2 (Fig. 2C). As expected, the donor emission band centered at 440 nm decreased, while the acceptor emission peak at 520 nm increased.
A plot of fluorescence intensity ratio (I440/I520) against VAN-PEG-FITC concentration is depicted in Fig. 2D. I440/I520 decreases gradually in the range of 0–0.12 mg mL−1, then remains stable until 0.16 mg mL−1 due to excessive acceptor. Consequently, 0.1 mg mL−1 of VAN-PEG-FITC was applied in the following preparation procedure, and the ratio of donor/acceptor was finally determined to be 16.9/1 (Fig. S3–S4, ESI†). I440/I520 values of the FRET-based nanoprobe slightly change after being diluted several times, confirming the stable loading of VAN-PEG-FITC (Fig. S10, ESI†). To investigate the effect of VAN on the bacterial combination, the composite of PEG-FITC/HCAA@UiO-66 without VAN modification was also prepared with optimized dosages for further study (Fig. S11 and S12, ESI†).
3.3. Ratiometric response of VAN-PEG-FITC/HCAA@UiO-66 to S. aureus.
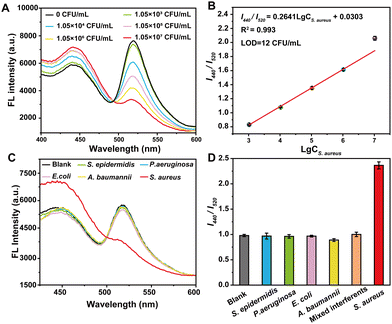
To evaluate the sensitivity of VAN-PEG-FITC/HCAA@UiO-66 as a FRET nanoprobe in S. aureus detection, we studied the fluorescence behavior of the nanoprobe in the presence of S. aureus in aqueous solution at pH 7.2 (Fig. 3A). With the addition of S. aureus, the emission band of FITC centered at 520 nm gradually decreased, and the emission peak of HCAA@UiO-66 at 440 nm recovered. A working curve was established by plotting the I440/I520versus the S. aureus concentration. As shown in Fig. 3B, I440/I520 is linearly proportional to the concentration of S. aureus. In addition, a good linear response (R2 = 0.993) can be obtained in the range of 1.05 × 10³–1.05 × 10⁷ CFU mL−1. The limit of detection (LOD) is calculated to be 12 CFU mL−1, which is comparable to previously reported fluorescent probes for bacteria detection.38–42 The LOD was calculated using the equation: LOD = 3s/k, where s is the standard deviation of 11 data for the blank sample, and k is the slope. These results demonstrate the suitability of our FRET nanoprobe for the quantitative detection of S. aureus.Control experiments were carried out under the same conditions to test the selectivity of the FRET nanoprobe in the presence of other bacteria. We also recorded the fluorescence intensity ratios change upon exposure to various interfering bacterial strains. As shown in Fig. 3C and D, only S. aureus can induce a high fluorescence intensity ratio change, whereas E. coli and other bacterial strains trigger a slight variation in intensity ratio. Furthermore, we incubated the FRET nanoprobe with a mixture of different bacterial strains. It is obvious that the co-existence of these species has a negligible interfering effect on S. aureus sensing, indicating that the FRET nanoprobe shows high selectivity towards S. aureus over other bacteria. In addition, the control group of PEG-FITC/HCAA@UiO-66 without VAN grafting shows minimal changes in the fluorescence intensity ratio with adding S. aureus and other interfering bacterial strains (Fig. S13, ESI†). This result also complies with expectations and verifies the necessity of introducing VAN as a recognition unit. Thus, VAN-PEG-FITC/HCAA@UiO-66 could be applied for S. aureus detection with good selectivity and reliability.
3.4. Bacterial targeting of VAN-PEG-FITC/HCAA@UiO-66 nanoprobes
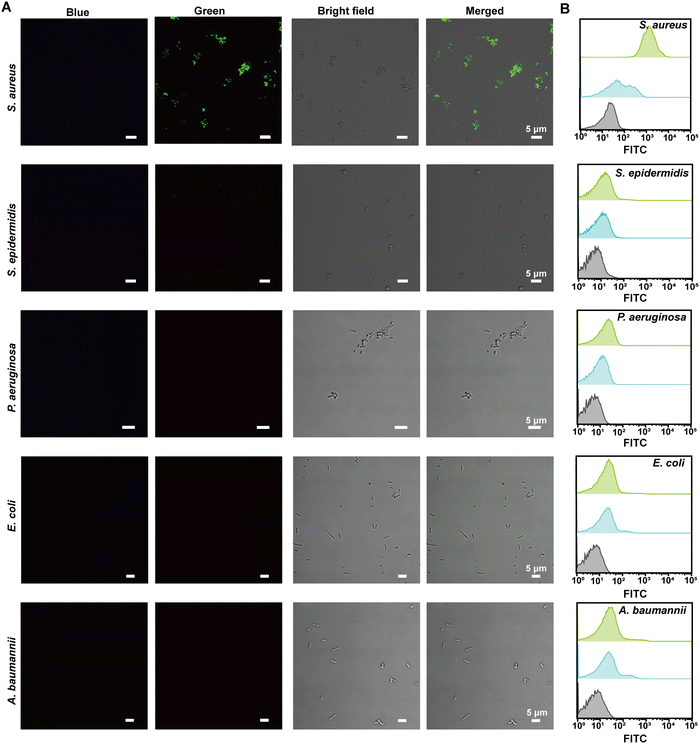
To provide visual confirmation of the binding of the VAN-PEG-FITC/HCAA@UiO-66 nanoprobe to S. aureus, confocal microscopy and flow cytometry were used to investigate the interaction between nanoprobes and different bacterial strains. Compared to other bacterial strains, high green fluorescence signals of FITC were only observed from S. aureus after treatment with VAN-PEG-FITC/HCAA@UiO-66 (Fig. 4A). Flow cytometry was further used for quantitative analysis of the FITC-dyeing level. The emission signal in the FITC channel of most S. aureus cells increased around 100-fold after treatment with the probe. It could be visually distinguished from the control groups of other interfering bacteria (Fig. 4B). In addition, all the bacteria were not stained with blue fluorescence (Fig. 4A), which means VAN-PEG-FITC interacts with S. aureus and releases from the MOF scaffold. This result is consistent with the gradually weakened FRET process in the presence of S. aureus due to the increased distance between FITC moiety and HCAA.The control experiment was carried out by using the same amount of bacterial solution to incubate with PEG-FITC@UiO-66/HCAA. As shown in Fig. S14 (ESI†), no obvious fluorescence signal can be observed for all bacteria treated without VAN, which unambiguously verified that the binding ability of VAN-PEG-FITC@UiO-66/HCAA for bacteria was attributed to VAN. As a glycopeptide antibiotic, vancomycin could combine with the D-Ala-D-Ala residues of N-acetylmuramic acid and N-acetylglucosamine peptide subunits on Gram-positive bacterial cell walls.43 Representative Gram-negative bacteria, such as P. aeruginosa, E. coli, and A. baumannii, with thin peptidoglycan layers and covered by an outer membrane,44 is more difficult to be recognized. S. epidermidis, a common species of Gram-positive bacteria, has a cell wall consisting of glycerol teichoic acid glucosyl residues, while S. aureus has N-acetylglucosamine ribitol teichoic acid. The main recognition site of VAN is N-acetylmuramic and N-acetylglucosamine residues, which are present in S. aureus.45 The collected evidence demonstrates the VAN-combining mechanism in S. aureus detection with excellent selectivity.
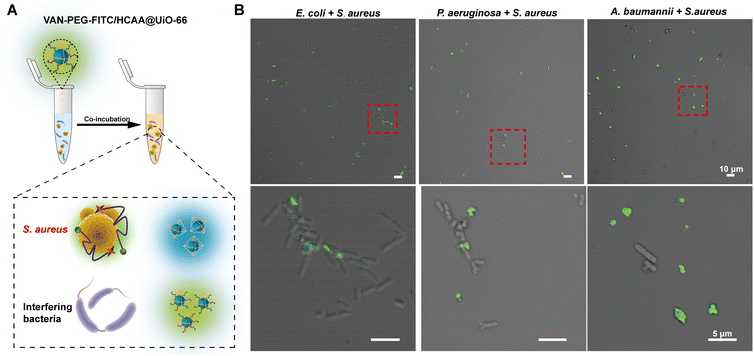
Furthermore, we mixed S. aureus with distinguishable rod-shaped Gram-negative bacteria, such as P. aeruginosa, E. coli, and A. baumannii. The contaminated bacterial mixtures were treated with the nanoprobe (Fig. 5). As indicated by the red dashed circle in Fig. 5B, S. aureus displays bright green fluorescence, whereas the Gram-negative bacteria are almost unstained. It provides further evidence that the nanoprobe of VAN-PEG-FITC/HCAA@UiO-66 is highly selective for S. aureus and resistant to interfering Gram-negative bacteria.
3.5. Determination of S. aureus in real samples
Having studied VAN-PEG-FITC/HCAA@UiO-66 for highly sensitive and selective detection of S. aureus, the feasibility of this nanoprobe for detecting S. aureus in real samples was explored. Lake water, orange juice, and saliva were employed as real samples and varying concentrations of S. aureus were spiked in these real samples. Spiked samples were treated with the nanoprobe, and their emission spectra were measured. As summarized in Table 1, the results of the recovery tests for spiked lake water, orange juice, and saliva are 90.36–119.28%, 97.22–104.63%, and 91.76–126.82%, respectively, with all RSDs at most 2.3% (n = 3). The concentrations of S. aureus in the above real samples detected by the nanoprobe are in high agreement with the spiked samples. Therefore, VAN-PEG-FITC/HCAA@UiO-66 is epitomized as an integrated FRET probe of S. aureus with satisfying reliability and application potential.| Real sample | C spiked (CFU mL−1) | C detected (CFU mL−1) | RSD (%) | Recovery (%) |
|---|---|---|---|---|
| Lake water | 0.83 × 10⁴ | 0.75 × 10⁴ | 0.6 | 90.36 |
| 1.66 × 10⁵ | 1.67 × 10⁵ | 0.5 | 100.60 | |
| 4.15 × 10⁵ | 4.95 × 10⁵ | 0.3 | 119.28 | |
| Orange juice | 1.08 × 10⁴ | 1.13 × 10⁴ | 0.8 | 104.63 |
| 2.16 × 10⁵ | 2.13 × 10⁵ | 1.0 | 98.61 | |
| 5.40 × 10⁵ | 5.25 × 10⁵ | 2.3 | 97.22 | |
| Saliva | 0.85 × 10⁴ | 0.78 × 10⁴ | 0.5 | 91.76 |
| 1.70 × 10⁵ | 1.85 × 10⁵ | 1.4 | 108.82 | |
| 4.25 × 10⁵ | 5.39 × 10⁵ | 0.3 | 126.82 |
4. Conclusions
We have successfully devised a highly efficient, user-friendly, cost-effective, and dependable fluorescent nanoprobe utilizing the MOF platform for S. aureus identification and quantification. The nanoprobe exhibits high selectivity towards S. aureus over other interfering bacteria, even in real samples. Furthermore, the quantification of S. aureus in spiked samples was achieved with exceptional accuracy, as evidenced by the high recoveries higher than 90%. Based on the elaborate FRET detection method that we proposed, low levels of S. aureus could be evaluated rapidly and conveniently. The method has the potential for portable application and may further reduce the threat of pathogens to human health.Author contributions
The manuscript was written through the contributions of all authors. All authors have approved the final version of the manuscript.Conflicts of interest
The authors declare no conflicts of interest.Acknowledgements
This work was financially supported by the Jiangsu Innovation Team Program, National Natural Science Foundation of China (No. 52203156 and 21971037), Start-up Research Fund of Southeast University (RF1028623188), Zhishan Young Scholar Program (2242023R40025), Fundamental Research Funds for the Central Universities (2242023K5007) and the Xiaomi Young Scholar Program.References
- J. Lederberg, JAMA, 1996, 276, 417–419 CrossRef CAS PubMed.
- S. O. Teng, W. S. Lee, T. Y. Ou, Y. C. Hsieh, W. C. Lee and Y. C. Lin, J. Microbiol., Immunol. Infect., 2009, 42, 86–91 Search PubMed.
- C. Willyard, Nature, 2017, 543, 15 CrossRef CAS PubMed.
- F. D. Lowy, N. Engl. J. Med., 1998, 339, 520–532 CrossRef CAS PubMed.
- J. Kadariya, T. C. Smith and D. Thapaliya, BioMed Res. Int., 2014, 2014, 827965 Search PubMed.
- M. Maurin, Expert Rev. Mol. Diagn., 2012, 12, 731–754 CrossRef CAS PubMed.
- I. H. Cho and J. Irudayaraj, Int. J. Food Microbiol., 2013, 164, 70–75 CrossRef CAS PubMed.
- I. V. Martynenko, D. Kusić, F. Weigert, S. Stafford, F. C. Donnelly, R. Evstigneev, Y. Gromova, A. V. Baranov, B. Rühle, H. J. Kunte, Y. K. Gun'ko and U. Resch-Genger, Anal. Chem., 2019, 91, 12661–12669 CrossRef CAS PubMed.
- S. G. Roh, A. I. Robby, P. T. M. Phuong, I. In and S. Y. Park, Mater. Sci. Eng., C, 2019, 97, 613–623 CrossRef CAS PubMed.
- Z. Wang, X. Yao, R. Wang, Y. Ji, T. Yue, J. Sun, T. Li, J. Wang and D. Zhang, Biosens. Bioelectron., 2019, 132, 360–367 CrossRef CAS PubMed.
- Y. Tang, X. Wang, G. Zhu, Z. Liu, X. M. Chen, H. K. Bisoyi, X. Chen, X. Chen, Y. Xu, J. Li and Q. Li, Small, 2023, 19, e2205440 CrossRef PubMed.
- M. Yang, X. Chen, L. Zhu, S. Lin, C. Li, X. Li, K. Huang and W. Xu, ACS Appl. Mater. Interfaces, 2021, 13, 38647–38655 CrossRef CAS PubMed.
- N. Qian, X. Hou, Y. Tang, S. Zhang, X. Chen and Q. Li, ChemPhotoChem, 2023, 7, e202300018 CrossRef.
- H. Furukawa, K. E. Cordova, M. O'Keeffe and O. M. Yaghi, Science, 2013, 341, 1230444 CrossRef PubMed.
- H. D. Lawson, S. P. Walton and C. Chan, ACS Appl. Mater. Interfaces, 2021, 13, 7004–7020 CrossRef CAS PubMed.
- J. Liu, J. Liang, J. Xue and K. Liang, Small, 2021, 17, e2100300 CrossRef PubMed.
- Y. Zhao, H. Zeng, X. W. Zhu, W. Lu and D. Li, Chem. Soc. Rev., 2021, 50, 4484–4513 RSC.
- M. Yang, J. Zhang, Y. Wei, J. Zhang and C. Tao, Nano Res., 2022, 15, 6220–6242 CrossRef CAS PubMed.
- A. Gupta, M. Garg, S. Singh, A. Deep and A. L. Sharma, ACS Appl. Mater. Interfaces, 2020, 12, 48198–48205 CrossRef CAS PubMed.
- K. He, T. Bu, X. Zheng, J. Xia, F. Bai, S. Zhao, X. Y. Sun, M. Dong and L. Wang, J. Hazard. Mater., 2022, 425, 128034 CrossRef CAS PubMed.
- W. Zuo, L. Liang, F. Ye and S. Zhao, Sens. Actuators, B, 2021, 345, 130345 CrossRef CAS.
- D. Bhatt, S. Singh, N. Singhal, N. Bhardwaj and A. Deep, Anal. Bioanal. Chem., 2023, 415, 659–667 CrossRef CAS PubMed.
- J. Wei, L. Zhang, H. Yang, L. Wang and Z. Fu, Nanoscale, 2021, 13, 12546–12552 RSC.
- B. Yan, Acc. Chem. Res., 2017, 50, 2789–2798 CrossRef CAS PubMed.
- X. Chen, Q. Cao, H. K. Bisoyi, M. Wang, H. Yang and Q. Li, Angew. Chem., Int. Ed., 2020, 59, 10493–10497 CrossRef CAS PubMed.
- X. Guo, N. Zhu, Y. Lou, S. Ren, S. Pang, Y. He, X. B. Chen, Z. Shi and S. Feng, Chem. Commun., 2020, 56, 5389–5392 RSC.
- F. Fu, Y. Zhang, L. Li, H. Wang, Q. Li, X. Tao, Y. Song and E. Song, Anal. Chem., 2020, 92, 11462–11468 CrossRef CAS PubMed.
- L. Hou, Y. Qin, J. Li, S. Qin, Y. Huang, T. Lin, L. Guo, F. Ye and S. Zhao, Biosens. Bioelectron., 2019, 143, 111605 CrossRef CAS PubMed.
- X. Chen, K. Cao, H. K. Bisoyi, S. Zhang, N. Qian, L. Guo, D. Guo, H. Yang and Q. Li, Small, 2022, 18, 2204360 CrossRef CAS PubMed.
- H. Tan, X. Wu, Y. Weng, Y. Lu and Z. Z. Huang, Anal. Chem., 2020, 92, 3447–3454 CrossRef CAS PubMed.
- C. Gong, Z. Li, G. Liu, R. Wang and S. Pu, Spectrochim. Acta, Part A, 2022, 265, 120362 CrossRef CAS PubMed.
- J.-X. Wang, J. Yin, O. Shekhah, O. M. Bakr, M. Eddaoudi and O. F. Mohammed, ACS Appl. Mater. Interfaces, 2022, 14, 9970–9986 CrossRef CAS PubMed.
- S. Feng, F. Pei, Y. Wu, J. Lv, Q. Hao, T. Yang, Z. Tong and W. Lei, Spectrochim. Acta, Part A, 2021, 246, 119004 CrossRef CAS PubMed.
- Y. Liang, J. Li, S. Yang, S. Wu, M. Zhu, V. P. Fedin, Y. Zhang and E. Gao, Polyhedron, 2022, 226, 116080 CrossRef CAS.
- K. Yi and L. Zhang, Food Chem., 2021, 354, 129584 CrossRef CAS PubMed.
- R. Nagarajan, Antimicrob. Agents Chemother., 1991, 35, 605–609 CrossRef CAS PubMed.
- D. Feng, T. Zhang, T. Zhong, C. Zhang, Y. Tian and G. Wang, J. Mater. Chem. C, 2021, 9, 16978–16984 RSC.
- L. Fu, Q. Chen and L. Jia, Food Chem., 2022, 374, 131750 CrossRef CAS PubMed.
- Y. Shen, T. Wu, H. Chen, Y. Ye and J. J. Xu, Chem. Commun., 2022, 58, 447–450 RSC.
- Y. Wang, Z. Wang, Z. Zhan, J. Liu, T. Deng and H. Xu, Anal. Chim. Acta, 2022, 1189, 339213 CrossRef CAS PubMed.
- A. B. Pebdeni, M. Hosseini and A. Barkhordari, Talanta, 2022, 246, 123454 CrossRef CAS PubMed.
- S. Ye, T. Han, M. Cheng and L. Dong, Sens. Actuators, B, 2022, 356, 131332 CrossRef CAS.
- B. K. Hubbard and C. T. Walsh, Angew. Chem., Int. Ed., 2003, 42, 730–765 CrossRef CAS PubMed.
- R. D. Turner, A. F. Hurd, A. Cadby, J. K. Hobbs and S. J. Foster, Nat. Commun., 2013, 4, 1496 CrossRef PubMed.
- C. Geary, J. Z. Jordens, J. F. Richardson, D. M. Hawcroft and C. J. Mitchell, J. Med. Microbiol., 1997, 46, 195–203 CrossRef CAS PubMed.
Footnotes |
| † Electronic supplementary information (ESI) available. See DOI: https://doi.org/10.1039/d3tb01428b |
| ‡ Jing Qiao and Xuanbo Chen contributed equally to this work. |
| This journal is © The Royal Society of Chemistry 2023 |

