 Open Access Article
“d-electron interactions” induced CoV2O6–Fe–NF for efficient oxygen evolution reaction†
Yuchao Guo ,
Gaojie Yan,
Xi Sun,
Shuo Wang,
Li Chen and
Yi Feng*
Hebei Key Laboratory of Functional Polymers, Department of Polymer Materials and Engineering, Hebei University of Technology, Tianjin 300400, P. R. China. E-mail: luckyii0512@163.com
First published on 20th June 2023
Abstract
The investigation of cost-effective, highly efficient, and environmentally friendly non-noble-metal-based electrocatalysts is imperative for oxygen evolution reactions (OER). Herein, CoV2O6 grown on nickel foam (NF) was selected as the fundamental material, and Fe2+ is introduced through a simple Fe3+ immersion treatment to synthesize CoV2O6–Fe–NF. Fe2+ is transformed into high oxidation state Fe(2+δ)+ due to interactions between the 3d electrons of transition metals. In situ Raman spectroscopy analysis reveals the specific process of OER in the presence of Fe(2+δ)+. Being in a higher oxidation state, Fe(2+δ)+ provides more active sites, which is beneficial for the reaction between water molecules and the reactive sites of the electrocatalyst, ultimately enhancing the accelerated OER process. CoV2O6–Fe–NF exhibited an overpotential of only 298 mV at 100 mA cm−2 in 1 M KOH electrolyte, which is lower than that of CoV2O6–NF (348 mV), as well as the comparative samples: Fe–NF (390 mV) and NF (570 mV). The exploration of high performance, triggered synergistically by the cooperative effect of transition metal 3d electrons, provides insights into the design of transition metal electrocatalysts for highly efficient OER.
Energy has played a vital role in the progress of human civilization. Today, the urgent environmental issues caused by the burning of traditional fossil fuels are becoming more evident, and the foreseeable catastrophic consequences have spurred humanity to develop clean energy. Hydrogen, as a high energy density (120 MJ kg−1) and carbon-neutral fuel, aligns with the new concept of civilization development and presents an ideal alternative to fossil fuels.1–4 Water splitting into hydrogen and oxygen (H2O → H2 + 1/2O2), operated by electricity derived from renewable energy sources, is recognized as a viable approach to large-scale hydrogen production.5–7 In water splitting, the hydrogen evolution reaction (HER) occurs at the cathode and the oxygen evolution reaction (OER) occurs at the anode. The OER involves a four-electron transfer, whereas the HER involves only a two-electron transfer. Thus, the efficiency of water-splitting is determined by the slower OER, which attracts considerable research attention. Both Pt and RuO2 are excellent electrocatalysts for OER as they are noble-metal-based materials,8–10 but their elemental scarcity and prohibitive cost severely limit their universal applications. A fundamental challenge that attracts the attention of researchers is to design low-cost electrocatalysts that are highly active and long-lived for water oxidation and proton reduction.
Great attention has been devoted to Transition Metal Compounds (TMCs) such as oxides, nitrides, dichalcogenides, and phosphides.11–16 Due to their unsaturated coordination and high electrical conductivity, these cations can act as active catalytic centers for adsorption/activation of OER intermediates. Guided by the Brewer–Engel bond valence theory, the combination of early transition metals with empty or half-filled vacant d-orbitals and late transition metals with internally paired d-electrons will achieve a significant synergistic effect. As proof the valence electron configuration of V5+ is 3d0 with empty 3d orbital occupy, which is in favor of regulating the local electronic coordination environment.17 Some recent research discovered that incorporation of V into late transition metals could effectively enhance the OER activity of the catalysts.18–21 Fe has a unique advantage in optimizing the electronic structure of Ni and Co because of the similar ionic radius and 3d orbital electron configurations.22 At the beginning of 1947, Hickling et al. found that operating a Ni-alkaline cell in the KOH solution containing only 1 ppm Fe impurity could greatly contract the cell voltage and reduce the OER onset potential, indicating that the introduction of trace Fe would significantly enhance the electrocatalytic activity.23 It was reported that Fe acted as a fast active site in (Ni, Fe)OOH and (Co, Fe)OOH while NiOOH and CoOOH only contribute as conductive carriers.24 In 2021 Wang et al. found the interfacial electron transfer from Fe to Co and Ni optimizes the eg filling of Co and Fe sites, which is beneficial for the surface reconstruction to CoOOH and FeOOH during OER process.25
In this study, we used a simple preparation route to grow CoV2O6 on the surface of pre-Fe-treated nickel foam. Through a redox reaction (2Fe3+ + 2Ni → 2Fe2+ + Ni2+) introduced Fe2+ into the CoV2O6–NF.
XPS analyses showed the synergistic interaction of Fe, V, and Co cations in the CoV2O6–Fe–NF catalyst, indicating that Fe2+ via 3d electron interaction turns into a novel electronic structure of Fe(2+δ)+.
Metals with higher oxidation states provide the optimum bonding strength between cations and water molecules and intermediates, making Fe(2+δ)+ beneficial to reacting with the adsorbed OH− and finally deriving an accelerated OER process.26 This work had explain for the study of the synergistic catalytic effect for OER of metal sites in Co–O–Fe–O–V system.
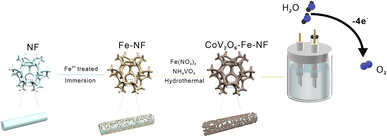
The CoV2O6–Fe–NF was synthesized via convenient Fe-treatment and subsequent sol–gel reaction (Fig. 1, details in ESI†). The CoV2O6–NF counterpart was synthesized in almost identical method except Fe-treatment, while sample just after Fe-treatment was also synthesized and designated as Fe–NF. After that, related tests were used to characterize samples. The X-ray diffraction (XRD) patterns were displayed in Fig. S1† for Fe–NF. The diffraction peaks at 2θ = 19.7°, 31.9°, 36.8° and 57.6° match well with the (020), (111), (201), and (241) planes of orthorhombi of FeCl2·(H2O)4 (JCPDS No. 97-001-5597) which confirmed the occurrence of the redox reactions. The XRD patterns of CoV2O6–NF and CoV2O6–Fe–NF were displayed in Fig. S2.† For CoV2O6–NF, the diffraction peaks at 2θ = 17.6°, 21.9°, 22.4°, 26.1°, 27.6°, 29.1°, 35.7°, 39.7°, and 48.5° match well with the (101), (102), (022), (031), (122), (112), (202), (203), (051) and (144) planes of CoV2O6·(H2O)2 (JCPDS No. 00-041-0420) identified the successful synthesis of CoV2O6 on the surface of NF. A slight peak shift observed in CoV2O6–Fe–NF suggest the retained cobalt vanadate crystalline structure with Fe incorporation, while diminished peaks at 2θ = 17.6°, 26.0° and 42.8° imply differential exposure of crystalline surfaces. The morphology of CoV2O6–Fe–NF, CoV2O6–NF, Fe–NF and NF samples were characterized via scanning electron microscopy (SEM). Contrasted with an approximately smooth NF surface (Fig. S3b†), Fig. 2a illustrated the nano-array-like structure on the surface of Fe–NF, which transformed into densely distributed nanoparticles in CoV2O6–Fe–NF after the sol–gel reaction. The size of the nanoparticles on CoV2O6–Fe–NF was estimated to be 90 nm in diameter (Fig. 2b). The physical photo of CoV2O6–Fe–NF was shown in Fig. S3a.† The sample was uniformly deposited on the three-dimensional NF skeleton. The SEM image of the cross section showed that the thickness of the deposited layer of the prepared sample was about 4.79 μm. Transmission electron microscopy (TEM) image of one detached piece of stacked nanoparticles on CoV2O6–Fe–NF was displayed in Fig. 2c, while the high-resolution transmission electron microscopy (HRTEM) image could be seen in Fig. 2d. The lattice fringes observed in the HRTEM image with lengths of 0.379 nm and 0.224 nm coincide with the (112) and (022) plane of CoV2O6·(H2O)2, which was in accordance with the XRD result. Elemental mapping (Fig. 2f) demonstrated the uniform distribution of Co, Fe, V and O on the nanoparticle.
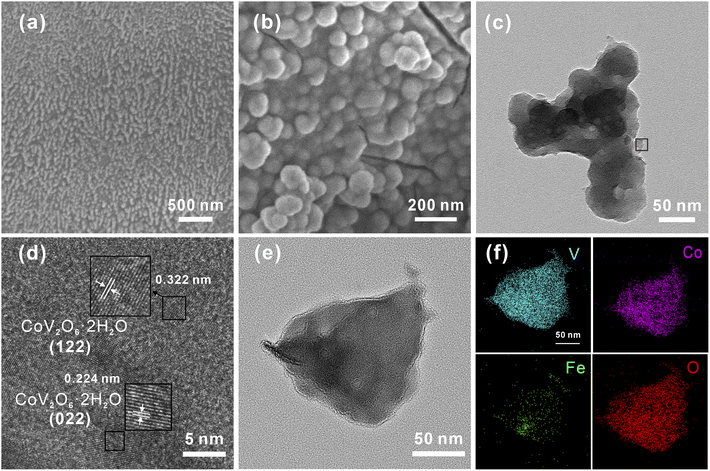 | ||
| Fig. 2 (a) SEM image of Fe–NF, (b) SEM image of CoV2O6–Fe–NF, (c) TEM image of CoV2O6–Fe–NF, (d) corresponding HRTEM image of CoV2O6–Fe–NF, (e) and (f) corresponding elemental mapping. | ||
The atomic ratio of Fe, Co, V, and O was estimated using Energy Dispersive Spectrometry (EDS) and found to be 1![[thin space (1/6-em)]](https://www.rsc.org/images/entities/char_2009.gif) :
:![[thin space (1/6-em)]](https://www.rsc.org/images/entities/char_2009.gif) 5.24
5.24![[thin space (1/6-em)]](https://www.rsc.org/images/entities/char_2009.gif) :
:![[thin space (1/6-em)]](https://www.rsc.org/images/entities/char_2009.gif) 11.62
11.62![[thin space (1/6-em)]](https://www.rsc.org/images/entities/char_2009.gif) :
:![[thin space (1/6-em)]](https://www.rsc.org/images/entities/char_2009.gif) 36.46. Additionally, the (Co + Fe)
36.46. Additionally, the (Co + Fe)![[thin space (1/6-em)]](https://www.rsc.org/images/entities/char_2009.gif) :
:![[thin space (1/6-em)]](https://www.rsc.org/images/entities/char_2009.gif) V
V![[thin space (1/6-em)]](https://www.rsc.org/images/entities/char_2009.gif) :
:![[thin space (1/6-em)]](https://www.rsc.org/images/entities/char_2009.gif) O ratio was approximately 1
O ratio was approximately 1![[thin space (1/6-em)]](https://www.rsc.org/images/entities/char_2009.gif) :
:![[thin space (1/6-em)]](https://www.rsc.org/images/entities/char_2009.gif) 1.857
1.857![[thin space (1/6-em)]](https://www.rsc.org/images/entities/char_2009.gif) :
:![[thin space (1/6-em)]](https://www.rsc.org/images/entities/char_2009.gif) 5.823, exhibiting a similarity to the stoichiometry of CoV2O6 (Fig. S4†). The atomic ratio of Co
5.823, exhibiting a similarity to the stoichiometry of CoV2O6 (Fig. S4†). The atomic ratio of Co![[thin space (1/6-em)]](https://www.rsc.org/images/entities/char_2009.gif) :
:![[thin space (1/6-em)]](https://www.rsc.org/images/entities/char_2009.gif) Fe
Fe![[thin space (1/6-em)]](https://www.rsc.org/images/entities/char_2009.gif) :
:![[thin space (1/6-em)]](https://www.rsc.org/images/entities/char_2009.gif) V was further confirmed using inductively coupled plasma-optical emission spectroscopy (ICP-OES), resulting in an estimated ratio of 7.27
V was further confirmed using inductively coupled plasma-optical emission spectroscopy (ICP-OES), resulting in an estimated ratio of 7.27![[thin space (1/6-em)]](https://www.rsc.org/images/entities/char_2009.gif) :
:![[thin space (1/6-em)]](https://www.rsc.org/images/entities/char_2009.gif) 1
1![[thin space (1/6-em)]](https://www.rsc.org/images/entities/char_2009.gif) :
:![[thin space (1/6-em)]](https://www.rsc.org/images/entities/char_2009.gif) 17.24. The (Co + Fe)
17.24. The (Co + Fe)![[thin space (1/6-em)]](https://www.rsc.org/images/entities/char_2009.gif) :
:![[thin space (1/6-em)]](https://www.rsc.org/images/entities/char_2009.gif) V ratio was found to be approximately 1
V ratio was found to be approximately 1![[thin space (1/6-em)]](https://www.rsc.org/images/entities/char_2009.gif) :
:![[thin space (1/6-em)]](https://www.rsc.org/images/entities/char_2009.gif) 2.08 (Table S1†). The atomic ratio of (Co + Fe)
2.08 (Table S1†). The atomic ratio of (Co + Fe)![[thin space (1/6-em)]](https://www.rsc.org/images/entities/char_2009.gif) :
:![[thin space (1/6-em)]](https://www.rsc.org/images/entities/char_2009.gif) V
V![[thin space (1/6-em)]](https://www.rsc.org/images/entities/char_2009.gif) :
:![[thin space (1/6-em)]](https://www.rsc.org/images/entities/char_2009.gif) O, as well as the XRD pattern of CoV2O6–Fe–NF, suggests that Fe was incorporated into the crystalline structure of CoV2O6·(H2O)2 in the cationic position, consistent with observations reported in other studies.27–29
O, as well as the XRD pattern of CoV2O6–Fe–NF, suggests that Fe was incorporated into the crystalline structure of CoV2O6·(H2O)2 in the cationic position, consistent with observations reported in other studies.27–29
To show the surface chemical environment and electronic interaction of CoV2O6–Fe–NF and CoV2O6–NF, they were characterized by X-ray photoelectron spectroscopy (XPS). The survey XPS spectra reveal the presence of Co, V, Fe, O in CoV2O6–Fe–NF (Fig. 3a) and Co, V, O in CoV2O6–NF (Fig. S5†), respectively. In high resolution spectra of Co 2p (Fig. 3b), significant peaks around 781 and 797 eV could be attributed to the spin–orbit splitting to Co 2p3/2 and Co 2p1/2 (ref. 30 and 31) for both CoV2O6–Fe–NF and CoV2O6–NF. As for CoV2O6–NF, peaks centre at 780.85 and 796.90 eV corresponded with Co3+ while the 782.70 and 798.55 eV peaks corresponded with Co2+with two satellite peaks locate at 782.70 and 803.43 eV. Corresponding peaks exhibited a blue shift in CoV2O6–Fe–NF. Specifically, Co3+ peaks demonstrated ∼0.37 eV shift to lower binding energy at 780.62 and 796.53 eV, while Co2+ peaks display ∼0.86 eV shifted to 782.26 and 797.69 eV.32–35 The blue shift suggested a lower valence state of Co species in CoV2O6–Fe–NF,25 which was further confirmed by a lower Co3+/Co2+ ratio of (0.66) compared with CoV2O6–NF (0.88) calculated via corresponding peak area.
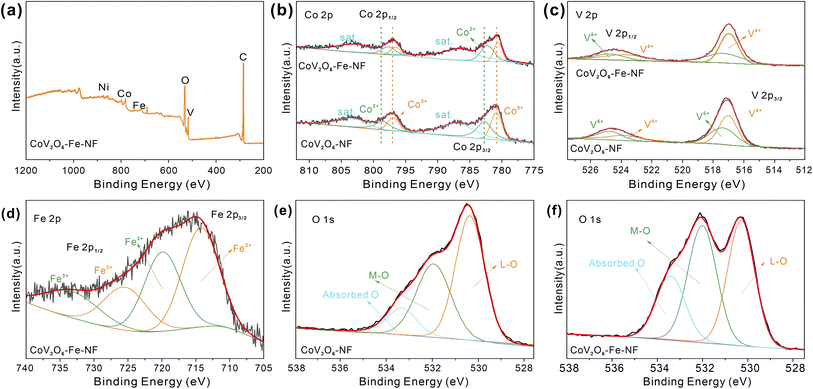 | ||
| Fig. 3 (a) XPS survey of CoV2O6–Fe–NF, (b) XPS spectra patterns of Co 2p and (c) V 2p, (d) XPS spectra of Fe2p, O 1s XPS spectra of (e) CoV2O6–NF and (f) CoV2O6–Fe–NF. | ||
Fig. 3c demonstrates high resolution XPS spectra of V 2p, with distinct peaks located at 517 and 524 eV respectively attributed to V 2p3/2 and V 2p1/2. Concerning CoV2O6–NF, deconvoluted peaks of V 2p1/2 and V 2p3/2 indicate the presence of high valence V4+ (517.02, 523.78 eV) and V5+ (517.37, 524.76 eV). Although a minor blue shift (∼0.07 eV) could be observed in CoV2O6–Fe–NF, a lower V5+/V4+ ratio (0.65) versus CoV2O6–NF (0.82) suggests less oxidated V species after Fe incorporation36–38 (Table S2†). The typical Fe 2p spectrum of CoV2O6–Fe–NF was displayed in (Fig. 3d), where peaks centred at (714.27 eV) and (719.90 eV) are identified to Fe2+ and Fe3+, respectively.39 Meanwhile, the high resolution O 1s spectrum (Fig. 4e and f) of CoV2O6–NF and CoV2O6–Fe–NF could be deconvoluted into three peaks in the vicinity of 530, 531.9 and 533.4 eV, which represent the existence of lattice O (L-O), metal–O (M–O) and absorbed O, respectively.38
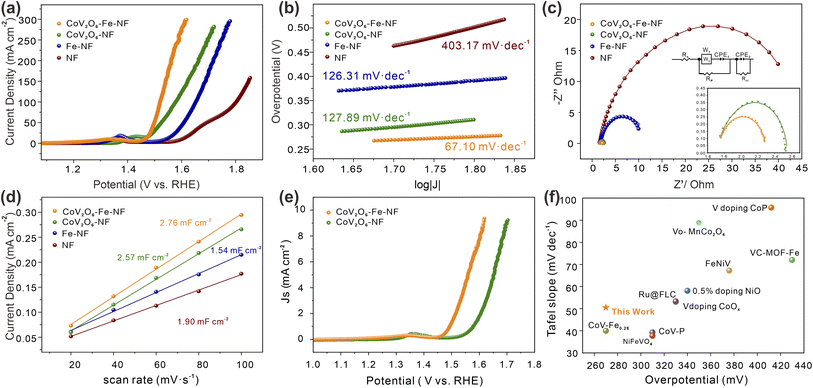
The effect of Fe incorporation in CoV2O6–NF was further investigated by evaluating the electrocatalytic OER performances in a three-electrode setup with 1 M KOH solution (details in ESI†). Linear Sweep Voltammetry (LSV) curves with the scan rate of 2 mV s−1 were shown in Fig. 4a. CoV2O6–Fe–NF exhibited considerable electrocatalytic OER activity with the lowest overpotential at the current density of 100 mA cm−2 (298 mV), which surpassed the CoV2O6–NF (348 mV), Fe–NF (390 mV), and NF (570 mV) in this work. Compared with the LSV curves of NF, the evidently promoted OER performance of CoV2O6–Fe–NF and CoV2O6–NF, especially at high overpotential, imply that the OER activities dominantly result from cobalt vanadate or Fe incorporated cobalt vanadate. Moreover, the OER performance of CoV2O6–Fe–NF was also competitive among a majority of transition metal catalysts (Fig. 4f).39–48 Compared with the LSV curves of NF, the evidently promoted OER performance of CoV2O6–Fe–NF and CoV2O6–NF, especially at high overpotential, imply that the OER activities dominantly result from cobalt vanadate or Fe incorporated cobalt vanadate.
Next, the OER kinetics of the catalysts were also evaluated by Tafel plots (Fig. 4b). Among all synthesized catalysts, CoV2O6–Fe–NF exhibited the smaller Tafel slope (67.1 mV dec−1) than CoV2O6–NF (126.31 mV dec−1), Fe–NF (127.89 mV dec−1), and NF (403.17 mV dec−1). It indicates that the kinetics of CoV2O6–Fe–NF were accelerated, owing that Tafel slopes were closely related to the rate-determine-steps (RDSs) and electron–transfer reactions.49,50 Turnover frequencies (TOF, based on total amount of metals, details in ESI†) of CoV2O6–Fe–NF and CoV2O6–NF were also assessed to investigate the promotion in electrocatalytic efficiency (Fig. S6†). At an overpotential of 298 mV, CoV2O6–Fe–NF displayed an almost higher TOF value (0.059 s−1) than CoV2O6–NF (0.003 s−1). The ascending trend of TOF value against overpotential reveals that CoV2O6–Fe–NF had higher TOF values, indicating that it surpasses electrocatalytic efficiency even at large current density. Electrochemical impedance spectroscopy (EIS) further elucidated the electrocatalytic charge transfer of CoV2O6–Fe–NF and its synthesized counterparts (Fig. 4c). CoV2O6–Fe–NF exhibited a smaller semicircle in the equivalent Nyquist plot, with a fitted charge-transfer resistance (Rct) 0.99 Ω, compared to other obtained catalysts (CoV2O6–NF: 1.26 Ω; Fe–NF: 10.32 Ω; NF: 46.49 Ω) at the overpotential of 605 mV. It was demonstrated that CoV2O6–Fe–NF has higher conductivity and accelerated charge transfer due to Fe incorporation.17
To disclose the origin of promoted electrocatalytic performance of CoV2O6–Fe–NF, electrochemical active surface area (ECSA) was estimated by double-layer capacitance (Cdl) method (details in ESI†), since ECSA has positive relationship with Cdl values. The Cdl values were obtained by measuring cyclic voltammetry (CV) at different scan rates in the non-faradaic regions under the same conditions.51 (Fig. S7†). According to the Cdl values of the synthesized electrocatalysts (Fig. 4d), CoV2O6–Fe–NF exhibited the higher ECSA of 69.0 cm2 than CoV2O6–NF (64.3 cm2), Fe–NF (47.5 cm2) and NF (38.5 cm2), indicating an increase in active sites due to the introduction of Fe. To gain a general understanding of the intrinsic activities, OER polarization curves normalized by ECSA values were plotted in Fig. 4e. The CoV2O6–Fe–NF still outperformed CoV2O6–NF, demonstrating an intrinsically promoted OER electrocatalytic ability, which could be attributed to the induced Fe. In addition, stability investigated by chronopotentiometry (CP) method was another essential property to evaluate the performance of electrocatalysts (Fig. S8†). The CP test showed that CoV2O6–Fe–NF maintained a current density of 50 mA cm−2 with no significant decrease in current observed after 48 hours of continuous electrochemical OER testing, indicating the superior long-term stability of the catalyst.
To further probing possible changes in morphology or phase transformations during OER process, SEM and TEM images of CoV2O6–Fe–NF were recorded after a post-OER for 48 h. SEM images in (Fig. 5a) illustrated the nanosheets reconstructed on the surface of CoV2O6–Fe–NF. The morphology was further characterized via TEM (Fig. 5b and c) HRTEM image demonstrated the lattice fringes of 0.247 nm and 0.236 nm, which coincided with (130) and (111) plane of FeOOH (JCPDS No.97-000-1544). TEM image of post-OER CoV2O6–NF was demonstrated in Fig. S9,† where the HRTEM image also illustrates the crystalline CoOOH (012) and (101) at the surface. Raman spectroscopy of post-OER CoV2O6–Fe–NF (Fig. S10†) demonstrated the E2g bending (461 cm−1) and A1g stretching (538 cm−1) vibration of Co–O in CoOOH.52,53 A peak centered at 205 cm−1 could be typically assigned to α-FeOOH, and the other peak of the doublets (550 cm−1) were likely to be covered by adjacent CoOOH54 Raman peaks. On the contrary, identical Raman peaks of vanadate are too weak to be found in the Raman spectra.
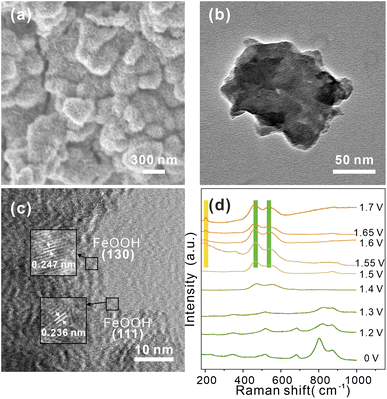 | ||
| Fig. 5 (a) SEM, (b) TEM, and (c) HRTEM image of post-OER CoV2O6–Fe–NF, (d) in situ Raman spectra of CoV2O6–Fe–NF at the potentials of 1.2–1.7 V in 1 M KOH. | ||
The HRTEM and Raman results indicated the structural change on the surface of CoV2O6–Fe–NF, in which CoOOH and α-FeOOH act as real OER catalysts.
In the previously reported mechanism for 3d metal-based catalysts in alkaline media, the OER undergoes through following four elementary steps:55,56
| * + OH− → OH* + e− | (1) |
| OH* + OH− → O* + H2O (l) + e− | (2) |
| O* + OH− → OOH* + e− | (3) |
| OOH* + OH− → O2 + H2O (l)+ e− | (4) |
Next, to verify the mentioned mechanism of OER activity enhancement and identify the origin of CoOOH and FeOOH, in situ Raman spectroscopy was conducted to clarify the structural change under the OER process (Fig. 5d). Potentials from 1.2 V to 1.7 V (vs. RHE) were applied to CoV2O6–Fe–NF, and the Raman spectra recorded at open circuit potential demonstrated similar peaks with as synthesized CoV2O6–Fe–NF. When the potential of 1.2 V was applied, intensity of peaks(513 cm−1 and 681 cm−1, corresponding to the A1g stretching vibration mode of Co–O;57 803 cm−1 and 870 cm−1 belong to the A1g stretching vibration mode of V![[double bond, length as m-dash]](https://www.rsc.org/images/entities/char_e001.gif) O58) exhibited obvious decrease, and disappeared at 1.4 V, indicating the structural change of vanadate in the catalyst. In addition, the Co–O (of CoOOH) Raman peaks appeared at 1.4 V, which gradually increased with the ascending potential. Raman peaks of α-FeOOH was generated at 1.55 V (205 cm−1 and 550 cm−1) with an increasing intensity at higher overpotential. Notably, peak at 550 cm−1 was not obvious due to the overlapping A1g stretching vibration mode peak of Co–O in CoOOH. The in situ Raman spectra clarified the structural change of CoV2O6–Fe–NF under OER process, resulting that the vanadate were believed to be conducive on generating more active sites-FeOOH.
O58) exhibited obvious decrease, and disappeared at 1.4 V, indicating the structural change of vanadate in the catalyst. In addition, the Co–O (of CoOOH) Raman peaks appeared at 1.4 V, which gradually increased with the ascending potential. Raman peaks of α-FeOOH was generated at 1.55 V (205 cm−1 and 550 cm−1) with an increasing intensity at higher overpotential. Notably, peak at 550 cm−1 was not obvious due to the overlapping A1g stretching vibration mode peak of Co–O in CoOOH. The in situ Raman spectra clarified the structural change of CoV2O6–Fe–NF under OER process, resulting that the vanadate were believed to be conducive on generating more active sites-FeOOH.
Based on the Pauli40 exclusion principle and Hund's rule,59 the synergistically electronic interplay of Co, Fe, and V cations in CoV2O6–Fe–NF was well explained in light of the analysis of valence electron structures of metal ions. A Co–O–V unit (Fig. 6a) was used to analyze the electronic interaction of Co and V cations in CoV2O6–NF. The valence electron configuration of Co2+ was at high-spin state 3d7 with full t2g orbital and one-electron-filled eg orbital; the valence electron configuration of V5+ was at high-spin state 3d0 with empty t2g orbital and empty eg orbital, which was in favor of the π-donation from bridging O to V. Thus, the repulsion between O 2p and Co 3d would be relieved, leading to a 3d electron form eg orbital of Co2+ delocalization on the Co–O–V unit.
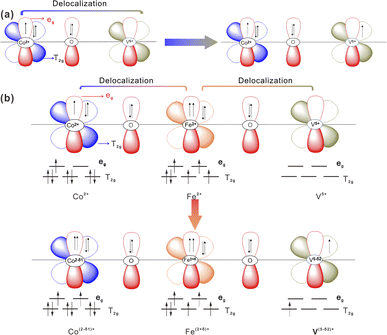 | ||
| Fig. 6 Schematic representations of the electronic coupling among (a) Co and V in CoV2O6–NF and (b) Co, Fe and V in CoV2O6–Fe–NF. | ||
The valence electron of Fe2+ was 3d6, consisting of four-electron-filled t2g orbital and one-electron-filled eg orbital.60 Based on the above description, stronger electron interaction could make a 3d electron from eg orbital of Fe2+ delocalizing on the Co–O–Fe–O–V unit when the Fe2+ being introduced into the system (Fig. 6b).
Electron delocalization caused the valence state of Fe2+ to increase (δ) and that Co and V to decrease δ1 and δ2. This could be supported by the result of the XPS result. Meanwhile, the electron transfer from Fe to Co and V optimizes the eg filling of Co, V and Fe sites, which is beneficial or the surface reconstruction to CoOOH and FeOOH during OER process.
Conclusions
We use a simple preparation route to grow CoV2O6 on the surface of pre-Fe-treated nickel foam. Through a redox reaction (2Fe3+ + 2Ni → 2Fe2+ + Ni2+), it introduced Fe2+ into the CoV2O6 system. The 3d electron interaction of Co–O–Fe–O–V turns Fe2+ into a novel electronic structure of Fe(2+δ)+. The Fe(2+δ)+ is beneficial for reacting with the adsorbed OH− and finally derives an accelerated OER process. The CoV2O6–Fe–NF exhibits superior OER activity with an overpotential of 298 mV to drive a current density of 100 mA cm−2. This work introduces a new strategy for the development of novel electrocatalysts towards OER and can be broadly applied to the exploration of advanced materials in generalized catalysis applications.Author contributions
Yuchao Guo conceived the project, performed most of the experimental work, and drafted part of the manuscript. Yi Feng conceived and supervised the project, revised the entire paper. Gaojie Yan made the in situ-Raman experiments. Xi Sun, Shuo Wang and Li Chen analyzed some experiment data.Conflicts of interest
The authors declare no competing financial interests.Acknowledgements
The acknowledgements come at the end of an article after the conclusions and before the notes and references. This work was supported by the China Central Government Guide for the Development of Local Science and Technology Special Funds (226Z1202G) and Natural Science Foundation of Hebei Province (Grant No. B2020202042, B2020202073).References
- J. Bonan, C. Cattaneo, G. Adda and M. Tavoni, Combining information on others' energy usage and their approval of energy conservation promotes energy saving behaviour, Nat. Energy, 2020, 5, 832–833, DOI:10.1038/s41560-020-00727-z.
- L. Zhang, H. Zhao, S. Xu, Q. Liu, T. Li, Y. Luo, S. Gao, X. Shi, A. M. Asiri and X. Sun, Recent advances in 1D electrospun nanocatalysts for electrochemical water splitting, Small Struct., 2021, 2, 2000048, DOI:10.1002/sstr.202000048.
- S. Geng, F. Tian, M. Li, X. Guo, Y. Yu, W. Yang and Y. Hou, Hole rich CoP nanosheets with an optimized d-band center for enhancing pH-universal hydrogen evolution electrocatalysis, J. Mater. Chem. A, 2021, 9, 8561–8567, 10.1039/D1TA00044F.
- L. Zhang, H. Zhao, S. Xu, Q. Liu, T. Li, Y. Luo, S. Gao, X. Shi, A. M. Asiri and X. Sun, Co-metal-organic framework derived CoSe2@MoSe2 core-shell structure on carbon cloth as an efficient bifunctional catalyst for overall water splitting, Chem. Eng. J., 2022, 429, 132379, DOI:10.1016/j.cej.2021.132379.
- B. M. Hunter, H. B. Gray and A. M. Muller, Earth-abundant heterogeneous water oxidation catalysts, Chem. Rev., 2016, 116, 14120–14136, DOI:10.1021/acs.chemrev.6b00398.
- Z. W. Seh, J. Kibsgaard, C. F. Dickens, I. Chorkendorff, J. K. Nørskov and T. F. Jaramillo, Combining theory and experiment in electrocatalysis: Insights into materials design, Science, 2017, 355, eaad4998, DOI:10.1126/science.aad4998.
- M. W. Glasscott, A. D. Pendergast, S. Goines, A. R. Bishop, A. T. Hoang, C. Renault and J. E. Dick, Electrosynthesis of high entropy metallic-glass nanoparticles for designer, multi-functional electrocatalysis, Nat. Commun., 2019, 10, 2650, DOI:10.1038/s41467-019-10303-z.
- C. Hu, L. Zhang and J. Gong, Recent progress made in the mechanism comprehension and design of electrocatalysts for alkaline water splitting, Energy Environ. Sci., 2019, 12, 2620–2645, 10.1039/C9EE01202H.
- W. J. Jiang, T. Tang, Y. Zhang and J. S. Hu, Synergistic modulation of non-precious-metal electrocatalysts for advanced water splitting, Acc. Chem. Res., 2020, 53, 1111–1123, DOI:10.1021/acs.accounts.0c00127.
- Y. Wang, D. Wang and Y. Li, A fundamental comprehension and recent progress in advanced Pt-based ORR nanocatalysts, Smart Mater., 2021, 2, 56–75, DOI:10.1002/smm2.1023.
- Y. Zhu, Q. Lin, Y. Zhong, H. A. Tahini, Z. Shao and H. Wang, Metal oxide-based materials as an emerging family of hydrogen evolution electrocatalysts, Energy Environ. Sci., 2020, 13, 3361–3392, 10.1039/D0EE02485F.
- K. N. Dinh, Q. Liang, C. Du, J. Zhao, A. I. Y. Tok, H. Mao and Q. Yan, Nanostructured metallic transition metal carbides, nitrides, phosphides, and borides for energy storage and conversion, Nano Today, 2019, 25, 99–121, DOI:10.1016/j.nantod.2019.02.008.
- Y. Guo, T. Park, J. W. Yi, J. Henzie, J. Kim, Z. Wang, B. Jiang, Y. Bando, Y. Sugahara, J. Tang and Y. Yamauchi, Nano architectonics for transition-metal-sulfide-based electroc-atalysts for water splitting, Adv. Mater., 2019, 31, 1807134, DOI:10.1002/adma.201807134.
- Z. Pu, T. Liu, I. S. Amiinu, R. Cheng, P. Wang, C. Zhang, P. Ji, W. Hu, J. Liu and S. Mu, Transition-metal phosphides: activity origin energy related electrocatalysis applications and synthetic strategies, Adv. Funct. Mater., 2020, 30, 2004009, DOI:10.1002/adfm.202004009.
- R. Zhang, G. Wang, Z. Wei, X. Teng, J. Wang, J. Miao, Y. Wang, F. Yang, X. Zhu, C. Chen, E. Zhou, W. Hu and X. Sun, A Fe-Ni5P4/Fe-Ni2P heterojunction electrocatalyst for highly efficient solar-to-hydrogen generation, J. Mater. Chem. A, 2021, 9, 1221–1229, 10.1039/D0TA08631B.
- Y. Huang, L. Hu, R. Liu, Y. Hu, T. Xiong, W. Qiu, M. S. J. T. Balogun, A. Pan and Y. Tong, Nitrogen treatment generates tunable nanohybridization of Ni5P4 nanosheets with nickel hydr(oxy)oxides for efficient hydrogen production in alkaline, seawater and acidic media, Appl. Catal., B, 2019, 251, 181–194, DOI:10.1016/j.apcatb.2019.03.037.
- J. Jiang, F. Sun, S. Zhou, W. Hu, H. Zhang, J. Dong, Z. Jiang, J. Zhao, J. Li, W. Yan and M. Wang, Atomic-level insight into super-efficient electrocatalytic oxygen evolution on iron and vanadium co-doped nickel(oxy)hydroxide, Nat. Commun., 2018, 9, 2885, DOI:10.1038/s41467-018-05341-y.
- A. Singh and R. Singh, Effect of V substitution at B-site on the physicochemical and electrocatalytic properties of spinel-type NiFe2O4 towards O2 evolution in alkaline solutions, Int. J. Hydrogen Energy, 2010, 35, 3243–3248, DOI:10.1016/j.ijhydene.2010.02.003.
- K. Fan, H. Chen, Y. Ji, H. Huang, P. M. Claesson, Q. Daniel, B. Philippe, H. Rensmo, F. Li, Y. Luo and Li. Sun, Nickel-vanadium monolayer double hydroxide for efficient electrochemical water oxidation, Nat. Commun., 2016, 7, 1–9, DOI:10.1038/ncomms11981.
- K. Fan, Y. Ji, H. Zou, J. Zhang, B. Zhu, H. Chen, Q. Daniel, Y. Luo, J. Yu and L. Sun, Hollow Iron-vanadium composite sphe-res: a highly efficient iron-based water oxidation electrocatalyst without the need for nickel or cobalt, Angew. Chem., Int. Ed., 2017, 56, 3289–3293, DOI:10.1002/anie.201611863.
- K. N. Dinh, P. Zheng, Z. Dai, Y. Zhang, R. Dangol, Y. Zheng, B. Li, Y. Zong and Q. Yan, Ultrathin porous NiFeV ternary layer hydroxide nanosheets as a highly efficient bifunctional electrocatalyst for overall water splitting, Small, 2018, 14, 1703257, DOI:10.1002/smll.201703257.
- Y. Liu, Y. Ying, L. Fei, Y. Liu, Q. Hu, G. Zhang, S. Y. Pang, W. Lu, C. L. Mak and X. Luo, Valence engineering via selective atomic substitution on tetrahedral sites in spinel oxide for highly enhanced oxygen evolution catalysis, J. Am. Chem. Soc., 2019, 141, 8136–8145, DOI:10.1021/jacs.8b13701.
- A. Hickling and S. Hill, Oxygen overvoltage, Part I, The influence of electrode material, current density, and time in aqueous solution, Faraday Discuss., 1947, 1, 236–246, 10.1039/DF9470100236.
- D. Friebel, M. W. Louie, M. Bajdich, K. E. Sanwald, Y. Cai, A. M. Wise, M. J. Cheng, D. Sokaras, T. C. Weng, R. A. Mori, R. C. Davis, J. R. Bargar, J. K. Norskov, A. Nilsson and A. T. Bell, Identification of highly active Fe sites in (Ni, Fe)OOH for electrocatalytic water splitting, J. Am. Chem. Soc., 2015, 137, 1305–1313, DOI:10.1021/ja511559d.
- X. Wang, J. Luo, Y. Tuo, Y. Gu, W. Liu, S. Wang, Y. Zhou and J. Zhang, Hierarchical heterostructure of NiFe2O4 nanoflakes grown on the tip of NiCo2O4 nanoneedles with enhanced interfacial polarization effect to achieve highly efficient electrocatalytic oxygen evolution, Chem. Eng. J., 2023, 457, 1385–8947, DOI:10.1016/j.cej.2022.141169.
- Y. Yang, L. Dang, M. J. Shearer, H. Sheng, W. Li, J. Chen, P. Xiao, Y. Zhang, R. J. Hamers and S. Jin, Highly active trimetallic NiFeCr layered double hydroxide electrocatalysts for oxygen evolution reaction, Adv. Energy Mater., 2018, 8, 170318, DOI:10.1002/aenm.201703189.
- M. Görlin, P. Chernev, J. F. D. Araújo, T. Reier, S. Dresp, B. Paul, R. Krähnert, H. Dau and P. Strasser, Oxygen evolution reaction dynamics faradaic charge efficiency and the active metal redox states of Ni-Fe oxide water splitting electrocatalysts, J. Am. Chem. Soc., 2016, 138, 5603–5614, DOI:10.1021/jacs.6b00332.
- X. Long, G. Li, Z. Wang, H. Zhu, T. Zhang, S. Xiao, W. Guo and S. Yang, Metallic iron-nickel sulfide ultrathin nanosheets as a highly active electrocatalyst for hydrogen evolution reaction in acidic media, J. Am. Chem. Soc., 2015, 137, 11900–11903, DOI:10.1021/jacs.5b07728.
- X. Xu, F. Song and X. Hu, A nickel iron diselenide-derived efficient oxygen evolution catalyst, Nat. Commun., 2016, 7, 12324, DOI:10.1038/ncomms12324.
- H. He, C. Miao, H. Guo, W. Hua, Y. Yue and Z. Gao, Ethane dehydrogenation over Co-based MOR zeolites Reaction Kinetics, React. Kinet., Mech. Catal., 2022, 135, 2045–2058, DOI:10.1007/s11144-022-02231-9.
- X. Zhang and L. Wu, Polyvinyl pyrrolidone regulated Co, N co-doped porous carbon for oxygen reduction reaction, Ionics, 2022, 28, 3435–3543, DOI:10.1007/s11581-022-04581-9.
- J. Li, M. Li and Z. Jin, ZIF-67 derived hierarchical hollow Co3S4@Mo2S3 dodecahedron with an S-scheme surface heterostructure for efficient photocatalytic hydrogen evolution, Catal. Sci. Technol., 2022, 12, 1144–1158, 10.1039/D1CY01757H.
- W. Gong, H. Zhang, L. Yang, Y. Yang, J. Wang and H. Liang, Core@shell MOFs derived Co2P/CoP@ NPGC as a highly-active bifunctional electrocatalyst for ORR/OER, J. Ind. Eng. Chem., 2022, 106, 492–502, DOI:10.1016/j.jiec.2021.11.032.
- Q. Hu, M. Tang, M. He, N. Jiang, C. Xu, D. Lin and Q. Zheng, Core-shell MnO2@CoS nanosheets with oxygen vacancies for high-perfo-rmance supercapattery, J. Power Sources, 2020, 446, 227335, DOI:10.1016/j.jpowsour.2019.227335.
- Y. Liu, G. Han, X. Zhang, C. Xing, C. Du, H. Cao and B. Li, Co-Co3O4@carbon core-shells derived from metal-organic framework nanocrystals as efficient hydrogen evolution catalysts, Nano Res., 2017, 10, 3035–3048, DOI:10.1007/s12274-017-1519-1.
- X. Li, J. Ge, J. Zhou and B. Lu, SbVO4 based high capacity potassium anode: a combination of conversion and alloying reactions, Sci. China: Chem., 2021, 64, 238–244, DOI:10.1007/s11426-020-9858-3.
- X. X. Li, L. Zhang, L. Yuan, T. Wang, L. Z. Dong, K. Huang, J. Liu and Y. Q. Lan, Constructing crystalline redox catalyst to achieve efficient CO2 photoreduction reaction in water vapor, Chem. Eng. J., 2022, 442, 136157, DOI:10.1016/j.cej.2022.136157.
- F. N. I. Sari, S. Abdillah and J. M. Ting, FeOOH-containing hydrated layered iron vanadate electrocatalyst for superior oxygen evolution reaction and efficient water splitting, Chem. Eng. J., 2021, 416, 129165, DOI:10.1016/j.cej.2021.129165.
- M. Kuang, J. Zhang, D. Liu, H. Tan, K. N. Dinh, L. Yang, H. Ren, W. Huang, W. Fang, J. Yao and X. Hao, Amorphous/crystalline heterostructured cobalt-vanadium-iron(oxy)hydroxides for highly efficient oxygen evolution reaction, Adv. Energy Mater., 2020, 10, 2002215, DOI:10.1002/aenm.202002215.
- R. Zhang, Z. Wei, G. Ye, G. Chen, J. Miao, X. Zhou, X. Zhu, X. Cao and X. Sun, d-Electron Complementation” induced V-Co phosphide for efficient overall water splitting, Adv. Energy Mater., 2021, 11, 2101758, DOI:10.1002/aenm.202101758.
- L. Chen, R. Deng, S. Guo, Z. Yu, H. Yao, Z. Wu, K. Shi, H. Li and S. Ma, Synergistic effect of V and Fe in Ni/Fe/V ternary layered double hydroxides for efficient and durable oxygen evolution reaction, Front. Chem. Sci. Eng., 2023, 17, 102–115, DOI:10.1007/s11705-022-2179-6.
- H. Huang, Y. Li, W. Li, S. Chen, C. Wang, M. Cui and T. Ma, Enhancing oxygen evolution reaction electrocatalytic performance with vanadium-doped Co/CoO encapsulated in carbon nanorod, Inorg. Chem. Commun., 2019, 103, 1–5, DOI:10.1016/j.inoche.2019.02.041.
- C. Shi, Y. Yuan, Q. Shen, X. Yang, B. Cao, B. Xu, B. Kang, Y. Sun and C. Li, Encapsulated ruthenium nanoparticles activated few-layer carbon frameworks as high robust oxygen evolution electrocatalysts in acidic media, J. Colloid Interface Sci., 2022, 612, 488–495, DOI:10.1016/j.jcis.2021.12.150.
- Z. Xiao, W. Zhou, N. Zhang, C. Liao, S. Huang, G. Chen, G. Chen, M. Liu, X. Liu and R. Ma, Lithium doped nickel oxide nanocrystals with a tuned electronic structure for oxygen evolution reaction, Chem. Commun., 2021, 57, 6070–6073, 10.1039/D1CC01655E.
- Y. Yang, Y. Kang, H. Zhao, X. Dai, M. Cui, X. Luan, X. Zhang, F. Nie, Z. Ren and W. Song, An interfacial electron transfer on tetrahedral NiS2/NiSe2 heterocages with dual-phase synergy for efficiently triggering the oxygen evolution reaction, Small, 2020, 16, 1905083, DOI:10.1002/smll.201905083.
- B. Zhang, Z. Wu, W. Shao, Y. Gao, W. Wang, T. Ma, L. Ma, S. Li, C. Cheng and C. Zhao, Interfacial atom-substitution engineered transition-metal hydroxide nanofibers with high-valence Fe for efficient electrochemical water oxidation, Angew. Chem., Int. Ed., 2022, 61, e202115331, DOI:10.1002/anie.202115331.
- W. Guo, J. Kim, H. Kim and S. H. Ahn, Cu-Co-P electrodeposited on carbon paper as an efficient electrocatalyst for hydrogen evolution reaction in anion exchange membrane water electrolyzers, Int. J. Hydrogen Energy, 2021, 46, 19789–19801, DOI:10.1016/j.ijhydene.2021.03.120.
- A. Kapalka, G. Foti and C. Comninellis, Determination of the Tafel slope for oxygen evolution on boron-doped diamond electrode, Electrochem. Commun., 2008, 10, 607–610, DOI:10.1016/j.elecom.2008.02.003.
- N. T. Suen, S. F. Hung, Q. Quan, N. Zhang, Y. J. Xu and H. M. Chen, Electrocatalysis for the oxygen evolution reaction: recent development and future perspectives, Chem. Soc. Rev., 2016, 46, 337–365, 10.1039/C6CS00328A.
- K. Dastafkan, Q. Meyer, X. Chen and C. Zhao, Efficient oxygen evolution and gas bubble release achieved by a low gas bubble adhesive iron-nickel vanadate electrocatalyst, Small, 2020, 16, 2002412, DOI:10.1002/smll.202002412.
- I. Duo, A. Fujishima and C. Comninellis, Electron transfer kinetics on composite diamond(sp3)-graphite(sp2) electrodes, Electrochem. Commun., 2003, 5, 695–700, DOI:10.1016/S1388-2481(03)00169-3.
- H. Yin, H. Xiao, R. Qin, J. Chen, F. Tan, W. Zhang, J. Zhao, L. Zeng, Y. Hu, F. Pan, P. Lei and S. Yuan, Lattice Strain Mediated Reversible Reconstruction in CoMoO4·0.69H2O for Intermittent Oxygen Evolution, ACS Appl. Mater. Interfaces, 2023, 15, 20100–20109, DOI:10.1021/acsami.3c00544.
- X. Yu, R. B. Araujo, Z. Qiu, E. C. D. Santos, A. Anil, A. Cornell, L. G. M. Pettersson and M. Johnsson, Hydrogen evolution linked to selective oxidation of glycerol over CoMoO4 A theoretically predicted catalyst, Adv. Energy Mater., 2022, 12, 2103750, DOI:10.1002/aenm.202103750.
- S. J. Oh, D. C. Cook and H. E. Townsend, Characterization of iron oxides commonly formed as corrosion products on steel, Hyperfine Interact., 1998, 112, 59–66, DOI:10.1023/A:1011076308501.
- Y. F. Li and A. Selloni, Mechanism and activity of water oxidation on selected surfaces of pure and Fe-doped NiOx, ACS Catal., 2014, 4, 1148–1153, DOI:10.1021/cs401245q.
- J. Rossmeisl, A. Logadottir and J. K. Nørskov, Electrolysis of water on(oxidized) metal surfaces, Chem. Phys., 2005, 319, 178–184, DOI:10.1016/j.chemphys.2005.05.038.
- J. Hu, B. Qian, X. Zeng, Y. Qi, Y. Liu, L. Zhang and X. Zhang, Oxygen vacant Co3O4 in situ embedded on carbon spheres: cooperatively tuning electron transfer for boosted peroxymonosulfate activation, J. Mater. Chem. A, 2021, 9, 16489–16499, 10.1039/D1TA03963F.
- J. Yu and A. Kudo, Effects of structural variation on the photocatalytic performance of hydrothermally synthesized BiVO4, Adv. Funct. Mater., 2006, 16, 2163–2169, DOI:10.1002/adfm.200500799.
- Y. Liu, C. Xiao, P. Huang, M. Cheng and Y. Xie, Regulating the charge and spin ordering of two-dimensional ultrathin solids for electrocatalytic water splitting, Chem, 2018, 4, 1263–1283, DOI:10.1016/j.chempr.2018.02.006.
- R. Seidel, S. Thürmer, J. Moens, P. Geerlings, J. Blumberger and B. Winter, Valence photoemission spectra of aqueous Fe2+/3+ and [Fe(CN)6]4–/3–and their interpretation by DFT calculations, J. Phys. Chem. B, 2011, 115, 11671–11677, DOI:10.1021/jp203997p.
Footnote |
| † Electronic supplementary information (ESI) available. See DOI: https://doi.org/10.1039/d3ra02830e |
| This journal is © The Royal Society of Chemistry 2023 |

