Assembly of polyelectrolyte star block copolymers at the oil–water interface†
Jan-Michael Y.
Carrillo
 *a,
Zhan
Chen
b,
Uvinduni I.
Premadasa
c,
Christian
Steinmetz
b,
E. Bryan
Coughlin
 b,
Benjamin
Doughty
 *c,
Thomas P.
Russell
*bd and
Bobby G.
Sumpter
 a
a
aCenter for Nanophase Materials Sciences, Oak Ridge National Laboratory, Oak Ridge, Tennessee 37831, USA. E-mail: carrillojy@ornl.gov
bPolymer Science and Engineering Department, Conte Center for Polymer Research, University of Massachusetts, Amherst, MA 01003, USA. E-mail: russell@mail.pse.umass.edu
cChemical Sciences Division, Oak Ridge National Laboratory, Oak Ridge, Tennessee 37831, USA. E-mail: doughtybl@ornl.gov
dMaterials Sciences Division, Lawrence Berkeley National Laboratory, Berkeley, CA 94720, USA
First published on 22nd November 2022
Abstract
To understand and resolve adsorption, reconfiguration, and equilibrium conformations of charged star copolymers, we carried out an integrated experimental and coarse-grained molecular dynamics simulation study of the assembly process at the oil–water interface. This is important to guide development of novel surfactants or amphiphiles for chemical transformations and separations. The star block copolymer consisted of arms that are comprised of hydrophilic–hydrophobic block copolymers that are covalently tethered via the hydrophobic blocks to one point. The hydrophobic core represents polystyrene (PS) chains, while the hydrophilic corona represents quaternized poly(2-vinylpyridine) (P2VP) chains. The P2VP is modeled to become protonated when in contact with an acidic aqueous phase, thereby massively increasing the hydrophilicity of this block, and changing the nature of the star at the oil–water interface. This results in a configurational change whereby the chains comprising the hydrophilic corona are significantly stretched into the aqueous phase, while the hydrophobic core remains solubilized in the oil phase. In the simulations, we followed the kinetics of the anchoring and assembly of the star block copolymer at the interface, monitoring the lateral assembly, and the subsequent reconfiguration of the star via changes in the interfacial tension that varies as the degree-of-protonation increases. At low fractions of protonation, the arm cannot fully partition into the aqueous side of the interface and instead interacts with other arms in the oil phase forming a network near the interface. These insights were used to interpret the non-monotonic dependence of pH with the asymptotic interfacial tension from pendant drop tensiometry experiments and spectral signatures of aromatic stretches seen in vibrational sum frequency generation (SFG) spectroscopy. We describe the relationship of interfacial tension to the star assembly via the Frumkin isotherm, which phenomenologically describes anti-cooperativity in adsorbing stars to the interface due to crowding. Although our model explicitly considers long-range electrostatics, the contribution of electrostatics to interfacial tension is small and brought about by strong counterion condensation at the interface. These results provide key insights into resolving the adsorption, reconfiguration, and equilibrium conformations of charged star block copolymers as surfactants.
1 Introduction
Star block copolymers (BCP) are formed by joining multiple linear diblock copolymers to a single junction point, having one block form a core while the second block forms a corona surrounding the core.1 Owing to their unique architecture, star block copolymers can be molecularly dispersed in a medium (solvent or polymer) that is miscible with the corona block.2 If the core block is miscible with the matrix medium,3 the medium will penetrate into the core to an extent that will depend on the interactions between the core segments and the medium itself, which is limited by the configurational constraints of the convergent core chains and entropic constraints of the medium. However, if the core block is immiscible with the medium, the star block copolymer will form essentially a unimolecular micelle where the core block is “protected” from the medium.4,5 The extent to which this occurs will depend on the segmental interactions between the core block and the medium and the core block with the corona block. So, effectively, the core block remains hidden or is stealth in the matrix.If, we bring a second immiscible medium into contact with such a molecular dispersion, the fate of the star block copolymer will depend on the interfacial energy between the two media and the segmental interactions of the core block with the second medium. Only if the interfacial energy of the system is lowered by localizing the molecular micelle at the interface will the star block copolymers assemble at the interface. However, if the core block interacts favorably with the second medium, then the star block copolymer should reconfigure at the interface, with the corona chains preferentially residing in the original medium, while inverting and placing the core block preferentially in the second medium. Consequently, the star block copolymer will behave as a surfactant, a stealth surfactant, where the surfactant nature of the star block copolymer is not evident until it encounters the interface. If the dispersive media are polymers, segregating the core and corona blocks with these blocks preferentially locating in their respective polymer phase on opposite sides of the interface will reduce the interfacial energy, broaden the interface, and promote the adhesion between the two homopolymers. Such behavior was reported in molecular dynamics simulation of linear diblock copolymers grafted nanoparticles, where the interfacial tension between two immiscible phases was decreased, with the two blocks residing in the two different polymers.6
The interfacial assembly and reconfiguration will also be highly dependent on the medium where the star block copolymer is initially dispersed. A medium that is a good solvent for both blocks will facilitate the motions in the flexibile polymer chains in both the core and corona blocks, yielding an easier delivery of core blocks to the second phase. If the second phase interacts more favorable with the corona blocks in comparison to the core blocks, without a configurational inversion of the star block copolymers, the kinetic energy barrier for placing core and corona blocks in their favorable solvent is negligible. However, due to the confinement of chain ends, the interfacial assembly of the star block copolymers will be a highly cooperative process involving multiple arms. Unlike linear block copolymers, where the chains are, on average, oriented normal to the interface,7 the linking of the chains to a single junction point will force significant deviations from this simple picture. A reconfiguration can also be speculated during the assembly since there is no characteristic orientation of arms in the initial solvent or polymer. Hence, resolving the adsorption, reconfiguration, and equilibrium conformation of star block copolymers at fluid interfaces will be important to guide the use of star block copolymers as stealth surfactants. Molecular dynamic simulations, with the ability to visualize the kinetics of adsorption, reconfiguration and solve the equilibrium conformation statistically, is ideally suited to understand these complex systems and interfaces.8–11
Therefore, we investigated the interfacial assembly of 3-arm and 4-arm star block copolymers, comprising a polystyrene (PS) core block and a poly(2-vinyl pyridine) (P2VP) corona by molecular dynamics simulation. Since both PS and P2VP are oil-soluble, yet P2VP blocks are the more polar block, one would expect that the star block copolymers would assemble at the oil–water interface with the P2VP block preferentially located near the water side.12 P2VP can be protonated to quarternized poly(2-vinyl pyridinium) (QP2VP) under acid conditions, the degree-of-protonation of the P2VP block will be governed by the pH of the aqueous phase.13 Hence, PS-b-P2VP star block copolymers can be converted in situ to PS-b-QP2VP star block copolymers with a pH-controlled level of protonation, which affords an easy way to manipulate the amphiphilicity and interfacial behaviors of the star block copolymers. We anticipate that this control and the associated mechanisitic insight into the assembly behavior at oil–water interfaces will broadly enhance our understanding of the general class of charged star block copolymers for applications as stealth surfactants, or amphiphiles for chemical transformations and separations. Tunability of surface properties can be achieved by modifying the macromolecule's architecture (e.g., number of arms, composition of arms and degree-of-polymerization of blocks) and solvent affinity or hydrophilicity (e.g., degree-of-protonation and fraction of charged blocks).
2 Materials and methods
2.1 Simulation details
We modeled the assembly of star block copolymers at the oil–water interface as shown in Fig. 1(a and b). The model consisted of the star block copolymers, the dielectric solvent phase, and the oil phase. In this coarse-grained representation, all short-range pair-wise interactions can be described by the shifted truncated Lennerd-Jones (LJ) potential with a characteristic bead size σ, mass m and strength of interaction εLJ, all bond connectivity is described by finite extensible nonlinear elastic (FENE) bonds.14 (Further details are provided in the ESI†). There are mstar molecules in the simulation box. The star molecules have Narm number of arms with a degree-of-polymerization of Larm = 10, consisting of 5 cyan-colored hydrophobic PS beads and another 5 magenta or green-colored P2VP beads, that were initially dissolved in Noil beads, with an initial bulk star density, ϕs = NarmLarmmstar/Noil. The 0.5 fraction of PS beads in an arm was chosen to match the experimental system which has an approximately 50% PS-to-P2VP ratio. The difference between the magenta-colored and the green-colored P2VP beads is that the magenta-colored beads can gain a positive charge and can convert to QP2VP (blue-colored beads) following the ad hoc protonation reaction, as shown in Fig. 1(c). The number of magenta-colored and green-colored beads determine the degree-of-protonation, fq, with where nIP2VP is the number of inert P2VP (IP2VP) beads in an arm and nP2VP = 5. Similar to experiments, the model star block copolymer has the PS beads situated near the junction of the star while the P2VP beads comprising the other half of the arm are located at the chain ends, such that in aqueous environment, the PS segments will act as a core and the QP2VP segments can extend into the aqueous phase. IP2VP beads are randomly assigned in the P2VP block to specify fq.
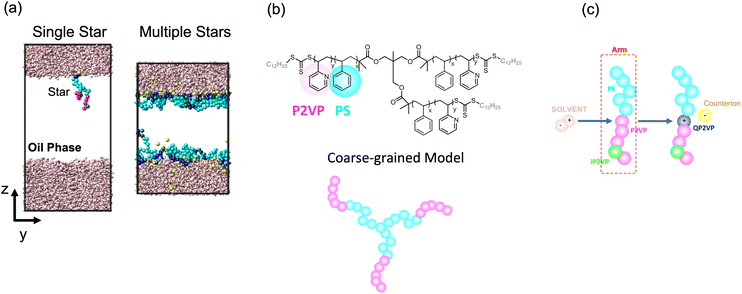 | ||
| Fig. 1 Simulation box showing a single star or multiple stars at the dielectric solvent-oil interface (a). Cyan beads are lyophilic beads representing PS, blue beads are quaternized P2VP or QP2VP, green beads are inert P2VP beads or IP2VP, pink rods are dielectric solvent molecules representing the aqueous phase and oil beads are not shown for clarity. Atomistic and coarse-grained representation of a 3-arm PS-P2VP block copolymer star (b). Ad hoc protonation reaction where a dipolar solvent molecule is consumed when the positively charged end of the solvent molecule comes into contact with a P2VP bead (within a 1.3σ cutoff). The P2VP bead is quarternized to QP2VP, which is positively charged, and a counterion is dissociated (c). Movies of the systems shown in (a) illustrating the ad hoc protonation reaction and the assembly of stars at the interface are provided in the ESI.† | ||
The dielectric solvent, representing water, is modeled as charged dumbbells having two opposite charges of a magnitude q, mass of 0.5m, and separated by a distance of 0.5σ. The pairwise interactions of dielectric solvent beads include both short-range LJ interaction and long-range Coulomb interactions. We calculate the static dielectric constant of the solvent through the variance of the system dipole moment15,16 in solvent-only simulations (see Fig. S1†), and we can tune the value of the static dielectric constant by changing the value of q (See ESI† for more details.). We chose q = 0.25e, where e is the elementary charge, from which ε = 9.1 ± 0.2 which is greater than the ε = 1 of the oil phase. Furthermore, we chose the short-range pair-wise parameters such that PS and solvent beads are incompatible with the dielectric phase, while P2VP beads are slightly more compatible. The oil phase is represented as LJ beads where the oil and solvent beads are incompatible, PS beads are miscible with the oil beads and P2VP beads are slightly less miscible with the oil beads relative to PS beads. The pair-wise potential parameters are summarized in Table S1.†
The protocol for performing the MD simulations consisted of several steps, which included: (1) initial isothermal-isobaric (NPT) equilibration, (2) NPT equilibration where protonation is incorporated as described in the ad hoc protonation reaction of Fig. 1(c), (3) another NPT equilibration and (4) a canonical (NVT) production run where the size of the simulation box was deformed to the average dimensions of the previous equilibration step (step 3). All simulations were performed using the LAMMPS molecular dynamics simulations software package.17,18 and the results presented are ensemble averages from NVT production runs. Further details of the simulations are presented in the ESI.†
2.2 Experiment details
Polymerization of styrene using pentaerythritol tetrakis[2-(dodecylthiocarbonothioylthio)-2-methylpropionate]. Dry styrene (15 mL, 13.7 g, 131.4 mmol, 4 × 100 equiv.) was added to a 100 mL Schlenk flask equipped with a magnetic stir bar containing pentaerythritol tetrakis[2-(dodecylthiocarbonothioylthio)-2-methylpropionate] (500 mg, 0.33 mmol, 1 equiv. CTA4) and AIBN (10 mg, 0.066 mmol, 4 × 0.05 equiv.) dissolved in 50 mL dry 1,4-dioxane. The flask was closed with a septum and underwent three freeze–pump–thaw cycles before it was immersed into an oil bath pre-heated to 70 °C. After a prescribed reaction time, the polymerization was quenched in an ice bath, diluted with tetrahydrofuran (THF) to lower the viscosity and precipitated into ice-cold methanol. The supernatant methanol was decanted and the residual precipitated polymer was dissolved in THF and precipitated a second time in ice-cold methanol to remove residual styrene monomer. The twice precipitated polymer was collected in a Büchner funnel via suction filtration and dried under vacuum over night to yield (PS-macro-CTA)4 as a light yellow white powder.
The NMR spectrum of 4-arm star PS core block is shown in Fig. S4.† The peak at δ ≈ 3.25 ppm was assigned to the two methylene protons (Hb) of the dodecyl chain alpha to the trithiocarbonate group, while the broad peak between δ ≈ 4.7 and 5.1 ppm was assigned to the benzylic proton (Ha) of the terminal styrene unit bonded to the trithiocarbonate group, with the region between δ ≈ 6.2 and 7.2 ppm integrated as the aromatic protons (Hc). The molecular weight (MW) and dispersity was determined by Dimethylformamide-gel permeation chromatograph (DMF GPC) calibrated with polystyrene standards, which was found Mn 11![[thin space (1/6-em)]](https://www.rsc.org/images/entities/char_2009.gif) 290 g mol−1 (2800 g mol−1 per arm) with PDI 1.13 (Fig. S6†).
290 g mol−1 (2800 g mol−1 per arm) with PDI 1.13 (Fig. S6†).
Chain extension using 2-vinyl pyridine. The chain extension with 2-vinyl pyridine was performed using the synthesized 4-arm star PS core blocks as the RAFT agent in a split batch approach. In three 20 mL scintillation vials with septum caps, to each was added 1.0 g (4-arm star PS core blocks) (0.077 mmol, 1 equiv.) were dissolved in 5 mL dry 1,4-dioxane and 0.25 mL of a 10 mg mL−1 AIBN solution in 1,4-dioxane (0.25 mg, 0.015 mmol, 4 × 0.05 equiv.). Then 6.7 mL (62 mmol, 4 × 200 equiv.) 2-vinyl pyridine was added to the solution. The scintillation vials were closed with a screw on septum cap and purged with nitrogen for 15 minutes before heating at 70 °C in an oil bath for one week. The solutions were precipitated into 50 mL centrifuge tubes filled with 40 mL of ice-cold diethyl ether. If the reaction solution was too viscous (especially the higher targeted molecular weight) the solution was diluted with an appropriate amount of THF prior to precipitation. The samples were centrifuged at 4000 rpm for 10 minutes after which the supernatant was decanted. The centrifuged polymer in the tube was dried under vacuum over night to yield final product as a dark orange glassy solid.
Determining the molecular weight of the star architecture by GPC is not viable since the blocks of the block copolymer have different hydrodynamic radii leading to a misrepresentation of the true molecular weight by this relative method calibrated against a homopolymer. Calculating the molecular weight by end-group analysis using NMR to determine the molecular weight is less suited for the molecular weight determination for high molecular weights as the end-groups become less well resolved in the spectrum close to the baseline. Therefore, the degree of polymerization (DP) of 2-vinyl pyridne was calculated by the ratio of 2-vinyl pyridine to styrene using 1H NMR with deuterated chloroform (CDCl3) as solvent. The spectrum of the 4-arm star is given in Fig S5,† where the peak between δ ≈ 8.0 and 8.4 ppm was assigned to the aromatic proton ortho to the nitrogen atom (Hd), while the peaks between δ ≈ 6.1 and 7.3 ppm were assigned to the residual of aromatic protons of the polymer (Hc and He). The molar fraction of styrene and 2-vinyl pyridine in the block copolymer star was calculated using the equation
 | (1) |
Vibrational sum frequency generation spectroscopy (SFG) was performed using a homebuilt system described elsewhere.19–22 Briefly, broadband mid-infrared (centered near 3000 cm−1 and narrowband near-infrared pulses (centered near 803 nm, 1 nm bandwidth at full width half maximum) were spatially and temporally overlapped at a the sample interface at a 60 degree angle with respect to the surface normal. The radiated SFG signal was collected in a reflection geometry, polarization resolved, spectrally dispersed and detected with a CCD camera (Newton, Andor). Exposure times of 5 minutes were averaged over six frames for each spectra presented below. Raw SFG intensity spectra were background subtracted and scaled to the non-resonant response of a gold film. All spectra presented were taken in the SSP polarization combination. The aqueous phase was pH adjusted immediately before measurements using concentrated HCl. Liquid–liquid interfaces were prepared by adding 40 μL of polymer dissolved in d8-toluene at 0.1 mg mL−1 concentrations to the prepared aqueous phase.
3 Results and discussion
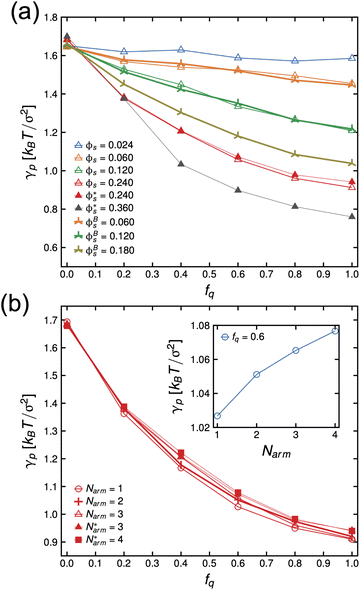
When the protonation reaction is complete after all P2VP beads are converted to QP2VP beads, and the chain configuration has reached its equilibrium, following the simulation protocol described above, we proceeded to calculate the interfacial tension, γp, by taking an ensemble average of the difference between the normal and tangential pressures.23–25 For our configuration where the z axis is in the direction normal to the interface, interfacial tension is, | (2) |
We describe the behavior of γp in terms of an adsorption isotherm which relates the surface concentration, Γ, of the surface active component to γp at constant temperature. The surface active component is QP2VP and Γ is evaluated as,  where ρ(z) is the density distribution of QP2VP as shown in Fig. 3. There are two interfaces and ρ(z) is the average of the two interfaces as shown in Fig. 3(c). γp can be expressed as the sum of the contributions from four components:28,29 (1) the pure solvent-oil interface without the stars, γ0, (2) the ideal 2D lattice adsorption sites, γideal, (3) cohesive interactions among adsorbed components γcohesive and (4) from electrostatic contributions, γelectrostatic, such that,
| γp = γ0 + γideal + γcohesive + γelectrostatic. | (3) |
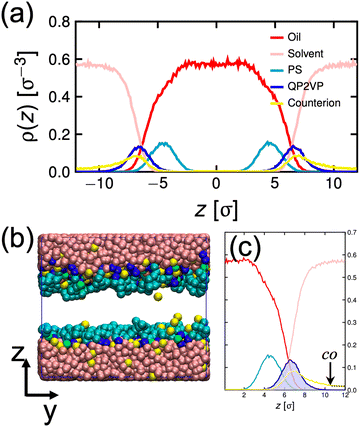 | ||
| Fig. 3 Density distribution of oil, solvent (water), PS, QP2VP and counterion beads normal to the interface, ρ(z) for the system with mstar = 40, ϕs = 0.24 and fq = 0.8 (a). Snapshot of the equilibrated oil-aqueous interface (b). Average of ρ(z) from the two interfaces (c). The dotted line in (c) is the counterion distribution using eqn (5) evaluated from co. | ||
γ 0 is determined by performing MD simulation of a system without stars and then calculating γ0 using eqn (2) and is found to be γ0 = 1.635kBT/σ2. First, we neglect the electrostatic contributions and describe γp as,
 | (4) |
Next, to incorporate electrostatics, we observe from data in Fig. 3 that counterions in the solvent phase have peaks in their density distributions (ρc(z)) that coincide with that of QP2VP (ρQ(z)) suggesting that counterions are localized near the QP2VP beads and are associated with charged segments. We envision the distribution of the counterions in the aqueous phase as a diffused electrical double layer originating from the surface charge density of the positively charged protonated adsorbed star arms at the interface. The effective surface charge, Σ, is obtained from the density distribution as  , where co is the cutoff distance from which QP2VP beads are zero in the density distribution. Typical values of Σ are 0.005–0.04e/σ2. We solve the nonlinear Poisson–Boltzmann equation, which couples the distribution of counterions with electrostatic potential, to estimate the counterion distribution in this region using the estimated value of the Bjerrum lengh,
  , in our solvent by using the equation,
 | (5) |
 , and the parameter s is the solution to the equation s
![[thin space (1/6-em)]](https://www.rsc.org/images/entities/char_2009.gif) tan(s) = 2πlBΣh.33–35 Sample plots of ρc(z) using eqn (5) are shown in Fig. 3(c) and Fig. S3.† Thereafter, we estimate the surface charge potential, Ψ0, from Σ using the Grahame equation,36
tan(s) = 2πlBΣh.33–35 Sample plots of ρc(z) using eqn (5) are shown in Fig. 3(c) and Fig. S3.† Thereafter, we estimate the surface charge potential, Ψ0, from Σ using the Grahame equation,36 | (6) |
 | (7) |
In Fig. 4(a), we present the dependence of γp − γelectrostatic to Γ for different, ϕs, fq and Narm, and then fit the data with the Frumkin isotherms using eqn (4). We observe a better qualitative agreement with the Frumkin isotherm than the Langmuir isotherm with α > 0 suggesting anti-cooperative adsorption where adsorption becomes more difficult as the interface becomes more crowded. The fitting procedure involves setting the fitting parameter α as a function of fq and determining a unique Γ∞ per Narm and fq. For a constant fq, the chemical composition of an arm is constant, hence the rationale for using a single α for systems having the same fq. However, Γ∞ needs to be fitted for different Narm because different Narm-stars pack differently at the interface. The fit parameters from the lines in Fig. 4(a) are listed in Table 1. We observe that there is a non-monotonic dependence of α on fq. This can be attributed to the strong interaction of QP2VP beads with the aqueous phase at higher values of fq and the interaction of PS and IP2VP beads (or neutral P2VP beads) in the oil-phase at lower values of fq. We also observe that Γ∞ is increasing with increasing values of Narm at constant fq, suggesting that it is more difficult to pack stars with more Narm at the interface. In other words, α parallels the enthalpic interactions of the star with the solvents and Γ∞ pertains to the entropic nature of the arms being connected to a core to form a star polymer.
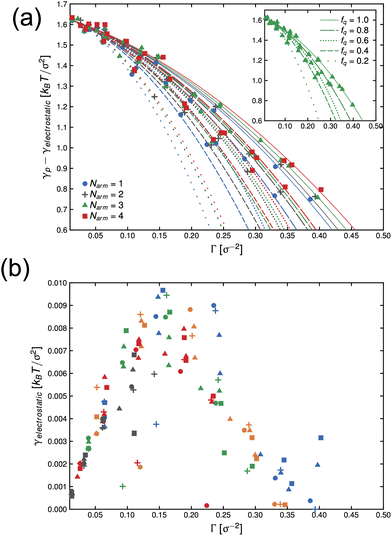 | ||
| Fig. 4 Dependence of γp − γelectrostatic with surface concentration of the active component, Γ, for different systems of stars with number of arms, Narm, and degree-of-protonation fq (a). Lines in (a) are fits to eqn (4) and inset in (a) shows the system with Narm = 3. Solid, long-dashed, dotted, short-dashed and loosely-dotted lines pertains to fq of 1.0, 0.8, 0.6, 0.4 and 0.2, respectively. The electrostatic component of interfacial tension, γelectrostatic, is given by eqn (7). The symbols in (b), •, +, ▲ and ■ pertains to systems with Narm of 1, 2, 3 and 4, respectively. The colors of the symbols in (b): blue, orange, green, red and gray pertains to fq of 1.0, 0.8, 0.6, 0.4 and 0.2, respectively. | ||
| Γ ∞ [σ−2] | |||||
|---|---|---|---|---|---|
| f q | α | N arm = 1 | N arm = 2 | N arm = 3 | N arm = 4 |
| 1.0 | 3592 | 515.9 | 547.5 | 593.7 | 645.4 |
| 0.8 | 7.974 | 0.927 | 1.040 | 1.089 | 1.132 |
| 0.6 | 3.974 | 0.427 | 0.494 | 0.514 | 0.543 |
| 0.4 | 4993 | 280.8 | 325.8 | 368.5 | 382.2 |
| 0.2 | 7168 | 235.0 | 283.7 | 281.7 | 288.1 |
Thereafter, we use eqn (7) to evaluate the electrostatic contribution and the results for γelectrostatic are shown in Fig. 4(b). We observe that γelectrostatic values are small with a maximum of only ∼0.6% of the value for γ0. This suggests that the short-range hydrophilic interaction between the QP2VP block and the solvent is the dominant interaction contributing to γp. The electrostatic screening that reduces electrostatic repulsion among QP2VP beads can be attributed to the strong binding of counterions to charged segments which is expected even in dilute salt-free solutions of many-armed stars.39 Also, this counterion binding behavior is qualitatively in agreement with the results observed in simulations of diblock copolymers of PS-b-P2VP where stronger electrostatic interactions are expected because of a dielectric mismatch at the interface.7 Although it is also possible that in this work, the attractive effect of the dielectric mismatch is weaker than the short-range repulsive interactions between counterions and QP2VP beads leading to more counterions dissolving in the solvent phase, since counterions are more soluble in higher dielectric solvents (see Fig. S3†). More investigations are required to study the interplay between electrostatic and short-range interactions (e.g., hydrophobicity)40 in counterion binding.
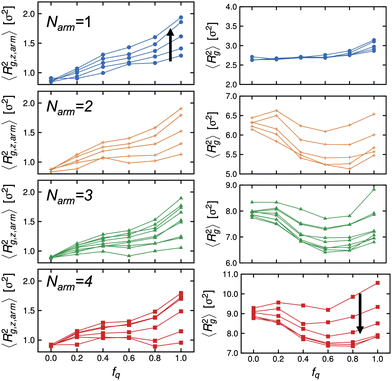
Next, we examine the conformations of these stars at the interface by calculating their mean-squared radius of gyration. We present the z-component of the mean-squared radius of gyration of the arms, 〈Rg,z,arm2〉 descriptive of the extent to which they protrude into either bulk phase, and that of the of individual stars, 〈Rg2〉, in Fig. 5 (left) and (right) panels, respectively. We observe that the arms are not uniformly stretched as a function of the degree-of-protonation, fq, and there is non-monotonic dependence of the mean-squared radius of gyration of the individual stars to fq, except for the Narm = 1 system which is essentially a diblock copolymer lacking the core and has more freedom to reorient itself with respect to the interface.
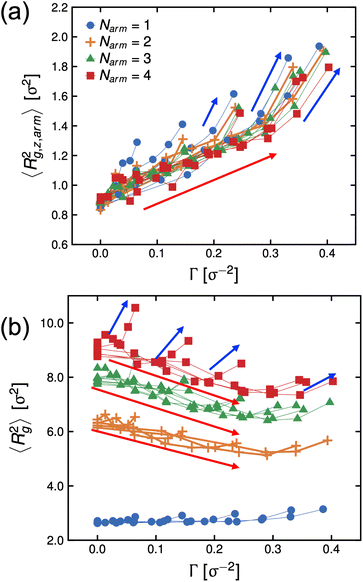
In Fig. 6, we re-plot the radius of gyration data as a function of Γ to map these systems to the adsorption isotherm. At low degrees-of-protonation, the mean-squared radius of gyration values follow a similar behavior (see red arrows in Fig. 6), and 〈Rg,z,arm2〉 is increasing while 〈Rg2〉 is deceasing as a function of Γ. The data points of 〈Rg2〉 have the same behavior for the same Narm. However, at higher values of fq, the arms become significantly more stretched, and the size of the molecules becomes larger (see blue arrows in Fig. 6) which deviates from the adsorption isotherm behavior seen for low values of fq, (see red arrows in Fig. 6), suggesting abrupt conformational changes brought about by the increase in hydrophilicity of the P2VP block.
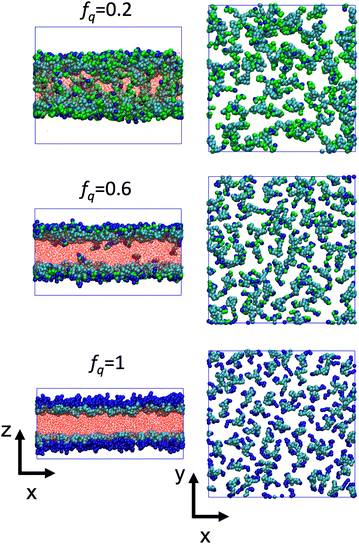
The conformational changes are apparent when we examine snapshots of simulations (see Fig. 7), at lower degrees-of-protonation (see Fig. 7 at fq = 0.2), the arm cannot fully anchor itself within the aqueous side of the interface and interacts with other arms in the oil phase. Here, we observe that the system is in the semi-dilute concentration regime in the oil-phase where star molecules are in contact with other star molecules. As the degree-of-protonation increases (see Fig. 7 at fq = 0.6), more of the P2VP arms are dissolved to the solvent, changing the conformation of stars from a 3D structure in solution to a more 2D-like structure at the interface. As more charged segments crowd the interface, the size of the star shrinks to accommodate more of the P2VP block. At higher degrees-of-protonation (see Fig. 7 at fq = 1.0), more charged segments are dissolved in the solvent and the arms are well-stretched, while the PS core remains in the oil phase. This results in the star molecule becoming elongated, hence 〈Rg2〉 abruptly increases.
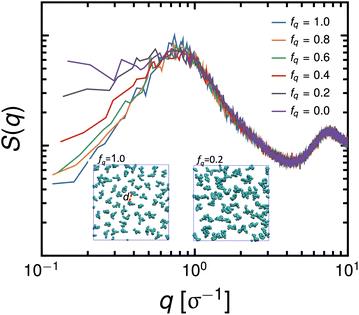
To complement our analysis of the assembled polymer structure at the interface, we probed the in-plane structure by calculating the 2D scattering function,  , of the PS beads at the interface.34,41 The brackets correspond to an ensemble average in time and between the two interfaces. We calculate S(q) by taking the Fourier transform of the surface concentration of PS beads, ΓPS(x, y), in the xy plane, and the resulting function
  is the product of
  with its complex conjugate
  . Then,
  is reduced to S(q), with
  . Shown in Fig. 8 are S(q)for the systems shown in Fig. 7. A characteristic peak in the spectra, q* = 2π/d, is seen for different values of fq, representing the distance between PS domains. At high values of fq, this peak is well-defined since the PS beads are strongly anchored by the QP2VP segments buried in the aqueous phase. At lower values of fq, the intensity of S(q) at the low-q region increases suggesting aggregation of the PS beads since PS molecules are less anchored, and the probability of PS beads interacting with other PS beads from a different star is larger.
3.1 Comparison with experiments
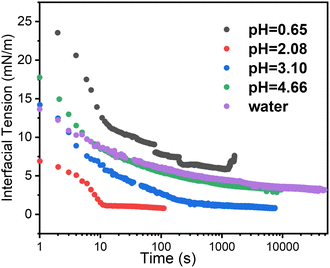
Time dependent interfacial tension, as measured by pendant drop tensiometry, of 4-arm star block copolymers with a PS core (2800 g mol−1 per arm) and P2VP corona (4200 g mol−1 per arm) dissolved in toluene against water are shown in Fig. 9 at the specified pH values. The lowest equilibrium interfacial tension was found at pH = 2.08 whereas the largest interfacial tension was observed at pH = 0.65. The pKa of P2VP at 55% protonation with HCl as titrant is reported to be 1.86.42 From a pH range of 2.08 to ∼7 (water), the degree-of-protonation in the P2VP block decreases, the asymptotic values of the interfacial tension increases, similar to the behavior found in the simulations (see Fig. 2). Given the highest interfacial tension was measured at pH = 0.65, we anticipate that the combination of strong electrostatic interactions and the packing of the PS cores will limit adsorption of additional star BCPs to the interface. This insight is supported by SFG measurements shown in Fig. 10 where we find spectral signatures of the aromatic stretches (3050 cm−1) that vary non-monotonically with pH. The intensity of an SFG signal informs on the local symmetry of the interface, population, and the orientation/ordering of the probed functional groups out of the interfacial plane. As such, the pH dependent spectral response suggests that at pHs below the pKa of P2VP, the interface is disordered such that there is no net out of plane orientation and/or that the interface is highly disordered. Alternatively, the arrangement of arms could assume conformations where the transition moments point parallel to the interfacial plane; however, since SFG only probes ordering out of the plane, we cannot comment on such an arrangement with the present data. At pH ∼2 we find a maximum in the SFG response for the aromatic stretch with contributions from methylene groups and associated Fermi resonances near (2850–2925 cm−1) originating from the polymer backbones that are co-organized at the interface. Recall that near pH ∼2, interfacial tension measurements showed a minimum in the asymptotic γp values that should correspond to the best ordered interfacial layer, which is in agreement with SFG results. As the pH increases we find that the ordering of the interface becomes poorer as evidenced by decreasing aromatic stretching intensities, which is again, in agreement with interfacial tension measurements.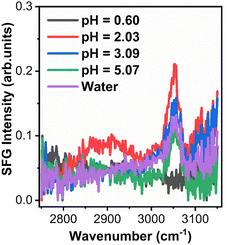 | ||
| Fig. 10 SFG spectra collected from 4-arm star block copolymers adsorbed to the d8-toluene-aqueous interface at various pHs. | ||
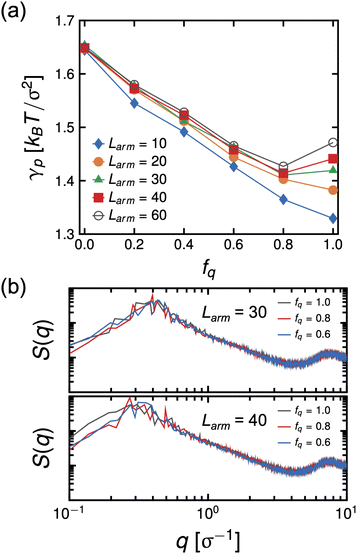
We did not see this effect in the simulations at Larm = 10. However, we note that the molecular weight in the experiment is significantly larger than that used in the simulation model, significantly amplifying the combined effects of strong electrostatic interactions and assembly of PS cores at the interface in the experiment. Therefore, to test our hypothesis, we performed MD simulations of systems having Narm = 4 at varying arm degrees-of-polymerization, Larm, ranging from 10 to 60 at a constant initial bulk star density ϕs = 0.096, which means that these systems have the same number of P2VP and PS beads and only the number of bonds is different. The system size of these simulations are also considerably larger than the previous set of simulations (8×) to allow for arms to relax and minimize contact between the two interfaces. The results of the simulations show that γp is non-monotonic with respect to fq for systems having Larm ≥ 30 with the minimum at fq ∼0.8. (See Fig. 11(a)) The intensity of the in-plane scattering of PS or S(q) at low-q values (S(q) → 0) is lowest for the fq corresponding to the lowest γp (see Fig. 11(b).). In the context of the experimental results, this suggests that the size of PS core aggregates is larger at the highest pH (pH = 0.65) relative to that of the size in the system with optimal pH where interfacial tension is lowest (pH = 2.08). This indicates that P2VP segments which are not dissolved in the aqueous phase disrupt the PS core aggregates thereby decreasing its size and allowing for more stars to adsorb to the interface.
For stars to adsorb to the interface, the stars must rearrange their arms to pass an activation barrier43 where the rearrangement of arms would be more difficult for arms with a higher degree-of-protonation and therefore larger molecular weights. We note, though, that 〈Rg2〉 is the lowest at intermediate values of fq in the 4-arm star simulation (see Fig. 5), indicating that the packing density (number of BCPs at the interface) would be the highest at a constant ϕs, that would lead to the lowest interfacial tension. Due to the stretching of arms at high protonation, as discussed above, the packing density will be considerably reduced, leading to a higher interfacial tensions at all other pH values in the experiment. Alternatively, it is also possible that the mechanism that gave rise to higher interfacial tension at very low pH is brought about by an effective star-interface repulsion because of counterion entropy and the reduction of free space available to them due to the presence of an impenetrable interface.10 We are currently performing more in depth experimental studies of the interfacial tension and configuration of the star block copolymer at the interface to further compare with the simulation results described here.
4 Conclusions
In this work we have shown that the interfacial tension, γp, of PS-b-P2VP stars assembling in an oil–water interface can be described by the Frumkin isotherm, where anti-cooperative adsorption occurs, or adsorption becomes more difficult as the interface becomes more crowded. The electrostatic contribution is relatively small, brought about by strong counterion condensation, and hydrophilic interaction between the charged P2VP block which is the dominant interaction contributing to γp. Simulation results show conformational changes of stars at the interface brought about by the increase in hydrophilicity of charged P2VP where the arms of the stars becomes significantly stretched into the aqueous phase, while the hydrophobic core remains solubilized in the oil phase, pegging the star in the interface. Furthermore, comparisons with tensiometry and SFG spectroscopy demonstrate that the coarse-grained model is capable of capturing interfacial tension trends as a function of pH and to infer the order of stars at the interface, respectively.One might question the necessity of using a star-block architecture when a linear diblock copolymer or BCP can also act as a surfactant. The difference in architecture would manifest in the kinetics of the adsorption process and to the value of the equilibrium interfacial energy. A BCP is more mobile and can easily assemble and reorient at the interface resulting in a lower value of γp relative to stars (see inset of Fig. 2(b)). However, the whole concept of the stealth surfactant is that one can have unimolecular structures that can be dispersed in a medium uniformly and, when it gets to the interface, undergo the reconfiguration to become a surfactant. This works whether the segmental interactions are very strongly non-favorable or if they are less favorable. With BCPs, that is not the case. If the segmental interactions are strongly non-favorable, dispersing the BCPs in a medium is generally not possible and the BCPs will tend to aggregate. If the segmental interactions are less strong, it may be possible to disperse the copolymer uniformly without aggregation, but the strength of surfactant is less, and they will not be as interfacially active. These behaviors have been shown experimentally, which is why a layer of BCPs are placed immediately at the interface (in a trilayer geometry A-(BCP A-B)-B) followed by lengthy thermal annealing to see the interfacial behavior.44,45 In essence, the star architecture shifts the critical micelle concentration (cmc) to higher concentrations. Note that in the current simulations, the data presented are for concentrations below the cmc. Experiments to investigate the kinetics of adsorption of stars with different number of arms and computational work on understanding the relationship of cmc and polymer architecture are underway and will be reported in separate manuscripts.
Finally, we envision that we can couple this methodology with high throughput simulations and machine learning algorithms thereby allowing for the optimization of key parameters such as degree-of-polymerization of arms, chemical composition of arms, number of arms, block sizes, and sequence of blocks. This will not only enhance our understanding, but also predict interfacial properties of the general class of charged star block copolymers for applications as stealth surfactants or amphiphiles for chemical transformations and separations.
Author contributions
Conceptualization – ZC, TPR and BGS; Data curation – JYC, ZC and CS; Formal analysis – JYC, ZC, BD and BGS; Funding acquisition – EBC, BD, TPR and BGS; Investigation – JYC, ZC, UIP, CS and BD; Methodology – JYC, ZC and UIP; Project administration – JYC, TPR and BGS; Resources – CS, EBC, TPR and BGS; Software – JYC; Supervision – EBC, TPR and BGS; Validation – JYC and UIP; Visualization – JYC, ZC, UIP and CS; Writing of original draft – JYC, ZC and BGS; Writing – review & editing – all authors.Conflicts of interest
The authors declare no conflict of interest.Acknowledgements
This work was performed at the Center for Nanophase Materials Sciences, a US DOE Office of Science User Facility. This research used resources of the Oak Ridge Leadership Computing Facility (OLCF) and of the Compute and Data Environment for Science (CADES) at the Oak Ridge National Laboratory, which is supported by the Office of Science of the U.S. Department of Energy under Contract No. DE-AC05-00OR22725. This work is also supported by the Army Research Office under Contract No. W911NF-20-0093. U. I. P. and B. D. were supported by the U.S. Department of Energy, Office of Science, Basic Energy Sciences, Chemical Sciences, Geosciences, and Biosciences Division.References
- J. M. Ren, T. G. McKenzie, Q. Fu, E. H. Wong, J. Xu, Z. An, S. Shanmugam, T. P. Davis, C. Boyer and G. G. Qiao, Chem. Rev., 2016, 116, 6743–6836 CrossRef CAS.
- Y.-J. Sheng, C.-H. Nung and H.-K. Tsao, J. Phys. Chem. B, 2006, 110, 21643–21650 CrossRef CAS.
- E. He, P. Ravi and K. Tam, Langmuir, 2007, 23, 2382–2388 CrossRef CAS PubMed.
- S. Strandman, A. Zarembo, A. A. Darinskii, B. Löflund, S. J. Butcher and H. Tenhu, Polymer, 2007, 48, 7008–7016 CrossRef CAS.
- Y. Zhang, T. Guan, G. Han, T. Guo and W. Zhang, Macromolecules, 2018, 52, 718–728 CrossRef.
- C. E. Estridge and A. Jayaraman, ACS Macro Lett., 2015, 4, 155–159 CrossRef CAS.
- F. Jiménez-Ángeles, H.-K. Kwon, K. Sadman, T. Wu, K. R. Shull and M. Olvera de la Cruz, ACS Cent. Sci., 2019, 5, 688–699 CrossRef PubMed.
- A. Chremos and J. F. Douglas, J. Chem. Phys., 2017, 147, 044906 CrossRef PubMed.
- K.-H. Shen, M. Fan and L. M. Hall, Macromolecules, 2021, 54, 2031–2052 CrossRef CAS.
- M. Konieczny and C. N. Likos, J. Chem. Phys., 2006, 124, 214904 CrossRef.
- P. Košovan, J. Kuldová, Z. Limpouchová, K. Procházka, E. B. Zhulina and O. V. Borisov, Soft Matter, 2010, 6, 1872–1874 RSC.
- J. G. Kennemur, Macromolecules, 2019, 52, 1354–1370 CrossRef CAS.
- M. Satoh, E. Yoda, T. Hayashi and J. Komiyama, Macromolecules, 1989, 22, 1808–1812 CrossRef CAS.
- K. Kremer and G. S. Grest, J. Chem. Phys., 1990, 92, 5057–5086 CrossRef CAS.
- G. Raabe and R. J. Sadus, J. Chem. Phys., 2011, 134, 234501 CrossRef.
- M. Neumann, Mol. Phys., 1983, 50, 841–858 CrossRef CAS.
- S. Plimpton, J. Comput. Phys., 1995, 117, 1–19 CrossRef CAS.
- W. M. Brown, P. Wang, S. J. Plimpton and A. N. Tharrington, Comput. Phys. Commun., 2011, 182, 898–911 CrossRef CAS.
- A. U. Chowdhury, F. Liu, B. R. Watson, R. Ashkar, J. Katsaras, C. P. Collier, D. A. Lutterman, Y.-Z. Ma, T. R. Calhoun and B. Doughty, Opt. Lett., 2018, 43, 2038–2041 CrossRef CAS PubMed.
- A. U. Chowdhury, G. J. Taylor, V. Bocharova, R. L. Sacci, Y. Luo, W. T. McClintic, Y.-Z. Ma, S. A. Sarles, K. Hong, C. P. Collier and B. Doughty, J. Am. Chem. Soc., 2019, 142, 290–299 CrossRef PubMed.
- A. U. Chowdhury, B. R. Watson, Y.-Z. Ma, R. L. Sacci, D. A. Lutterman, T. R. Calhoun and B. Doughty, Rev. Sci. Instrum., 2019, 90, 033106 CrossRef PubMed.
- A. U. Chowdhury, L. Lin and B. Doughty, ACS Appl. Mater. Interfaces, 2020, 12, 32119–32130 CrossRef CAS.
- R. C. Tolman, J. Chem. Phys., 1948, 16, 758–774 CrossRef CAS.
- J. G. Kirkwood and F. P. Buff, J. Chem. Phys., 1949, 17, 338–343 CrossRef CAS.
- A. E. Ismail, G. S. Grest and M. J. Stevens, J. Chem. Phys., 2006, 125, 014702 CrossRef PubMed.
- S. F. Burlatsky, V. V. Atrazhev, D. V. Dmitriev, V. I. Sultanov, E. N. Timokhina, E. A. Ugolkova, S. Tulyani and A. Vincitore, J. Colloid Interface Sci., 2013, 393, 151–160 CrossRef CAS PubMed.
- T. V. Vu and D. V. Papavassiliou, J. Chem. Phys., 2018, 148, 204704 CrossRef PubMed.
- A. J. Prosser and E. I. Franses, Colloids Surf., A, 2001, 178, 1–40 CrossRef CAS.
- R. Borwankar and D. Wasan, Chem. Eng. Sci., 1988, 43, 1323–1337 CrossRef CAS.
- A. Frumkin, Z. Phys. Chem., 1925, 116, 466–484 CrossRef CAS.
- C.-T. Hsu, C.-H. Chang and S.-Y. Lin, Langmuir, 1997, 13, 6204–6210 CrossRef CAS.
- I. Langmuir, J. Am. Chem. Soc., 1917, 39, 1848–1906 CrossRef CAS.
- D. F. Evans and H. Wennerström, The Colloidal Domain: Where Physics, Chemistry, Biology, and Technology Meet, Wiley-Vch, New York, 1999 Search PubMed.
- J.-M. Y. Carrillo and A. V. Dobrynin, Langmuir, 2009, 25, 13158–13168 CrossRef CAS PubMed.
- J.-M. Y. Carrillo and A. V. Dobrynin, Langmuir, 2010, 26, 18374–18381 CrossRef CAS PubMed.
- D. C. Grahame, Chem. Rev., 1947, 41, 441–501 CrossRef CAS PubMed.
- J.-M. Y. Carrillo and A. V. Dobrynin, Macromolecules, 2011, 44, 5798–5816 CrossRef CAS.
- S. S. Datwani and K. J. Stebe, Langmuir, 2001, 17, 4287–4296 CrossRef CAS.
- J. Klein Wolterink, F. Leermakers, G. Fleer, L. Koopal, E. Zhulina and O. Borisov, Macromolecules, 1999, 32, 2365–2377 CrossRef.
- R. Fernandez-Alvarez, L. Nová, F. Uhlík, S. Kereïche, M. Uchman, P. Košovan and P. Matějíček, J. Colloid Interface Sci., 2019, 546, 371–380 CrossRef CAS PubMed.
- J.-M. Y. Carrillo and A. V. Dobrynin, Langmuir, 2007, 23, 2472–2482 CrossRef CAS PubMed.
- J. D. Roach, M. M. Bondaruk, A. Al-Abdulghani and Z. Shahrori, Adv. Mater. Phys. Chem., 2016, 6, 249 CrossRef CAS.
- A. Mercurieva, T. Birshtein and F. Leermakers, Langmuir, 2009, 25, 11516–11527 CrossRef CAS PubMed.
- T. P. Russell, S. H. Anastasiadis, A. Menelle, G. P. Felcher and S. Satija, Macromolecules, 1991, 24, 1575–1582 CrossRef CAS.
- T. Russell, A. Menelle, W. Hamilton, G. Smith, S. Satija and C. Majkrzak, Macromolecules, 1991, 24, 5721–5726 CrossRef CAS.
Footnote |
| † Electronic supplementary information (ESI) available. See DOI: https://doi.org/10.1039/d2nr05113c |
| This journal is © The Royal Society of Chemistry 2023 |

