 Open Access Article
Creative Commons Attribution 3.0 Unported Licence
A new multifunctional energy harvester based on mica nanosheet-dispersed PVDF nanofabrics featuring piezo-capacitive, piezoelectric and triboelectric effects†
Govind S.
Ekbote
a,
Mohammed
Khalifa
 b,
B.
Venkatesa Perumal
c and
S.
Anandhan
 *a
*a
aDepartment of Metallurgical and Materials Engineering, National Institute of Technology Karnataka, Srinivasnagar, Mangaluru 575025, India. E-mail: anandhan@nitk.edu.in; anandtmg@gmail.com
bKompetenzzentrum Holz GmbH, W3C, A-9300 St. Veit/Glan, Klagenfurter Strasse 87-89, Linz, Austria
cDepartment of Electrical and Electronics Engineering, National Institute of Technology Karnataka, Srinivasnagar, Mangaluru 575025, India
First published on 30th August 2023
Abstract
In recent years, there has been a significant rise in the popularity of piezoelectric and triboelectric nanogenerators as alternative power sources for miniature devices and internet of things devices (IoT). Herein, piezoelectric nanogenerators (PNG) and triboelectric nanogenerators (TENG) based on mica nanosheet (MNS)-infused poly(vinylidene fluoride) (PVDF) composite nanofabrics were developed. The morphology, crystallinity, and polymorphism of PVDF/MNS composite nanofabrics were studied using different characterization techniques. The incorporation of MNS into PVDF resulted in enhanced electroactive β-phase content, reaching a maximum of 84.3% in the composite nanofabric containing 0.75 wt% of MNS. The same nanofabric exhibited a dielectric constant ∼1.64 times that of pure PVDF nanofabric, substantially enhancing the capacitive sensing capability by ∼4.4 times. The PNG developed using the nanofabric containing 0.75 wt% of MNS displayed an open-circuit voltage (VOC) of ∼8.4 V and a power density of ∼3 μW cm−2 when subjected to 8 N force. The TENG based on the aforementioned nanofabric produced a maximum VOC of ∼163 V and a power density of ∼585 μW cm−2 when subjected to one-finger tapping. With the same TENG upon one-finger tapping, 35 LEDs were illuminated. A fluttering-driven TENG utilizing the same nanofabric generated a maximum VOC of ∼70 V when exposed to a wind speed of 7 m s−1. The results indicate that the nanofabrics developed herein could potentially be utilized to fabricate energy harvesting devices to power health monitoring sensors, IoT and nano/micro devices.
Introduction
Recent advances in autonomous low-power wireless electronics, remote sensors, and miniature portable devices have made energy harvesters an appealing alternative power source.1–3 Energy harvesting technologies based on piezoelectric and triboelectric technologies have attracted significant attention recently due to their potential to extract energy from ambient vibrations. Portability, cost-effectiveness, flexibility, and efficiency make these harvesters a suitable source of power for low-power devices.4–8Poly(vinylidene fluoride) (PVDF) has been suggested as a promising triboelectric and piezoelectric material for ambient mechanical energy harvesters due to its large dipole moment, high piezoelectric coefficient, superior dielectric property among all the polymers, and its high tribonegativity.9–12 PVDF consists of the monomer unit of CH2–CF2, which forms different phases based on chain conformations such as α, β, γ, δ, and ε. The β and γ-phases exhibit piezoelectric nature owing to their polar nature.11,13 In comparison with ceramic-based materials, PVDF has a lower piezoelectric coefficient, limiting its use in a wide variety of devices. Researchers have dedicated a great deal of time and effort to enhancing the piezoelectric performance of PVDF by improving its β-phase content. Various strategies such as mechanical stretching,14–16 electrical poling,17,18 and incorporation of nanoscale fillers have been used to enhance the electroactivity of PVDF. Nanofillers such as cobalt ferrite (CoFe2O4),19 zinc oxide (ZnO),20 clay nanolayers,21 halloysite nanotube (HNT),22,23 bismuth ferrite (BiFeO3),24 talc,25 have been shown to boost the piezoelectric performance of PVDF.
The triboelectric effect can also be utilized to harvest energy from waste mechanical vibrations. The triboelectric effect combined with electrostatic induction generates electricity when two dissimilar materials are periodically touched and separated.3 The dielectric property, surface contact area, distance between the layers, surface charge density, and surface's chemical nature may govern the performance of a triboelectric nanogenerator (TENG).26–28 A variety of nanofillers, including dopamine-treated tin oxide (SnO2),29 cellulose nanocrystal (CNC),30 cobalt ferrite (CoFe2O4),31 graphene quantum dots (GQD),32 MXene (Ti3C2Tx),33 multiwall carbon nanotubes (MWCNT),34 and iron oxide (Fe3O4),35 have been observed to augment β-phase content and dielectric properties of PVDF, thereby uplifting its triboelectric performance.
The capacitive sensor offers touch/pressure sensing ability with superior stability and low power consumption.36 PVDF could also be a promising material for capacitive sensors due to its ability to detect changes in capacitance upon the application of external forces. The incorporation of nanofillers has been proven to improve its capacitive sensing performance.37,38
Phyllosilicate-based nanofillers, such as mica nanosheets (MNS), occur naturally and provide high specific surface area and dielectric constant.39 Mica consists of two tetrahedral (aluminium, silicon, oxygen) units and an octahedral unit (aluminium, oxygen, hydrogen), and an interlayer cation (potassium).40 The presence of hydroxyl and oxygen groups on the surface of MNS could facilitates its interaction with PVDF chains, enhancing the β-phase content of the latter. Also, MNS could enhance the dielectric properties of PVDF. Khalifa et al. have reported enhanced piezoelectric, dielectric, and piezo capacitive performances of PVDF/MNS nanocomposites synthesized by solution casting followed by rapid cooling.39 Fu et al. prepared the PVDF/exfoliated mica composite using the solution casting method and reported improvement in dielectric property, energy storage, and breakdown strength of the prepared composite film.41 Until now, no comprehensive studies have been published examining the piezo capacitive sensing, dielectric, piezoelectric, and triboelectric properties of electrospun PVDF nanofibers dispersed with MNS.
Electrospinning is a facile, scalable, and low-cost fabrication technique to produce nanofibers. As a result of uniaxial mechanical stretching and electrical poling during the electrospinning process, a higher β-phase is induced in the PVDF.42–44 Additionally, it assists in fabricating nanofabrics with a high aspect ratio and reasonable roughness, resulting in a larger effective contact area, thereby enhancing triboelectric performance.32,45,46
In this study, the interaction between the hydroxyl group of MNS and PVDF chains through hydrogen bonding as well as the interaction between Si–O group of MNS with PVDF chains, coupled with the advantages of the electrospinning process, were utilized to enhance the β-phase and dielectric property of PVDF. A comprehensive investigation was conducted to examine the influence of MNS on morphology, polymorphism, piezo capacitance, dielectric, piezoelectric, and triboelectric properties of PVDF nanofibers infused with MNS.
Experimental details
Materials
PVDF (Solef 1015, Solvay, Italy) (![[M with combining macron]](https://www.rsc.org/images/entities/i_char_004d_0304.gif) w = 575
w = 575![[thin space (1/6-em)]](https://www.rsc.org/images/entities/char_2009.gif) 000) was purchased from Prakash Chemicals, India. Mica nanosheets (purity of >99%) (particle size < 80 nm) were procured from Nanoshell, UK. N,N-dimethyl formamide (DMF), and acetone were procured from Molychem, India. The solvents were of analytical grade, and hence no further purification was performed prior to their use.
000) was purchased from Prakash Chemicals, India. Mica nanosheets (purity of >99%) (particle size < 80 nm) were procured from Nanoshell, UK. N,N-dimethyl formamide (DMF), and acetone were procured from Molychem, India. The solvents were of analytical grade, and hence no further purification was performed prior to their use.
Electrospinning of PVDF/MNS composite nanofabrics
A precursor solution was prepared by dissolving PVDF powder (13.5 wt/v%) in a 9![[thin space (1/6-em)]](https://www.rsc.org/images/entities/char_2009.gif) :
:![[thin space (1/6-em)]](https://www.rsc.org/images/entities/char_2009.gif) 1 mixture of DMF and acetone. The mixture was stirred for 10 h to ensure complete dissolution of PVDF and electrospun to prepare pure PVDF nanofabric (EPVDF). The composite nanofabrics were synthesized by adding an accurately weighed amount of MNS (0.25, 0.5, 0.75, and 1 wt% based on the weight of PVDF) to PVDF solution. Initially, a dispersion of MNS was prepared in the mixed solvent. The mixture was probe-sonicated for 40 minutes, and then 1.35 g of PVDF was added under continuous magnetic stirring and kept for 10 hours. Subsequently, the resultant solution was loaded into a syringe equipped with a 22-gauge beveled stainless steel needle and subjected to electrospinning using the following parameters: applied voltage of 18 kV, a flow rate of 0.6 mL h−1, a tip-to-collector distance of 17 cm, a rotating drum collector speed of 1500 rpm, a relative humidity of 50 ± 2%, and a temperature of 28 ± 3 °C (Table 1).
1 mixture of DMF and acetone. The mixture was stirred for 10 h to ensure complete dissolution of PVDF and electrospun to prepare pure PVDF nanofabric (EPVDF). The composite nanofabrics were synthesized by adding an accurately weighed amount of MNS (0.25, 0.5, 0.75, and 1 wt% based on the weight of PVDF) to PVDF solution. Initially, a dispersion of MNS was prepared in the mixed solvent. The mixture was probe-sonicated for 40 minutes, and then 1.35 g of PVDF was added under continuous magnetic stirring and kept for 10 hours. Subsequently, the resultant solution was loaded into a syringe equipped with a 22-gauge beveled stainless steel needle and subjected to electrospinning using the following parameters: applied voltage of 18 kV, a flow rate of 0.6 mL h−1, a tip-to-collector distance of 17 cm, a rotating drum collector speed of 1500 rpm, a relative humidity of 50 ± 2%, and a temperature of 28 ± 3 °C (Table 1).
| MNS (wt%) loading in PVDF | Sample designation |
|---|---|
| 0 | EPVDF |
| 0.25 | PVDF/MNS-0.25 |
| 0.5 | PVDF/MNS-0.5 |
| 0.75 | PVDF/MNS-0.75 |
| 1 | PVDF/MNS-1 |
Characterization
Field emission scanning electron microscope (FESEM) (Zeiss GeminiSEM 300, Germany) and transmission electron microscope (TEM) (JEOL-2100, Japan) were used to visualize the morphology of the nanofibers. Prior to FESEM analysis, the nanofibers were coated with a thin gold layer by sputtering. The average fiber diameter and standard deviation of fiber diameter were calculated by measuring the diameters of 50 nanofibers at three different locations. The diameter of the nanofiber was determined by ImageJ software.47Fourier transform infrared (FTIR) spectroscopy (FTIR-4200, JASCO, Japan) was employed to examine the polymorphism and the nature of interaction between the MNS and PVDF chains. The FTIR analysis was performed in ATR mode at a resolution of 4 cm−1 in the wavenumber range of 4000–650 cm−1. The β-phase content (F(β)) in EPVDF and PVDF/MNS composite nanofabrics was quantified using the following equation:13
 | (1) |
Polymeric phases and crystallinity of PVDF composite nanofabrics were examined using X-ray diffraction (XRD) (Empyrean Malvern Panalytical, UK). The XRD scan covered a 2θ range of 10–45°, with a step size of 0.013° and a dwell time of 24 s per step. The XRD measurement was carried out using Cu-Kα radiation (λ = 1.54 Å, 40 kV, and 40 mA).
The degree of crystallinity of the composite nanofabrics (Xc) was calculated by the following equation:
 | (2) |
To measure the dielectric properties of EPVDF and PVDF/MNS composite nanofabrics, an LCR meter (RS PRO: LCR-6300, UK) was employed. The test involved placing a nanofiber mat between two copper electrodes. Measurements were carried over the frequency range of 1 kHz to 200 kHz at a bias voltage of 1 V. The dielectric constant was calculated using the following equation.
 | (3) |
The capacitive sensor response was analyzed using a dielectric analyzer (Alpha A, Novocontrol Technologies, Germany). The capacitance values were recorded as a function of the applied external load. The sensitivity of the sensor was estimated using the following equation:48
 | (4) |
Evaluation of piezoelectric and piezo capacitive performance
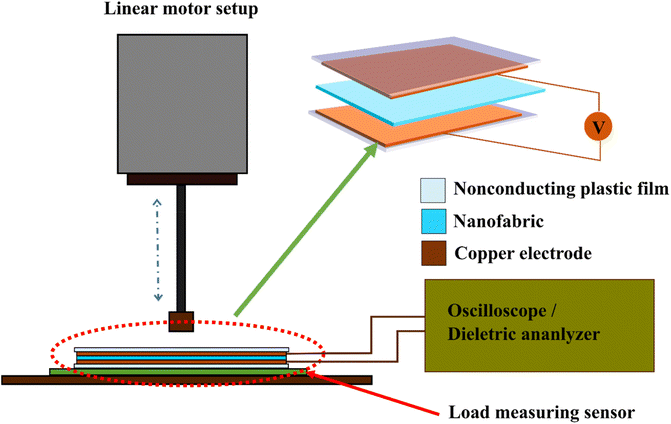
The examination of piezoelectric behavior involved the use of a digital oscilloscope (RS PRO-1052, UK) and a standard linear motor kit setup (Cyltronic AG, Switzerland). The piezoelectric nanogenerator (PNG) was built by placing the nanofabric between two copper electrodes attached to an insulating plastic film. Then, copper electrodes were connected to an oscilloscope, and external force was applied to record the open-circuit voltage (VOC) of the PNG (Fig. 1). The piezo capacitive measurement was carried out in a similar way with a slight difference in the sample preparation as illustrated in Fig. S1 (ESI).†Evaluation of triboelectric property
An arch-shaped triboelectric nanogenerator (TENG) was developed, as shown in Fig. 2. The nanofiber mat (length and width of 2 cm each) was adhered to a Cu electrode and then glued to an acrylic sheet to create the tribo-negative part. A tribo-positive part was fabricated by attaching a Cu tape (BOLT, India) (2 cm × 2 cm) to a flexible insulating plastic film. The TENG was fabricated by attaching the tribo-positive part to the tribo-negative part in an arch-shaped structure. The distance of separation between the Cu tape and nanofabric surfaces was 1 cm. The test was performed by tapping the TENG with a single finger, and measurements were recorded using a digital oscilloscope (Tektronix, TDS 2012C, USA).Results and discussion
Morphology of the nanofabrics
Fig. 3(a–e) shows the SEM images of EPVDF and PVDF/MNS composite nanofabrics. Fig. 3f shows the SEM image of MNS that reveals their lamellar structure. The average fiber diameter (AFD) of the nanofibers was reduced upon incorporation of MNS. It was observed that the AFD was decreased up to a loading of 0.75 wt% MNS, after which it increased. The lowest AFD of 293 ± 61 nm was recorded for PVDF/MNS-0.75 composite nanofabric. The incorporation of MNS in precursor solution increased the surface charge density, leading to an enhanced stretching effect during electrospinning which reduced the AFD.23,25 The higher concentration of MNS results in an increase in the solution's viscosity. The higher viscosity solution may have contributed to a reduction in mechanical stretching experienced during electrospinning. This reduction in mechanical stretching led to higher AFD for the composite nanofabrics loaded with 1 wt% of MNS.25,49 The d33 is a direct measure of the piezoelectric performance of piezoelectric materials. Ico et al. has revealed the relationship between the fiber diameter and the d33 in their study, where the d33 was inversely proportional to the fiber diameter (eqn (5)).50 Thus, the improved β-phase content and piezoelectric performance can be correlated with the fiber diameter. Apart from the reduced mechanical stretching effect at higher loading, one more reason for the low β-phase content could be the lesser surface area of the MNS for polymer–filler interaction, due to the agglomeration of MNS particles. | (5) |
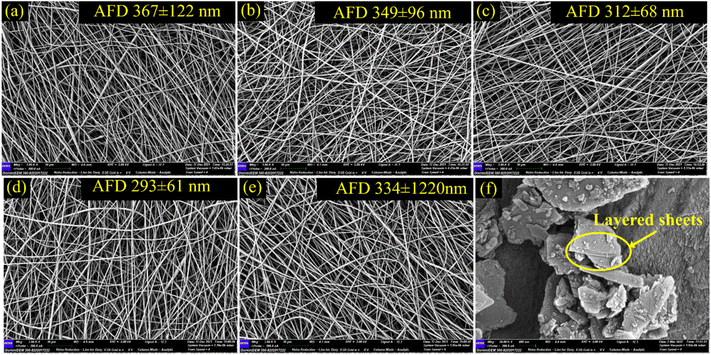 | ||
| Fig. 3 SEM images of (a) EPVDF, (b) PVDF/MNS-0.25, (c) PVDF/MNS-0.5, (d) PVDF/MNS-0.75, (e) PVDF/MNS-1, (f) MNS. | ||
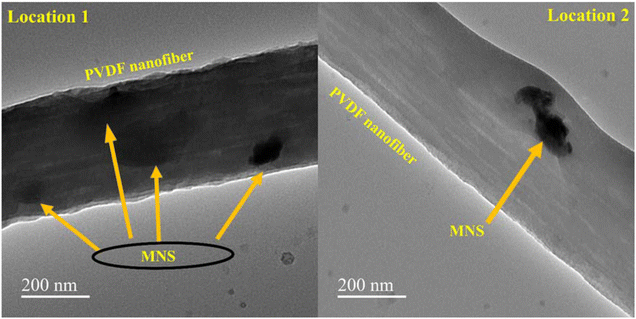
The TEM images of a single nanofiber of PVDF/MNS-0.75 are shown in Fig. 4. The PVDF matrix effectively encapsulates the well-dispersed MNS sheets facilitated by the electrospinning process. The fine dispersion of the MNS sheets helps in effective polymer–filler interaction.
FTIR spectroscopy
FTIR spectroscopy was used to analyze the electroactive phase content of EPVDF and PVDF/MNS composite nanofabrics. The presence of the α-phase is indicated by the peaks at 762, 796, and 974 cm−1, while the electroactive phase is identified by a peak at 840 cm−1. The peaks at 1234 cm−1 and 1275 cm−1 represent the signature peaks of the γ and β-phases, respectively11,51 (Fig. 5). The enhanced peak intensity at 840 cm−1 corresponding to the polar phase, coupled with reduced peak intensities at 762, 796, and 974 cm−1 associated with α-phase, indicates an increase in the electroactive phase content with the incorporation of MNS. Furthermore, the strong peak at 1275 cm−1, along with the minuscule shoulder peak at 1234 cm−1, and the absence of other γ-phase peaks such as 776, 811, and 833 cm−1 indicate the dominance of the polar β-phase in the composite nanofabrics.13 Therefore, the γ-phase was not considered for further analysis. The peak at 875 cm−1, associated with C–C asymmetric stretching, exhibited a shift to the range of 876–879 cm−1, while the peak at 1177 cm−1, corresponding to the CF2 symmetric stretching, showed a shift to a range of 1179–1180 cm−1 in the composite nanofabrics13,52 (Fig. 5(b) and (c)). The observed shifts in the vibrational bands suggest significant interaction between the MNS and the PVDF chains, facilitating the conversion of the α-phase into the β-phase.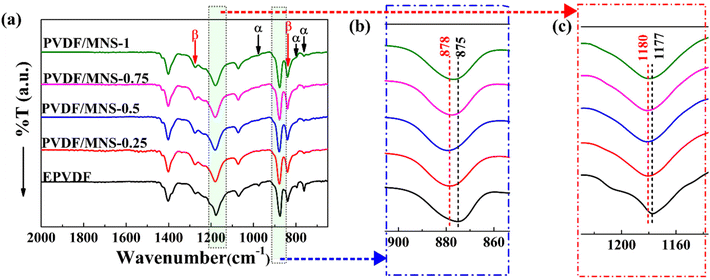 | ||
| Fig. 5 FTIR spectra of EPVDF and PVDF/MNS composite nanofabrics (a) 2000–650 cm−1, (b) 900–860 cm−1, (c) 1230–1140 cm−1. | ||
In EPVDF, the β-phase content was 63.6%. On the other hand, the F(β) of PVDF increased in the presence of MNS in the composite nanofabrics. The F(β) increased with the loading of MNS up to 0.75 wt%, reaching 84.3%; after that, it declined. The enhancement in F(β) may be attributed to a synergistic effect of the polymer–filler interaction, weak solvent polymer chain interaction, and the influence of electrospinning. The CH2 group of PVDF may have weakly interacted with the C![[double bond, length as m-dash]](https://www.rsc.org/images/entities/char_e001.gif) O of DMF through hydrogen bonding, facilitating the emergence of polar phases by lowering the energy barrier for the same.39,53 Also, the interaction between MNS and polymer chains promoted the alignment of PVDF chains in the all-trans conformation. Here, the interaction between the O-atoms of MNS and the CH2 group of the PVDF chains and the hydrogen bonding between the hydroxyl groups of MNS and the CF2 groups of the polymer might have played a significant role in the improvement in the β-phase content (Fig. 6).39 Also, the negatively charged MNS (ζ-potential (average) = −33.4 mV) (Fig. S5†) could interact with the CH2 groups of PVDF, enhancing the β-phase content in PVDF. The β-phase content of electrospun nanofabrics are shown in Table 2.
O of DMF through hydrogen bonding, facilitating the emergence of polar phases by lowering the energy barrier for the same.39,53 Also, the interaction between MNS and polymer chains promoted the alignment of PVDF chains in the all-trans conformation. Here, the interaction between the O-atoms of MNS and the CH2 group of the PVDF chains and the hydrogen bonding between the hydroxyl groups of MNS and the CF2 groups of the polymer might have played a significant role in the improvement in the β-phase content (Fig. 6).39 Also, the negatively charged MNS (ζ-potential (average) = −33.4 mV) (Fig. S5†) could interact with the CH2 groups of PVDF, enhancing the β-phase content in PVDF. The β-phase content of electrospun nanofabrics are shown in Table 2.
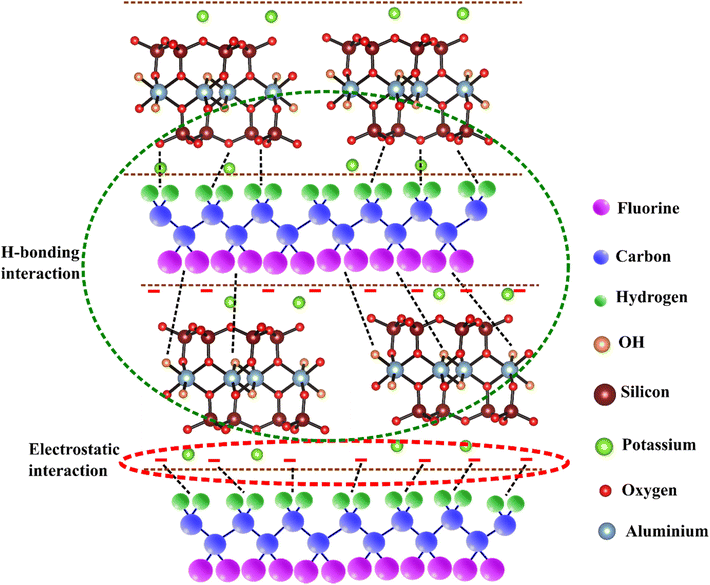 | ||
| Fig. 6 Visual depiction illustrating the potential mechanism of interaction between MNS and PVDF chains.54 | ||
| Nanofabrics | F(β)% | X c (%) |
|---|---|---|
| EPVDF | 63.6 | 36.5 |
| PVDF/MNS-0.25 | 79.6 | 42.9 |
| PVDF/MNS-0.5 | 81.8 | 44.7 |
| PVDF/MNS-0.75 | 84.3 | 46.8 |
| PVDF/MNS-1 | 83.4 | 45.4 |
Wide angle X-ray diffraction study
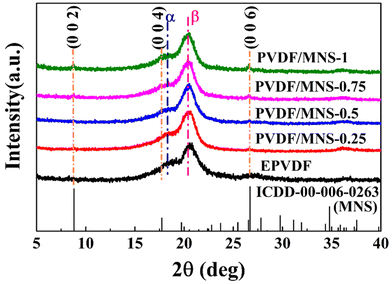
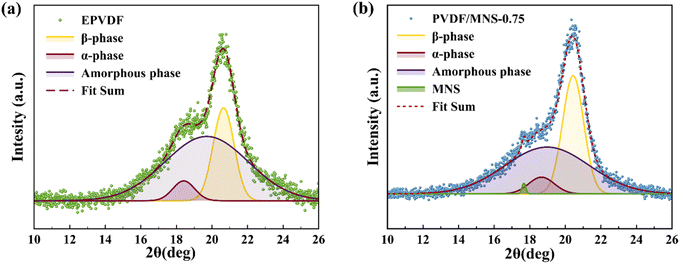
Wide angle XRD was used to analyze the phases and crystallinity in EPVDF and PVDF/MNS composite nanofabrics (Fig. 7). In EPVDF, the peak pertaining to 18.3° (0 2 0) and 27° (0 2 1) represent the α-phase, and the peaks at 20.6° (1 1 0/2 0 0) represents the β-phase, indicating the presence of α and β-phases.11,55 Upon the addition of MNS, the intensity of the α-phase peak was weakened, and the intensity of the β-phase peak was intensified, suggesting improvement in F(β). Moreover, the peaks at 8.7°, 17.7°, and 26.5° belong to MNS (ICDD-00-006-0263), which confirms the presence of MNS in the composite nanofabrics. Also, the diffraction peak of the α-phase at 27° was diminished and masked by the diffraction peak of MNS. In accordance with the FTIR results, the XRD results also suggest that the addition of MNS improved the F(β) of PVDF. Deconvoluted X-ray diffractograms were used to determine the total crystallinity of the nanofabrics (Fig. 8). The incorporation of MNS resulted in an increase in the overall crystallinity of the nanofabrics. The nanolayer surface of the filler particles in the composite nanofabrics serve as nucleation sites, interacting with the polymer chains during the electrospinning process, thereby promoting the crystallinity of PVDF.56–59 However, at 1 wt% loading of MNS, the surface area available for nucleation is reduced possibly due to agglomeration of MNS, which led to a decrease in total crystallinity of PVDF/MNS-1.Dielectric properties
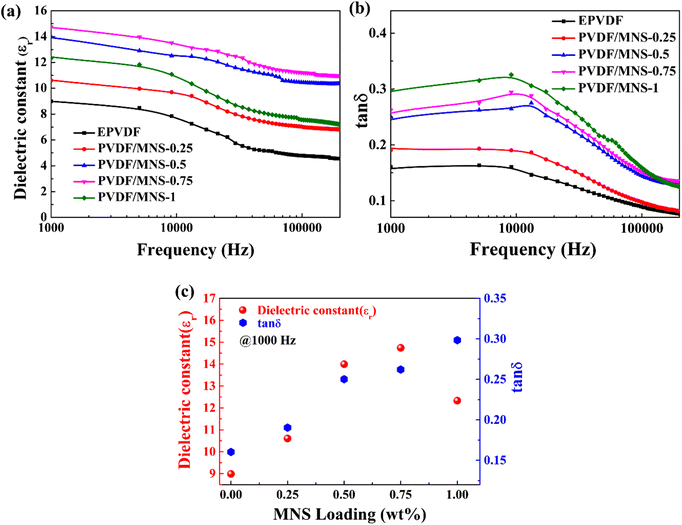
Dielectric properties of EPVDF and PVDF/MNS composite nanofabrics were measured at 25 °C across the 1000 Hz–200 kHz frequency range. Fig. 9 illustrates the dielectric properties of the nanofabrics with different loading of MNS as a function of frequency. The dielectric constant of composite nanofabrics was significantly improved with the incorporation of MNS. At 1000 Hz, the PVDF/MNS-0.75 composite nanofabric had the maximum dielectric constant value of 14.7, which was 64% greater than that of EPVDF. The enhancement of the dielectric constant at lower frequencies may be a result of the interfacial polarization.60 The overall improvement in the dielectric constant could be ascribed to the following contributing factors: first, the enhanced β-phase content,61,62 and second, the incorporation of MNS.39,63 At the highest loading of MNS, the dielectric constant considerably decreased, which could be attributed to a decline in the β-phase content and poor dispersion of MNS. In general, the dielectric constant value progressively decreases as the frequency of the applied electric field increases, which is due to the failure of the dipoles to align with the field.61,64Dielectric loss in polymer composites depends on the dipolar, distortion, and interfacial polarization. In addition, conduction loss also contributes to the dielectric loss.65 The dielectric loss of PVDF/MNS composite nanofabrics was higher than that of EPVDF. The increase in the dielectric loss may be attributed to the formation of small domain networks resulting from the addition of MNS, which leads to enhanced interfacial polarization and conduction loss.66 The broad peak of dielectric loss at higher frequency could be due to dipolar/orientation polarization.67–69 Additionally, the dielectric properties of composite nanofabrics are influenced by the morphology of the filler, dispersion of filler, and polymer–filler interaction.24 The porous structure of nanofabric also affects the dielectric properties by varying dipole density.61 The ability of a material to store charges is represented by its dielectric constant, while the dielectric loss indicates its leakiness. Materials with high dielectric constants can offer enhanced triboelectric charge density, whereas those with low dielectric loss can efficiently hold charges. Therefore, selecting a material that exhibits a high dielectric constant and a low dielectric loss is essential for optimal triboelectric performance.
Piezo capacitance evaluation
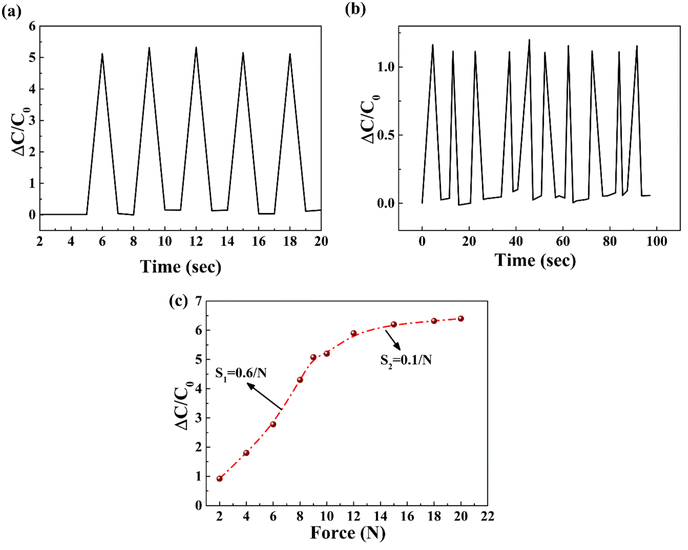
The performance of the capacitive sensor was evaluated using a standard linear motor kit, where the applied force was perpendicular to the sensor. The PVDF/MNS-0.75 composite nanofabric was chosen for further investigation among the prepared composites because of its high dielectric constant. To create the capacitive sensor, the PVDF/MNS-0.75 composite nanofabric was placed between two copper electrodes (parallel plate capacitor configuration) (Fig. S1†).Fig. 10 shows the responses of the capacitive sensor based on EPVDF and PVDF/MNS-0.75 composite nanofabric to an external load. The PVDF/MNS-0.75 based capacitive sensor's response (ΔC/C0) was ∼4.4 times higher than that of the EPVDF-based sensor when subjected to 9 N force. The curve depicting the response (ΔC/C0) as a function of the applied external force was plotted for the PVDF/MNS-0.75 based sensor, and its sensitivity was calculated by measuring the slope of the curve. Two regions with distinct sensitivities were observed; the first one, at a low force range (2–9 N), demonstrated a sensitivity of 0.6 N−1, while the second one, at a higher force range (10–20 N), exhibited a sensitivity of 0.1 N−1. At higher applied forces, the sensor's sensitivity was reduced. The change in distance and effective dielectric constant of the sensor are crucial factors that dictate the sensor's sensitivity. When prominent deformation of nanofabric is reduced, and porosity (the voids between nanofibers) is eliminated at higher forces, the change in distance, as well as the effective dielectric constant, are minimum, resulting in reduced sensitivity of the sensor. The same trend was observed in PVDF/MNS-0.75 based sensor.
The following equation was used to determine the capacitance:
 | (6) |
Capacitance is determined by the dielectric constant, the distance between the electrodes, and electrode contact area. The change in capacitance of the nanofabric may be due to two reasons: first, the force applied may reduce the distance between electrodes, thereby increasing the capacitance. Second, the material's dielectric constant may change due to the external load, leading to an increase in the sensor's effective dielectric constant caused by the reduction of pores (the voids between nanofibers); however, the dielectric constant of composite nanofabrics is crucial factor in determining effective dielectric constant.37,70,71 The improved sensing property of the PVDF/MNS-0.75 composite nanofabric could be ascribed to its higher dielectric constant value. This capacitive sensor holds potential for applications in pressure sensors, tactile sensing, and wearable devices.72
Piezoelectric performance
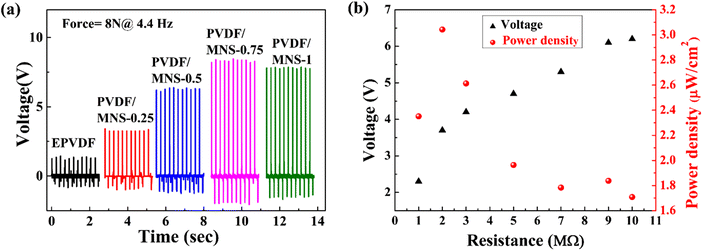
The response of PNG based on EPVDF and PVDF/MNS composite nanofabrics was evaluated under 8 N force (Fig. 11) applied using a linear motor kit in the normal direction. The open-circuit voltage (VOC) of PNG based on composite nanofabrics was improved upon the incorporation of MNS into the PVDF matrix. PVDF/MNS composite nanofabrics-based PNGs demonstrated better piezoelectric performance due to their improved β-phase content.23,25 The VOC increased as the filler loading increased, peaking at 0.75 wt% of MNS, and the maximum VOC of 8.4 V was attained when subjected to 8 N force. Additionally, the piezoelectric behavior of composite nanofabrics may depend on the nanofiller's morphology and surface characteristics, as well as the humidity levels maintained during the electrospinning.73–75 As the loading of fillers exceeded 0.75 wt%, there was a decrease in the VOC, potentially due to a decline in the β-phase content at 1 wt% of MNS loading.Upon the application of an external force, the dipoles orient themselves in response to the force. As a result, a piezoelectric potential is generated across the top and bottom surfaces of the electrode. The piezoelectric potential between the top and bottom electrode causes electrons to flow across the external circuit, which produces an electric signal. When the applied force is removed, the dipoles return to their initial position, and the electrons flow back in the opposite direction leading to a reverse signal.
PVDF/MNS-0.75 composite nanofabric-based PNG was used for power density measurement since it showed the highest VOC. In order to calculate the power density, voltage across the load resistance was measured. In response to an increase in load resistance, the voltage increased. At a load resistance of 2 MΩ, a peak power density of 3 μW cm−2 was attained. The power density (P) value was determined by employing eqn (7):
 | (7) |
Triboelectric performance
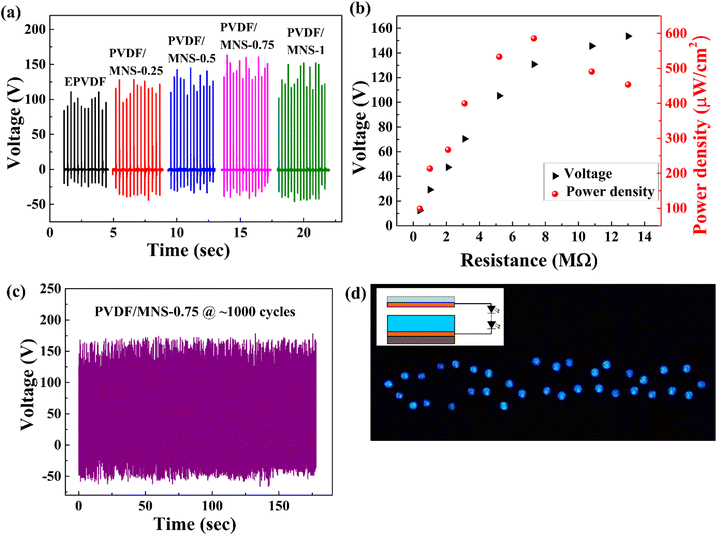
TENGs based on composite nanofabrics containing different amounts of MNS were prepared to evaluate the effects of MNS on the triboelectric response (Fig. 12). The fabrication process of the triboelectric nanogenerators is detailed in the Experimental section, and the schematic of the same is depicted in Fig. 2(a). The TENGs were evaluated under the application of one finger tapping force (∼avg. 3.8 N) in contact-separation mode. VOC of 110 V was observed for EPVDF-based TENG. VOC values of 128, 142, 163, and 152 V were recorded for TENGs made from PVDF/MNS-0.25, PVDF/MNS-0.5, PVDF/MNS-0.75, and PVDF/MNS-1 composite nanofabrics, respectively. The VOC values of TENGs based on composite nanofabrics were enhanced upon the addition of MNS. The triboelectric output showed an upward trend with the increase in MNS loading, peaking at a VOC of 163 V at 0.75 wt% MNS loading. However, a further increase in MNS loading led to a decline in the triboelectric voltage output. The TENG consisting of composite nanofabric with 0.75 wt% of MNS exhibited a triboelectric output ∼1.48 times higher than that of the TENG based on EPVDF. The triboelectric output voltage can be described by the following equation:26 | (8) |
The open-circuit voltage (VOC) generated by TENG can be given as:
 | (9) |
The VOC of TENG is determined by the triboelectric charge density and distance of separation, as shown in the eqn (9). In a contact-separation mode TENG, the capacitance of the triboelectric material plays a crucial role in determining the surface charge density, as the device has the ability to both store and generate energy. Therefore, the capacitance of the triboelectric material serves as a determining factor for the surface charge density in the contact-separation mode.26,76,77 It is worth noting that a material's capacitance is determined by its dielectric constant and the effective contact area, assuming uniform thickness. As a result, improving both the effective contact area and dielectric constant would enhance the triboelectric response of the TENG.
The enhanced triboelectric performance of PVDF/MNS composite nanofabrics could be attributed to its improved dielectric properties. Furthermore, the improved β-phase content enhances its triboelectric performance by rapidly introducing charges onto the composite nanofabrics.29,35,78 A lower dielectric constant, a lower β-phase content, and increased dielectric loss were all contributing factors to reduced triboelectric output at the highest loading of the MNS.29,35,77–80
Since PVDF/MNS composite nanofabric containing 0.75 wt% of MNS showed the highest VOC among the PVDF/MNS composite nanofabrics, it was used for the instant power density measurement (Fig. 12(b)). The voltage measured across different load resistances (0.39 MΩ to 13 MΩ) was used for the calculation of the instant power density. The voltage generated across the load resistance increased with the increase in load resistance value. It was possible to obtain a maximum power density of ∼585 μW cm−2 across a load resistance value of 7.3 MΩ. The PVDF/MNS composite nanofabric-based TENG's performance is on par with the systems in the previously published literature (Table 3).
| Filler | Process | V OC (V) | I (μA cm−2) | P (μW cm−2) | Force (N) | Ref. |
|---|---|---|---|---|---|---|
| AgNW (3 wt%) | Electrospinning | 240 | 3 | — | 5 | 83 |
| GQD (5 vol%) | Electrospinning | ∼75 | ∼0.05 | 2.7 | — | 32 |
| Fullerene (C60) (0.2 mg) | Electrospinning | ∼80 | ∼2 | 70.5 | — | 84 |
| Fe3O4 nanoparticles (11.34 wt%) | Electrospinning | 138 | ∼0.18 | — | — | 35 |
| Dopamine treated SnO2 (0.6 wt%) | Electrospinning | 60 | 0.38 | 81 | 4.5 | 29 |
| BaTiO3 (11.25 wt%) | Doctor-blade casting method | 131 | 1.025 | — | 12 | 85 |
| Ti0.87O2 (1.5 wt%) | Solution casting | 52.8 | 5.7 | — | 86 | |
| Graphene nanosheets | Electrospinning | 1511 | 18.9 | 13![[thin space (1/6-em)]](https://www.rsc.org/images/entities/char_2009.gif) 020 020 |
50 | 78 |
| MNS | Electrospinning | 163.2 | — | 585 | Finger tapping (∼avg. 3.8 N) | Present study. |
Roughness of the tribolayers affects the device's triboelectric performance and durability. The surface morphology and roughness of the copper tape were studied to ensure its flatness. The copper tape surface was found to exhibit a flat line-type microstructure pattern (Fig. S2 and S3, ESI†), with an average roughness value (Ra) of 0.2 to 0.215 μm (Table S1, ESI†), indicating that the surface is flat, which is beneficial for the durability of the TENG. Due to the soft nature of PVDF/MNS nanofabrics, the flatness of copper aids in the device's durability. The TENG's electrical performance showed no evidence of degradation after ∼1000 cycles, demonstrating its durability and structural integrity (Fig. 12(c)). The 35 LEDs connected in series with TENG based on PVDF/MNS-0.75 composite nanofabric were illuminated under the force exerted by one finger tapping (Fig. 12(d)). The operational mechanism of the fabricated TENG has been thoroughly discussed in the ESI, and Fig. S4 (ESI)† depicts its working principle.
An energy-harvesting device, namely the fluttering-based triboelectric nanogenerator (FL-TENG), was developed to capture wind energy (Fig. 13). FL-TENG is a tiny rectangular duct with a cross-section of 2.8 × 2 cm2 and 9 cm in length. A composite nanofabric containing 0.75 wt% MNS with a copper electrode was attached at the duct's top and bottom, acting as a tribo-negative material. The fluttering film was made from copper foil with a thickness of 30 μm and attached at the entry points of the duct. An electric fan (Tornado II, Orient Electric, India) was employed to create different wind speeds for evaluating the triboelectric response of the FL-TENG, while an anemometer (Professional Instruments Anemometer, India) was utilized to measure the precise wind speeds. The working mechanism of FL-TENG is shown in Fig. 13(b). Initially, the fluttering film remains stationary due to the absence of wind flow, but as soon as the wind flows at a particular speed, it flutters. The fluttering creates periodic contact and separation between the fluttering film and the composite nanofabric. When the fluttering film comes in contact with the composite nanofabric, it generates triboelectric charges. Subsequently, as the tribo-negative and tribo-positive layers separate, the charges present at the interface of the composite nanofabric induce opposite charges on the electrode through electrostatic induction. These charges create a strong electric field between the fluttering film and the electrode, enabling the electron flow across an external circuit, resulting in the generation of an electric current. When the fluttering film approaches again, an opposite electric potential is created, which causes electrons to flow in the reverse direction, creating an electrical signal in the opposite direction.81,82
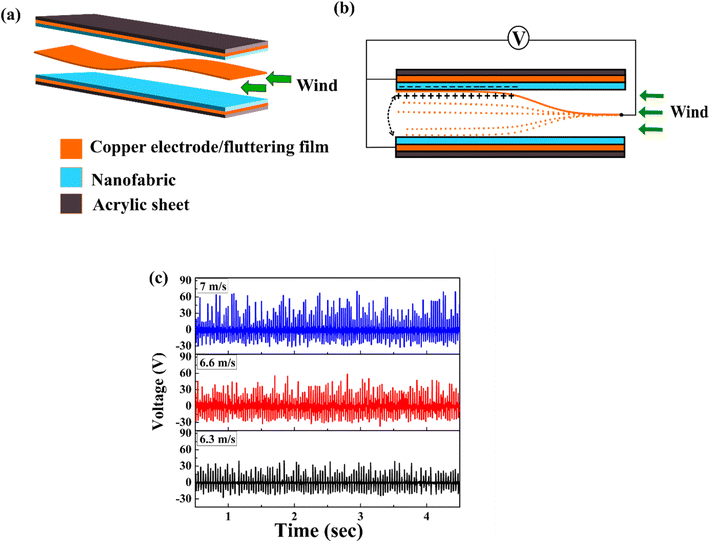 | ||
| Fig. 13 (a) Schematic of the FL-TENG, (b) schematic of the working mechanism of FL-TENG, and (c) triboelectric performance of PVDF/MNS-0.75 based FL-TENG when exposed to varying wind speeds. | ||
The triboelectric behavior of FL-TENG under various wind speeds is depicted in Fig. 13(c). With there is a rise in the wind speed, the VOC of FL-TENG exhibits an upward trend. The limited motion of the fluttering film leads to an increased contact force between the copper film and composite nanofabric. This phenomenon is attributed to an increase in the fluttering frequency induced by the increased wind speed.81 The maximum VOC recorded at 7 m s−1 was 70 V, which was the highest compared to the VOC at the other two speeds. At wind speeds of 6.3 m s−1 and 6.6 m s−1, the FL-TENG generated VOC of 39 V and 58 V, respectively.
Summary and conclusions
The β-phase content and dielectric properties of PVDF/MNS composite nanofabrics showed significant improvement compared to that of pure PVDF nanofabric. The improvement in the β-phase content can be attributed to the synergy between effective polymer–filler interaction and the influence of stretching cum local poling brought about by the electrospinning. The composite nanofabric containing 0.75 wt% of MNS had the highest β-phase content of 84.3%. It also demonstrated the highest dielectric constant of 14.7, which was ∼1.64 times that of pure PVDF nanofabric. The high dielectric constant of PVDF/MNS-0.75 composite nanofabric aided in its better piezo capacitance response, which was ∼4.4 times that of the pristine polymer nanofabric. The sensitivity of the aforementioned composite nanofabric-based capacitive sensor was 0.6 N−1. The performance of the PNG based on the same nanofabric was significantly enhanced due to its high β-phase content. This PNG generated the highest VOC of ∼8.4 V and the highest instantaneous power density of ∼3 μW cm−2 under 8 N. The same composite nanofabric also displayed exemplary triboelectric performance, which can be attributed to its high β-phase content, enhanced dielectric properties, and improved piezoelectric performance. The TENG generated a maximum VOC of 163 V and instantaneous power density of ∼585 μW cm−2 under one finger tapping that were able to illuminate 35 LEDs connected in series. The fluttering-based TENG fabricated based on this nanofabric displayed a maximum VOC of 70 V at a wind speed of 7 m s−1. Overall, this study reveals that the newly developed composite nanofabrics could be useful in piezoelectric and triboelectric energy harvesting and touch sensing and can be advantageous in self-powered miniature devices and IoT.Author contributions
Govind S. Ekbote: investigation, methodology, data curation, original draft preparation; Mohammed Khalifa: piezoelectric, piezo capacitance, and dielectric testing and data curation; B. Venkatesa Perumal: triboelectric testing; S. Anandhan: conceptualization, validation, supervision, resources, project administration, editing, and reviewing.Conflicts of interest
There are no conflicts of interest to declare.Acknowledgements
Govind S. Ekbote expresses gratitude to the National Institute of Technology Karnataka (NITK) for providing a research fellowship. The authors thank Prof. Uday Bhat K. and Dr M. R. Rahman for their assistance in utilizing the TEM and XRD facility. The authors also acknowledge the central research facility, NITK, for providing the FESEM facility. The authors also thank Mr Bibekananda and Mr Sharat for their support in the TEM analysis.References
- F. R. Fan, Z. Q. Tian and Z. L. Wang, Nano Energy, 2012, 1, 328–334 CrossRef CAS.
- M. Ha, J. Park, Y. Lee and H. Ko, ACS Nano, 2015, 9, 3421–3427 CrossRef CAS PubMed.
- Z. L. Wang, L. Long, J. Chen, S. Niu and Y. Zi, Triboelectric Nanogenerators, Springer International Publishing, Switzerland, 2016.
- T. He, X. Guo and C. Lee, iScience, 2021, 24, 101934 CrossRef PubMed.
- F. Xing, Y. Jie, X. Cao, T. Li and N. Wang, Nano Energy, 2017, 42, 138–142 CrossRef CAS.
- X. Guo, L. Liu, Z. Zhang, S. Gao, T. He, Q. Shi and C. Lee, J. Micromech. Microeng., 2021, 31, 093002 CrossRef CAS.
- X. Xie, J. Tian, X. Cao, X. Li, J. Zhang, Z. Wang and K. Ren, ACS Appl. Energy Mater., 2022, 5, 7651–7660 CrossRef CAS.
- A. Wang, Z. Liu, M. Hu, C. Wang, X. Zhang, B. Shi, Y. Fan, Y. Cui, Z. Li and K. Ren, Nano Energy, 2018, 43, 63–71 CrossRef CAS.
- Y. Hao, Y. Bin, H. Tao, W. Cheng, W. Hongzhi and Z. Meifang, in IEEE-NANO 2015 – 15th International Conference on Nanotechnology, IEEE, Rome, Italy, 2015, vol. 1, pp. 1485–1488 Search PubMed.
- J. P. Lee, J. W. Lee and J. M. Baik, Micromachines, 2018, 9, 532 CrossRef PubMed.
- P. Martins, A. C. Lopes and S. Lanceros-Mendez, Prog. Polym. Sci., 2014, 39, 683–706 CrossRef CAS.
- S. Zhang, B. Zhang, J. Zhang and K. Ren, ACS Appl. Mater. Interfaces, 2021, 13, 32242–32250 CrossRef CAS PubMed.
- S. Shetty, A. M. Shanmugharaj and S. Anandhan, J. Polym. Res., 2021, 28, 419 CrossRef CAS.
- L. Li, M. Zhang, M. Rong and W. Ruan, RSC Adv., 2014, 4, 3938–3943 RSC.
- A. Salimi and A. A. Yousefi, Polym. Test., 2003, 22, 699–704 CrossRef CAS.
- V. Sencadas, R. Gregorio and S. Lanceros-Méndez, J. Macromol. Sci., Part B: Phys., 2009, 48, 514–525 CrossRef CAS.
- Y. Jiang, Y. Ye, J. Yu, Z. Wu, W. Li, J. Xu and G. Xie, Polym. Eng. Sci., 2007, 47, 1344–1350 CrossRef CAS.
- A. Lund and B. Hagström, J. Appl. Polym. Sci., 2011, 120, 1080–1089 CrossRef CAS.
- R. Gonçalves, P. Martins, X. Moya, M. Ghidini, V. Sencadas, G. Botelho, N. D. Mathur and S. Lanceros-Mendez, Nanoscale, 2015, 7, 8058–8061 RSC.
- G. Li, H. Zhang, K. Guo, X.-S. Ma and Y.-Z. Long, Mater. Res. Express, 2020, 7, 095502 CrossRef CAS.
- X. Wang, F. Sun, G. Yin, Y. Wang, B. Liu and M. Dong, Sensors, 2018, 18, 330 CrossRef PubMed.
- M. M. Abolhasani, M. Naebe, A. Jalali-Arani and Q. Guo, Nano, 2014, 9, 1450065 CrossRef.
- M. Khalifa, A. Mahendran and S. Anandhan, RSC Adv., 2016, 6, 114052–114060 RSC.
- S. Dash, R. N. P. Choudhary and M. N. Goswami, J. Alloys Compd., 2017, 715, 29–36 CrossRef CAS.
- S. Shetty, A. Mahendran and S. Anandhan, Soft Matter, 2020, 16, 5679–5688 RSC.
- J. Chen, H. Guo, X. He, G. Liu, Y. Xi, H. Shi and C. Hu, ACS Appl. Mater. Interfaces, 2016, 8, 736–744 CrossRef CAS PubMed.
- S. Chen, X. Tao, W. Zeng, B. Yang and S. Shang, Adv. Energy Mater., 2017, 7, 1601569 CrossRef.
- S. Wang, L. Lin and Z. L. Wang, Nano Lett., 2012, 12, 6339–6346 CrossRef CAS PubMed.
- M. V. Paranjape, S. A. Graham, H. Patnam, P. Manchi and J. S. Yu, Compos. Sci. Technol., 2022, 221, 109323 CrossRef CAS.
- J. E. Lee, Y. E. Shin, G. H. Lee, J. Kim, H. Ko and H. G. Chae, Composites, Part B, 2021, 223, 109098 CrossRef CAS.
- D. L. Vu and K. K. Ahn, in 2021 24th International Conference on Mechatronics Technology, ICMT 2021, Institute of Electrical and Electronics Engineers Inc., 2021 Search PubMed.
- G. J. Choi, S. H. Baek, S. S. Lee, F. Khan, J. H. Kim and I. K. Park, J. Alloys Compd., 2019, 797, 945–951 CrossRef CAS.
- T. Bhatta, P. Maharjan, H. Cho, C. Park, S. H. Yoon, S. Sharma, M. Salauddin, M. T. Rahman, S. S. Rana and J. Y. Park, Nano Energy, 2021, 81, 105670 CrossRef CAS.
- S. Kim, Y. Song and M. J. Heller, J. Nanomater., 2017, 2017, 2697382 Search PubMed.
- J. S. Im and I. K. Park, ACS Appl. Mater. Interfaces, 2018, 10, 25660–25665 CrossRef CAS PubMed.
- C. Berger, R. Phillips, A. Centeno, A. Zurutuza and A. Vijayaraghavan, Nanoscale, 2017, 9, 17439–17449 RSC.
- X. Yang, Y. Wang and X. Qing, Sens. Actuators, A, 2019, 299, 111579 CrossRef CAS.
- C.-R. Yang, M.-F. Lin, C.-K. Huang, W.-C. Huang, S.-F. Tseng and H.-H. Chiang, Measurement, 2022, 202, 111817 CrossRef.
- M. Khalifa, E. Schoeffmann, H. Lammer, A. R. Mahendran, G. Wuzella and S. Anandhan, Soft Matter, 2021, 17, 10891–10902 RSC.
- S. Wu, W. P. C. Lee and P. Wu, Sci. Rep., 2022, 12, 1–11 CrossRef PubMed.
- Y. Fu, Y. Wang, S. Wang, Z. Gao and C. Xiong, Polym. Compos., 2019, 40, 2088–2094 CrossRef CAS.
- J. S. Andrew and D. R. Clarke, Langmuir, 2008, 24, 670–672 CrossRef CAS PubMed.
- H. Jiyong, Z. Yinda, Z. Hele, G. Yuanyuan and Y. Xudong, Smart Mater. Struct., 2017, 26, 085019 CrossRef.
- Z. Zhao, J. Li, X. Yuan, X. Li, Y. Zhang and J. Sheng, J. Appl. Polym. Sci., 2005, 97, 466–474 CrossRef CAS.
- S. Jang, H. Kim, Y. Kim, B. J. Kang and J. H. Oh, Appl. Phys. Lett., 2016, 108, 143901 CrossRef.
- T. Huang, M. Lu, H. Yu, Q. Zhang, H. Wang and M. Zhu, Sci. Rep., 2015, 5, 13942 CrossRef CAS PubMed.
- C. A. Schneider, W. S. Rasband and K. W. Eliceiri, Nat. Methods, 2012, 9, 671–675 CrossRef CAS PubMed.
- W. Chen and X. Yan, J. Mater. Sci. Technol., 2020, 43, 175–188 CrossRef CAS.
- S. Rasel and G. Rizvi, Polym.-Plast. Technol. Eng., 2018, 57, 320–326 CrossRef CAS.
- G. Ico, A. Showalter, W. Bosze, S. C. Gott, B. S. Kim, M. P. Rao, N. V. Myung and J. Nam, J. Mater. Chem. A, 2016, 4, 2293–2304 RSC.
- X. Cai, T. Lei, D. Sun and L. Lin, RSC Adv., 2017, 7, 15382–15389 RSC.
- M. Sharma, G. Madras and S. Bose, Cryst. Growth Des., 2015, 15, 3345–3355 CrossRef CAS.
- G. S. Ekbote, M. Khalifa, A. Mahendran and S. Anandhan, Soft Matter, 2021, 17, 2215–2222 RSC.
- K. Momma and F. Izumi, J. Appl. Crystallogr., 2011, 44, 1272–1276 CrossRef CAS.
- D. M. Esterly and B. J. Love, J. Polym. Sci., Part B: Polym. Phys., 2004, 42, 91–97 CrossRef CAS.
- A. M. AlAhzm, M. O. Alejli, D. Ponnamma, Y. Elgawady and M. A. A. Al-Maadeed, J. Mater. Sci.: Mater. Electron., 2021, 32, 14610–14622 CrossRef CAS.
- R. S. Bharath, T. Chakraborthy, H. Nhalil, B. Masin, K. Ashok, H. Sreemoolanadhan, C. Oommen and S. Elizabeth, J. Mater. Chem. C, 2019, 7, 4484–4496 RSC.
- N. Jahan, F. Mighri, D. Rodrigue and A. Ajji, J. Appl. Polym. Sci., 2017, 134, 44940 CrossRef.
- C. Tsonos, H. Zois, A. Kanapitsas, N. Soin, E. Siores, G. D. Peppas, E. C. Pyrgioti, A. Sanida, S. G. Stavropoulos and G. C. Psarras, J. Phys. Chem. Solids, 2019, 129, 378–386 CrossRef CAS.
- C. Shamitha, A. Mahendran and S. Anandhan, J. Appl. Polym. Sci., 2020, 137, 48697 CrossRef CAS.
- S. Shetty, G. S. Ekbote, A. Mahendran and S. Anandhan, J. Mater. Sci.: Mater. Electron., 2019, 30, 20703–20715 CrossRef CAS.
- H. J. Ye, L. Yang, W. Z. Shao, S. B. Sun and L. Zhen, RSC Adv., 2013, 3, 23730–23736 RSC.
- S. Dash, R. N. P. Choudhary, A. Kumar and M. N. Goswami, J. Mater. Sci.: Mater. Electron., 2019, 30, 19309–19318 CrossRef CAS.
- H. Lu, L. Liu, J. Lin, W. Yang, L. Weng, X. Zhang, G. Chen and W. Huang, J. Appl. Polym. Sci., 2017, 134, 45362 CrossRef.
- Prateek, V. K. Thakur and R. K. Gupta, Chem. Rev., 2016, 116, 4260–4317 CrossRef CAS PubMed.
- G. Hu, F. Gao, J. Kong, S. Yang, Q. Zhang, Z. Liu, Y. Zhang and H. Sun, J. Alloys Compd., 2015, 619, 686–692 CrossRef CAS.
- S. Song, Y. Zhai and Y. Zhang, ACS Appl. Mater. Interfaces, 2016, 8, 31264–31272 CrossRef CAS PubMed.
- S. Wageh, L. He, A. A. Al-Ghamdi, Y. A. Al-Turki and S. C. Tjong, RSC Adv., 2014, 4, 28426–28431 RSC.
- T. Zhu, C. Qian, W. Zheng, R. Bei, S. Liu, Z. Chi, X. Chen, Y. Zhang and J. Xu, RSC Adv., 2018, 8, 10522–10531 RSC.
- D. Kwon, T. I. Lee, J. Shim, S. Ryu, M. S. Kim, S. Kim, T. S. Kim and I. Park, ACS Appl. Mater. Interfaces, 2016, 8, 16922–16931 CrossRef CAS PubMed.
- Y. Zhu, Y. Wu, G. Wang, Z. Wang, Q. Tan, L. Zhao and D. Wu, Org. Electron., 2020, 84, 105759 CrossRef CAS.
- L. Ma, X. Shuai, Y. Hu, X. Liang, P. Zhu, R. Sun and C. P. Wong, J. Mater. Chem. C, 2018, 6, 13232–13240 RSC.
- M. Sharma, V. Srinivas, G. Madras and S. Bose, RSC Adv., 2016, 6, 6251–6258 RSC.
- M. Abbasipour, R. Khajavi, A. A. Yousefi, M. E. Yazdanshenas and F. Razaghian, J. Mater. Sci.: Mater. Electron., 2017, 28, 15942–15952 CrossRef CAS.
- F. Mokhtari, M. Shamshirsaz, M. Latifi and S. Asadi, J. Text. Inst., 2017, 108, 906–914 CrossRef CAS.
- X. He, H. Guo, X. Yue, J. Gao, Y. Xi and C. Hu, Nanoscale, 2015, 7, 1896–1903 RSC.
- S. Ippili, V. Jella, A. M. Thomas, C. Yoon, J. S. Jung and S. G. Yoon, J. Mater. Chem. A, 2021, 9, 15993–16005 RSC.
- L. Shi, H. Jin, S. Dong, S. Huang, H. Kuang, H. Xu, J. Chen, W. Xuan, S. Zhang, S. Li, X. Wang and J. Luo, Nano Energy, 2021, 80, 105599 CrossRef CAS.
- J. H. Zhang, Z. Zhou, J. Li, B. Shen, T. Zhu, X. Gao, R. Tao, X. Guo, X. Hu, Y. Shi and L. Pan, ACS Mater. Lett., 2022, 4, 847–852 CrossRef CAS.
- P. Liu, N. Sun, Y. Mi, X. Luo, X. Dong, J. Cai, X. Jia, M. A. Ramos, T. S. Hu and Q. Xu, Compos. Sci. Technol., 2021, 208, 108733 CrossRef CAS.
- M. Xu, Y. C. Wang, S. L. Zhang, W. Ding, J. Cheng, X. He, P. Zhang, Z. Wang, X. Pan and Z. L. Wang, Extrem. Mech. Lett., 2017, 15, 122–129 CrossRef.
- I. W. Tcho, W. G. Kim, J. K. Kim, D. W. Kim, S. Y. Yun, J. H. Son and Y. K. Choi, Nano Energy, 2022, 98, 107197 CrossRef CAS.
- S. Cheon, H. Kang, H. Kim, Y. Son, J. Y. Lee, H. J. Shin, S. W. Kim and J. H. Cho, Adv. Funct. Mater., 2018, 28, 1703778 CrossRef.
- D. J. Sim, G. J. Choi, S. H. Sohn and I. K. Park, J. Alloys Compd., 2022, 898, 162805 CrossRef CAS.
- X. Kang, C. Pan, Y. Chen, X. Pu, X. Kang, Y. Chen, X. Pu, C. Pan and X. Pu, RSC Adv., 2020, 10, 17752–17759 RSC.
- R. Wen, J. Guo, A. Yu, K. Zhang, J. Kou, Y. Zhu, Y. Zhang, B. W. Li and J. Zhai, Nano Energy, 2018, 50, 140–147 CrossRef CAS.
Footnote |
| † Electronic supplementary information (ESI) available. See DOI: https://doi.org/10.1039/d3lp00080j |
| This journal is © The Royal Society of Chemistry 2023 |

