 Open Access Article
Investigation on electrocatalytic performance and material degradation of an N-doped graphene-MOF nanocatalyst in emulated electrochemical environments†
Niladri
Talukder
 a,
Yudong
Wang
 a,
Bharath Babu
Nunna
 b,
Xiao
Tong
 c,
Jorge Anibal
Boscoboinik
 c and
Eon Soo
Lee
 *a
*a
aAdvanced Energy Systems and Microdevices Laboratory, Department of Mechanical and Industrial Engineering, New Jersey Institute of Technology, Newark, NJ 07102, USA. E-mail: eonsoo.lee@njit.edu
bDepartment of Mechanical Engineering, Weber State University, Ogden, Utah 84408, USA
cThe Center for Functional Nanomaterials, Brookhaven National Laboratory, Upton, New York 11973, USA
First published on 1st August 2023
Abstract
To develop graphene-based nanomaterials as reliable catalysts for electrochemical energy conversion and storage systems (e.g. PEM fuel cells, metal–air batteries, etc.), it is imperative to critically understand their performance changes and correlated material degradation processes under different operational conditions. In these systems, hydrogen peroxide (H2O2) is often an inevitable byproduct of the catalytic oxygen reduction reaction, which can be detrimental to the catalysts, electrodes, and electrolyte materials. Here, we studied how the electrocatalytic performance changes for a heterogeneous nanocatalyst named nitrogen-doped graphene integrated with a metal–organic framework (N-G/MOF) by the effect of H2O2, and correlated the degradation process of the catalyst in terms of the changes in elemental compositions, chemical bonds, crystal structures, and morphology. The catalyst samples were treated with five different concentrations of H2O2 to emulate the operational conditions and examined to quantify the changes in electrocatalytic performances in an alkaline medium, elemental composition and chemical bonds, crystal structure, and morphology. The electrocatalytic performance considerably declined as the H2O2 concentration reached above 0.1 M. The XPS analyses suggest the formation of different oxygen functional groups on the material surface, the breakdown of the material's C–C bonds, and a sharp decline in pyridinic-N functional groups due to gradually harsher H2O2 treatments. In higher concentrations, the H2O2-derived radicals altered the crystalline and morphological features of the catalyst.
Keywords: Nitrogen-doped graphene-based electrocatalyst; Metal–organic framework; Hydrogen peroxide effect on catalyst; Electrocatalytic performance; Material degradation.
1 Introduction
Graphene-based materials have attracted special attention in recent decades as these materials showed impressive physical, chemical, and electrochemical properties such as mechanical strength, high surface area, thermal conductivity, electrical conductance, capacitance, etc.1–3 indicating their applicability in numerous fields such as electrochemical energy conversion and storage systems,4–6 supercapacitors,7–10 photocatalysis,11–13 point-of-care disease detection devices,14 magnetic memories,15,16 and so on. For different electrochemical systems (PEM fuel cell, metal–air battery, electrochemical H2O2 synthesis, etc.), the substantial economic disadvantage of using precious metal-based catalysts to promote the sluggish electrochemical reactions has driven researchers to develop viable alternative catalysts. Readily available graphene-based materials have shown high potential as electrochemical catalysts recently. However, at this point, graphene-based electrocatalysts require numerous studies to improve their catalytic parameters such as performance stability, material degradation, onset potential, surface fouling, etc.Different approaches are being taken to polish up the electrocatalytic properties of graphene-based materials; one of the largely explored directions is introducing defects by doping a variety of heteroatoms (N, B, P, S, etc.) into the graphene structure so that its electronic properties can be modulated. Nitrogen-doped graphene (N-G) has gained distinct interest as the doped nitrogen atoms can form bonds with the carbon atoms of graphene in different orientations which create different nitrogen functional groups (substitutional/graphitic-N, pyrrolic-N, pyridinic-N, pyridinic-N-oxide, etc.), and each of these functional groups shows unique functionalities in electrochemical environments. The electrocatalytic performances of N-Gs appear promising, yet further improvements are needed in different electrocatalytic parameters to consider these materials as reliable alternative catalysts for electrochemical systems. An approach to enhance the current density of N-G catalysts is to integrate them with other materials with adventitious properties for electrocatalytic activity.
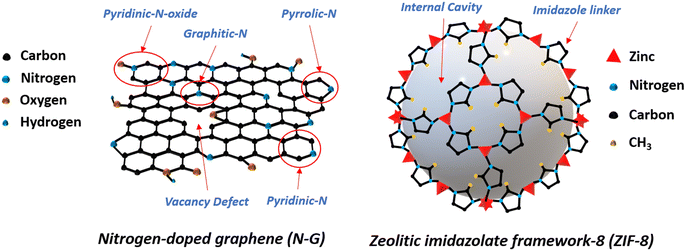
Metal–organic frameworks (MOFs) are among the advantageous materials for the catalytic process. With micro and nano pores, crystal units with cavities, and high surface areas, MOFs can offer paramount structural requirements for heterogeneous catalysts.17,18 Zeolitic imidazolate framework-8 (ZIF-8) is one of the popular members of the MOF family because of its unique structural and chemical properties. In Fig. 1 the schematics of the structural forms of N-G and ZIF-8's unit cell are shown. Previously ZIF-8 was integrated with N-G to synthesize an N-G/MOF nano-catalyst. The N-G/MOF nano-catalyst exhibited electrocatalytic performances comparable to the standard 10 wt% platinum supported by carbon (Pt/C) catalyst.4,19–27 The extended surface area brought by ZIF-8 in the N-G/MOF structure aided in hosting a larger number of catalytically active sites (e.g. N functional groups from N-G) and the porous crystal structure of ZIF-8 improved the reactant/product transport process. As a result, the reaction rate was enhanced substantially which was manifested as high current density.
The N-G/MOF material can be taken as a representative of both graphene-based and MOF-based electrocatalysts, hence, in this study, we used it to investigate how the presence of H2O2 and other H2O2-derived highly oxidative species in electrochemical systems affects both N-G and MOF materials and accordingly reduce the catalytic performance during operation. Such a study is crucial for carbon-based high-potential electrocatalysts; the materials must maintain their catalytic activity as well as structural integrity in considerably harsh reaction environments of the electrochemical systems for a long period.
The electrochemical oxygen reduction reaction is one of the most studied processes for electrochemical energy systems. In this process, there are several known pathways for catalyst degradation. H2O2-driven degradation is a major one.28 In electrochemical systems, the direct 4-electron transfer oxygen reduction reaction pathway is desirable as it ensures maximum current density output. However, on carbon-based catalysts, both direct 4-electron and two-step 2-electron transfer oxygen reduction reaction processes were observed.29 When the 2-electron transfer ORR proceeds, H2O2 or HO2− species are generated as the intermediate products as shown below.
The ORR in alkaline medium:
| O2 + H2O + 2e− → HO2− + OH− | (1) |
| HO2− + H2O + 2e− → 3OH− | (2) |
Electrochemical H2O2 decomposition:
| H2O2 + e− → OH− + OH˙ | (3) |
| H2O2 → HOO˙ + H+ + e− | (4) |
| H2O2 + OH− → HOO− + H2O (in alkaline medium) | (5) |
Numerous studies evaluated the performance durability of different graphene-based catalysts for oxygen reduction reaction with the consideration of material degradation process by H2O2;4,32–36 however, most of them are limited to reporting H2O2 yield from the electrochemical reaction under different conditions. Besides, most of these studies were conducted on transition metal-based catalysts (especially iron (Fe)-based ones) supported by some forms of carbon, rarely graphene; the primary focus was invested on the dissolution of Fe sites due to H2O2-derived species.4,37–40 Lefèvre et al. reported the H2O2 yield from five Fe-based carbon-supported catalysts in the electrochemical environment. This study concluded that H2O2 treatments decreased the catalytic performances of the samples; delamination of Fe contents by H2O2 treatment is one of the possible causes for that.41 The effect of H2O2 on the carbon structure of the catalyst was not included in their study. Wu et al. performed a performance durability study on their synthesized polyaniline (PANI)-derived non-precious metal-based catalyst supported by Ketjen carbon black.42 Their study suggests that a peroxide-rich environment is detrimental to such catalysts. However, changes brought by the oxidative attack of H2O2-related radicals on the carbon support were not probed here. Goellner et al. conducted experiments to understand the H2O2-induced degradation phenomenon of three transition metals Fe, Co, and Cr supported by N-doped carbon catalysts.43 They applied an ex situ hydrothermal reflux process to treat the catalysts with different concentrations of H2O2. Their investigation mostly remained focused on the H2O2-driven changes in the catalytically active sites around the metal atoms. Effects of H2O2-derived oxidative species on the graphene structure remained mostly beyond the scope of this study. Xing et al. conducted a brief study to understand the degradation of graphene by hydrogen peroxide. Their study mainly focused on the changes in defect structures on graphene caused by H2O2-derived radicals, which did not provide sufficient information regarding the chemical structural changes in the material.44 It is evident that a substantial knowledge gap exists on the H2O2-driven performance changes and material degradation process of graphene-based catalysts for electrochemical systems.
In this study, we have investigated the electrocatalytic performance losses and corresponding material degradation pathways of an advanced carbon-based nano electrocatalyst N-G/MOF by the effect of H2O2 and H2O2-derived oxidative species. As the same oxidative species/radicals (OH˙, H˙, OOH˙) are generated by both electrochemical and chemical decomposition of H2O2 (eqn (3)–(5)), to emulate the H2O2 driven catalyst degradation phenomena under different operational conditions, we have chemically treated five samples of the N-G/MOF catalyst with five different concentrations of H2O2, and observed the physical and chemical changes brought by the treatments and studied how the corresponding electrocatalytic performances were affected. The electrocatalytic performances of the samples were evaluated by a three-electrode rotating disk electrode (RDE) system. The samples were analyzed by X-ray photoelectron spectroscopy (XPS), X-ray diffraction (XRD), and scanning electron microscopy (SEM) to quantify/identify the changes in their compositions, chemical bonds, crystal features, and morphologies caused by H2O2. The experimental reports presented in this study should serve as guides for the improvement approaches of a vast array of potential catalysts that involve graphene-derived and MOF-based materials for the next-generation electrochemical systems.
2 Results and discussion
2.1 Changes in the electrocatalytic performance
The changes in electrocatalytic performance of N-G/MOF samples in alkaline medium caused by H2O2 treatments were evaluated by comparing the cathodic ORR current densities generated by the samples, measured through the LSV technique in an RDE system (detailed in the Experimental section). All the LSV curves for individual N-G/MOF samples presented in this section are the average of multiple repeated LSV data sets obtained under identical conditions. For all the individual LSV curves, the current density values at different applied potentials remained within a standard deviation of 0.31 mA cm−2.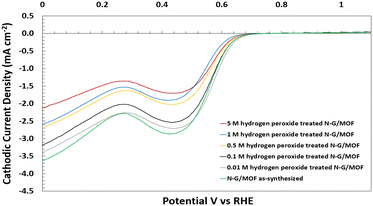 | ||
| Fig. 2 Electrochemical performance evaluation of the as-synthesized and H2O2 treated N-G/MOF samples in alkaline medium (0.1 M KOH), experimentally taken by the LSV technique of the RDE system. | ||
The LSV curve of the 0.01 M H2O2 treated N-G/MOF suggests that the effect of H2O2-derived radicals on the N-G/MOF's catalytic performance was not severe for this H2O2 treatment. At lower applied potentials (vs. RHE) the cathodic current densities from this sample remained close to the ones of the as-synthesized N-G/MOF. The 0.1 M H2O2 treated sample showed a lower performance than the as-synthesized N-G/MOF throughout the potential range and the peak cathodic current density was reduced by around 7% compared with the as-synthesized N-G/MOF. The current density critically depends on some material properties of the catalyst such as porosity, surface area, number of active sites on the surface, electronic nature of the active sites, etc.; all these properties are directly related to the material and chemical structures of the catalyst.
The LSV curve of this sample indicates that, although not severe, the material and chemical structures of the N-G/MOF was altered noticeably by 0.1 M H2O2 treatment which was unfavourable for facilitating the reaction. The catalytic activity sharply dropped for the N-G/MOF samples treated with H2O2 of higher concentrations: 0.5 M, 1 M, and 5 M, indicating a drastic change in the material and chemical structures of the N-G/MOF catalyst caused by the oxidative radicals from H2O2. The cathodic ORR current density dropped by 40% for the 5 M H2O2-treated N-G/MOF compared to the as-synthesized N-G/MOF. While probing the specific reactions between H2O2-derived species and the N-G/MOF, which essentially caused the structural degradation, was beyond the scope of this study, nonetheless, some important indications were obtained from these observations: at higher H2O2 concentrations than 0.1 M, the highly oxidative radicals considerably reduced the catalytic performance of the N-G/MOF, most likely by altering the N-doped graphene structure, as well as reduced the porosity of the material by deforming the ZIF-8's crystal units. Table 1 presents the comparison of electron transfer numbers for the samples calculated from the generated current densities at 0 V vs. RHE. The electron transfer numbers suggest that the N-G/MOF could facilitate the 4-electron transfer ORR to some degree till the treatment with 0.1 M H2O2.
| H2O2 concentrations for the treatments of N-G/MOF samples | 0 (M) | 0.01 (M) | 0.1 (M) | 0.5 (M) | 1 (M) | 5 (M) |
|---|---|---|---|---|---|---|
| Electron transfer number, n | 3.35 | 3.08 | 3.03 | 2.44 | 2.22 | 2.11 |
2.2 Changes in the elemental compositions and chemical bonds
The changes in electrocatalytic performance of the N-G/MOF due to H2O2 treatments indicated that the structural properties of the material were altered, and these alterations should be observable in terms of the changes in elemental compositions and different chemical bonds. The changes in elemental compositions of the N-G/MOF were observed by obtaining XPS survey scans on each of the samples. And the changes in the different chemical bonds of carbon, nitrogen, and oxygen were quantified by taking C 1s, N 1s, and O 1s narrow scans and peak fittings based on the standard binding energy of the bonds from the XPS database.![[double bond, length as m-dash]](https://www.rsc.org/images/entities/char_e001.gif) O bonds. Fig. 4a shows the C 1s spectra of the as-synthesized N-G/MOF. Apparently, as the catalyst was treated with gradually increasing concentrations of H2O2, Fig. 4b–f, the overall C 1s spectra regions broadened, and the data noise levels increased even though 20 consecutive C 1s narrow scans were taken to obtain each of these data sets. As the local chemical structure has a direct influence on the energy of photoelectrons emitted from specific atoms, this observation on C 1s plots suggests a higher molecular level interaction between the H2O2-derived species and carbon atoms of the N-G/MOF as the H2O2 concentrations increased.
O bonds. Fig. 4a shows the C 1s spectra of the as-synthesized N-G/MOF. Apparently, as the catalyst was treated with gradually increasing concentrations of H2O2, Fig. 4b–f, the overall C 1s spectra regions broadened, and the data noise levels increased even though 20 consecutive C 1s narrow scans were taken to obtain each of these data sets. As the local chemical structure has a direct influence on the energy of photoelectrons emitted from specific atoms, this observation on C 1s plots suggests a higher molecular level interaction between the H2O2-derived species and carbon atoms of the N-G/MOF as the H2O2 concentrations increased.
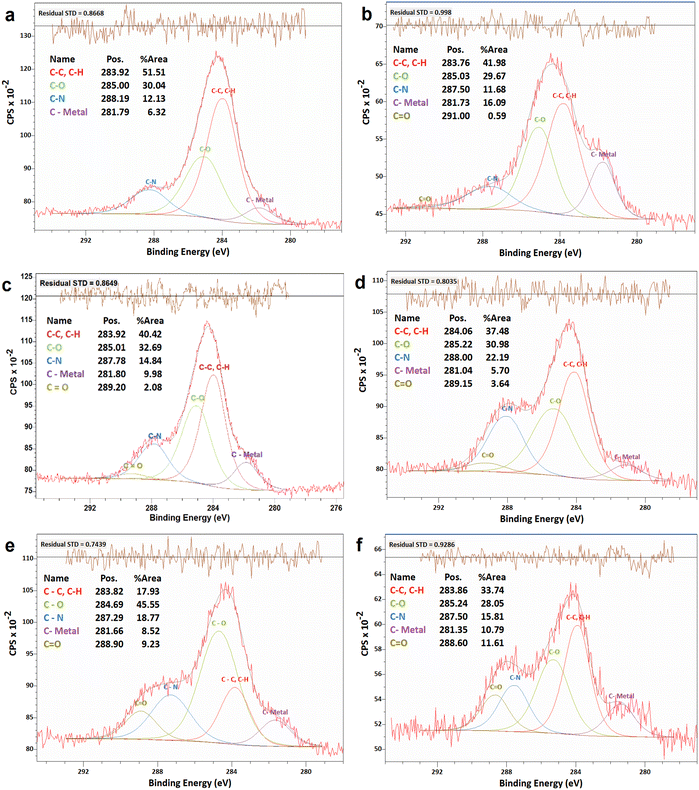 | ||
| Fig. 4 XPS analyses of the C 1s narrow scan spectra of N-G/MOF samples: (a) as-synthesized N-G/MOF; (b) 0.01 M; (c) 0.1 M; (d) 0.5 M; (e) 1 M; and (f) 5 M H2O2 treated N-G/MOF. | ||
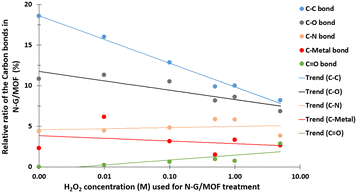
The quantifications of different carbon bonds are summarized in Fig. 5; the relative ratios of different carbon bonds in N-G/MOF samples were plotted with the corresponding concentrations of H2O2 used to treat them. The relative ratios of C–C (carbon–carbon) bonds sharply dropped as the H2O2 concentration increased. The chemical structures of N-G and ZIF-8 suggest that the primary locations of the C–C bonds in the N-G/MOF are the hexagonal honeycomb shape lattice of graphene and the imidazole linkers of ZIF-8 (Fig. 1). The declining trend of C–C bonds suggests the possible disintegration of both graphene's honeycomb structure and ZIF-8's crystal units to some degree because of the oxidative attack of H2O2-derived radicals.47–51 Deformation of graphene's honeycomb structure should result in a disrupted pi-electron network in N-G. On the other hand, damage to the ZIF-8 structure should reduce the electrocatalytic performance of the N-G/MOF by being incapable of hosting a large number of catalytically active sites, also the capacity for reactant/product transport can be reduced. The trend of the current density values obtained from the RDE experiments (Fig. 2) is in agreement with this observation of the changes in relative ratios of the C–C bond.
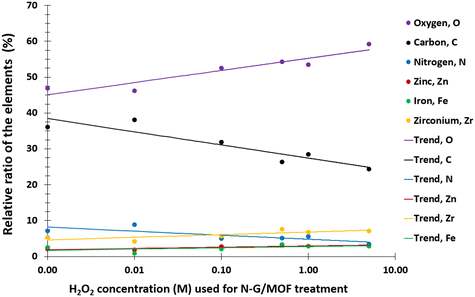
The relative ratios of the C–O (carbon–oxygen) bonds also appeared to be in a declining trend with the increment of H2O2 concentration. This implies that the oxygen-containing species from H2O2 most likely formed bonds with the existing oxygen functional groups on graphene (recalling that the GO was used as the graphene source, which contained different oxygen groups in its chemical structure). The relative ratios of C–N (carbon–nitrogen) bonds slightly increased although the elemental ratio of N slightly decreased (as seen in Fig. 3). Recalling the RDE data, again this observation suggests the existence of some form of C–N bonds that possibly did not support the catalytic reaction. To this aspect, the deactivation of nitrogen sites of the N-G/MOF by the formation of the NH3 group through protonation is a compelling possibility.52 A slight decline in C–metal bonds implies the dissociation of metal atoms from graphene structure by H2O2 treatments to some degree (most possibly Fe by Fenton reactions). A higher level of data fluctuation for the relative ratios of C–metal bonds was observed. This most possibly occurred by the effect of the highly complex molecular structure and a substantially lower ratio of metal atoms on the XPS narrow scan data acquisition process. At higher concentrations of H2O2 treatments increased C![[double bond, length as m-dash]](https://www.rsc.org/images/entities/char_e001.gif) O was observed in the N-G/MOF which suggests the formation of additional ketone groups on the N-G/MOF.53
O was observed in the N-G/MOF which suggests the formation of additional ketone groups on the N-G/MOF.53
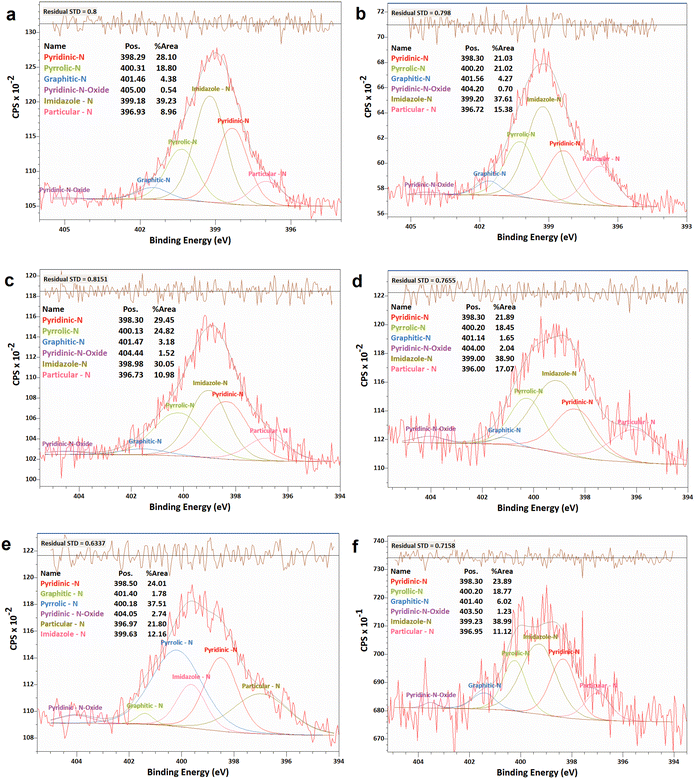 | ||
| Fig. 6 XPS analyses of the N 1 s narrow scan spectra of N-G/MOF samples: (a) as-synthesized N-G/MOF; (b) 0.01 M; (c) 0.1 M; (d) 0.5 M; (e) 1 M; and (f) 5 M H2O2 treated N-G/MOF. | ||
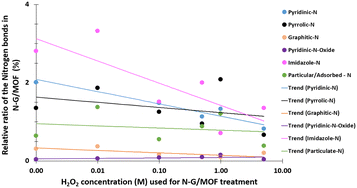
The changes in different N bonds are summarized in Fig. 7. Most of the N-bonds decreased with the increment of H2O2 concentration. The nitrogen group from imidazole rings of ZIF-8 and the pyridinic-N group from N-G experienced a sharp decline as the H2O2 concentration increased. Following this observation, the sharp decline in the catalytic performance of the N-G/MOF with higher concentration H2O2 treatment (Fig. 2) suggests that these two nitrogen groups were the main active site inducers in the N-G/MOF catalyst. The decline of nitrogen contents from imidazole rings however also suggests the disintegration of ZIF-8 crystal units, which is also responsible for the drop in the catalytic activity as seen in the RDE data. The pyrrolic-N functional group and graphitic-N are the other two significant catalytic sites in N-G materials. Only a slight drop in these groups because of the H2O2 treatments is observed, which agrees with the fact that the N-G/MOF still could support catalytic activities to some degree under harsher H2O2 conditions. The contents of physisorbed or particulate nitrogen remained almost unchanged, most possibly formed through the breakdown of other nitrogen groups. The overall declining trend of the elemental ratios of nitrogen in the N-G/MOF (Fig. 3) and the declining trends of most of the nitrogen bonds with increased H2O2 concentration suggest that the oxidative species from H2O2 have removed a portion of nitrogen atoms from the N-G/MOF during the H2O2 treatments.
![[double bond, length as m-dash]](https://www.rsc.org/images/entities/char_e001.gif) O bonds. The spectra for all the samples were considerably free of noise, which suggests that the oxygen atoms were mainly exposed to the material's surface; thus lower interference in the spectra was obtained.
O bonds. The spectra for all the samples were considerably free of noise, which suggests that the oxygen atoms were mainly exposed to the material's surface; thus lower interference in the spectra was obtained.
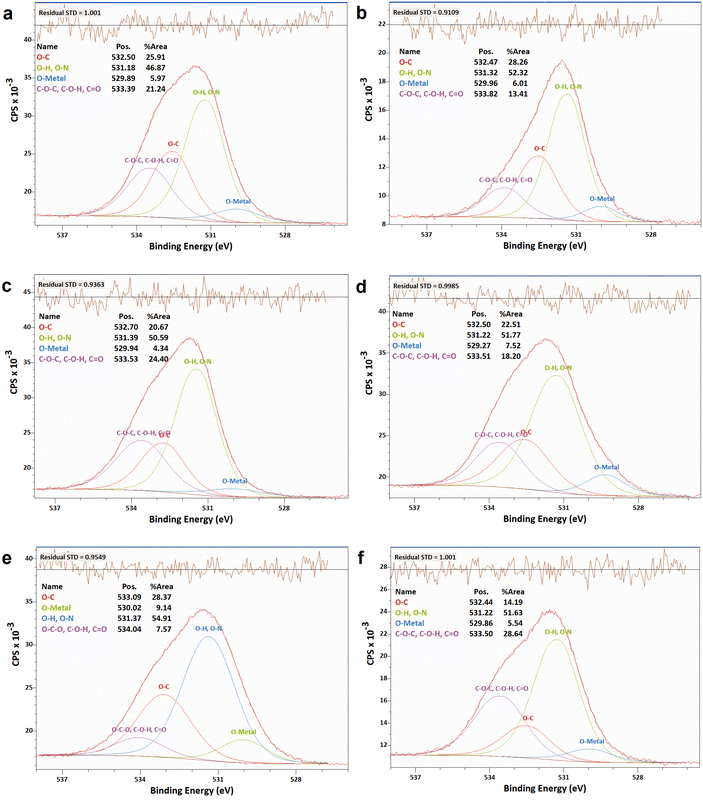 | ||
| Fig. 8 XPS analyses of the O 1s narrow scan spectra of N-G/MOF samples: (a) as-synthesized N-G/MOF; (b) 0.01 M; (c) 0.1 M; (d) 0.5 M; (e) 1 M; and (f) 5 M H2O2 treated N-G/MOF. | ||
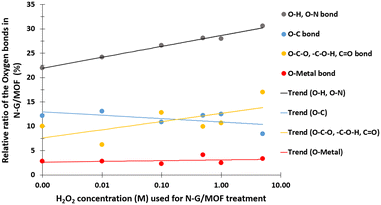
In Fig. 9 the changes in different oxygen bonds due to H2O2 treatments are summarized. A sharp increase in O–H and O–N bonds suggests due to H2O2 treatments most of the oxygen contents from H2O2 remained on the surface of the material in the forms of O–H and/or O–N oxygen functional groups. The peaks corresponding to the pyridinic-N-oxides (Fig. 6) did not appear similar to the peaks corresponding to the O–H and O–N peaks in Fig. 8, which suggests that the O–H bonds contributed most to these peaks in Fig. 8. The decline in the O–C bond's relative ratio at higher H2O2 treatments supports the observation of C–O seen from C 1s spectra analysis (Fig. 4). The relative ratios of possible bonds O–C–O, –C–O–H, and C![[double bond, length as m-dash]](https://www.rsc.org/images/entities/char_e001.gif) O increased. The peaks corresponding to the oxygen and carbon bonds (C–O and O–C) were similar in Fig. 4 and 8, although not exactly mirror reflections; most possibly because of the highly complex elemental orientations around these bonds. These bonds may have formed through the interactions between the oxidative radicals from H2O2 and N-G and ZIF-8 structures. The O–metal bonds experience a very slight increase. In Fig. 4, the C 1s spectra showed a slight decline in C–metal bonds. These two observations together suggest that metal atoms were delaminated from the N-G/MOF and formed metal oxides.
O increased. The peaks corresponding to the oxygen and carbon bonds (C–O and O–C) were similar in Fig. 4 and 8, although not exactly mirror reflections; most possibly because of the highly complex elemental orientations around these bonds. These bonds may have formed through the interactions between the oxidative radicals from H2O2 and N-G and ZIF-8 structures. The O–metal bonds experience a very slight increase. In Fig. 4, the C 1s spectra showed a slight decline in C–metal bonds. These two observations together suggest that metal atoms were delaminated from the N-G/MOF and formed metal oxides.
2.3 Changes in the crystal structure
The as-synthesized and H2O2-treated N-G/MOF samples were subjected to XRD analyses to observe the changes in crystal structures of the material due to the effect of the H2O2-derived oxidative species. Some form of crystalline structure was expected on the N-G/MOF as the precursor materials ZIF-8 have well-defined crystal structures; also, the GO should exhibit characteristic peaks of graphene to some degree. Fig. 10 shows the XRD patterns of the samples. For comparison, the XRD patterns of each sample were normalized by dividing by the highest intensity on each pattern. The peaks on the as-synthesized N-G/MOF are mainly the characteristic peaks of the precursor materials ZIF-8, GO, and melamine. The peaks at 7.3°, 12.6°, and 17.8° are the representatives of the ZIF-8 crystal units.54,55 The peak at 10.4° represents the GO, however, its small intensity suggests a considerable reduction of oxygen functional groups to exhibit a more graphitic nature as seen from the peak at 28.4°.56–58 The peaks at 13.5° and 15° are the standard peaks from the melamine structure.59 Broad peaks around 29° and 30° are attributed to both ZIF-8 and melamine; the width of these peaks suggests a complex physicochemical integration of N-G and ZIF-8 while forming the N-G/MOF.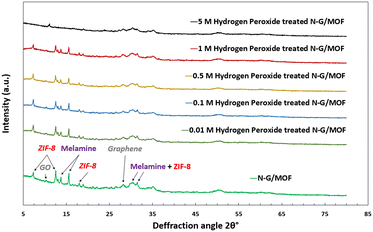 | ||
| Fig. 10 Changes in the X-ray diffraction (XRD) patterns of the as-synthesized and H2O2 treated N-G/MOF samples. | ||
This comparison of XRD patterns for different H2O2-treated N-G/MOF samples suggests that the positions of major peaks remained unchanged till 1 M H2O2 treatment, however, their intensities reduced, which indicates the breakdown of corresponding crystal structures to some degree. This reduction in the crystal features from ZIF-8 can be correlated to the declining catalytic performances seen in Fig. 2. Dramatic changes were observed in the 5 M H2O2 treated N-G/MOF sample where most of the major peaks of ZIF-8 and melamine almost disappeared suggesting a drastic material degradation for the N-G/MOF. Also, for this sample, the peak corresponding to GO (10.4°) in the N-G/MOF shifted to the right (11.1°) and increased, suggesting that the material was highly oxidized under this condition. The intensity of the peak at 28.8° corresponding to the graphene structure also reduced, suggesting graphene degradation to some degree.
To better understand the degradation process of the N-G/MOF through alteration of its crustal structure due to H2O2 treatments, the degree of crystallinities was also calculated for each sample from their XRD patterns. While the peaks on XRD patterns represent the existence of periodically repeating well-defined atomic orientations (lattice structures) in the material, the absence of peaks at some regions of the diffraction angle (2θ°) represents the presence of amorphous structure (randomly oriented atoms). Therefore, it is possible to quantify the overall degree of crystallinity from the XRD patterns as the ratio of the area under the full XRD pattern to the summation of areas under the crystal peaks; both areas were determined by constructing a reasonable baseline, as in the equation below:60
| Degree of Crystallinity = (Total area under all the crystalline peaks of XRD pattern/Total area under the full XRD pattern) × 100% |
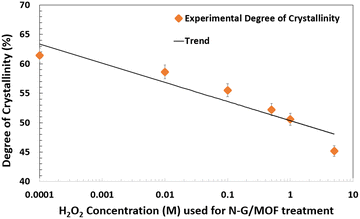 | ||
| Fig. 11 Changes in the degree of crystallinity in the as-synthesized and H2O2 treated N-G/MOF samples. | ||
2.4 Changes in morphology
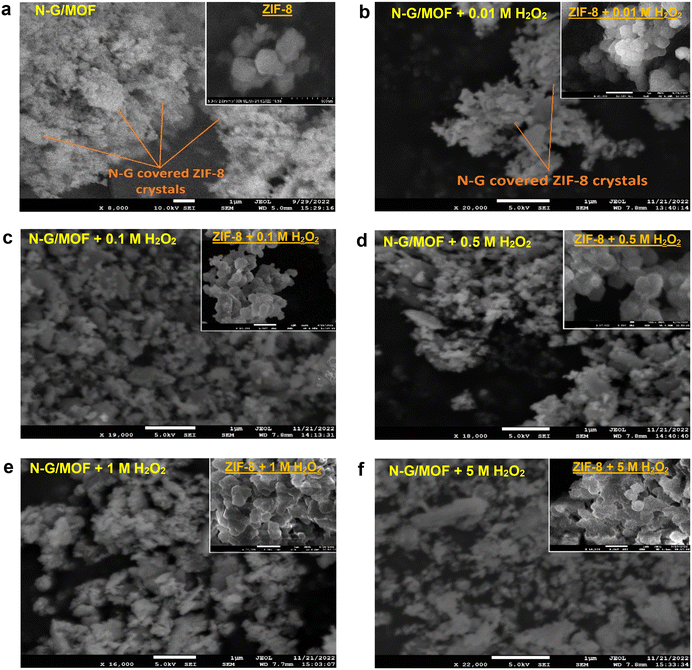
The morphological changes brought by the chemical bond and crystal structure changes in the N-G/MOF due to H2O2-derived oxidative species are observed by obtaining SEM images of the samples, as presented in Fig. 12; the unit bars are kept at 1 μm for all the images. Some morphological features of the N-G/MOF catalyst as-synthesized by the wet ball milling process can be noted as: the N-G nanoparticles covered the crystal units of ZIF-8; the ball milling process broke a portion of the ZIF-8 crystal units, and the fragments were physicochemically integrated with N-G. The rhombic dodecahedral-shaped (12 faces) crystal units of pure ZIF-8 are generally in the range of 200–500 nanometers.54,55,61 In the N-G/MOF these crystal units are found more than ∼1-micrometer size as seen in Fig. 12a. For the 0.01 M H2O2 treated N-G/MOF, the crystal sizes were reduced still some shapes of ZIF-8 units were visible, Fig. 12b. The particle size and crystal structures of the N-G/MOF were further reduced by the treatments of higher concentrations of H2O2 as seen in Fig. 12c–f. From the SEM image of the 5 M H2O2 treated N-G/MOF sample it was noticed that the ZIF-8 crystal structures were highly damaged, and the particles were much more fragmented than the other samples. This observation is aligned with the findings in RDE, XPS, and XRD analyses. To gain a clearer perception of such H2O2-driven morphological changes, five samples of pure ZIF-8 samples were treated with the same (as used for N-G/MOF treatments) concentrations of H2O2 following the same procedure and subsequently, their morphology was observed by SEM imaging. The SEM images of the pure ZIF-8 sample and five H2O2-treated ZIF-8 samples are presented in the insets of the SEM images of each corresponding N-G/MOF sample in Fig. 12a–f. The inset of Fig. 12a depicts the rhombic dodecahedral crystal structure of pure ZIF-8. As the concentration of H2O2 used for the treatments increased, the crystal structure of ZIF-8 gradually deformed, as observed in the insets of Fig. 12b–f. It is noteworthy that the ZIF-8 structure was significantly affected by the treatments with 1 M and 5 M H2O2 (insets Fig. 12e and f), with noticeable distortion of the edges and fusion of crystal units.3 Conclusions
The study evaluated the electrocatalytic performance loss and its correlations with the material degradation process (through chemical and structural changes) for a graphene-based and metal–organic framework integrated nanocatalyst N-G/MOF, by the effect of H2O2 and H2O2-derived highly oxidative species. The catalyst was chemically treated with H2O2 of different concentrations and subjected to RDE, XPS, XRD, and SEM analyses and compared with the as-synthesized sample to determine the changes in the electrocatalytic performances in alkaline medium, elemental compositions, different chemical bonds, crystal features, and morphology. The RDE results show that in alkaline medium the catalyst could reasonably maintain its performance up to 0.1 M H2O2 treatment, while higher concentrations of H2O2 treatments reduced the catalytic activities dramatically. The XPS survey analysis showed that the oxygen contents on the material surface increased dramatically as the H2O2 concentration increased, and the carbon contents dropped simultaneously. These observations suggest the formation of a variety of oxygen functional groups on the material surface. The changes in the relative ratios of different chemical bonds were evaluated from XPS C 1s, N 1s, and O 1s narrow scan analyses. Notably, the reduction of C–C bonds with the increments of H2O2 concentration indicates the deformation of N-G and ZIF-8 structure by the attack of oxidative radicals from H2O2. The relative ratio of most of the nitrogen bonds dropped by H2O2 treatments, especially the pyridinic-N functional group. The rapid increase in O–H and/or O–N bonds with increased concentration of H2O2 again suggested the formation of a cover of oxygen groups on the material surface. The XRD patterns of the samples confirmed the material degradation through crystal structure alteration which adversely affected the electrocatalytic performance of the material. The chemical and structural changes were also manifested as morphological changes. The reported effects of H2O2 on this graphene-based and MOF-integrated catalyst in this study should help the future efforts of electrocatalyst development with both materials by suggesting their performance and degradation nature in different practical electrochemical systems.4 Experimental section
4.1 Catalyst synthesis
The N-G/MOF catalyst was synthesized by a nanoscale high energy wet (NHEW) ball milling process. First, taking graphene oxide (OG) and melamine as graphene and nitrogen sources, respectively, in a 1![[thin space (1/6-em)]](https://www.rsc.org/images/entities/char_2009.gif) :
:![[thin space (1/6-em)]](https://www.rsc.org/images/entities/char_2009.gif) 6 mass ratio, nitrogen-doped graphene (N-G) was synthesized through the NHEW ball milling process. Successful doping of nitrogen (N) into graphene by this wet ball milling process was confirmed by our previous studies; the relationships between the grinding time and grinding speed with the nitrogen doping ratio and relative ratios of different nitrogen functional groups were determined and later utilized to achieve the best performing N-G catalyst.26 The N-G catalyst generated electrocatalytic current densities comparable to the standard 10 wt% (Pt/C) catalyst. For the N-G/MOF synthesis, N-G was mixed with zeolitic imidazolate framework-8 (ZIF-8) in a 1
6 mass ratio, nitrogen-doped graphene (N-G) was synthesized through the NHEW ball milling process. Successful doping of nitrogen (N) into graphene by this wet ball milling process was confirmed by our previous studies; the relationships between the grinding time and grinding speed with the nitrogen doping ratio and relative ratios of different nitrogen functional groups were determined and later utilized to achieve the best performing N-G catalyst.26 The N-G catalyst generated electrocatalytic current densities comparable to the standard 10 wt% (Pt/C) catalyst. For the N-G/MOF synthesis, N-G was mixed with zeolitic imidazolate framework-8 (ZIF-8) in a 1![[thin space (1/6-em)]](https://www.rsc.org/images/entities/char_2009.gif) :
:![[thin space (1/6-em)]](https://www.rsc.org/images/entities/char_2009.gif) 1 mass ratio; then the same NHEW ball milling process was applied. The best performing N-G/MOF catalyst was obtained in 16 hours of grinding time at 350 rpm grinding speed. The N-G/MOF catalyst generated higher current density than N-Gs which was very close to the 10% Pt/C catalyst.4,19–26,46 Extensive characterization of the N-G/MOF catalyst was reported previously. The N-G/MOF catalyst contained some impurities; primarily zirconia forms the grinding medium and a trace amount of Fe from the stainless-steel grinding jar. By a post-synthesis centrifugation process, comparatively heavier zirconia particles could be removed considerably. An acid wash of the catalysts was attempted to remove the Fe impurities; however, it had adverse effects on the catalytic activity of the material. Hence, the acid wash step was later dropped from the synthesis process.
1 mass ratio; then the same NHEW ball milling process was applied. The best performing N-G/MOF catalyst was obtained in 16 hours of grinding time at 350 rpm grinding speed. The N-G/MOF catalyst generated higher current density than N-Gs which was very close to the 10% Pt/C catalyst.4,19–26,46 Extensive characterization of the N-G/MOF catalyst was reported previously. The N-G/MOF catalyst contained some impurities; primarily zirconia forms the grinding medium and a trace amount of Fe from the stainless-steel grinding jar. By a post-synthesis centrifugation process, comparatively heavier zirconia particles could be removed considerably. An acid wash of the catalysts was attempted to remove the Fe impurities; however, it had adverse effects on the catalytic activity of the material. Hence, the acid wash step was later dropped from the synthesis process.
4.2 Hydrogen peroxide treatment
The synthesized N-G/MOF catalyst was chemically treated with different concentrations of H2O2. For evaluating the electrocatalytic performance changes and material degradation process of the catalyst, it is essential to keep the ex situ H2O2 treatment process similar to the operational environments of practical electrochemical systems. Sethuraman et al. conducted a study to determine H2O2 formation rates in a PEM fuel cell anode and cathode with a Pt/Vulcan catalyst during electrochemical operation. They suggested that the selectivity toward H2O2 for such catalysts is related to factors such as water activity (humidity) and temperature.62 Our previous studies with the graphene-based N-G/MOF catalyst showed that the H2O2 production from the electrochemical oxygen reduction reaction in alkaline electrolyte has a large dependency on the applied voltage on electrodes.36 Such observations suggest that the operational chemical environment and applied potentials dictate the production rate of H2O2 or H2O2-derived species and their residence time, correspondingly, their effects on the catalysts. Furthermore, it is important to realize that the electrocatalytic activity of graphene-based materials has some fundamental differences from the platinum-based ones due to the difference between their local electronic structures at the catalytically active sites. While platinum-based catalysts have good selectivity toward both 4-electron transfer and 2-electron transfer oxygen reduction reactions, reportedly, the graphene-based catalysts produce H2O2 at a higher rate through the 2-electron transfer reaction, especially at lower applied potentials. Considering these facts, we used four solutions of 0.01 M, 0.1 M, 0.5 M, and 1 M H2O2 to treat N-G/MOF samples, which are reasonable from the perspective of practical electrochemical systems. Also, a higher concentration of 5 M H2O2 solution was used to treat the catalyst. The higher H2O2 concentrations were chosen to gain some insight into extreme cases,63–66 as well as to clearly identify the trends in the electrochemical performance losses and material degradation (in terms of changes in different chemical bonds) caused by the effect of H2O2-derived species.Conducting an in situ investigation on the effects of H2O2, produced during the electrochemical operations, on graphene-based nano-catalysts is highly complicated.46 For such technical limitation, we chemically treated the N-G/MOF catalyst with different concentrations of H2O2ex situ, as it was confirmed that the same oxidative radicals can also be generated by the chemical decomposition of H2O2.4,30,31,67 Five samples of 80 mg of N-G/MOF catalyst powder were mixed with five concentrations of H2O2: 0.01 M, 0.1 M, 0.5 M, 1 M, and 5 M H2O2. A commercially available 30% H2O2 solution was used to prepare the 1 ml H2O2 solutions of the above-mentioned concentrations. The N-G/MOF samples in the H2O2 solutions were subjected to vortex mixing for two hours for the treatments. Application of external heat in this H2O2 treatment process was not required. Because of the unstable nature of H2O2 in the presence of catalyst material, it decomposed exothermically; the elevated temperature further intensified the decomposition process. Besides, in the presence of a trace amount of Fe impurity in the catalyst, highly oxidative radicals were expected to be produced in the reaction environment.67 After the H2O2 treatment, catalyst samples were dried out and stored for analysis.
4.3 Electrochemical performance evaluation method
The as-synthesized N-G/MOF and H2O2-treated N-G/MOF samples were tested for electrocatalytic activities in a three-electrode RDE system (RRDE-3A). Catalyst samples were loaded at 39.7 ± 0.5 μg cm−2 on the glassy carbon disk of the working electrode (GCt RRDE—WCO22, ALS Co. Ltd., Tokyo, Japan) by the drop casting method. In the drop casting process, the catalyst was dispersed in deionized (DI) water at a concentration of 5 mg per 16 mL and subjected to sonication for 30 minutes to achieve a uniform mixture. Subsequently, a 25 μL portion of the catalyst–DI water mixture was applied onto the mirror-polished surface of the electrode disk and allowed to dry in a vacuum oven at 70–80 °C for 20–25 minutes, forming a thin layer (drying out the catalyst–ID water mixture on the electrode surface at elevated temperature helps to reduce the coffee-ring type catalyst deposition).68 Images of the uncoated and coated surfaces of the working electrode are provided in the ESI† (Fig. S1). No binder substance was used over the catalyst coating as we intended to see the catalytic activity of the N-G/MOF samples without any influence from the binder. A standard Ag/AgCl (3 M NaCl internal solution) reference electrode and a coiled platinum wire (23 cm) counter electrode were used in this system. The applied potentials with vs. Ag/AgCl reference electrode were converted into applied potentials vs. the reversible hydrogen electrode (RHE) reference electrode. The linear sweep voltammetry (LSV) technique was employed to measure the current densities, generated by the electrochemical oxygen reduction reaction on the catalyst surface, in oxygen-saturated alkaline (0.1 M KOH) electrolyte. The applied potential for the tests was kept between 1.1 and 0 V vs. the RHE reference electrode. With each N-G/MOF sample, the LSV curves were obtained after 10–20 cyclic voltammetry (CV) sweeps to ensure stabilized dynamic electrochemical environments and fully activated catalytic actives. As the measurements of cathodic current densities by RDE systems may involve errors from a variety of sources, to minimize the experimental errors, the RDE tests with each of the N-G/MOF samples were entirely repeated multiple times (minimum of three times), keeping other experimental conditions unchanged. The cathodic current densities were shown as negative – the negative signs of the current densities only indicate the direction of current flow from ORR reactants to the working electrode (opposite to the electron flow).4.4 Elemental composition and chemical bonds evaluation method
To evaluate the change in the elemental ratios and relative ratios of the carbon, nitrogen, and oxygen bonds in the N-G/MOF due to H2O2 treatments, the samples were analyzed using an ultrahigh vacuum X-ray photoelectron spectroscopy (UHV-XPS) system with base pressures below 5 × 10⁻⁹ Torr equipped with a hemispherical electron energy analyzer (SPECS, PHOIBOS 100) and twin anode X-ray source (SPECS, XR50). Al Kα (1486.7 eV) radiation was used at 10 kV and 30 mA. The angle between the analyzer and X-ray source is 45° and photoelectrons were collected from the sample surface perpendicularly. The adventitious carbon located at 284.5 eV was used to calibrate the XPS peak positions. XPS data were analyzed using Casa XPS.4.5 Crystal structure evaluation method
X-ray diffraction (XRD) spectroscopy analyses of the samples were performed mainly to observe the changes in the crystal features of the N-G/MOF catalysts due to the H2O2 treatments. A multipurpose X-ray diffractometer (XRD) system (EMPYREAN, Philips) was utilized. A zero-background detraction holder of pure silicon (9 N) was used to load the samples so that the diffraction peaks can be reasonably attributed to the N-G/MOF and H2O2 treated N-G/MOF samples and crystal changes in the crystallinity could be estimated.4.6 Morphology evaluation method
To observe the morphological changes of the catalyst due to H2O2 treatments, scanning electron microscopy (SEM) images were taken for the as-synthesized and H2O2-treated N-G/MOF samples. These morphological changes are the visual manifestations of the chemical composition, bonds, and crystal structure changes in the N-G/MOF due to the oxidative attack of the H2O2-derived species indicated by XPS and XRD analyses. A JEOL JSM-7600F SEM system was used to obtain the submicron scale images of the samples.Author contributions
The manuscript was written through contributions of all authors. Niladri Talukder conducted the experiments, and prepared and wrote the manuscript. Yudong Wang assisted in conducting the experiments and preparing the manuscript, Bharath B. Nunna reviewed and provided suggestions for editing the manuscript, Xiao Tong assisted in obtaining and analyzing the XPS data and composed the corresponding methodology section, and J. Anibal Boscoboinik facilitated the XPS experiments and helped with suggestions for the manuscript. Eon S. Lee designed the experiments, supervised the research activities, ensured the theoretical soundness of the experiments, constructed, edited, and reviewed the manuscript, and provided suggestions for editing. All authors have given approval to this version of the manuscript.Conflicts of interest
There are no conflicts to declare.Acknowledgements
The authors acknowledge the research support from the Advanced Energy System and Microdevices (AESM) Laboratory at the New Jersey Institute of Technology (NJIT). This research used UHV-XPS and JEOL JSM-7600F SEM systems of Center for Functional Nanomaterials (CFN), which is a U.S. Department of Energy Office of Science User Facility, at Brookhaven National Laboratory under Contract No. DE-SC0012704. The authors also the acknowledge the support from the Materials Characterization Laboratory at Otto H. York Center for Environmental Engineering and Science (YCEES) at New Jersey Institute of Technology where some of the experiments (XRD, SEM) were conducted.References
- C. Lee, X. Wei, J. W. Kysar and J. Hone, Measurement of the elastic properties and intrinsic strength of monolayer graphene, Science, 2008, 321, 385–388 CrossRef CAS PubMed.
- A. A. Balandin, S. Ghosh, W. Bao, I. Calizo, D. Teweldebrhan, F. Miao and C. N. Lau, Superior thermal conductivity of single-layer graphene, Nano Lett., 2008, 8, 902–907 CrossRef CAS PubMed.
- K. S. Novoselov, A. K. Geim, S. V. Morozov, D. Jiang, Y. Zhang, S. V. Dubonos, I. V. Grigorieva and A. A. Firsov, Electric field effect in atomically thin carbon films, Science, 2004, 306, 666–669 CrossRef CAS PubMed.
- H. Singh, S. Zhuang, B. Ingis, B. B. Nunna and E. S. Lee, Carbon-based catalysts for oxygen reduction reaction: A review on degradation mechanisms, Carbon, 2019, 151, 160–174 CrossRef CAS.
- A. Ali, F. Liang, J. Zhu and P. K. Shen, The role of graphene in rechargeable lithium batteries: Synthesis, functionalisation, and perspectives, Nano Mater. Sci., 2022 DOI:10.1016/j.nanoms.2022.07.004 , in press.
- X. Chen and Y. Tian, Review of graphene in cathode materials for Lithium-Ion batteries, Energy Fuels, 2021, 35, 3572–3580 CrossRef CAS.
- M. D. Stoller, S. Park, Y. Zhu, J. An and R. S. Ruoff, Graphene-based ultracapacitors, Nano Lett., 2008, 8, 3498–3502 CrossRef CAS PubMed.
- M. F. El-Kady and R. B. Kaner, Scalable fabrication of high-power graphene micro-supercapacitors for flexible and on-chip energy storage, Nat. Commun., 2013, 4, 1475 CrossRef PubMed.
- A. Velasco, Y. K. Ryu, A. Boscá, A. Ladrón-de-Guevara, E. Hunt, J. Zuo, J. Pedrós, F. Calle and J. Martinez, Recent trends in graphene supercapacitors: From large area to microsupercapacitors, Sustainable Energy Fuels, 2021, 5, 1235–1254 RSC.
- C. Liu, Z. Yu, D. Neff, A. Zhamu and B. Z. Jang, Graphene-based supercapacitor with an ultrahigh energy density, Nano Lett., 2010, 10, 4863–4868 CrossRef CAS PubMed.
- D. Wei, Y. Liu, Y. Wang, H. Zhang, L. Huang and G. Yu, Synthesis of N-doped graphene by chemical vapor deposition and its electrical properties, Nano Lett., 2009, 9, 1752–1758 CrossRef CAS PubMed.
- K.-Q. Lu, Y.-H. Li, Z.-R. Tang and Y.-J. Xu, Roles of graphene oxide in heterogeneous photocatalysis, ACS Mater. Au, 2021, 1, 37–54 CrossRef CAS PubMed.
- X. An and J. C. Yu, Graphene-based photocatalytic composites, RSC Adv., 2011, 1, 1426–1434 RSC.
- D. Mandal, B. B. Nunna, S. Zhuang, S. Rakshit and E. S. Lee, Carbon nanotubes based biosensor for detection of cancer antigens (CA-125) under shear flow condition, Nano-Struct. Nano-Objects, 2018, 15, 180–185 CrossRef CAS.
- J. Li, X. Li, P. Zhao, D. Y. Lei, W. Li, J. Bai, Z. Ren and X. Xu, Searching for magnetism in pyrrolic N-doped graphene synthesized via hydrothermal reaction, Carbon, 2015, 84, 460–468 CrossRef CAS.
- P. Ranjan, A. Sattar, M. Benkraouda, S. Garaj, N. Amrane and E.-H. S. Sadki, Graphene for next generation magnetic devices: A first-principles study, 2021 6th International Conference on Renewable Energy: Generation and Applications (ICREGA), Al Ain, United Arab Emirates, 2021, pp. 199–204 Search PubMed.
- J. Zhang, Y. Tan and W.-J. Song, Zeolitic imidazolate frameworks for use in electrochemical and optical chemical sensing and biosensing: A review, Microchim. Acta, 2020, 187, 234 CrossRef CAS PubMed.
- R. Banerjee, A. Phan, B. Wang, C. Knobler, H. Furukawa, M. O'Keeffe and O. M. Yaghi, High-throughput synthesis of zeolitic imidazolate frameworks and application to CO2 capture, Science, 2008, 319, 939–943 CrossRef CAS PubMed.
- E. S. Lee, S. Zhuang, B. B. Nunna and L. Lei, Synthesis of nitrogen-doped graphene catalyst by wet-ball milling for electrochemical systems, 251st ACS National Meeting & Exposition, March 13–17, San Diego, California, 2016 Search PubMed.
- S. Zhuang, H. Singh, B. B. Nunna, D. Mandal, J. A. Boscoboinik and E. S. Lee, Nitrogen-doped graphene-based catalyst with metal-reduced organic framework: Chemical analysis and structure control, Carbon, 2018, 139, 933–944 CrossRef CAS.
- S. Zhuang, B. B. Nunna and E. S. Lee, Metal organic framework-modified nitrogen-doped graphene oxygen reduction reaction catalyst synthesized by nanoscale high-energy wet ball-milling structural and electrochemical characterization, MRS Commun., 2018, 8, 40–48 CrossRef CAS.
- H. Singh, S. Zhuang, B. B. Nunna and E. S. Lee, Morphology and chemical structure of modified nitrogen-doped graphene for highly active oxygen reduction reactions, 48th Power source conference, June 11th–14th, Denver, CO, 2018 Search PubMed.
- S. Zhuang, L. Lei, B. Nunna and E. S. Lee, New nitrogen-doped graphene/MOF-modified catalyst for fuel cell systems, ECS Trans., 2016, 72, 149 CrossRef CAS.
- H. Singh, S. Zhuang, B. B. Nunna and E. S. Lee, Thermal stability and potential cycling durability of nitrogen-doped graphene modified by metal-organic framework for oxygen reduction reactions, Catalysts, 2018, 8, 607 CrossRef.
- S. Zhuang, B. B. Nunna, D. Mandal and E. S. Lee, A review of nitrogen-doped graphene catalysts for proton exchange membrane fuel cells-synthesis, characterization, and improvement, Nano-Struct. Nano-Objects, 2018, 15, 140–152 CrossRef CAS.
- S. Zhuang, B. B. Nunna, J. A. Boscoboinik and E. S. Lee, Nitrogen-doped graphene catalysts: High energy wet ball milling synthesis and characterizations of functional groups and particle size variation with time and speed, Int. J. Energy Res., 2017, 41, 2535–2554 CrossRef CAS.
- S. Zhuang, E. S. Lee, L. Lei, B. B. Nunna, L. Kuang and W. Zhang, Synthesis of nitrogen-doped graphene catalyst by high-energy wet ball milling for electrochemical systems, Int. J. Energy Res., 2016, 40, 2136–2149 CrossRef CAS.
- R. Ma, G. Lin, Y. Zhou, Q. Liu, T. Zhang, G. Shan, M. Yang and J. Wang, A review of oxygen reduction mechanisms for metal-free carbon-based electrocatalysts, npj Comput. Mater., 2019, 5, 1–15 CrossRef CAS.
- Y. Sun, I. Sinev, W. Ju, A. Bergmann, S. Dresp, S. Kühl, C. Spöri, H. Schmies, H. Wang, D. Bernsmeier, B. Paul, R. Schmack, R. Kraehnert, B. Roldan Cuenya and P. Strasser, Efficient electrochemical hydrogen peroxide production from molecular oxygen on nitrogen-doped mesoporous carbon catalysts, ACS Catal., 2018, 8, 2844–2856 CrossRef CAS.
- B. Mlasi, D. Glasser and D. Hildebrandt, Kinetics of the decomposition of hydrogen peroxide in acidic copper sulfate solutions, Ind. Eng. Chem. Res., 2015, 54, 5589–5597 CrossRef CAS.
- T. Tatsuoka and N. Koga, Energy diagram for the catalytic decomposition of hydrogen peroxide, J. Chem. Educ., 2013, 90, 633–636 CrossRef CAS.
- G. Shi, D. A. Tryk, T. Iwataki, H. Yano, M. Uchida, A. Iiyama and H. Uchida, Unparalleled mitigation of membrane degradation in fuel cells via a counter-intuitive approach: Suppression of H2O2 production at the hydrogen anode using a Ptskin–PtCo catalyst, J. Mater. Chem. A, 2020, 8, 1091–1094 RSC.
- R. Zhou, Y. Zheng, M. Jaroniec and S.-Z. Qiao, Determination of the electron transfer number for the oxygen reduction reaction: From theory to experiment, ACS Catal., 2016, 6, 4720–4728 CrossRef CAS.
- G. Jürmann and K. Tammeveski, Electroreduction of oxygen on multi-walled carbon nanotubes modified highly oriented pyrolytic graphite electrodes in alkaline solution, J. Electroanal. Chem., 2006, 597, 119–126 CrossRef.
- M. Zhang, Y. Yan, K. Gong, L. Mao, Z. Guo and Y. Chen, Electrostatic layer-by-layer assembled carbon nanotube multilayer film and Its electrocatalytic activity for O2 reduction, Langmuir, 2004, 20, 8781–8785 CrossRef CAS PubMed.
- N. Talukder, Y. Wang, B. B. Nunna and E. S. Lee, An in-depth exploration of the electrochemical oxygen reduction reaction (ORR) phenomenon on carbon-based catalysts in alkaline and acidic mediums, Catalysts, 2022, 12(7), 791 CrossRef CAS.
- H. Bai, W. Jiang, G. P. Kotchey, W. A. Saidi, B. J. Bythell, J. M. Jarvis, A. G. Marshall, R. A. S. Robinson and A. Star, Insight into the mechanism of graphene oxide degradation via the photo-Fenton reaction, J. Phys. Chem. C, 2014, 118, 10519–10529 CrossRef CAS PubMed.
- H. Schulenburg, S. Stankov, V. Schünemann, J. Radnik, I. Dorbandt, S. Fiechter, P. Bogdanoff and H. Tributsch, Catalysts for the oxygen reduction from heat-treated iron (III) tetramethoxyphenylporphyrin chloride: Structure and stability of active sites, J. Phys. Chem. B, 2003, 107, 9034–9041 CrossRef CAS.
- J. H. Zagal, F. BediouiJ and J.-P. Dodelet, N4-macrocyclic metal complexes, Springer, 2006 Search PubMed.
- L. Gubler, S. M. Dockheer and W. H. Koppenol, Radical (HO˙, H˙ and HOO˙) formation and ionomer degradation in polymer electrolyte fuel cells, J. Electrochem. Soc., 2011, 158, B755 CrossRef CAS.
- M. Lefèvre and J.-P. Dodelet, Fe-based catalysts for the reduction of oxygen in polymer electrolyte membrane fuel cell conditions: Determination of the amount of peroxide released during electroreduction and its influence on the stability of the catalysts, Electrochim. Acta, 2003, 48, 2749–2760 CrossRef.
- G. Wu, K. Artyushkova, M. Ferrandon, A. J. Kropf, D. Myers and P. Zelenay, Performance durability of polyaniline-derived non-precious cthode catalysts, ECS Trans., 2009, 25, 1299 CrossRef CAS.
- V. Goellner, V. Armel, A. Zitolo, E. Fonda and F. Jaouen, Degradation by hydrogen peroxide of metal-nitrogen-carbon catalysts for oxygen reduction, J. Electrochem. Soc., 2015, 162, H403 CrossRef CAS.
- W. Xing, G. Lalwani, I. Rusakova and B. Sitharaman, Degradation of graphene by hydrogen peroxide, Part. Part. Syst. Charact., 2014, 31, 745–750 CrossRef CAS.
- A. J. Bard, L. R. Faulkner and H. S. White, Electrochemical methods: Fundamentals and applications, John Wiley & Sons, 2022 Search PubMed.
- N. Talukder, Y. Wang, B. B. Nunna and E. S. Lee, Nitrogen-doped graphene nanomaterials for electrochemical catalysis/reactions: A review on chemical structures and stability, Carbon, 2021, 185, 198–214 CrossRef CAS.
- Y. Xu, C.-Y. Chen, Z. Zhao, Z. Lin, C. Lee, X. Xu, C. Wang, Y. Huang, M. I. Shakir and X. Duan, Solution processable holey graphene oxide and its derived macrostructures for high-performance supercapacitors, Nano Lett., 2015, 15, 4605–4610 CrossRef CAS PubMed.
- H. Zhang, M. Zhao, Y. Yang and Y. S. Lin, Hydrolysis and condensation of ZIF-8 in water, Microporous Mesoporous Mater., 2019, 288, 109568 CrossRef CAS.
- M. Taheri and T. Tsuzuki, Photo-accelerated hydrolysis of metal organic framework ZIF-8, ACS Mater. Lett., 2021, 3, 255–260 CrossRef CAS.
- K. S. Rao, J. Senthilnathan, Y.-F. Liu and M. Yoshimura, Role of peroxide ions in formation of graphene nanosheets by electrochemical exfoliation of graphite, Sci. Rep., 2014, 4, 4237 CrossRef PubMed.
- R. Kurapati, S. P. Mukherjee, C. Martín, G. Bepete, E. Vázquez, A. Pénicaud, B. Fadeel and A. Bianco, Degradation of single-layer and few-Layer graphene by neutrophil myeloperoxidase, Angew. Chem., Int. Ed., 2018, 57, 11722–11727 CrossRef CAS PubMed.
- O. Naumov, S. Naumov, B. Abel and A. Varga, The stability limits of highly active nitrogen doped carbon ORR nano-catalysts: A mechanistic study of degradation reactions, Nanoscale, 2018, 10, 6724–6733 RSC.
- W. Gao, L. B. Alemany, L. Ci and P. M. Ajayan, New insights into the structure and reduction of graphite oxide, Nat. Chem., 2009, 1, 403–408 CrossRef CAS PubMed.
- M. Bergaoui, M. Khalfaoui, A. Awadallah-F and S. Al-Muhtaseb, A review of the features and applications of ZIF-8 and its derivatives for separating CO2 and isomers of C3- and C4- hydrocarbons, J. Nat. Gas Sci. Eng., 2021, 96, 104289 CrossRef CAS.
- D. Saliba, M. Ammar, M. Rammal, M. Al-Ghoul and M. Hmadeh, Crystal growth of ZIF-8, ZIF-67, and their mixed-metal derivatives, J. Am. Chem. Soc., 2018, 140, 1812–1823 CrossRef CAS PubMed.
- F. T. Johra, J.-W. Lee and W.-G. Jung, Facile and safe graphene preparation on solution based platform, J. Ind. Eng. Chem., 2014, 20, 2883–2887 CrossRef CAS.
- W. Xue, Q. Zhou, F. Li and B. S. Ondon, Zeolitic imidazolate framework-8 (ZIF-8) as robust catalyst for oxygen reduction reaction in microbial fuel cells, J. Power Sources, 2019, 423, 9–17 CrossRef CAS.
- S. E. Lowe, G. Shi, Y. Zhang, J. Qin, S. Wang, A. Uijtendaal, J. Sun, L. Jiang, S. Jiang, D. Qi, M. Al-Mamun, P. Liu, Y. L. Zhong and H. Zhao, Scalable production of graphene oxide using a 3D-printed packed-bed electrochemical reactor with a boron-doped diamond electrode, ACS Appl. Nano Mater., 2019, 2, 867–878 CrossRef CAS.
- L. D. Yao, F. Y. Li, J. X. Li, C. Q. Jin and R. C. Yu, Study of the products of melamine (C3N6H6) treated at high pressure and high temperature, Phys. Status Solidi A, 2005, 202, 2679–2685 CrossRef CAS.
- H. Khan, A. S. Yerramilli, A. D'Oliveira, T. L. Alford, D. C. Boffito and G. S. Patience, Experimental methods in chemical engineering: X-ray diffraction spectroscopy—XRD, Can. J. Chem. Eng., 2020, 98, 1255–1266 CrossRef CAS.
- S. van Cleuvenbergen, Z. J. Smith, O. Deschaume, C. Bartic, S. Wachsmann-Hogiu, T. Verbiest and M. A. van der Veen, Morphology and structure of ZIF-8 during crystallisation measured by dynamic angle-resolved second harmonic scattering, Nat. Commun., 2018, 9, 3418 CrossRef PubMed.
- V. A. Sethuraman, J. W. Weidner, A. T. Haug, S. Motupally and L. V. Protsailo, Hydrogen peroxide formation rates in a PEMFC anode and cathode: Effect of humidity and temperature, J. Electrochem. Soc., 2007, 155, B50 CrossRef.
- R. E. Post, Effects of temperature and electrolyte concentration on performance of a fuel cell of the Bacon type, Cleveland, Ohio, 1969 Search PubMed.
- P. L. Ng, A. Jamaludin, Y. Alias, W. J. Basirun, Z. A. Ahmad and A. A. Mohamad, Effect of KOH concentration in the gel polymer electrolyte for direct borohydride fuel cell, J. Appl. Polym. Sci., 2012, 123, 2662–2666 CrossRef CAS.
- L. Guanghua, Z. Ke, A. M. Mohammed, Z. Rui and L. Lixu, Effect of electrolyte concentration and depth of discharge for zinc-air fuel cell, Int. J. Electrochem. Sci., 2015, 10, 6672–6683 CrossRef.
- P. J. Marques Cordeiro-Junior, C. Sáez Jiménez, M. R. de Vasconcelos Lanza and M. A. Rodrigo Rodrigo, Electrochemical production of extremely high concentrations of hydrogen peroxide in discontinuous processes, Sep. Purif. Technol., 2022, 300, 121847 CrossRef CAS.
- P. Pędziwiatr, F. Mikołajczyk, D. Zawadzki, K. Mikołajczyk and A. Bedka, Decomposition of hydrogen peroxide - kinetics and review of chosen catalysts, Acta Innov., 2018, 26, 45–52 Search PubMed.
- Y. Li, C. Lv, Z. Li, D. Quéré and Q. Zheng, From coffee rings to coffee eyes, Soft Matter, 2015, 11, 4669–4673 RSC.
Footnote |
| † Electronic supplementary information (ESI) available. See DOI: https://doi.org/10.1039/d3im00044c |
| This journal is © Institute of Process Engineering of CAS 2023 |

