 Open Access Article
Creative Commons Attribution 3.0 Unported Licence
Nanoscale probing of local dielectric changes at the interface between solids and aqueous saline solutions
William
Trewby
 and
Kislon
Voïtchovsky
 *
*
Physics Department, Durham University, Durham DH1 3LE, UK. E-mail: kislon.voitchovsky@durham.ac.uk
First published on 27th February 2023
Abstract
The mobility of dissolved ions and charged molecules at interfaces underpins countless processes in science and technology. Experimentally, this is typically measured from the averaged response of the charges to an electrical potential. High-resolution Atomic Force Microscopy (AFM) can image single adsorbed ions and molecules at solid–liquid interfaces, but probing the associated dynamics remains highly challenging. One possible strategy is to investigate the response of the species of interest to a highly localized AC electric field in an approach analogous to dielectric spectroscopy. The dielectric force experienced by the AFM tip apex is modulated by the dielectric properties of the sample probed, itself sensitive to the mobilities of solvated charges and dipoles. Previous work successfully used this approach to quantify the dielectric constant of thin samples, but with limited spatial resolution. Here we propose a strategy to simultaneously map the nanoscale topography and local dielectric variations across a range of interfaces by conducting high-resolution AFM imaging concomitantly with electrical AC measurements in a multifrequency approach. The strategy is tested over a 500 MHz bandwidth in pure liquids with different dielectric constants and in saline aqueous solutions. In liquids with higher dielectric constants, the system behaves as inductive–resistive–capacitive but the adjunction of ions removes the inductive resonances and precludes measurements at higher frequencies. High-resolution imaging is demonstrated over single graphene oxide (GrO) flakes with simultaneous but decoupled dielectric measurements. The dielectric constant is consistent and reproducible across liquids, except at higher salt concentrations where frequency-dependent effects occur. The results suggest the strategy is suitable for nanometre-level mapping of the dielectric properties of solid–liquid interfaces, but more work is needed to fully understand the different physical effects underpinning the measurements.
1. Introduction
The dynamics of ions and charged molecules at solid–liquid interfaces is central to numerous phenomena in science and technology. Examples span from charge transfer along biological membranes1–3 to electrochemical processes4,5 and energy storage,6 the growth of minerals,7–9 nanofluidics10,11 and lubrication.12,13Experimentally, deriving quantitative information about the motion of charges at and along interfaces can often be challenging. Firstly, solid–liquid interfaces are intrinsically nanoscale objects. In close vicinity to the solid, liquid molecules tend to be more ordered and less mobile than their bulk counterpart due to a combination of direct interactions with the solid and reduced configurational entropy.14–16 Ions located in this interfacial liquid often present different dynamics than in the bulk liquid,12,17–19 but the interface is typically only a few molecular diameters thick and vanishes rapidly into bulk liquid.20,21 Measurements therefore need to be specifically sensitive to the interface, and often rely on techniques such as X-ray diffraction18,20,22 or nonlinear spectroscopies.23,24
Secondly any nanoscale structure or chemical heterogeneity of the solid’s surface can dramatically affect the local molecular dynamics. This last point is exemplified by the enhanced activity of specific sites in solid–liquid heterogeneous catalysis.25,26 As a result, any experimental approach relying on spatial averaging is likely to miss out important information.
Local probe techniques such as atomic force microscopy (AFM) can sense and image the details of solid–liquid interfaces with molecular-level precision,17,27–29 including single adsorbed ions and molecules.17,30–33 However, most AFM measurements are temporally limited by the mechanical response of the probe. High-speed AFM measurements can reach a temporal resolution of micro- to milliseconds34–36 with most measurements still taking tens of seconds.7,13,19,37 In contrast, computer simulations30,38–40 and estimates from the bulk diffusion coefficient41,42 suggest residence times and interfacial dynamics on the scale of nanoseconds for ions and moving molecules. This significant temporal gap with existing AFM capabilities cannot be solved by brute force since it would require mechanical parts moving at hundreds of MHz in a controlled manner.
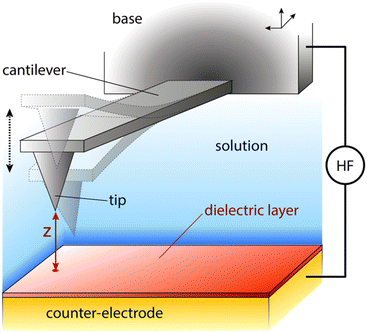
One possible way forward is to keep the high spatial resolution of AFM but invert the measurement paradigm. Instead of the tip moving faster than the ion or molecule it aims to track, it could be used to sense the response of these ions and molecules to a highly localised AC electric field. This can be achieved by broadcasting the field with a conducting AFM probe, exploiting the enhancement of the field at the sharp tip apex of the probe43 and using a suitable range of frequencies to explore the desired process such as the ion’s translational motion. The idea is analogous to dielectric spectroscopy,44 albeit when run in the sub-GHz regime. Practically, it is not the motion of individual charges or molecules that is directly probed, but rather the resulting effect it has on the dielectric force experienced by the tip (Fig. 1). This force is sensitive to the dielectric properties through which the field propagates as well as the mobility of the ions and charges in the medium.45 The idea of using AFM to conduct such measurements is not new,46 with the potential of the approach first demonstrated in aqueous solutions over silicon oxide samples47 and biological membranes,48 branding the technique ‘dielectric force microscopy’. More recently, the group of Gabriel Gomila adapted and refined the technique,49–53 and developed a quantitative model to extract the local dielectric constant of a given sample.51 The model is similar to that developed for biosensing with MEMS54,55 and it also works in dilute ionic solution. In a typical dielectric force microscopy experiment, an AC potential is applied between the AFM conducting tip and a counter-electrode located underneath the sample. The resulting dielectric force has a capacitive origin and can be derived from a general expression valid for most electrical measurements with AFM:56
 | (1) |
When conducting frequency-dependent electrical measurements in liquid electrolytes, the solution is often assumed to behave as a resistor–capacitor (RC) circuit. Based on this assumption, Gomila derived an explicit expression linking the model parameters to a force measurable with AFM.51 The experimental strategy entails modulating the high-frequency electrical voltage (frequency fH) that induces the dielectric force with a signal at a lower modulation frequency fM ≪ fH that is measurable by the AFM: the magnitude of the dielectric force is simply the probe’s amplitude at 2fM. If fM is chosen well below the mechanical resonance of the probe, then the dielectric force |F(z,fH)|fM measured is given by:51
 | (2) |
To apply this technique to solid–liquid interfaces, it is necessary to overcome two obvious challenges. First, electrical forces measurements need to be decoupled from the other short range ‘atomic forces’ responsible for the image formation in AFM. Second the interface can no longer be seen as a simple, homogeneous capacitor formed by the electrical double layer. The measuring tip disturbs the double layer in a locally sensitive manner, something difficult to account for in a model.
In this paper a strategy is proposed and tested to tackle the first challenge: decoupling electrical and mechanical forces to enable high spatial resolution of the dielectric measurements at the interface. The results are discussed in terms of the interfacial dielectric constant of the liquid and ion mobilities, but more work is needed to derive a quantitative handle on the data interpretation.
2. Experimental
2.1 Experimental setup
The measurements were conducted with a Cypher ES microscope (Asylum Research, Oxford Instruments, Santa Barbara, US) equipped with photothermal excitation (BlueDrive) and temperature control. Electrical contact to the conducting probe was achieved through a micro-SMA coaxial cable directly touching the chip to which the cantilever is attached (base in Fig. 1). To limit possible unwanted electrochemical effects, the probe/contact was held in place with a custom-made insulating PEEK clip. All the electrical measurements were made using a high-frequency arbitrary wave functions generator (HDAWG, Zurich Instruments) working in conjunction with an external lock-in amplifier (MFIA, Zurich Instruments). The high-frequency voltage applied to the AFM probe is connected through a high quality 1 m SMA cable. All the other electrical connections are achieved through standard coaxial cables. Control and modulation of the high-frequency voltage was achieved through a bespoke software created in Python and communicating directly with the HDAWG through an API. The MFIA output was recorded as additional data channels in the Cypher acquisition software.2.2 Measurement procedure
The basic strategy adopted for the measurements is similar to that developed by the group of Gomila.49–51 The amplitude AD of the probe’s modulated deflection from the dielectric force (Fig. 1) is measured using the external lock-in amplifier which also quantifies the associated phase φD. The magnitude of AD is proportional to the dielectric force. In this paper, φD is measured but not shown since it remains constant unless the system is driven away from ideal experimental conditions. Four types of measurements are conducted, all with the probe fully immersed in the liquid: dielectric force spectroscopy, frequency sweeps, interface imaging and lift mode imaging.Force spectroscopy examines the dependence of AD and φD on the tip–surface distance z at a given location. This is achieved by extending/retracting the base of the probe (Fig. 1) towards/away from the sample at a given location of the sample.
Frequency sweeps quantify the dependence of AD and φD on fH at a set location and distance from the solid’s surface.
Interface imaging entails high-resolution imaging of the interface in amplitude modulation AFM while simultaneously probing the dielectric force experienced by the tip. The amplitude modulation imaging is conducted at the first resonance (flexural eigenmode) of the probe which is driven by photothermal actuation. The measurements of AD and φD are conducted with fM usually chosen so that detection at 2fM matches the frequency of the probe’s second flexural eigenmode to improve the signal to noise.
Lift mode imaging complements interface imaging and operates in a similar manner: during a raster scanning of the interface, each line is repeated but with the tip lifted at a set distance z above the sample, faithfully following the local topographic profile to keep the tip–sample distance always the same. This effectively provides an interfacial image together with a map of all the experimental parameters (including AD and φD) at a set distance from the surface.
Before each experiment, the probe, the holder/clip and the substrate were sequentially cleaned with isopropanol and ultrapure water (18.2 MΩ, Merck Millipore, Gillingham, UK) and allowed to dry protected from dust. The temperature of the sample was kept at 25.0 ± 0.1 °C for all measurements except in hexadecane where the temperature was set to 35.0 ± 0.1 °C to ensure no solidification of the liquid at the interface.
2.3 Materials
AFM probes were purchased from different sources depending on the purpose of the measurements. Solid platinum iridium probes (25PtIr300B) with a nominal stiffness of k = 22 N m−1 and resonance frequency of fres = 21 kHz in air were obtained from Rocky Mountain Nanotechnology (Bountiful, USA) to test and characterise the setup. While not ideal for high-resolution measurements, the probes offer two advantages: (i) being made of solid metal, potential measurements artefacts from e.g. trapped charges can be discounted. (ii) The vertical part of the probe immediately above the tip is particularly long (80 μm), hence limiting the impact of the cantilever itself on electrical measurements. Single crystal doped diamond probes (Apex Super Sharp, k = 2.8 N m−1, fres = 75 kHz) were sourced from Adama Innovations (Dublin, Ireland) for interface imaging and lift mode measurements.Substrates are made of a conducting material protected by a thin insulating layer. Here we used highly conductive p-doped silicon wafers (Inseto, Andover, UK) with the insulating layer formed by the native oxide naturally developing on the surface when the silicon is exposed to ambient atmosphere (typically 2–10 nm). The use of wafers ensures a substrate as flat as possible to deposit any sample of interest.
Chemicals and liquids were purchased from Sigma-Aldrich (Merck Millipore, Gillingham, UK) and used without further purification. The graphene oxide (GrO) was diluted to 0.1 mg ml−1 and deposited as a drop (30 μL) on the silica substrate and left to dry at 70 °C for 20 min before immersion in the liquid of interest for measurement. Ionic solutions were prepared from pure salts (99.9%) and ultrapure water. Table 1 lists the different liquids and solutions used in this study together with their respective static dielectric constant at 25 °C.
| Liquid/solution | Dielectric constant |
|---|---|
| a The dielectric constant of organic liquids can vary significantly with frequency, something not taken into consideration here. See e.g. ref. 58. b Calculated from ref. 59. The variations are mostly negligible for the purpose of this study. | |
| n-Hexadecane | 2.05a (ref. 42) |
| 1-Octanol | 10.3a (ref. 42) |
| Isopropanol (IPA) | 19.92a (ref. 42) |
| Dimethyl sulfoxide (DMSO) | 46.68 (ref. 42) |
| Ultrapure water (UP) | 78.4 (ref. 42) |
| 1 mM KCl solution | 78.38b |
| 10 mM KCl solution | 78.2b |
| 50 mM KCl solution | 77.4b |
| 100 mM KCl solution | 76.4b |
2.4 Data analysis
The Cypher ES acquires data in the Igor Pro software environment (Wavemetrics, Lake Oswego, USA). All the spectroscopy and chirp data were analysed using bespoke routines programmed in Igor Pro. This includes correction for positional drift over long acquisitions and data averaging wherever relevant. Image analysis was done through a combination of the tools available in Cypher software, home-made software programmed in Igor Pro and WsXM.603. Results and discussion
Achieving nanoscale dielectric measurements in solution with AFM becomes increasingly challenging for higher frequencies. To disentangle experimental limitations from fundamental limitations, the setup is first characterised in close to ideal conditions before measurements are conducted in progressively more challenging but relevant conditions.3.1 Characterisation of the setup in a near-ideal liquid
To test the capabilities of the setup and characterise its high-frequency (fH) bandwidth, measurements were conducted with solid PtIr tips in hexadecane. The low dielectric constant of hexadecane and the fact that it is composed of simple alkanes should minimally impact the propagation of the electric field over the range of accessible frequencies (fH ∼ 0–500 MHz). The result of a frequency sweep is shown in Fig. 2. The response of the setup highlights many local maxima and minima that deviate from the ideal behaviour predicted from eqn (2). This is, to some extent, expected due to the natural imperfections of the system from the capacitance of electrical connections to variations in the shape and geometry of the tip. Another important feature is the loss of dielectric signal beyond fH ∼ 350 MHz. This is also expected; the AFM probe is not shielded electrically and hence acts as a broadcasting nano-antenna. Without suitable shielding (see e.g. scanning microwave impedance microscopy61,62) the tip has a limited bandwidth and the transmission of the electrical signal is expected to progressively cut off beyond a certain frequency. The specific details of this cut-off depend on the specific details of the setup and probe, but measurements such as those presented in Fig. 2 can act as an effective calibration, with the experimental curve representing the system’s transfer function. Here this is done by fitting the experimental data with a reverse sigmoidal function to determine the idealised cut-off (Fig. 2) and subsequently defining the ratio of the idealised cut-off with the experimental data as the setup’s transfer function.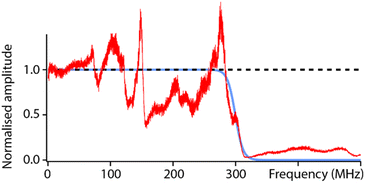 | ||
| Fig. 2 Characterisation of the setup’s capabilities in hexadecane. The ideal dielectric amplitude as predicted from eqn (2) should be independent of the applied frequency (black dashed line). In reality, a cut off is expected at higher frequencies due to hardware limitations and transmission loss in the probe (blue curve), here obtained by fitting the experimental data with a sigmoid-type transition. The measured dielectric amplitude (red) does not behave ideally; it exhibits many frequency-dependent variations compared to the prediction (blue) due to setup imperfections (connections, tip shape, etc.). However, this experimental measurement can be used as a calibration curve for the setup. All the curves are normalised to their value at DC to aid visualisation. The experimental measurement is taken with a solid PtIr cantilever and tip. | ||
3.2 Sensing at the second vibration eigenmode of the probe
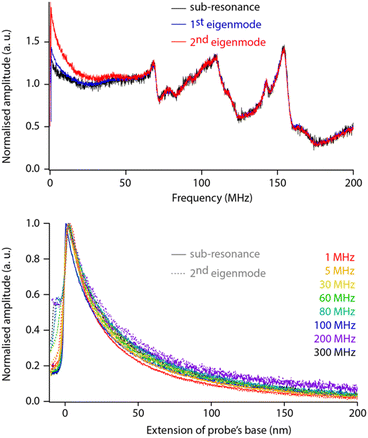
In order to quantify the net effect of the dielectric force on the probe, a modulation of the high frequency voltage is usually applied (see Section 2.2). In previous work, the modulation frequency fM is taken well below the natural flexural resonance of the probe where the dielectric force is simply |F(z,fH)|fM = kAD. While ideal for spectroscopy measurements, the approach is not suitable for work at the interface since any mechanical interaction of the tip with the interface would impact the dielectric measurement. A new strategy is needed where dielectric and mechanical (imaging) forces can be measured simultaneously but independently and with minimal crosstalk. Here we propose using the second flexural eigenmode of the probe to carry-out the dielectric sensing, by choosing fM so that the detection frequency 2fM coincides with the probe’s second eigenfrequency. This strategy has two advantages. First, working at an eigenfrequency of the probe can significantly enhance the sensitivity of the setup, something routinely exploited for high-resolution AFM imaging.63,64 Second, this leaves the first eigenmode of the cantilever free precisely for high-resolution imaging that can be carried out simultaneously. In principle, crosstalk between eigenmodes can occur,65,66 especially if the tip experiences non-linear interactions at the interface. However, because the effective stiffness of the first eigenmode is considerably lower than that of the second eigenmode, a given non-linear interaction will tend to affect the first eigenmode significantly more. This well-known fact is illustrated in Fig. 3: the first eigenmode is stimulated photo-thermally while the second eigenmode is simultaneously stimulated by the (modulated) dielectric force. As the tip approaches the surface of the immersed solid, the amplitude of the first eigenmode is damped by ∼30% before any effect is visible on that of the second eigenmode. The principle can be exploited to image the interface with the first eigenmode if gentle conditions are applied (setpoint > 70%).28,64 In such a case, the impact of the imaging on the dielectric force measured with the second eigenmode is minimal and can be neglected in first approximation.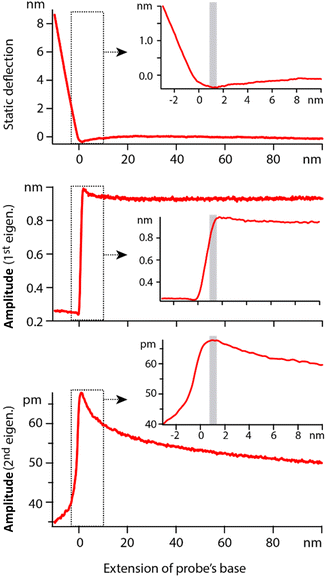 | ||
| Fig. 3 Example of spectroscopy measurement taken in hexadecane. The extension of the base can be understood as the tip–sample average distance for values >0. The static deflection of the probe is used to determine the tip–sample point of contact, arbitrarily set as zero on the horizontal axis. Simultaneously, the cantilever is driven at its 1st eigenmode by photothermal excitation, and at its 2nd eigenmode by adjusting the modulation of the dielectric frequency. Far from the interface, the 1st eigenmode amplitude is constant and the 2nd eigenmode amplitude behaves as predicted by eqn (2). In vicinity of the interface (<10 nm), the 1st eigenmode amplitude initially increases due to attractive surface forces and then rapidly decreases as it enters the interface (inset). The 2nd eigenmode amplitude remains unaffected until after the 1st eigenmode amplitude has begun its decrease. In typical gentle imaging conditions (setpoint > 0.7), the operating range corresponds to the region highlighted in grey in the insets. The dielectric measurement is minimally affected by the imaging process at the 1st eigenmode. The measurements are taken with an Adama tip in hexadecane, with each curve representing an average over >20 individual curves acquired at fH = 100 MHz. | ||
While helpful for enhancing resolution, sensing the dielectric force with the second eigenmode of the probe adds complexity to the data interpretation because the amplification offered by the eigenmode must be considered and properly calibrated. To test whether this can be achieved easily, we comparatively conducted sweeps and force spectroscopy measurements over a range of dielectric frequencies with fM set for detection (i) well below the first eigenfrequency (sub-resonance), (ii) at the first eigenfrequency, and (iii) at the second eigenfrequency. The measurements are taken on the same sample, with the same tip and in immediate succession to ensure comparability (Fig. 4).
The comparison reveals little difference between each sensing strategy except at lower dielectric frequencies (fH < 30 MHz). These differences do not seem to affect the overall response of the setup, and direct spectroscopic measurements at a given fH show no shape differences between curves acquired at sub-resonance or at the second eigenfrequency (within error, Fig. 4 bottom). Obviously, the comparison holds for the non-contact region of the curves with mechanical damping at the interface being mode-dependent: damping of the sub-resonance vibration is much sharper than that of the second eigenmode. This validates the strategy of modulating for detection at the second eigenmode of the probe. The strategy is therefore adopted for the rest of the paper, unless specified otherwise.
The normalised spectroscopy curves appear almost independent of fH, apart perhaps for extremes (1 MHz vs. 300 MHz, Fig. 4 bottom). Dependence on fH is expected for liquids with a relatively high dielectric constant where higher frequencies tend to focus the field lines to the tip apex.49,51 In hexadecane, the system behaves close to ideally.
3.3 Impact of the liquid’s dielectric constant
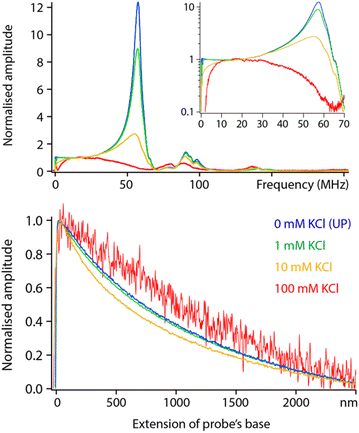
Before exploring saline solutions, we tested pure liquids with increasing values of static dielectric constant with frequency sweeps (Fig. 5, top). To allow for direct comparison, the curves have been corrected by the setup transfer function (see Section 3.1) and normalised by their amplitude close to DC.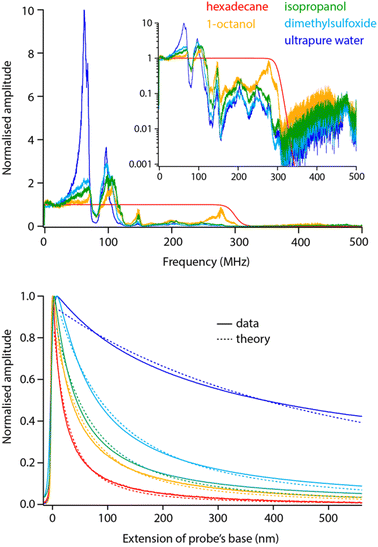 | ||
| Fig. 5 Frequency sweeps and spectroscopy measurements comparatively acquired in pure liquids with increasing dielectric constant. All the sweeps have been corrected with the transfer function obtained in Fig. 2 and normalised to their amplitude at DC to help comparison. Clear dielectric resonances appear around fH ∼ 50 MHz and fH ∼ 100 MHz. The inset presents the same data in log scale, highlighting a progressive cut off at higher frequencies. The spectroscopy curves (bottom) were acquired with fH set to 50 MHz and using the same tip as for the sweeps (solid lines). The normalised curves were fitted with eqn (2) (dashed lines), imposing the dielectric constant of the liquid and the same oxide thickness in all cases (yielding an effective thickness of ∼10 nm). The spectroscopy curves represent an average of over >10 individual curves normalised at their maximum value. All the data is acquired with the modulation set for detection at the 2nd flexural eigenmode of the probe. The extension of the base can be understood as the tip–sample average distance for values >0. | ||
Increasing the dielectric constant of the liquid has two main consequences. First, it decreases the cut off frequency of the setup with little or no dielectric amplitude measured beyond fH ∼ 150 MHz in pure water. Second, large resonances progressively appear around fH ∼ 50 MHz and fH ∼ 100 MHz. This suggests the liquid adds an inductive component to the assumed RC circuit. It is not clear what molecular mechanism could be responsible for the liquid acting as an electrical inductor during dielectric measurements. However, the fact that the resonance appears progressively with increasing dielectric constant (Fig. 5) suggests the effect to be intrinsic to the liquid and not an experimental artefact. In fact, the frequency of the observed dielectric resonance can be reliably tuned by adding an external capacitor in series to the setup (data not shown), confirming an LRC (inductor–resistor–capacitor) behaviour. This behaviour would also explain the loss of transmission at higher frequencies although not its molecular origins.
Taking a value of fH = 50 MHz, close to the dielectric force resonance, we conducted force spectroscopy measurements in each liquid, always with the same tip for comparability. The curves were then fitted with the model proposed in eqn (2), imposing in each case the liquid’s dielectric constant and the same oxide thickness for all measurements. The results show a good agreement with the theory (Fig. 5 bottom). The small systematic deviations from the experimental data can be explained by the non-ideal geometry of the tip (not a plane capacitor, but identical in all cases) and the inductive nature of the liquid: higher dielectric constants tend to achieve slightly worse fits.
3.4 Impact of the salt concentration in aqueous solutions
Having examined the behaviour of pure liquids, we now turn to aqueous solutions with increasing concentrations of KCl. Comparative frequency sweeps analysed as for Fig. 5 reveal two interesting features (Fig. 6, top). First, the low frequency (<20 MHz) response of the system exhibits the expected actuation behaviour of an RC circuit: dissolved ions can screen the applied potential provided fH is low enough for the ions to rearrange in time and cancel the dielectric force. The frequency beyond which the ions are no longer able to follow the applied field is often referred to as the actuation frequency f1. The higher the ionic concentration, the higher the value of f1, a behaviour well captured by eqn (2).The second feature is a progressive loss of the resonances highlighted in Fig. 5, with close to no force measured beyond 50 MHz in a solution of 100 mM KCl. This is not predicted by the theory which implies a frequency- and ionic concentration-independent force beyond f1. The spectroscopy curves also show salt-induced variations in shape with no clear trend (Fig. 6, bottom).
Measurements are still technically possible in 100 mM salt, but a different model may be needed to better capture the conducting nature of the liquid and its impact on the resulting dielectric force. Generally, a more conducting environment is expected to make localised experiment more challenging due to the combination of a loss of locality in the measurement and lower dielectric force. This is to some extent observed in Fig. 6 where a relatively poor signal to noise is achieved at 100 mM. Working at concentrations beyond 50 mM of monovalent salt did not allow for high-resolution measurements, likely due to a significant part of the tip contributing to the electrical measurement (see next section).
When operating at lower salt concentrations the setup tends to behave more closely to dielectric predictions, at least over regions where the tip remains outside of the interface. When the tip enters the interface, the local salt concentration and the overall capacitance experienced by the tip change. This can lead to concentration-, frequency- and tip shape-dependent effects on the measured dielectric force (not presented here).
3.5 High-resolution probing of the interface
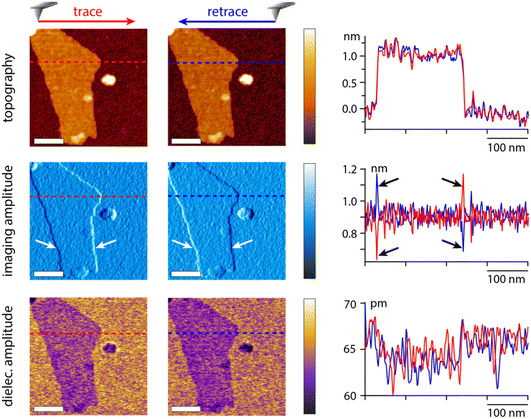
To illustrate the capability of the dual frequency approach, we imaged a model sample, graphene oxide flakes (GrO) deposited on the surface of a silicon substrate with a native oxide layer. The imaging is conducted at the first eigenmode of the cantilever and the dielectric measurement at the second eigenmode. An example of results acquired in hexadecane is presented in Fig. 7. Imaging artefacts induced by the feedback loop near the edges of the flake are clearly visible (arrows in Fig. 7). None of these artefacts are present in the dielectric image, confirming that the measurement strategy is suitable and not affected by the imaging process.The dielectric force appears smaller (darker contrast) over the flakes than over the surrounding silica substrate. This can be rationalised from eqn (2), assuming an increase in the effective sample thickness over the flake. The dielectric constant of the flake is likely higher than that of the silica (εsilica ∼ 3.7–3.9)42 hence inducing a smaller dielectric force than the silica layer at a comparatively similar thickness. It should be noted that the GrO flake is relatively thin (about 1 nm, profile in Fig. 7), highlighting the sensitivity of the approach which is able to detect variations in the order of 5–10 pm of the dielectric amplitude. The use of the second eigenmode with a higher effective stiffness (in the order of 160 N m−1) considerably helps with improving the sensitivity while minimising the crosstalk with imaging.
While helpful to confirm the potential of the proposed strategy, it is not clear at this stage how these results transpose in the presence of ionic solutions, and how the dielectric information gathered at the interface compares with similar information collected further away in the liquid. To further explore these points, lift mode measurements were conducted in aqueous solutions with various concentrations of KCl, using the same tip as in Fig. 6, and scanning over the edge of single GrO flakes for direct comparison. The process was repeated at multiple distances from the interface to evaluate the reliability of the contrast and its progressive evolution when moving away from the interface. Some representative results are shown in Fig. 8. In pure water, a similar contrast to that in hexadecane is obtained with lower dielectric amplitude over the flake, but with a significantly better signal to noise due to the increased dielectric constant of the liquid enhancing the capacitive measurements. When repeating the measurement at set distances from the interface, the GrO flake still appears darker, but the overall contrast progressively fades away, although still visible 100 nm away. Very similar results are obtained in 1 mM KCl in terms of contrast and distance dependence from the interface, consistent with the relatively similar behaviour of the setup in both liquids in Fig. 6. There are some important differences though; first the contrast disappears more quickly when moving away from the interface due to a slightly lower signal to noise. Second, significant local variations in the intensity of the dielectric force are visible across a given flake. By comparison, the surrounding silica appears relatively homogeneous with only small variations that can be explained by nanoscale roughness and possible adsorbed contaminants. The flake regions responsible for the highest force tend to coincide with overlaps or folds in the GrO. This is largely due to the locally increased sample thickness, but small mismatches between the topography and the dielectric picture suggest that the local curvature of the flake can influence the field intensity and direction. More work is needed to explore this effect, including the potential influence of trapped molecules and ions.67
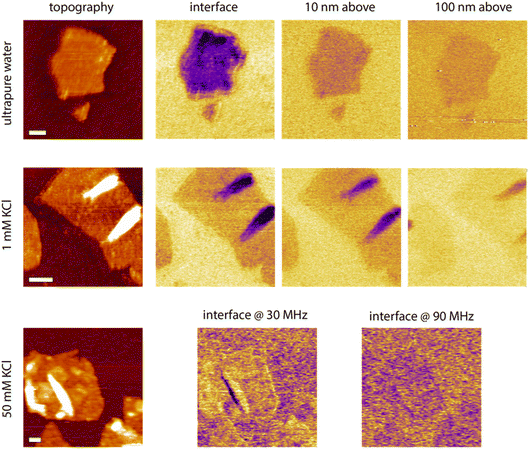 | ||
| Fig. 8 Example measurements taken in water and KCl solutions at the interface and with the tip faithfully following the interface but at a set distance (water and 1 mM KCl). In 50 mM KCl, only the interface is explored but at different dielectric frequencies. The scale bars represent 100 nm. The topography colour variations represent 4 nm in pure water and 1 mM KCl, and 8 nm in 50 mM KCl. In dielectric images it represents 30 pm (water and 1 mM) and 10 pm (50 mM KCl). The measurements were taken with the same tip as in Fig. 7, at fH = 50 MHz in pure water and 1 mM KCl. | ||
Measurements at 10 mM KCl broadly show a similar behaviour as in 1 mM but with poorer signal to noise and no clear contrast at 100 nm from the interface (not shown). To explore the limit of the technique in terms of ionic concentrations, we attempted measurements at 100 mM KCl but no reliable results could be obtained. A second attempt at 50 mM KCl (Fig. 8) still shows poor signal to noise, but at the interface a weak dielectric contrast can be consistently observed. Interestingly, at lower dielectric frequencies (here fH = 30 MHz), the contrast appears reversed, with a marginally higher dielectric force atop the flake compared to over the substrate. Although very weak, the contrast suggests that the frequency may be too close to the actuation frequency to achieve the expected outcome.
Consistently, increasing the dielectric frequency to fH = 90 MHz seems to reset the contrast back to normal with the flake appearing again slightly darker than the surrounding oxide. At fH = 30 MHz the silica does not look completely homogeneous suggesting local fluctuations and interfering ions picked up by the measurement, as expected close to the actuation frequency.
The lift mode results confirm beyond any doubt that the dual frequency strategy is suitable for decoupled electrical and mechanical probing of the interface. The further the tip is located from the interface, the less localised the measurement becomes with a progressive loss of detailed contrast and a more homogeneous picture emerging. Consistently, the magnitude of the force and of the contrast also decrease.
Beyond high-resolution mapping of the dielectric force across a given sample, an interpretation of the results in terms of ion mobility is still lacking, partly because it is entangled with the question of dielectric temporal response. The bulk mobility Λ of the ions as described in eqn (2) is not a suitable handle on the problem, first because of a predicted weak dependence of the dielectric force on Λ, but also because the concept itself becomes questionable at the interface. One possibility is to comparatively explore a range of dielectric frequencies simultaneously or in quick succession at a given location of the interface in order to derive a ‘local actuation frequency’. This could in turn be related to a local ionic relaxation and mobility. An interesting experiment would be to explore how this frequency evolves as a function of the tip–sample distance in close vicinity (<5 nm) to the interface. However, one key element remains to be addressed: the extent to which any dielectric information obtained is spatially localised. Specifically, what area of the interface is responsible for the dielectric force value measured at any given point. Operating at higher dielectric frequencies has been shown to enhance the contribution of the tip apex over the rest of the probe,49,51 but this becomes more challenging in high salt concentrations, as evidenced in the present work.
Preliminary results conducted using different substrates suggest that it is possible to tune the effective range of the dielectric interaction to promote highly localised measurements as well as a dielectric phase contrast in ionic solutions (data not shown here) but interpreting the results becomes more challenging because some of the assumptions underpinning eqn (2) no longer apply. Ongoing experimental work aims at systematically exploring these effects. From a theoretical perspective, the model developed by Gomila et al. has proved remarkably successful in quantitatively describing experimental results when the tip is outside the interface. Even at the interface, eqn (2) is able to provide some qualitative insights. Future developments focused on interfacial measurements may need to take into account the finite size of molecules and ions, as well as the precise geometry of the tip.
4. Conclusions
This work explores the possibility of mapping the dielectric properties of solid–liquid interfaces using dual frequency AFM. The ultimate goal is to gain some quantitative insights into the nanoscale mobility of charges and ions at interfaces from the local variations in the probe’s response to locally applied AC electrical potentials.When operating in pure liquids, the measurements tend to follow theoretical predictions well, especially when the tip is at some distance from the interface. The predictions rely on the system behaving as an RC circuit, something broadly verified except for the progressive apparition of inductive resonances in liquids with higher dielectric constants. The physical principles underpinning this inductive behaviour are not clear from the present work, but the effect appears linked to a poorer signal to noise at higher frequencies.
The setup’s ability to map the dielectric properties of interfaces is demonstrated with single GrO flakes deposited on a silicon substrate with a native oxide layer. A clear and consistent dielectric contrast is observed over the GrO, with the intensity and spatial details of the contrast progressively vanishing when moving away from the interface into the bulk solution.
The adjunction of salt into the liquid makes measurements more challenging, first by decreasing the overall magnitude of the dielectric force measured by the tip, second by a progressive loss of the inductive resonance and of the overall dielectric signal at higher frequencies. Consistently interface mapping in saline solutions is more challenging but measurements are still possible at concentrations up to 50 mM KCl. However, time-dependent effects become visible with a contrast over the GrO flake that depends on the frequency of the applied voltage. This can be explained by the dependence of the system’s actuation timescale on the ionic concentration when an external electric field is applied.
Overall, the current results indicate that high-resolution dielectric measurements in liquid are possible with dual frequency AFM, but moving beyond qualitative observations requires a clear understanding of the different effects at play together with their respective spatial and temporal range. When operating in close vicinity to or inside the interface, the precise configuration and geometry of the system can have a significant impact on the local electrical measurements, both in terms of intensity and spatial resolution. This offers both an opportunity for future improvements and a challenge for achieving reproducible and quantitative measurements. Developing new theoretical models may also be necessary to reflect the discrete nature of molecules and ions in highly localised experiments.
Data availability
All the data presented in this paper is freely available from the corresponding author upon reasonable request.Author contributions
WT and KV conducted the experiments and KV wrote the manuscript. WT and KV commented on the manuscript.Conflicts of interest
There are no conflicts to declare.Acknowledgements
The authors gratefully acknowledgements funding from the UK Engineering and Physical Sciences Research Council (EPSRC grant EP/S028234/1) and stimulating discussion with Alexander Newbold (Durham), Frieder Mugele and Serge Lemay (Twente).References
- M. Brändén, T. Sandén, P. Brzezinski and J. Widengren, Proc. Natl. Acad. Sci. U. S. A., 2006, 103, 19766–19770 CrossRef PubMed.
- J. Heberle, J. Riesle, G. Thiedemann, D. Oesterhelt and N. Dencher, Nature, 1994, 370, 379–382 CrossRef CAS PubMed.
- S. A. Contera, K. Voïtchovsky and J. F. Ryan, Nanoscale, 2010, 2, 222–229 RSC.
- A. Sood, A. D. Poletayev, D. A. Cogswell, P. M. Csernica, J. T. Mefford, D. Fraggedakis, M. F. Toney, A. M. Lindenberg, M. Z. Bazant and W. C. Chueh, Nat. Rev. Mater., 2021, 6, 847–867 CrossRef CAS.
- L. Scalfi, M. Salanne and B. Rotenberg, Annu. Rev. Phys. Chem., 2021, 72, 189–212 CrossRef CAS PubMed.
- F. Zhang, W. Zhang, D. Wexler and Z. Guo, Adv. Mater., 2022, 34, 2107965 CrossRef CAS PubMed.
- B. A. Legg, K. Voïtchovsky and J. J. De Yoreo, Sci. Adv., 2022, 8, eabn7087 CrossRef CAS PubMed.
- E. Ruiz-Agudo and C. V. Putnis, Mineral. Mag., 2012, 76, 227–253 CrossRef CAS.
- K. Miyata, J. Tracey, K. Miyazawa, V. Haapasilta, P. Spijker, Y. Kawagoe, A. S. Foster, K. Tsukamoto and T. Fukuma, Nano Lett., 2017, 17, 4083–4089 CrossRef CAS PubMed.
- L. Bocquet and E. Charlaix, Chem. Soc. Rev., 2010, 39, 1073 RSC.
- D. Argyris, D. R. Cole and A. Striolo, ACS Nano, 2010, 4, 2035–2042 CrossRef CAS PubMed.
- C. Cafolla and K. Voïtchovsky, Nanoscale, 2018, 10, 11831–11840 RSC.
- C. Cafolla and K. Voïtchovsky, Sci. Rep., 2021, 11, 19540 CrossRef CAS PubMed.
- K. Wandelt and S. Thurgate, Solid-liquid Interfaces: Macroscopic Phenomena, Microscopic Understanding, Springer, 2003 Search PubMed.
- C. Yu, G. Evmenenko, A. Richter, A. Datta, J. Kmetko and P. Dutta, Appl. Surf. Sci., 2001, 182, 231–235 CrossRef CAS.
- T. Schmatko, H. Hervet and L. Léger, Phys. Rev. Lett., 2005, 94, 244501 CrossRef.
- M. Ricci, W. Trewby, C. Cafolla and K. Voïtchovsky, Sci. Rep., 2017, 7, 43234 CrossRef CAS PubMed.
- S. S. Lee, P. Fenter, K. L. Nagy and N. C. Sturchio, Nat. Commun., 2017, 8, 15826 CrossRef PubMed.
- W. Trewby, J. Faraudo and K. Voïtchovsky, Nanoscale, 2019, 11, 4376–4384 RSC.
- P. Fenter and N. Sturchio, Prog. Surf. Sci., 2004, 77, 171–258 CrossRef CAS.
- J. Israelachvili and H. Wennerstrom, Nature, 1996, 379, 219–225 CrossRef CAS PubMed.
- P. Fenter, C. Park, K. Nagy and N. Sturchio, Thin Solid Films, 2007, 515, 5654–5659 CrossRef CAS.
- S. Roke, ChemPhysChem, 2009, 10, 1380–1388 CrossRef CAS PubMed.
- S. Pullanchery, S. Kulik, B. Rehl, A. Hassanali and S. Roke, Science, 2021, 374, 1366–1370 CrossRef CAS PubMed.
- C. Lamberti, A. Zecchina, E. Groppo and S. Bordiga, Chem. Soc. Rev., 2010, 39, 4951 RSC.
- A. Wang, J. Li and T. Zhang, Nat. Rev. Chem., 2018, 2, 65–81 CrossRef CAS.
- T. Fukuma and R. Garcia, ACS Nano, 2018, 12, 11785–11797 CrossRef CAS PubMed.
- K. Voïtchovsky, J. J. Kuna, S. A. Contera, E. Tosatti and F. Stellacci, Nat. Nanotechnol., 2010, 5, 401–405 CrossRef PubMed.
- L. Piantanida, A. F. Payam, J. Zhong and K. Voïtchovsky, Phys. Rev. Appl., 2020, 13, 064003 CrossRef CAS.
- M. Ricci, P. Spijker and K. Voïtchovsky, Nat. Commun., 2014, 5, 4400 CrossRef CAS PubMed.
- S.-H. Loh and S. P. Jarvis, Langmuir, 2010, 26, 9176–9178 CrossRef CAS PubMed.
- I. Siretanu, D. van den Ende and F. Mugele, Nanoscale, 2016, 8, 8220–8227 RSC.
- S. Su, I. Siretanu, D. van den Ende, B. Mei, G. Mul and F. Mugele, Adv. Mater., 2021, 33, 2106229 CrossRef CAS PubMed.
- T. Ando, N. Kodera, E. Takai, D. Maruyama, K. Saito and A. Toda, Proc. Natl. Acad. Sci. U. S. A., 2001, 98, 12468–12472 CrossRef CAS PubMed.
- T. Ando, T. Uchihashi and T. Fukuma, Prog. Surf. Sci., 2008, 83, 337–437 CrossRef CAS.
- T. Uchihashi, R. Iino, T. Ando and H. Noji, Science, 2011, 333, 755–758 CrossRef CAS PubMed.
- M. Stolz, D. Stoffler, U. Aebi and C. Goldsbury, J. Struct. Biol., 2000, 131, 171 CrossRef CAS PubMed.
- A. R. Finney and M. Salvalaglio, Chem. Eng. Res. Des., 2022, 180, 285–295 CrossRef CAS.
- I. C. Bourg and G. Sposito, J. Colloid Interface Sci., 2011, 360, 701–715 CrossRef CAS PubMed.
- M. Ricci, P. Spijker, F. Stellacci, J.-F. Molinari and K. Voïtchovsky, Langmuir, 2013, 29, 2207–2216 CrossRef CAS PubMed.
- V. Vitagliano and P. A. Lyons, J. Am. Chem. Soc., 1956, 78, 1549–1552 CrossRef CAS.
- W. M. Haynes, CRC Handbook of Chemistry and Physics, Boca Raton, 97th edn, 2016 Search PubMed.
- K. Tanabe, in Plasmonics for Hydrogen Energy, ed. K. Tanabe, Springer International Publishing, Cham, 2022, pp. 17–22 Search PubMed.
- W. H. H. Woodward, in Broadband Dielectric Spectroscopy: A Modern Analytical Technique, American Chemical Society, 2021, vol. 1375, pp. 3–59 Search PubMed.
- J. R. de Xammar Oro, G. Ruderman and J. R. Grigera, Biophysics, 2008, 53, 195–198 CrossRef.
- L. Collins, S. Jesse, J. I. Kilpatrick, A. Tselev, O. Varenyk, M. B. Okatan, S. A. L. Weber, A. Kumar, N. Balke, S. V. Kalinin and B. J. Rodriguez, Nat. Commun., 2014, 5, 3871 CrossRef CAS PubMed.
- B. P. Lynch, A. M. Hilton, C. H. Doerge and G. J. Simpson, Langmuir, 2005, 21, 1436–1440 CrossRef CAS PubMed.
- B. P. Lynch, A. M. Hilton and G. J. Simpson, Biophys. J., 2006, 91, 2678–2686 CrossRef CAS PubMed.
- G. Gramse, M. A. Edwards, L. Fumagalli and G. Gomila, Appl. Phys. Lett., 2012, 101, 213108 CrossRef.
- G. Gramse, A. Dols-Perez, M. A. Edwards, L. Fumagalli and G. Gomila, Biophys. J., 2013, 104, 1257–1262 CrossRef CAS PubMed.
- G. Gramse, M. A. Edwards, L. Fumagalli and G. Gomila, Nanotechnology, 2013, 24, 415709 CrossRef CAS PubMed.
- G. Gramse, A. Dols-Pérez, M. A. Edwards, L. Fumagalli and G. Gomila, Biophys. J., 2014, 106, 512a CrossRef.
- L. Fumagalli, M. A. Edwards and G. Gomila, Nanotechnology, 2014, 25, 495701 CrossRef CAS PubMed.
- H. V. Panchawagh, T. L. Sounart and R. L. Mahajan, J. Microelectromech. Syst., 2009, 18, 1105–1117 CAS.
- T. L. Sounart, H. V. Panchawagh and R. L. Mahajan, Appl. Phys. Lett., 2010, 96, 203505 CrossRef.
- S. Sadewasser and T. Glatzel, Kelvin Probe Force Microscopy, Springer, 2012, vol. 48 Search PubMed.
- L. Fumagalli, A. Esfandiar, R. Fabregas, S. Hu, P. Ares, A. Janardanan, Q. Yang, B. Radha, T. Taniguchi, K. Watanabe, G. Gomila, K. S. Novoselov and A. K. Geim, Science, 2018, 360, 1339–1342 CrossRef CAS PubMed.
- K. C. Lawrence, S. O. Nelson and P. G. Bartley, IEEE Trans. Instrum. Meas., 1998, 47, 354–361 CrossRef.
- A. Stogryn, IEEE Trans. Microwave Theory Tech., 1971, 19, 733–736 CrossRef.
- I. Horcas, R. Fernández, J. M. Gómez-Rodríguez, J. Colchero, J. Gómez-Herrero and A. M. Baro, Rev. Sci. Instrum., 2007, 78, 013705 CrossRef CAS PubMed.
- I. Humer, O. Bethge, M. Bodnarchuk, M. Kovalenko, M. Yarema, W. Heiss, H. P. Huber, M. Hochleitner, P. Hinterdorfer, F. Kienberger and J. Smoliner, J. Appl. Phys., 2011, 109, 064313 CrossRef.
- M. E. Barber, E. Y. Ma and Z.-X. Shen, Nat. Rev. Phys., 2022, 4, 61–74 CrossRef.
- N. Severin, A. R. Dzhanoev, H. Lin, A. Rauf, S. Kirstein, C.-A. Palma, I. M. Sokolov and J. P. Rabe, Phys. Rev. Res., 2022, 4, 023149 CrossRef CAS.
- K. Voïtchovsky, Phys. Rev. E: Stat., Nonlinear, Soft Matter Phys., 2013, 88, 022407 CrossRef PubMed.
- O. Sahin, S. Magonov, C. Su, C. F. Quate and O. Solgaard, Nat. Nanotech., 2007, 2, 507–514 CrossRef PubMed.
- M. Ricci, R. A. Quinlan and K. Voïtchovsky, Soft Matter, 2017, 13, 187–195 RSC.
- J. Song, Q. Li, X. Wang, J. Li, S. Zhang, J. Kjems, F. Besenbacher and M. Dong, Nat. Commun., 2014, 5, 5837 CrossRef PubMed.
| This journal is © The Royal Society of Chemistry 2023 |

