Luminescent chiral triangular prisms capable of forming double helices for detecting traces of acids and anion recognition†
Lifang
Bian
ab,
Min
Tang
 b,
Jiali
Liu
b,
Yimin
Liang
b,
Lin
Wu
b and
Zhichang
Liu
b,
Jiali
Liu
b,
Yimin
Liang
b,
Lin
Wu
b and
Zhichang
Liu
 *b
*b
aDepartment of Chemistry, Zhejiang University, Hangzhou, Zhejiang 310027, China. E-mail: liu@westlake.edu.cn
bKey Laboratory of Precise Synthesis of Functional Molecules of Zhejiang Province, Department of Chemistry, School of Science, Westlake University, 18 Shilongshan Road, Hangzhou, Zhejiang 310024, China
First published on 22nd September 2022
Abstract
Orchestrating stimuli-responsiveness, molecular recognition, and self-assembly in macrocycles plays a vital role in the preparation of multifunctional materials. Herein, we report a pair of triangular prismatic enantiomers (R)- and (S)-Δ based on tetraphenylethylene (TPE), which assemble into left- and right-handed double helices, respectively, in their single-crystal X-ray superstructures. Due to the geometrical constraint of triangles to the phenylene rotation within TPE, their emission is enhanced significantly. In addition, their fluorescence and circularly polarized luminescence change from blue to yellow in response to traces of acids in solvents, which, combined with enhanced intensity, makes them sensitive indicators for the quantitative detection of the acid present in common organic solvents such as CDCl3, CH2Cl2, and CHCl3, with a detection limit as low as 5 × 10⁻⁷ M. Furthermore, the cavity of triangles can bind I3− to form host–guest adducts by single-crystal-to-single-crystal transformation.
Introduction
Multi-purpose application requirements have brought challenges to the design of functional molecules. By embracing macrocyclic chemistry, especially in relation to molecular recognition and self-assembly, chemists can design sophisticated host molecules with multifunctionality. Thanks to their rigid geometries and enforced cavities, shape-persistent macrocycles, such as calixarenes,1–3 cucurbiturils,4,5 pillararenes,6 and cycloparaphenylenes,7,8 as well as various cages,9–19 have been investigated extensively. Among them, molecular triangles20–23 have exhibited considerable potential in storage, sensing, separation, catalysis, etc. on account of their triangular cavities being able to encapsulate selectively guest molecules of matching size and stereoelectronic properties.24–29 In addition, the small internal angle inside the triangles enforces interactions between their side units enhancing30 some of their properties.Aggregation-induced emission (AIE) of tetraphenylethylene (TPE) has been applied widely in fluorescent probes,31,32 bioimaging agents,33,34 chemical sensors,35–37 and circularly polarized luminescnece (CPL).38,39 The D2h symmetry and tetratopic reaction positions of TPE make it an ideal building block for constructing macrocycles and cages.40–44 Employing TPE as an organic linker enhances significantly the luminescence of these molecules as a result of the restriction of the phenylene rotation by either geometrical constraints or guest complexation.45–48 Taking advantage of the enhanced emission intensity of TPE, chiral macrocycles and cages possess hierachical structural complexity and functionality involving chiral recognition and sensing, CPL signal, and chiral superstructures.16,49
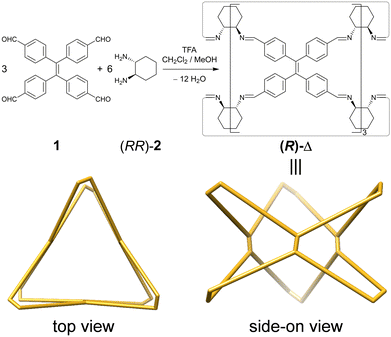
Herein, we report (Fig. 1) a pair of TPE-incorporated enantiomeric molecular triangles (RRRRRRRRRRRR)-Δ [(R)-Δ] and (SSSSSSSSSSSS)-Δ [(S)-Δ], which, as confirmed by single-crystal X-ray diffraction (SCXRD), can (i) assemble into left-(M) and right-handed (P)-double helices, respectively, as a result of chirality transfer. (ii) The enhanced emission intensity of the geometrically constrained TPE, combining with (iii) the trace acid-responsive emission, makes them (iv) sensitive indicators for the detection of the amount of acid in organic solvents to a limit of 5 × 10⁻⁷ M. Moreover, their triangular prismatic cavities can also (v) bind triiodide anions (I3−) to form host–guest adducts through a single-crystal-to-single-crystal (SCSC) transformation.
Results and discussion
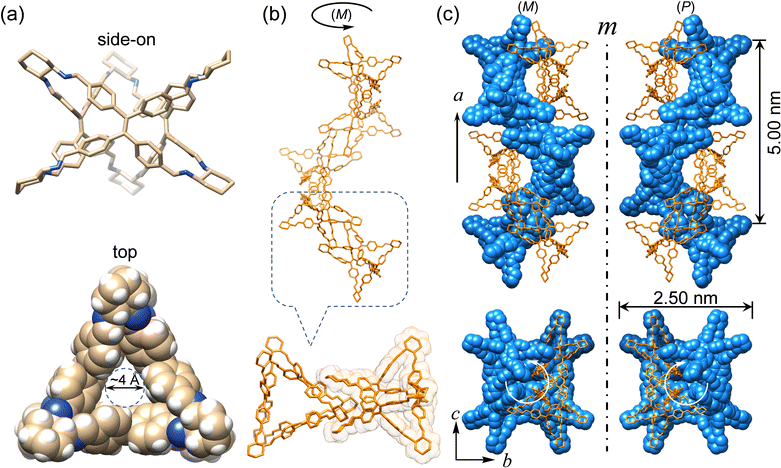
Enantiomeric (R)- and (S)-Δ were synthesized (Fig. 1) by a [3+6] cycloimination between tetrakis(4-formylphenyl)ethylene (1) with (1R,2R)- or (1S,2S)-diaminocyclohexane (2) in 88% and 90% yields, respectively. Their formation was confirmed by 1H and 13C NMR spectroscopies (Fig. S1–S4, ESI†), high-resolution mass spectrometry (Fig. S5, ESI†), and FT-IR spectroscopy (Fig. S6, ESI†).Single crystals of (R)- and (S)-Δ suitable for X-ray crystallography were obtained by slow liquid–liquid diffusion of MeOH into their solutions in CHCl3. SCXRD Analysis revealed (Fig. 2a and Table S1, ESI†) their triangular prismatic geometry wherein three TPE units are linked, in a compact manner, by six diaminocyclohexanes to form a triangular channel (diameter = ∼4 Å), thus preventing the phenylene rotation of TPE. In the X-ray superstructure (Fig. 2b) of (R)-Δ, adjacent triangles bite together through complementary van der Waals interactions (Fig. S7, ESI†) between the sides of the triangular prisms to form a (M)-single helix. Furthermore, two single helices with complementary configurations are intertwined (Fig. 2c) to form stereocontrolled (M)- and (P)-double helices from (R)- and (S)-Δ respectively, wherein each pitch is composed of eight triangles with a length of 5.00 nm and a diameter of 2.5 nm.
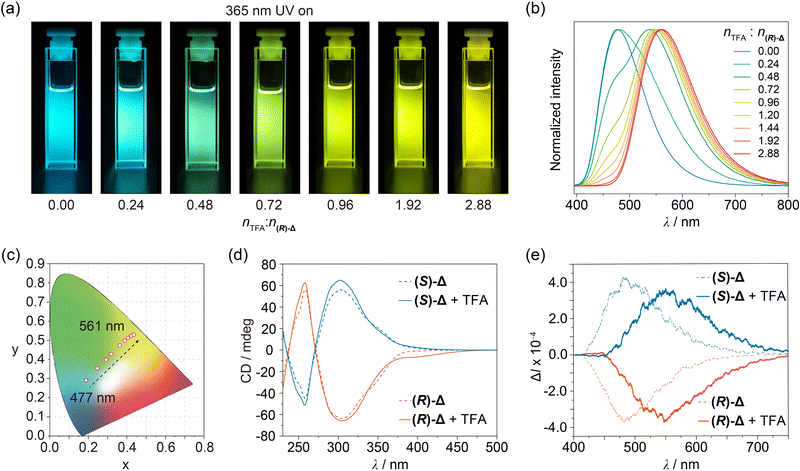
The photophysical properties of (R)- and (S)-Δ in their crystal states were first investigated under ambient conditions. Upon irradiation with 365 nm UV light, block crystals of both (R)- and (S)-Δ exhibit green-yellow emission (Fig. S8, ESI†). As shown in Fig. S9 (ESI†), their steady-state photoluminescence spectra showed a green-yellow emission band at around 530 nm with lifetime of 4.59 and 4.49 ns (Fig. S12 and Table S2, ESI†) as well as quantum efficiencies of 27.7% and 26.2% (Table S3, ESI†) for (R)- and (S)-Δ, respectively. When cleaning a flask containing (R)-Δ using commercial grade CH2Cl2, we discovered serendipitously that the fluorescence emission of the solution upon irradiation with 365 nm-UV light changed from the original blue to yellow. This observation inspired us to measure the fluorescence spectra of (R)-Δ in commercial grade CH2Cl2 and CHCl3 at concentrations as low as 1 × 10⁻⁴, 1 × 10⁻⁵, and 1 × 10⁻⁶ M, which exhibit (Fig. S10, ESI†) a clear trend in emission color from blue (∼480 nm) to yellow (∼560 nm) upon decreasing concentrations. We believe that the change in emission color might result from traces of acid in these solvents. Next, we measured the fluorescence spectra of (R)-Δ in deacidified CH2Cl2 and CHCl3 with K2CO3 at the same concentrations and discovered that they show no change in emission, confirming that traces of acid in solvents can change the emission of (R)-Δ. We performed a series of photophysical characterizations to compare properties of (R)- and (S)-Δ in deacidified and quantitatively acidified CHCl3, respectively. UV-Vis Spectra of solutions (1 × 10⁻⁵ M) of (R)- and (S)-Δ in deacidified CHCl3 show (Fig. S11, ESI†) characteristic peaks at 272, 310, and 345 nm, while the same solutions exhibit (Fig. 3a) bright blue emission upon irradiation with 365 nm-UV light. Fluorescence spectra recorded on the same solutions demonstrate (Fig. 3b) an emission band at ∼477 nm upon excitation at 380 nm, which has (Fig. S13 and Table S4, ESI†) a typical fluorescence feature with lifetimes of 2.29 and 2.52 ns and high quantum efficiencies of 25.5% and 23.4% (Table S5, ESI†) for (R)- and (S)-Δ, respectively. The significantly enhanced emission efficiencies can be ascribed to the restriction of the phenylene rotation within triangles.
Enantiomeric (R)- and (S)-Δ in deacidified CHCl3 lead (Fig. 3d) to mirror-symmetrical negative and positive Cotton effects in circular dichroism (CD) spectra, respectively, while CPL signals of (R)- and (S)-Δ are (Fig. 3e) also mirror-symmetrical at 484 nm with dissymmetry factors (glum) of −5.8 × 10⁻⁴ and 6.6 × 10⁻⁴, respectively.
Trifluoroacetic acid (TFA) was chosen to prepare quantitatively acidified CHCl3. Upon increasing the molar ratio of nTFA![[thin space (1/6-em)]](https://www.rsc.org/images/entities/char_2009.gif) :
:![[thin space (1/6-em)]](https://www.rsc.org/images/entities/char_2009.gif) n(R)-Δ from 0 to 2.88 in solutions (1 × 10⁻⁵ M) of (R)-Δ in quantitatively acidified CHCl3, their UV-Vis spectra exhibit (Fig. S11, ESI†) a decrease at 345 nm in concert with an enhancement at 365–500 nm, while their emissions show (Fig. 3a and b) a significant redshift from 477 to 561 nm, which covers a multicolor region from blue to green to yellow as shown (Fig. 3c) in the CIE chromaticity diagram. We envision that the protonation of (R)-Δ might narrow the energy gap and thus leading to the redshifted emission. Meanwhile, the more rigid cage stablized by hydrogen bonding of NH upon protonation can reduce the non-radiative transition of intramolecular excitons and thus exhibiting (Fig. S13 and Table S4, ESI†) a longer fluorescence lifetime of 4.87 ns. In order to gain insight into the change in photophysical properties, absorption spectra of (R)-Δ and protonated (R)-Δ were calculated using time-dependent density functional theory (TD-DFT). TD-DFT Data indicate that, upon protonation, the HOMO–LUMO energy gap decreases (Fig. S14, ESI†) from 3.53 eV in the case of (R)-Δ to 3.02 eV for the protonated counterpart, an observation which is in line with the redshifts in absorption and emission spectra upon protonation. CD Signals of (R)- and (S)-Δ solutions in a molar ratio of nTFA
n(R)-Δ from 0 to 2.88 in solutions (1 × 10⁻⁵ M) of (R)-Δ in quantitatively acidified CHCl3, their UV-Vis spectra exhibit (Fig. S11, ESI†) a decrease at 345 nm in concert with an enhancement at 365–500 nm, while their emissions show (Fig. 3a and b) a significant redshift from 477 to 561 nm, which covers a multicolor region from blue to green to yellow as shown (Fig. 3c) in the CIE chromaticity diagram. We envision that the protonation of (R)-Δ might narrow the energy gap and thus leading to the redshifted emission. Meanwhile, the more rigid cage stablized by hydrogen bonding of NH upon protonation can reduce the non-radiative transition of intramolecular excitons and thus exhibiting (Fig. S13 and Table S4, ESI†) a longer fluorescence lifetime of 4.87 ns. In order to gain insight into the change in photophysical properties, absorption spectra of (R)-Δ and protonated (R)-Δ were calculated using time-dependent density functional theory (TD-DFT). TD-DFT Data indicate that, upon protonation, the HOMO–LUMO energy gap decreases (Fig. S14, ESI†) from 3.53 eV in the case of (R)-Δ to 3.02 eV for the protonated counterpart, an observation which is in line with the redshifts in absorption and emission spectra upon protonation. CD Signals of (R)- and (S)-Δ solutions in a molar ratio of nTFA![[thin space (1/6-em)]](https://www.rsc.org/images/entities/char_2009.gif) :
:![[thin space (1/6-em)]](https://www.rsc.org/images/entities/char_2009.gif) n(R)-Δ = 2.88 were (Fig. 3d) slightly enhanced, while their CPL signals were red-shifted (Fig. 3e) from 484 to 550 nm with increased glum of −7.5 × 10⁻⁴ and 7.6 × 10⁻⁴, respectively, thus realizing trace acid-responsive and color tunable CPL signals.
n(R)-Δ = 2.88 were (Fig. 3d) slightly enhanced, while their CPL signals were red-shifted (Fig. 3e) from 484 to 550 nm with increased glum of −7.5 × 10⁻⁴ and 7.6 × 10⁻⁴, respectively, thus realizing trace acid-responsive and color tunable CPL signals.
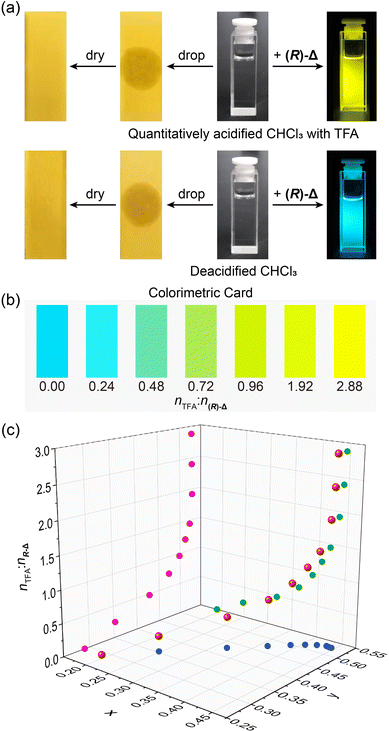
While trace amount of acids in organic solvents can cause undesired consequences, they are difficult to quantify.50 Based on the trace acid-responsive fluorescence change of (R)-Δ, we have explored its potential as an indicator to detect trace acids in organic solvents. Upon dropping (Fig. 4a) quantitatively acidified CHCl3 with TFA (2.88 × 10⁻⁵ M) and deacidified CHCl3 on to two pH papers, respectively, colors of both pH papers did not undergo change. In contrast, when shining 365 nm-UV light on two solutions (1 × 10⁻⁵ M) of (R)-Δ prepared from the above two solvents, the former (nTFA![[thin space (1/6-em)]](https://www.rsc.org/images/entities/char_2009.gif) :
:![[thin space (1/6-em)]](https://www.rsc.org/images/entities/char_2009.gif) n(R)-Δ = 2.88) exhibits yellow emission, while the latter (nTFA
n(R)-Δ = 2.88) exhibits yellow emission, while the latter (nTFA![[thin space (1/6-em)]](https://www.rsc.org/images/entities/char_2009.gif) :
:![[thin space (1/6-em)]](https://www.rsc.org/images/entities/char_2009.gif) n(R)-Δ = 0) is blue, suggesting that the emission of (R)-Δ is highly sensitive to traces of acid. Upon increasing the molar ratio of nTFA
n(R)-Δ = 0) is blue, suggesting that the emission of (R)-Δ is highly sensitive to traces of acid. Upon increasing the molar ratio of nTFA![[thin space (1/6-em)]](https://www.rsc.org/images/entities/char_2009.gif) :
:![[thin space (1/6-em)]](https://www.rsc.org/images/entities/char_2009.gif) n(R)-Δ from 0 to 2.88 in solutions (1 × 10⁻⁵ M) of (R)-Δ in CHCl3, their fluorescence colors could be discerned by the naked eye, demonstrating the potential of (R)-Δ as a visual colorimetric card (Fig. 4b) for rapidly detecting traces of acid in solvents. Moreover, trace amounts of various acids in solvents can be detected quantitatively (Fig. 4c) as equivalent TFA by correlating the relationship between the molar ratio of nTFA
n(R)-Δ from 0 to 2.88 in solutions (1 × 10⁻⁵ M) of (R)-Δ in CHCl3, their fluorescence colors could be discerned by the naked eye, demonstrating the potential of (R)-Δ as a visual colorimetric card (Fig. 4b) for rapidly detecting traces of acid in solvents. Moreover, trace amounts of various acids in solvents can be detected quantitatively (Fig. 4c) as equivalent TFA by correlating the relationship between the molar ratio of nTFA![[thin space (1/6-em)]](https://www.rsc.org/images/entities/char_2009.gif) :
:![[thin space (1/6-em)]](https://www.rsc.org/images/entities/char_2009.gif) n(R)-Δ and the CIE chromaticity coordinates. We detected the acid amount in two commercial CDCl3 samples [one with silver foil (C) and the other without (E)] using (R)-Δ. A solution of (R)-Δ (1 × 10⁻⁵ M) in CDCl3 C exhibited (Fig. S15, ESI†) a yellow-green emission in CIE coordinates upon excitation at 380 nm, which is equivalent to a nTFA
n(R)-Δ and the CIE chromaticity coordinates. We detected the acid amount in two commercial CDCl3 samples [one with silver foil (C) and the other without (E)] using (R)-Δ. A solution of (R)-Δ (1 × 10⁻⁵ M) in CDCl3 C exhibited (Fig. S15, ESI†) a yellow-green emission in CIE coordinates upon excitation at 380 nm, which is equivalent to a nTFA![[thin space (1/6-em)]](https://www.rsc.org/images/entities/char_2009.gif) :
:![[thin space (1/6-em)]](https://www.rsc.org/images/entities/char_2009.gif) n(R)-Δ ratio of 0.49, namely, 0.49 × 10⁻⁵ M of TFA. In striking contrast, the amount of acid in a solution of (R)-Δ (1 × 10⁻⁵ M) in CDCl3 E is too much and exceeds the detection threshold. When we diluted CDCl3 E 100 times with deacidified CHCl3 to make a solution of (R)-Δ (1 × 10⁻⁵ M) in solvent D, the emission of which was measured (Fig. S16, ESI†) to correspond to a nTFA
n(R)-Δ ratio of 0.49, namely, 0.49 × 10⁻⁵ M of TFA. In striking contrast, the amount of acid in a solution of (R)-Δ (1 × 10⁻⁵ M) in CDCl3 E is too much and exceeds the detection threshold. When we diluted CDCl3 E 100 times with deacidified CHCl3 to make a solution of (R)-Δ (1 × 10⁻⁵ M) in solvent D, the emission of which was measured (Fig. S16, ESI†) to correspond to a nTFA![[thin space (1/6-em)]](https://www.rsc.org/images/entities/char_2009.gif) :
:![[thin space (1/6-em)]](https://www.rsc.org/images/entities/char_2009.gif) n(R)-Δ ratio of 0.63—that is, 0.63 × 10⁻⁵ M of TFA. Considering the 100-fold dilution, the amount of acid in CDCl3 E without silver foil is equivalent to 0.63 × 10⁻³ M of TFA and 129 times higher than that in CDCl3 C stabilized with silver foil, suggesting that the addition of silver foil stabilizer can decrease significantly the amount of acid in CDCl3. Similarly, traces of acid in commercial grade CH2Cl2 and CHCl3 were also quantified (Fig. S16, ESI†) to be equivalent to 0.30 × 10⁻⁵ and 0.46 × 10⁻⁵ M of TFA, respectively. Finally, the detection limit was measured (Fig. S17, ESI†) to be 5 × 10⁻⁷ M.
n(R)-Δ ratio of 0.63—that is, 0.63 × 10⁻⁵ M of TFA. Considering the 100-fold dilution, the amount of acid in CDCl3 E without silver foil is equivalent to 0.63 × 10⁻³ M of TFA and 129 times higher than that in CDCl3 C stabilized with silver foil, suggesting that the addition of silver foil stabilizer can decrease significantly the amount of acid in CDCl3. Similarly, traces of acid in commercial grade CH2Cl2 and CHCl3 were also quantified (Fig. S16, ESI†) to be equivalent to 0.30 × 10⁻⁵ and 0.46 × 10⁻⁵ M of TFA, respectively. Finally, the detection limit was measured (Fig. S17, ESI†) to be 5 × 10⁻⁷ M.
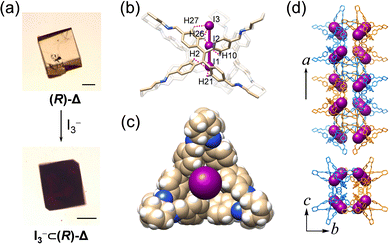
The channel of ∼4 Å inside (R)-Δ can act as an ideal host for binding linear guest molecules. We have investigated the complexation between linear I3− anions and (R)-Δ through SCSC transformation. Upon slow diffusion of a solution of [Bu4N][I3] in MeOH into the mother liquor containing single crystals of (R)-Δ, yellow crystals changed (Fig. 5a) to black after one day. SCXRD Analysis reveals (Fig. 5) that one I3− anion fills completely the tubular cavities of (R)-Δ to form a host–guest adduct [I3−⊂(R)-Δ] which assembles into a (M)-double helix in a similar cubic unit cell to the one with (R)-Δ. I3− Anions are stabilized (Fig. 5b, Fig. S18 and Table S8, ESI†) inside the channel through up to 18 weak [C–H⋯I] hydrogen bonding interactions (mean [H⋯I] separation d[H⋯I] = ∼3.4 Å), while the Bu4N+ cations are disordered. Although the disordered cations in the single-crystal superstructure cannot be observed, we believe that the Coulombic interaction between cations and I3− is also responsible for the stable binding of I3− anions to the cavity of the triangular prism.
Conclusions
We have prepared a pair of tetraphenylethylene-based enantiomeric molecular triangles (R)- and (S)-Δ. X-Ray crystallographic analysis reveals the stereocontrolled formations of left- and right-handed double helices from triangular prismatic (R)- and (S)-Δ, respectively, as a result of chirality transfer, wherein the cavities in the triangles can bind I3− anions to form host–guest adducts through SCSC transformation. Both enantiomers exhibit mirror symmetrical CD and CPL signals, as well as significantly enhanced fluorescence as a result of chiral induction together with the restriction of the phenylene rotation by geometrical constraints. Moreover, trace acid-responsive changes in fluorescence and CPL from blue to yellow have been applied to detect quantitatively the acid content in common organic solvents involving CH2Cl2, CHCl3, and CDCl3, with a detection limit as low as 5 × 10⁻⁷ M. This research demonstrates the integration of self-assembly, molecular recognition, and stimuli-responsiveness in a judiciously designed triangle while, at the same time, providing insight into fabricating multifunctional materials.Conflicts of interest
There are no conflicts to declare.Acknowledgements
We are grateful for financial support from the National Natural Science Foundation of China (21971211 and 22171232), the Natural Science Foundation of Zhejiang Province (2022XHSJJ007), the Qiantang River Talent Foundation (QJD1902029), and Westlake University. We thank Drs. Xiaohe Miao, Zhong Chen, Xingyu Lu, Xiaohuo Shi, and Yinjuan Chen for their help in the collection of X-ray diffraction dots, recording UV-Vis, CD, CPL, PL, and NMR spectra, and obtaining mass spectrometric data, respectively. This research was supported by Instrumentation and Service Centers for Molecular Science and for Physical Science, respectively, as well as by Westlake University HPC Center. We thank the Research Center for Industries of the Future (RCIF) at Westlake University for supporting this work. We also thank the staffs from BL17B beamline of National Facility for Protein Science in Shanghai (NFPS) at Shanghai Synchrotron Radiation Facility, for assistance during data collection.Notes and references
- C. D. Gutsche, Acc. Chem. Res., 1983, 16, 161–170 CrossRef CAS.
- C. D. Gutsche, B. Dhawan, K. H. No and R. Muthukrishnan, J. Am. Chem. Soc., 1981, 103, 3782–3792 CrossRef CAS.
- R. Muthukrishnan and C. D. Gutsche, J. Org. Chem., 1979, 44, 3962–3964 CrossRef CAS.
- S. J. Barrow, S. Kasera, M. J. Rowland, J. del Barrio and O. A. Scherman, Chem. Rev., 2015, 115, 12320–12406 CrossRef CAS PubMed.
- W. A. Freeman, W. L. Mock and N. Y. Shih, J. Am. Chem. Soc., 1981, 103, 7367–7368 CrossRef CAS.
- T. Ogoshi, S. Kanai, S. Fujinami, T. Yamagishi and Y. Nakamoto, J. Am. Chem. Soc., 2008, 130, 5022–5023 CrossRef CAS PubMed.
- S. E. Lewis, Chem. Soc. Rev., 2015, 44, 2221–2304 RSC.
- R. Jasti, J. Bhattacharjee, J. B. Neaton and C. R. Bertozzi, J. Am. Chem. Soc., 2008, 130, 17646–17647 CrossRef CAS PubMed.
- X. Yan, T. R. Cook, P. Wang, F. Huang and P. J. Stang, Nat. Chem., 2015, 7, 342–348 CrossRef CAS.
- Y. Liu, W. Zhao, C. H. Chen and A. H. Flood, Science, 2019, 365, 159–161 CAS.
- M. Yamashina, Y. Tanaka, R. Lavendomme, T. K. Ronson, M. Pittelkow and J. R. Nitschke, Nature, 2019, 574, 511–515 CrossRef CAS PubMed.
- Y. Ni, T. Y. Gopalakrishna, H. Phan, T. Kim, T. S. Herng, Y. Han, T. Tao, J. Ding, D. Kim and J. Wu, Nat. Chem., 2020, 12, 242–248 CrossRef CAS.
- L. Zhang, Y. Jin, G. H. Tao, Y. Gong, Y. Hu, L. He and W. Zhang, Angew. Chem., Int. Ed., 2020, 59, 20846–20851 CrossRef CAS PubMed.
- V. Abet, F. T. Szczypinski, M. A. Little, V. Santolini, C. D. Jones, R. Evans, C. Wilson, X. Wu, M. F. Thorne, M. J. Bennison, P. Cui, A. I. Cooper, K. E. Jelfs and A. G. Slater, Angew. Chem., Int. Ed., 2020, 59, 16755–16763 CrossRef CAS PubMed.
- X. Liu, Z. Shi, M. Xie, J. Xu, Z. Zhou, S. Jung, G. Cui, Y. Zuo, T. Li, C. Yu, Z. Liu and S. Zhang, Angew. Chem., Int. Ed., 2021, 60, 15080–15086 CrossRef CAS PubMed.
- H. Qu, X. Tang, X. Wang, Z. Li, Z. Huang, H. Zhang, Z. Tian and X. Cao, Chem. Sci., 2018, 9, 8814–8818 RSC.
- A. G. Slater, M. A. Little, A. Pulido, S. Y. Chong, D. Holden, L. Chen, C. Morgan, X. Wu, G. Cheng, R. Clowes, M. E. Briggs, T. Hasell, K. E. Jelfs, G. M. Day and A. I. Cooper, Nat. Chem., 2017, 9, 17–25 CrossRef CAS.
- P.-E. Alexandre, W.-S. Zhang, F. Rominger, S. M. Elbert, R. R. Schröder and M. Mastalerz, Angew. Chem., Int. Ed., 2020, 59, 19675–19679 CrossRef CAS PubMed.
- X. Zheng, W. Zhu, C. Zhang, Y. Zhang, C. Zhong, H. Li, G. Xie, X. Wang and C. Yang, J. Am. Chem. Soc., 2019, 141, 4704–4710 CrossRef CAS PubMed.
- Y. Wang, H. Wu and J. F. Stoddart, Acc. Chem. Res., 2021, 54, 2027–2039 CrossRef CAS PubMed.
- P. Das, A. Kumar, P. Howlader and P. S. Mukherjee, Chem. – Eur. J., 2017, 23, 12565–12574 CrossRef CAS PubMed.
- C. J. Pugh, V. Santolini, R. L. Greenaway, M. A. Little, M. E. Briggs, K. E. Jelfs and A. I. Cooper, Cryst. Growth Des., 2018, 18, 2759–2764 CrossRef CAS.
- Z. Liu, G. Liu, Y. Wu, D. Cao, J. Sun, S. T. Schneebeli, M. S. Nassar, C. A. Mirkin and J. F. Stoddart, J. Am. Chem. Soc., 2014, 136, 16651–16660 CrossRef CAS PubMed.
- Z. Yang, C. Yu, J. Ding, L. Chen, H. Liu, Y. Ye, P. Li, J. Chen, K. J. Wu, Q. Y. Zhu, Y. Q. Zhao, X. Liu, X. Zhuang and S. Zhang, Nat. Commun., 2021, 12, 6124 CrossRef CAS PubMed.
- Y. D. Yang, X. L. Chen, J. L. Sessler and H. Y. Gong, J. Am. Chem. Soc., 2021, 143, 2315–2324 CrossRef CAS PubMed.
- Y. Lei, Q. Chen, P. Liu, L. Wang, H. Wang, B. Li, X. Lu, Z. Chen, Y. Pan, F. Huang and H. Li, Angew. Chem., Int. Ed., 2021, 60, 4705–4711 CrossRef CAS PubMed.
- A. Dey, S. Chand, L. O. Alimi, M. Ghosh, L. Cavallo and N. M. Khashab, J. Am. Chem. Soc., 2020, 142, 15823–15829 CrossRef CAS PubMed.
- T. Hasell, M. Schmidtmann and A. I. Cooper, J. Am. Chem. Soc., 2011, 133, 14920–14923 CrossRef CAS PubMed.
- Y. Wang, J. Yang, Y. Gong, M. Fang, Z. Li and B. Z. Tang, SmartMat, 2020, 1, e1006–e1014 Search PubMed.
- H. Qu, Z. Huang, X. Dong, X. Wang, X. Tang, Z. Li, W. Gao, H. Liu, R. Huang, Z. Zhao, H. Zhang, L. Yang, Z. Tian and X. Cao, J. Am. Chem. Soc., 2020, 142, 16223–16228 CrossRef CAS PubMed.
- J. Liang, B. Z. Tang and B. Liu, Chem. Soc. Rev., 2015, 44, 2798–2811 RSC.
- J. Chen, L. Chen, Y. Wu, Y. Fang, F. Zeng, S. Wu and Y. Zhao, Nat. Commun., 2021, 12, 6870 CrossRef CAS.
- S. Cao, J. Shao, H. Wu, S. Song, M. T. D. Martino, I. A. B. Pijpers, H. Friedrich, L. K. E. A. Abdelmohsen, D. S. Williams and J. C. M. van Hest, Nat. Commun., 2021, 12, 2077 CrossRef CAS PubMed.
- Y. Li, X. Wu, B. Yang, X. Zhang, H. Li, A. Umar, N. F. Rooij, G. Zhou and Y. Wang, ACS Appl. Mater. Interfaces, 2019, 11, 37077–37083 CrossRef CAS.
- D. D. La, S. V. Bhosale, L. A. Jones and S. V. Bhosale, ACS Appl. Mater. Interfaces, 2018, 10, 12189–12216 CrossRef CAS PubMed.
- S. N. Lei, H. Xiao, Y. Zeng, C. H. Tung, L. Z. Wu and H. Cong, Angew. Chem., Int. Ed., 2020, 59, 10059–10065 CrossRef CAS PubMed.
- X. Li, Z. Li and Y. W. Yang, Adv. Mater., 2018, 30, 1800177 CrossRef PubMed.
- J. Roose, B. Z. Tang and K. S. Wong, Small, 2016, 12, 6495–6512 CrossRef CAS.
- J. B. Xiong, H. T. Feng, J. P. Sun, W. Z. Xie, D. Yang, M. Liu and Y. S. Zheng, J. Am. Chem. Soc., 2016, 138, 11469–11472 CrossRef CAS.
- H. T. Feng, Y. X. Yuan, J. B. Xiong, Y. S. Zheng and B. Z. Tang, Chem. Soc. Rev., 2018, 47, 7452–7476 RSC.
- L. Bian, Y. Liang and Z. Liu, ACS Appl. Nano Mater., 2022 DOI:10.1021/acsanm.2c01250.
- M. Zhang, J. Guo, T. Liu, Z. He, M. Irfan, Z. Zhao and Z. Zeng, J. Mater. Chem. C, 2020, 8, 14919–14924 RSC.
- H. Duan, Y. Li, Q. Li, P. Wang, X. Liu, L. Cheng, Y. Yu and L. Cao, Angew. Chem., Int. Ed., 2020, 59, 10101–10110 CrossRef CAS PubMed.
- J. Jiao, Z. Li, Z. Qiao, X. Li, Y. Liu, J. Dong, J. Jiang and Y. Cui, Nat. Commun., 2018, 9, 4423–4430 CrossRef PubMed.
- C. Zhang, Z. Wang, L. Tan, T. L. Zhai, S. Wang, B. Tan, Y. S. Zheng, X. L. Yang and H. B. Xu, Angew. Chem., Int. Ed., 2015, 54, 9244–9248 CrossRef CAS PubMed.
- Q. Huang, W. Li, Z. Mao, L. Qu, Y. Li, H. Zhang, T. Yu, Z. Yang, J. Zhao, Y. Zhang, M. P. Aldred and Z. Chi, Nat. Commun., 2019, 10, 3074–3081 CrossRef PubMed.
- M. Li, S. Jiang, Z. Zhang, X. Q. Hao, X. Jiang, H. Yu, P. Wang, B. Xu, M. Wang and W. Tian, CCS Chem., 2020, 2, 337–348 CrossRef CAS.
- Y. Peng, L. Li, C. Zhu, B. Chen, M. Zhao, Z. Zhang, Z. Lai, X. Zhang, C. Tan, Y. Han, Y. Zhu and H. Zhang, J. Am. Chem. Soc., 2020, 142, 13162–13169 CrossRef CAS PubMed.
- H. Qu, Y. Wang, Z. Li, X. Wang, H. Fang, Z. Tian and X. Cao, J. Am. Chem. Soc., 2017, 139, 18142–18145 CrossRef CAS PubMed.
- K. Anzai, S. Kawamorita, N. Komiya and T. Naota, Chem. Lett., 2017, 46, 672–675 CrossRef CAS.
Footnote |
| † Electronic supplementary information (ESI) available. CCDC 2114992–2114994. For ESI and crystallographic data in CIF or other electronic format see DOI: https://doi.org/10.1039/d2tc03506e |
| This journal is © The Royal Society of Chemistry 2022 |

