Pulsed-ramped-field-ionization zero-kinetic-energy photoelectron spectroscopy: a methodological advance
Oliver J.
Harper
 ,
Ning L.
Chen
 ,
Séverine
Boyé-Péronne
 and
Bérenger
Gans
 *
*
Institut des Sciences Moléculaires d'Orsay, CNRS, Université Paris-Saclay, 91405 Orsay, France. E-mail: berenger.gans@universite-paris-saclay.fr
First published on 28th October 2021
Abstract
A new experimental method has been developed to record photoelectron spectra based on the well-established pulsed-field-ionization zero-kinetic-energy photoelectron spectroscopy technique and inspired by the data treatment employed in slow photoelectron spectroscopy. This method has been successfully applied to two well-known systems: the X+2Πg,1/2(v+ = 0) ← X1Σ+g(v = 0) and the X+1Σ+(v+ = 2) ← X2Π1/2(v = 0) ionizing transitions of CO2 and NO, respectively. The first results highlight several advantages of our technique such as an improved signal-to-noise ratio without degrading the spectral resolution and a direct field-free energy determination. The data obtained for NO indicate that this method might be useful for studying field-induced autoionization processes.
1 Introduction
The Pulsed-Field-Ionization ZEro-Kinetic Energy PhotoElectron Spectroscopy (PFI-ZEKE PES) is a well-established technique which allows the measurement of high-resolution photoelectron spectra since the 1980s.1,2 Review papers and books have been published on this technique3–8 describing its evolution and the different developments which rank it first in terms of high-resolution photoelectron spectroscopy with a spectral record at 0.06 cm−1.9In this paper, we propose a new scheme of acquisition and data treatment for recording photoelectron spectra that we will call Pulsed-Ramped-Field-Ionization (PRFI) ZEKE PES throughout the text. It is based on one of the first2 as well as one of the latest9 developments in PFI-ZEKE spectroscopy, and on the data treatment procedure used in Slow PhotoElectron Spectroscopy (SPES).10 The experimental results presented below have been acquired with a recently built versatile setup devoted to Vacuum Ultra-Violet (VUV) laser spectroscopy and used here to measure photoelectron spectra.
The rest of this article is divided into four sections. In the first, we describe the details of our experimental setup. The second section is devoted to a qualitative description of the PRFI-ZEKE technique based on the procedure to model the PFI-ZEKE spectral resolution described in ref. 9. In the third section, we apply this new method to two different examples: the X+2Πg,1/2(v+ = 0) ← X1Σ+g(v = 0) and the X+1Σ+(v+ = 2) ← X2Π1/2(v = 0) ionizing transitions of CO2 and NO, respectively. The last section gathers our conclusions and some perspectives.
2 Experimental details
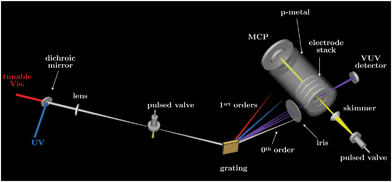
The experimental apparatus used in this paper is a versatile setup called VULCAIM which has been built to study single-VUV-photon-induced relaxation processes of species of astrophysical interest.11The VULCAIM configuration used in the present study is schematized in Fig. 1 and can be decomposed in two parts: a system to generate a tunable pulsed VUV laser (left part of the figure) coupled with a skimmed molecular beam and a photoelectron spectrometer (right part of the figure). This apparatus is similar to the setups used in the group of Prof. F. Merkt at ETH Zürich to perform photoelectron and photoion spectroscopy (see for instance ref. 12). Moreover, the photoelectron spectrometer used in the present paper was initially available for users at the laser center of the Paris-Sud University (CLUPS)13,14 following the design of the group of Prof. F. Merkt.15
VULCAIM is composed of 4 vacuum chambers: the jet, the spectrometer, the VUV generation, and the grating chambers. All of them are pumped by Pfeiffer turbomolecular pumps (HiPace2300, HiPace700, HiPace80, and HiPace700, respectively) and two backing pumps (ACP, Pfeiffer), one for the VUV generation and the grating chambers, and one for the jet and the spectrometer chambers. A typical background pressure of 10−7 mbar is reached in all chambers.
2.1 VUV laser system
The tunable pulsed VUV laser is generated by four-wave-mixing processes (2νUV ± νVis) in a pulsed rare-gas jet using two commercially available laser chains which deliver the νUV and νVis radiations. The UV radiation is depicted in blue in Fig. 1 and generated as follows. A cw ring dye laser (Matisse 2 DR series, Sirah) pumped by a frequency-doubled Nd:YVO4 cw laser at 532 nm (Millenia) seeds a 4-stage pulsed dye amplifier (PDA, Sirah) pumped by the second harmonic of a seeded Nd:YAG laser (Quanta-Ray Lab-190, Spectra-Physics) at 20 Hz (pulse duration: 7 ns and typical energy: 350–400 mJ per pulse). The PDA output is a near Fourier-transform-limited nanosecond laser pulse (20 Hz, 15–30 mJ per pulse) and is injected in a third harmonic unit (THU-205, Sirah) to generate the UV radiation by tripling or mixing with Nd:YAG fundamental after second harmonic generation (SHG). In the present experiment, the UV radiation is kept at a fixed wavelength (637.6680 nm) to match the (4p)6 1S0 → (4p)55p[1/2]0 two-photon transition in krypton by locking the ring dye laser at 637.6648 nm (with the integrated wavemeter, WS6 HighFinesse). The PDA output is slightly shifted in wavelength because of the stimulated Brillouin scattering cell included in the PDA to suppress the amplified spontaneous emission and the cw seed beam. This shift is controlled with an external wavemeter (WS7 HighFinesse). The UV radiation has a wavelength of 212.556 nm, a spectral resolution of a few 10−3 cm−1, a repetition rate of 20 Hz, a pulse duration slightly smaller than 7 ns, and an energy per pulse which can be set up to 3 mJ per pulse. Typically, an energy per pulse between 0.5 and 1.5 mJ per pulse is used.The tunable visible laser used to generate the νVis radiation is a double-grating dye laser (Cobra-Stretch – 1800 and 1800 or 1800 and 3000 gr mm−1, Sirah) pumped by the second (or third) harmonic of a pulsed Nd:YAG laser (Quanta-Ray Lab-170, Spectra-Physics). The dye laser output can be doubled in the included SHG unit. In all experiments, the dye-laser fundamental frequency is monitored by a wavemeter (WS6 HighFinesse).
The UV laser (νUV) and tunable visible laser (νVis) are superimposed using a dichroic mirror and focused by a lens just beneath a nozzle (Amsterdam Piezo Valve, MassSpecpecD BV the Netherlands) producing pulses (pulse duration: 40 μs, repetition rate: 20 Hz) of krypton to generate VUV radiation by four-wave-mixing (sum: νVUV+ = 2νUV + νVis or difference: νVUV− = 2νUV − νVis frequency mixing processes). A telescope is placed on the path of the visible radiation to compensate its longer focal length compared to the UV laser. A VUV reflective diffraction grating (platinum-coated TGS300 replica, Horiba) is then used to disperse the polychromatic light (νUV, νVis, νVUV+, νVUV−,…) and only send in the extraction region the desired VUV radiation. A VUV detector (R5150-10 electron multiplier tube, Hamamatsu) is placed in the rear-end of light path after the spectrometer (see Fig. 1).
The spectral resolution of the VUV laser is about 0.1–0.2 cm−1 (measured by pulsed-field-ionization of rare gases), above the expected resolution when using a tunable double-grating dye laser and a pulsed amplified ring dye laser to generate the VUV radiation (≪0.1 cm−1). This resolution issue is not understood yet and will be investigated in the near-future. The typical VUV flux obtained with our laser setup has not been measured yet. Nevertheless, we have performed a relative measurement with the same detector for our laser and for the one which was operational at the laser center of the Paris-Sud University. The flux of this laser has been measured with a calibrated detector to be in the range of 108–109 ph per pulse.16 By comparing the relative measurements performed with the same detector, we estimate that the flux of our VUV laser is at least 10 times higher (109–1010 ph per pulse).
2.2 Molecular beam and pulsed-field ionization spectrometer
The pulsed molecular beam is generated by an Amsterdam piezo valve (MassSpecpecD BV the Netherlands). The results obtained for CO2 and NO have been obtained by introducing diluted mixture of CO2 or NO (1–10%) in rare gas (argon or helium). The nozzle position can be 3D-adjusted with respect to the skimmer position which is fixed.The VUV laser crosses the molecular beam at a right angle inside the electrode stack of the spectrometer which is shielded by a mu-metal double tube to avoid the influence of stray magnetic fields on the electron trajectories. The pulsed electric-field sequences presented in this paper and applied to the electrode stack are generated by an arbitrary waveform generator (33250A, Agilent) and are synchronized to the nanosecond with a multi pulse delay generator (from ISMO electronic workshop). The influence of residual stray electric fields is neglected and will be investigated in future works. The ejected electrons are detected by a Micro-Channel-Plate detector (18-mm MCP detector assembly, Jordan) placed in front of the molecular beam. Note that with the same spectrometer, mass spectra can be recorded using pulsed-high-voltages (fast-high-voltage switch (Behlke) coupled with high voltage power supply (PS350, Standford Research Systems)). The output signal from the MCP detector is directly sent to an oscilloscope (WaveSurfer 10, Lecroy) without additional amplification.
3 Method principle and simulations
In this paper, we describe a way of recording and treating PFI-ZEKE PE spectra with “artificially”-increased statistics. This method is an extension of the procedure described by Hollenstein et al.9 along with a technique proposed by Reiser et al.2 and a data treatment procedure used in Slow PhotoElectron Spectroscopy (SPES).10In ref. 9, the authors compared the spectral resolution of PFI-ZEKE photoelectron spectra obtained using different sequences of pulsed electric fields. They very carefully tested standard and newly-designed sequences using experimental measurements and numerical simulations. In their paper, they proposed a pulsed sequence (Fig. 6a) of ref. 9) composed of a pre-pulse of 166 mV cm−1 followed by successive negative pulses from −75 mV cm−1 down to −161 mV cm−1 with −8.5 mV cm−1 steps, to access a very high selectivity in pulsed-field-ionization of high Rydberg states and thus the highest spectral resolution ever obtained in PFI-ZEKE spectroscopy, well below 0.1 cm−1 (0.06 and 0.055 cm−1 for argon and molecular nitrogen, respectively). The authors concluded that, in principle, one could make a sequence with even smaller steps to reach a spectral resolution that would no longer be limited by the electric field (and in particular with the very first negative pulse) but rather by other factors such as the laser bandwidth (0.008 cm−1 in their case), Doppler broadening,… Unfortunately, the resolution improvement is obtained at the expense of the signal intensity. In their Fig. 5, Hollenstein et al. presented the calculated and experimental spectra obtained with each negative pulse of the above sequence. One can see that the spectral resolution is quite similar for each pulse. Only a significant shift (the field-induced shift or “Stark shift”) is observed. Thus, it is possible to improve the signal-to-noise ratio by adding the spectra of several pulses following their own field-induced-shift correction. This method has already been used (see ref. 17 and 18 for instance) and is equivalent to an “artificial enhancement” of the statistics without increasing the real measurement statistics (average of multiple laser-shot measurements) and thus the measurement time.
In the present work, we extend this method to the following limit case. Instead of using successive negative pulses, we propose to use a linear ramp of negative electric field similar to the one used in the work of Reiser et al.,2 but still with a pre-pulse like in the work of Hollenstein et al.9
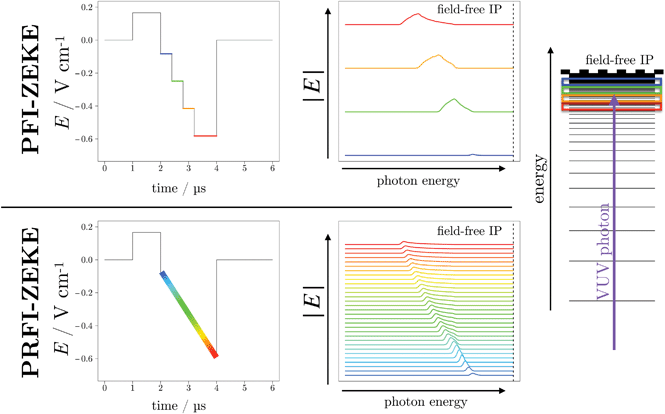
The PFI-ZEKE and PRFI-ZEKE methods are modeled and compared in Fig. 2 for a single ionizing transition. For each method, a typical pulse sequence is given (left-hand side of the upper and lower panel for the PFI and PRFI methods, respectively). On the right-hand side of these two panels, the calculated PFI signals are displayed employing the formula given in ref. 9 using only the second order of perturbation theory (here approximate calculations are sufficient for the description of principle). These plots should be considered as 2D matrices (x, y, z). The x axis is the photon energy, the y axis is the amplitude of the negative portion of the corresponding pulse sequence, and the z axis the intensity of the pulsed-field ionization. The position of the field-free ionization potential is reported as a dashed line. The right side of the figure is a “crude” illustration which describes the Rydberg-state selectivity in the pulsed-field-ionization. Depending on the electric-field amplitude, different “bunches” of Rydberg states located below the field-free ionization potential are ionized. Higher Rydberg states are ionized by weaker electric fields and vice versa.
In practice, for each photon energy of the excitation laser, a time-of-flight (TOF) of the ejected electrons by the pulsed-field ionization is acquired. If we refer to Fig. 2, this TOF would correspond to a slice of the 3D graph in the yz plane at a given x value (the corresponding photon energy). For the standard PFI-ZEKE method, the intensity of the TOF is integrated over time windows which encompass the signal generated by each negative pulse. For the PRFI-ZEKE method, we record the entire TOF and plot a 2D matrix for which the x axis is the photon energy, the y axis is the TOF and the z axis (matrix value) is the TOF intensity.
In the lower panel of Fig. 2, the pulsed-field-ionization signal has been simplified to several spectra as it would have been obtained using several small steps in the pulse sequence. Using a linear ramp implies having an infinite number of spectra. Note that in practice, the time resolution of the oscilloscope (which acquires the TOF), the waveform generator (which generates the ramp) and the matrix treatment (see later in the text) impose a finite number of spectra.
In Fig. 3, a more realistic matrix, that will be called “ZEKE matrix” has been modeled using the same procedure as in Fig. 2 (formula of ref. 9 up to the second order of perturbation theory) and assuming a photon resolution of 0.1 cm−1. In this figure, the TOF has been calibrated in electric-field strength (knowing the applied pulsed sequence and after a careful calibration of the electron TOF). As expected, the signal is curved (with a “comma” shape) signing the square-root trend of the ionization potential (IP) field-induced shift.9 In addition, one can easily see the asymmetric profile of the “comma” due to different field-ionization dynamics of the “red-” and “blue-shifted” Stark states (see ref. 9 for more details). It is quite easy to understand the evolution of the standard PFI-ZEKE signal with respect to pulsed-electric field by considering the ZEKE matrix. Indeed, the results obtained with the standard procedure can be obtained by integrating the matrix of Fig. 3 over a specific electric-field range. Thus, the higher the electric-field step, the higher the signal is albeit at the expense of the spectral resolution. Furthermore, the higher the centroid of the electric-field step, the higher the field-induced Stark shift is in the final photoelectron spectrum.
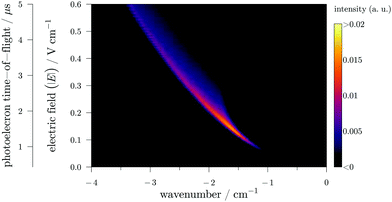 | ||
| Fig. 3 A calculated PRFI-ZEKE matrix for a single photoionizing transition. The x scale is the photon wavenumber with respect to the field-free adiabatic ionization potential. | ||
Here we propose to adopt a treatment procedure of the ZEKE matrix inspired by Slow PhotoElectron Spectroscopy.10 In the SPES technique the “photoelectron matrix” is the signal intensity (z axis) as a function of electron kinetic energy (y axis) and photon energy (x axis). Such a matrix is already linearized. To extract a photoelectron spectrum, the procedure consists in rotating this matrix and then in integrating over a kinetic energy range.
In PRFI-ZEKE, the ZEKE matrix differs by the y axis which is the time-of-flight of the electron. This matrix is linearized by applying a square-root function to the electric-field (y axis). As the field-induced Stark shift is proportional to the electric-field square root,9 this action results in the linearized matrix displayed in Fig. 4. Then, the straight diagonal corresponding to the “linearized comma” of Fig. 3 is fitted (white line in Fig. 4). The fitted diagonal is then used as a reference to rotate the matrix producing the matrix displayed in Fig. 5. The ionization threshold appears now as a vertical line.
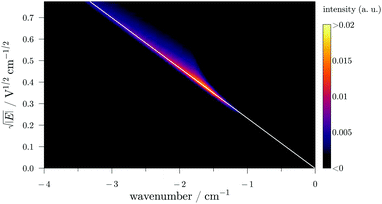 | ||
| Fig. 4 Linearized calculated PRFI-ZEKE matrix for a single photoionizing transition obtained by applying the square root function to the y axis of Fig. 3. The x scale is the photon wavenumber with respect to the field-free adiabatic ionization potential. | ||
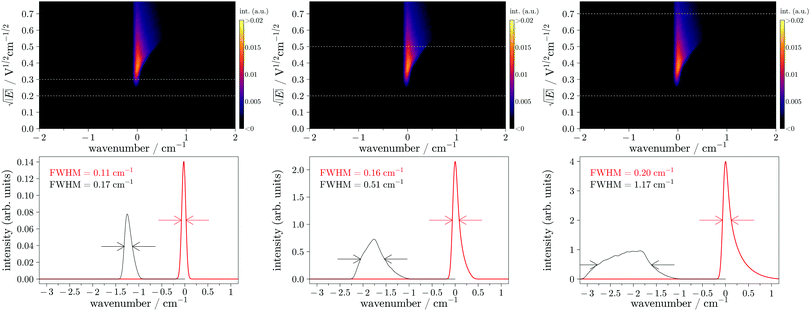 | ||
| Fig. 5 Rotated PRFI-ZEKE matrix for a single photoionizing transition (upper panels) obtained by rotating the matrix of Fig. 4 (the rotation implies the white diagonal line of Fig. 4 (not displayed here) to be vertical). The lower panels display the photoelectron spectra obtained by integrating the rotated matrix (upper panels) over the ranges delimited by the horizontal white dashed lines (in red) and the spectra obtained by the standard PFI-ZEKE technique with a pulsed electric field covering the equivalent electric field range (in black). | ||
From this latter matrix, one can extract a photoelectron spectrum by integrating the matrix over a given y axis range. The red spectra depicted in the lower panels of Fig. 5 have been obtained by integrating the rotated matrices of the upper panel over the ranges delimited by the two white dashed horizontal lines in the corresponding matrices. In this figure, the photoelectron spectra obtained by the standard PFI-ZEKE method using a step electric field (covering the same range as with the ramp) have been reported in black for comparison. These spectra can be obtained by integrating directly the matrix displayed in Fig. 3. At the beginning of the ramp (small electric field range below the amplitude of the pre-pulse), the simulation shows that the spectral resolution (0.11 cm−1) can get closer to the laser bandwidth (0.10 cm−1). By increasing the integrating region of the matrix, the signal strongly increases with a very slight loss in spectral resolution. The same arbitrary intensity scale has been used for the three graphs of Fig. 5. One can see that the intensity is increased by almost a factor of 30 whereas the spectral resolution is just multiplied by 2. The standard method does not exhibit the same evolution. The maximum of the photoelectron signal is just multiplied by about 12 and the resolution is much more deteriorated (from 0.17 to 1.18 cm−1). Note that in both methods the integral of the transition is the same but with the PRFI-ZEKE, the matrix treatment preserves the resolution and thus concentrates the photoelectron signal in a limited bandwidth. It is important to highlight that the spectral resolution can be smaller than the resolution limit (≈0.4 cm−1) obtained by Reiser et al.2 who also used a ramped electric field but without a pre-pulse (and without recording and analysing the ZEKE matrix). This limit was interpreted by Chupka19 by the ionization rate differences among the different Stark states of a given Rydberg state manifold. The use of the pre-pulse ahead the ramp should allow to reach very high spectral resolution close to the laser bandwidth (like in ref. 9 but with an improved sensitivity).
There is another important advantage in the PRFI-ZEKE method. The photoionizing transition in the final photoelectron spectrum is directly associated with the field-free ionization energy. Indeed, the field-induced shift is directly corrected by the matrix rotation. The choice of the rotation angle is essentially the same as fitting the slope to a field dependence of the ionization threshold shift in conventional PFI-ZEKE,9 and it contributes to the error bar of the energy scale.
4 Experimental results: proofs of principle
In this section, we present two different experimental measurements obtained with the PRFI-ZEKE method.4.1 PRFI-ZEKE of CO2
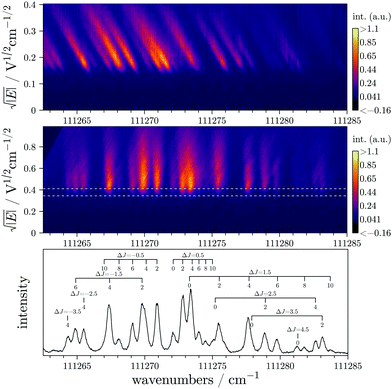
The rovibronic structure of CO+2 is well known.20–22 The CO2 molecule is thus a benchmark molecule for high resolution photoionization studies and has been studied quite extensively.18,23,24–28In Fig. 6, we present the experimental measurement of the X+2Πg,1/2(v+ = 0) ← X1Σ+g(v = 0) ionizing transition of CO2 obtained with the procedure described in the present paper. The ZEKE matrix has been recorded with statistics of only 50 laser shots per point (for each laser wavenumber). The entire measurement depicted in Fig. 6 corresponds to 1800 different laser wavenumbers and thus, has been recorded in just over one and a quarter hours.
The signal-to-noise ratio (SNR) is quite high even if the integrated window is kept quite narrow (see the two horizontal white dashed lines in the rotated linearized matrix of Fig. 6). A bigger window could improve the SNR even more without degrading the resolution too much but it was not necessary in this case. The spectral resolution of the spectrum is below 0.3 cm−1, and resolution down to 0.2 cm−1 has been achieved with NO. The spectral resolution depends on several parameters: the laser resolution, the y axis resolution of the matrix (i.e. the interpolation used for the electron time-of-flight to limit matrix size), and the matrix rotation (for the moment, we manually adjust the rotation by adjusting a line as the white line displayed in Fig. 4).
As mentioned in the previous section, one of the advantages of the PRFI-ZEKE method is that the transition energies in the final spectrum are directly the field-free energies. In order to validate the final energy scale obtained with the PRFI-ZEKE method, we compare adiabatic ionization energies extracted from PFI-ZEKE and PRFI-ZEKE techniques. In the standard PFI-ZEKE technique,9 one can record spectra with a pulse sequence composed of several electric field amplitudes and extrapolate the energy of a given transition to the zero-field limit. With the standard ZEKE method, we have measured the field-free energy of the X+2Πg,1/2(J+ = 1/2) ← X1Σ+g(J = 0) transition.11 The obtained value (111 271.75(30) cm−1) is compared to the corresponding transition energy obtained here with the PRFI-ZEKE method (111 272.14(60) cm−1). The PRFI-ZEKE value is a bit higher but the uncertainty is necessarily larger. The matrix rotation should lead to similar uncertainties as fitting the slope to a field dependence of the ionization threshold shift in conventional PFI-ZEKE as mentioned at the end of Section 3. However, in PRFI-ZEKE, the electron time-of-flight calibration is in fact an additional source of error. Despite this, we estimate that the uncertainty on the field-free energies obtained with the PRFI-ZEKE does not exceed 0.60 cm−1.
4.2 PRFI-ZEKE of NO
In this section, we illustrate the PRFI-ZEKE method with the example of NO in the vicinity of the X+1Σ+(v+ = 2) ← X2Π1/2(v = 0) photoionizing transition to show another aspect of this method. In the upper panel of Fig. 7, the corresponding PRFI-ZEKE matrix is depicted without any treatment (only a rough calibration of the electron time-of-flight has been performed). This matrix can be treated to obtain a photoelectron spectrum as in the previous section but the corresponding result is not presented here. Here we want to drive the attention of the readers on the vertical lines observed on the right side of the figure due to autoionization processes.29 The intensities of these vertical lines have been intentionally saturated in the upper panel of Fig. 7 to be able to easily see the left part of the figure which is similar to the CO2 case of the previous section. As the signals on the right side do not present any shift with the electric field, we can conclude that we are looking at autoionizations of neutral states. Note that in the SPES technique,10 autoionization processes also appear as vertical lines. To confirm this assumption, we compare this matrix (panel a) of Fig. 7) with a NO+ ion yield recorded with our setup by detecting the ions (panel b) of Fig. 7) and an absorption spectrum of NO which has been recorded with VUV FT spectrometer of the DESIRS beamline of the SOLEIL synchrotron (panel c) of Fig. 7).30,31 The vertical lines in the matrix appear precisely at the same wavenumbers where the ion yield and the absorption spectrum exhibit structures (see the asterisks in Fig. 7). Note that all the peaks of the ion yield are not present in the matrix. The ramp sequence used to record the matrix is composed of a pre-pulse of 166 mV cm−1 for 1 μs, followed by a ramp from −83 mV cm−1 to −1.33 V cm−1 during 4 μs. Three of the vertical lines in the matrix appear as soon as the electric field is in the right direction to send the electron towards the MCP detector. However, the one located at 79427.5 cm−1 appears after the electric field overtakes a certain value.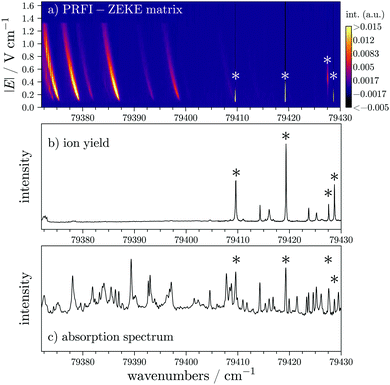 | ||
| Fig. 7 Comparison of the raw matrix obtained with a PRFI-ZEKE method (upper panel), an ion yield (middle panel), and an absorption spectrum31 (lower panel) of NO in the vicinity of the X+1Σ+(v+ = 2) ← X2Π1/2(v = 0) photoionizing transition. The color scale of the upper panel is arbitrary and has been saturated in order to see both autoionizing transitions through “isolated” neutral states (right side) and rotationally resolved photoelectron signals (left side). The peaks marked by an asterisk are common to the panels. | ||
The pulsed electric field used to extract the ions (≈200 V cm−1) is very high compared to the electric field ramp used to record the matrix. In addition, the ions are slow, compared to the electrons, to leave the extraction region without electric field (or with only eventual stray electric fields). Thus, in the case of the ion yield, the detection of autoionizing states is less selective than with the matrix. Indeed in the matrix, the fast autoionization processes cannot be detected as in conventional PFI-ZEKE and it seems that we can observe either slow autoionization or forced autoionization. In the case of slow photoionization, the process would be observed because the neutral Rydberg states involved would have long lifetime (several microseconds). In the case of forced autoionization, the ionizing field would have to reach a certain value to ionize towards a cationic state which is located slightly above the involved Rydberg state in the absence of the electric field.
In addition, a closer look at the far left part of the matrix displayed in Fig. 7, lets us think that the intensity of the “comma” which corresponds to a rotationally resolved photoionizing transition of NO is somehow affected by vertical lines, which might again sign some autoionization activity.
Further investigations are needed to fully understand and characterize the autoionization signatures in the matrix but the PRFI-ZEKE method might also be an interesting tool to study autoionization processes.
5 Conclusions and perspectives
In this paper, we propose a new approach to perform photoelectron spectroscopy inspired by the works of Reiser et al.2 and Hollenstein et al.9 in PFI-ZEKE spectroscopy and the treatment used in the Slow PhotoElectron Spectroscopy technique10. We succeeded in experimentally applying this method to two different systems: CO2 and NO.This method, called here PRFI-ZEKE spectroscopy, presents the following advantages:
• improvement of the signal-to-noise ratio of the photoelectron spectrum with a very limited degradation of the spectral resolution (which allows a faster measurement for unstable species, such as free radicals),
• possibility to extract different spectra with different resolution and different signal-to-noise ratios from a single measurement,
• direct field-free-energy determination of the observed transitions, and
• observation of specific autoionization processes.
In the present paper, the experimental measurements have been performed with a VUV laser spectral resolution of about 0.1–0.2 cm−1. As the use of a ramp after the pre-pulse seems to act as an infinity of steps (extension of the pulse sequence given in ref. 9), it would be interesting to use the PRFI-ZEKE method with a higher resolution VUV laser such as the one of ref. 12. The integration of the rotated matrix might allow to reach a higher resolution keeping a reasonable signal-to-noise ratio.
We are still working on this method and some tests have to be performed to fully control the effect of several parameters on the acquisition procedure (ramp speed, necessary time resolution of the electron time-of-flight,…) as well as on the data treatment (image interpolation, electron time-of-flight calibration,…). These tests will be essential to give reliable error bars on the field-free-energy measurements and fully understand the intensities of the transitions which might differ from the standard PFI-ZEKE technique or the different possible signatures of autoionization processes as highlighted in the present paper through the example of the NO radical.
Conflicts of interest
There are no conflicts to declare.Acknowledgements
The authors acknowledge U. Hollenstein (Physical Chemistry Laboratory, ETH Zürich) and M. Broquier (Institut des Sciences Moléculaires d'Orsay, Université Paris-Saclay) for very useful discussions about the conception and the construction of the VULCAIM setup, and G. A. Garcia. (SOLEIL synchrotron) about the data treatment procedure. The authors also thank C. Alcaraz (Institut de Chimie Physique, Université Paris-Saclay) for lending his PFI-ZEKE spectrometer, A. Heays (J. Heyrovský Institute of Physical Chemistry) for sharing his NO absorption spectrum (analysis under progress) and the technical staff at ISMO for their valuable assistance. This work has received financial support from the French “Agence Nationale de la Recherche” (ANR) under Grant No. ANR-17-CE30-0031-01 (Project PRIMA). This work has also received financial support from the “Institut de Physique” (INP) of CNRS, from Paris Île-de-France Region (DIM ACAV and DIM ACAV+) and from the University of Paris-Saclay (Labex PALM). This work was supported by the Programme National “Physique et Chimie du Milieu Interstellaire” (PCMI), the “Programme National de Planétologie” (PNP) and the “Commission Spécialisée Astronomie-Astrophysique” (CSAA) of CNRS/INSU with INC/INP cofunded by CEA and CNES.Notes and references
- K. Müller-Dethlefs, M. Sander and E. W. Schlag, Chem. Phys. Lett., 1984, 112, 291–294 CrossRef.
- G. Reiser, W. Habenicht, K. Müller-Dethlefs and E. W. Schlag, Chem. Phys. Lett., 1988, 152, 119–123 CrossRef CAS.
- K. Müller-Dethlefs and E. W. Schlag, Annu. Rev. Phys. Chem., 1991, 42, 109–136 CrossRef.
- F. Merkt and T. P. Softley, Int. Rev. Phys. Chem., 1993, 12, 205–239 Search PubMed.
- E. W. Schlag, ZEKE Spectroscopy, Cambridge University Press, Cambridge, UK, Cambridge edn, 1998 Search PubMed.
- C. E. H. Dessent and K. Müller-Dethlefs, Chem. Rev., 2000, 100, 3999–4022 CrossRef CAS PubMed.
- C.-Y. Ng, Annu. Rev. Phys. Chem., 2002, 53, 101–140 CrossRef CAS PubMed.
- F. Merkt, S. Willitsch and U. Hollenstein, in Handbook of High-Resolution Spectroscopy, ed. M. Quack and F. Merkt, Wiley & Sons, Chichester, UK, 2011, vol. 3, pp. 1617–1654 Search PubMed.
- U. Hollenstein, R. Seiler, H. Schmutz, M. Andrist and F. Merkt, J. Chem. Phys., 2001, 115, 5461–5469 CrossRef CAS.
- J. C. Poully, J. P. Schermann, N. Nieuwjaer, F. Lecomte, G. Gregoire, C. Desfrancois, G. A. Garcia, L. Nahon, D. Nandi, L. Poisson and M. Hochlaf, Phys. Chem. Chem. Phys., 2010, 12, 3566–3572 RSC.
- O. J. Harper, PhD thesis, Université Paris-Saclay, 2020 Search PubMed.
- U. Hollenstein, H. Palm and F. Merkt, Rev. Sci. Instrum., 2000, 71, 4023–4028 CrossRef CAS.
- N. Lamarre, B. Gans, C. Alcaraz, B. C. de Miranda, J.-C. Guillemin, M. Broquier, J. Liévin and S. Boyé-Péronne, Mol. Phys., 2015, 113, 3946–3954 CrossRef CAS.
- B. K. Cunha de Miranda, PhD thesis, Université Paris-Sud 11 (Orsay) and Universidade Federal Fluminense (Niterói), 2011 Search PubMed.
- F. Merkt, A. Osterwalder, R. Seiler, R. Signorell, H. Palm, H. Schmutz and R. Gunzinger, J. Phys. B: At., Mol. Opt. Phys., 1998, 31, 1705–1724 CrossRef CAS.
- C. Alcaraz, V. Carniato, F. Lecadre, P. Çarçabal, M. Broquier, C. Dedonder-Lardeux and C. Jouvet, UVX 2008 - 9e Colloque sur les Sources Cohérentes et Incohérentes UV, VUV et X: Applications et Développements Récents, Les Ulis, France, 2009, pp. 1–6 Search PubMed.
- B. Gans, G. Grassi and F. Merkt, J. Phys. Chem. A, 2013, 117, 9353–9362 CrossRef CAS.
- U. Hollenstein, K. Dulitz and F. Merkt, Mol. Phys., 2019, 117, 2956–2960 CrossRef CAS.
- W. A. Chupka, J. Chem. Phys., 1993, 98, 4520–4530 CrossRef CAS.
- D. Gauyacq, M. Horani, S. Leach and J. Rostas, Can. J. Phys., 1975, 53, 2040–2059 CrossRef CAS.
- D. Gauyacq, C. Larcher and J. Rostas, Can. J. Phys., 1979, 57, 1634–1649 CrossRef CAS.
- T. J. Sears, Mol. Phys., 1986, 59, 259–274 CrossRef CAS.
- H. H. Fielding, T. P. Softley and F. Merkt, Chem. Phys., 1991, 155, 257–265 CrossRef CAS.
- F. Merkt, S. R. Mackenzie, R. J. Rednall and T. P. Softley, J. Chem. Phys., 1993, 99, 8430–8439 CrossRef CAS.
- R. T. Wiedmann, M. G. White, H. Lefebvre-Brion and C. Cossart-Magos, J. Chem. Phys., 1995, 103, 10417–10423 CrossRef CAS.
- J. Liu, W. Chen, C.-W. Hsu, M. Hochlaf, M. Evans, S. Stimson and C. Y. Ng, J. Chem. Phys., 2000, 112, 10767–10777 CrossRef CAS.
- P. Rupper and F. Merkt, Rev. Sci. Instrum., 2004, 75, 613–622 CrossRef CAS.
- F. J. Furch, S. Birkner, J. H. Jungmann, F. Kelkensberg, C. P. Schulz, A. Rouzée and M. J. J. Vrakking, J. Chem. Phys., 2013, 139, 124309 CrossRef PubMed.
- Y. Ono, S. H. Linn, H. F. Prest, C. Y. Ng and E. Miescher, J. Chem. Phys., 1980, 73, 4855–4861 CrossRef CAS.
- N. de Oliveira, M. Roudjane, D. Joyeux, D. Phalippou, J.-C. Rodier and L. Nahon, Nat. Photonics, 2011, 5, 149–153 CrossRef CAS.
- A. Heays, Private communication.
| This journal is © the Owner Societies 2022 |

