Intrachain photophysics of a donor–acceptor copolymer†
Hak-Won
Nho‡
ab,
Won-Woo
Park‡
a,
Byongkyu
Lee‡
c,
Seoyoung
Kim
c,
Changduk
Yang
 *c and
Oh-Hoon
Kwon
 *ab
*ab
aDepartment of Chemistry, College of Natural Sciences, Ulsan National Institute of Science and Technology (UNIST), Room 415, Advanced Material Research Building (103), 50 UNIST-gil, Eonyang-eup, Ulju-gun, Ulsan 44919, Republic of Korea. E-mail: ohkwon@unist.ac.kr
bCenter for Soft and Living Matter, Institute for Basic Science (IBS), Ulsan 44919, Republic of Korea
cDepartment of Energy Engineering, School of Energy and Chemical Engineering, Perovtronics Research Center, Low Dimensional Carbon Materials Center, Ulsan National Institute of Science and Technology (UNIST), Room 701-4, 2nd Engineering Building (104), 50 UNIST-gil, Eonyang-eup, Ulju-gun, Ulsan 44919, Republic of Korea. E-mail: yang@unist.ac.kr
First published on 6th December 2021
Abstract
By taking advantage of bulk-heterojunction structures formed by blending conjugated donor polymers and non-fullerene acceptors, organic photovoltaic devices have recently attained promising power conversion efficiencies of above 18%. For optimizing organic photovoltaic devices, it is essential to understand the elementary processes that constitute light harvesters. Utilising femtosecond-resolved spectroscopic techniques that can access the timescales of locally excited (LE) state and charge-transfer (CT)/-separated (CS) states, herein we explored their photophysics in single chains of the top-notch performance donor–acceptor polymer, PM6, which has been widely used as a donor in state-of-the-art non-fullerene organic photovoltaic devices, in a single LE state per chain regime. Our observations revealed the ultrafast formation of a CT state and its equilibrium with the parent LE state. From the chain-length dependence of their lifetimes, the equilibrated states were found to idle until they reach a chain folding. At the chain folding, the CT state transforms into an interchain CT state that bifurcates into forming a CS state or annihilation within a picosecond. The observation of prevalent nonexponential behaviour in the relaxation of the transient species is attributed to the wide chain-length distribution that determines the emergence of the chain foldings in a single chain, thus, the lifetime of a LE and equilibrated CT states. Our findings indicate that the abundance of chain folding, where the generation of the “reactive” CS state is initiated from the interchain CT state, is essential for maximising charge carriers in organic photovoltaic devices based on PM6.
1. Introduction
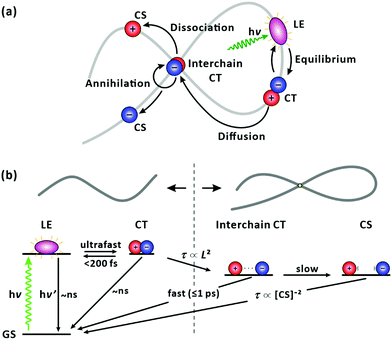
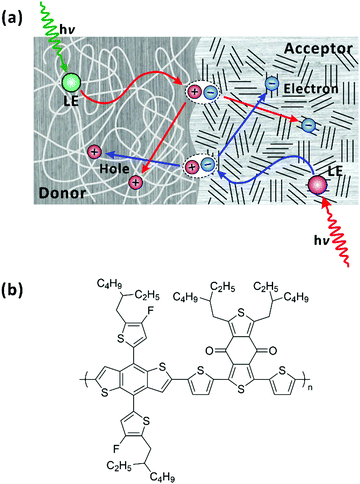
While being of fundamental interest for the past several decades,1–10 the photoinduced dynamics in conjugated polymers has become a prominent topic for application in photovoltaics.11–14 In bulk-heterojunction organic photovoltaic devices, in which conjugated polymer donors are blended with organic acceptors to form interconnecting domains in a thin film, the conversion of light into electricity requires a complicated interplay among the functional constituents, light harvesting and charge separating/transporting, occurring across broad spatiotemporal scales.15 Developing donor−acceptor (D–A) alternating conjugated polymers is a useful strategy for preparing high efficiency donor materials, since the energy levels can be easily tuned by choosing different electron-affinity units.16–18 By significantly extending the solar spectral range beyond those of organic photovoltaic systems with fullerene acceptors, the performance of organic photovoltaic devices based on non-fullerene acceptors19–28 has been recently improved, reaching power conversion efficiencies higher than 18%.29,30According to the general picture, locally excited (LE) states (strongly bound Frenkel excitons) are first generated in individual polymer chains upon photoexcitation. As a secondary process, charge-transfer (CT) state also referred to as polaron pairs, are formed because the low dielectric constants of organic media hamper charges to escape from the Coulomb interaction at room temperature.31,32 CT states with a lower binding energy separate into charge-separated (CS) states effectively at interfaces with smaller energy offsets.33,34 The molecular packing of donor polymers and acceptors, their arrangement at the interface, and phase segregation have been well documented to determine the charge separation and transport processes; refer to Fig. 1(a).35–40 The charge transfer has been reported to occur at donor–acceptor interfaces much faster than those within a single polymer chain (intrachain).41 Accordingly, the charge transfer at the D–A interfaces has been often related to the overall power conversion efficiency of the device while the effects of the intrinsic properties of individual polymer chains, including the structure, energetics, and exciton/charge-carrier dynamics, on device performance are veiled. To further enhance the performance of bulk-heterojunction organic photovoltaic devices it would be beneficial to understand the underlying, but overlooked, ultrafast charge-transfer and charge-separation dynamics of well-defined polymer donors (or acceptors) in isolated conditions, which are free from the prevailing events at the interfaces.
In this study, we explored femtosecond-resolved photoinduced dynamics within a single chain (in solution) of a D–A polymer. The D–A polymer of PM6 has been widely used as a donor in non-fullerene organic photovoltaics, which achieve the power conversion efficiencies higher than 18%.29,30 The chemical structure of PM6 is shown in Fig. 1(b). Recently, few studies using the transient-absorption (TA) spectroscopy focused on the dynamics of the LE and CT states, of pristine PM6 for designing optimal bulk-heterojunction organic photovoltaic devices.42,43 An interchain CT state were observed and proposed as the main annihilation source of the LE and CT states. In this contribution, we investigate the interplay among LE, intrachain CT, and interchain CT states and diffusion of the energy/charge-carrying states towards a CS state along the single chain of PM6. For this study, we used fluorescence-upconversion (FU) spectroscopy, time-correlated single-photon counting (TCSPC), and broadband (visible to near-infrared) TA. While FU spectroscopy is sensitive to emitting states, i.e., LE state, TA measurements allow us to monitor the elementary evolution of LE state and preferentially charge carriers (CT and CS states). By comparing the results of the two complementary experiments, we were able to correlate the dynamics among the transient species and establish their chemical kinetics. In addition, by performing a global lifetime analysis on the TA spectra, we resolved the spectral fingerprints of the LE, CT, and CS states and ascribed their apparent nonexponential relaxation to the heterogeneity in the chain length. In addition, we found that the steady-state photoluminescence (PL) is dominated by the PL of minor conformations that are not conducive to charge transfer.
2. Experimental
2.1 Materials
PM6 polymers with four different number average molecular weights (Mn = 14.9, 17.5, 31.9, and 40.3 kDa) were synthesized and purified following the reported procedure with the varied polymerization times.44 The PM6 polymers were dissolved for the stock solution usage in 4.1 mg mL−1 chloroform (CHCl3); the concentrations (1.5 μg mL−1–0.53 mg mL−1) were controlled for spectroscopic measurements at room temperature.2.2 Measurements
2.3 Data analyses
The obtained kinetic profiles were fitted to multiexponential functions or stretched exponential functions, I(t) or ; β ≤ 1, convoluted with the IRFs using software (Igor, WaveMetrics; Fluofit, PicoQuant). Global analyses of TA spectra were performed with using a software (CarpetView, Light Conversion).
3. Results and discussion
3.1 Luminescent species in solutions
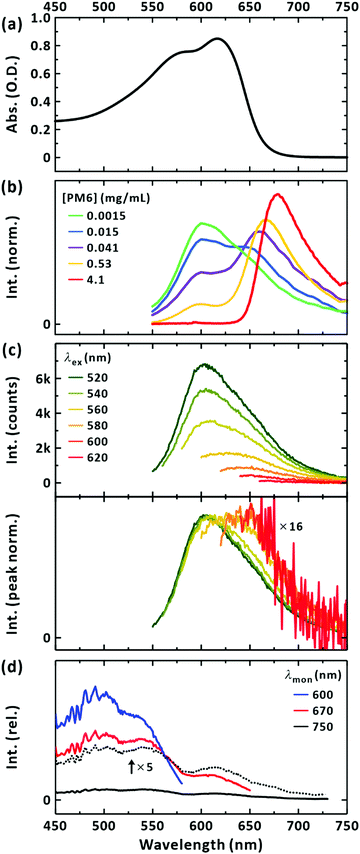
The steady-state absorption, PL, and excitation spectra for the PM6 (Mn = 40.3 kDa) chloroform solution are plotted in the same spectral window for a clear comparison (Fig. 2). The absorption spectrum of the PM6 solution did not change in shape when the concentration was progressively diluted (Fig. S1(a), ESI†). This indicates that the polymer chains were well separated for concentrations up to at least 0.1 mg mL−1. The PL spectrum of the sample (excited at 520 nm) is presented in Fig. 2(b). When the concentration of PM6 was the lowest ([PM6] = 1.5 μg mL−1) a PL band with the peak at approximately 600 nm was obtained. This apparently seems to disobey Kasha's rule because the lowest absorption occurs with a peak at 620 nm. This implies that the steady-state PL with a peak at 600 nm may originate from a minor species, but long-lived in the excited state, absorbing light below 600 nm. With an increase in concentration, there appeared a two-band feature with peaks at 600 and 650 nm. Further increase of the concentration suppressed the intensity of the band structure at 600 nm; see Fig. S1(b) (ESI†). Since the dip located between the two peaks in the PL spectra across the concentrations (1.5 μg mL−1–0.53 mg mL−1) coincides with the position of the lowest-energy peak in the absorption spectrum (Fig. 2(a)), and that the peak positions of the PL spectra of highly concentrated solutions match the onset of the absorption spectrum, we conclude that the vibronic-like structure in the PL spectra results from the self-absorption. It follows that the steady-state PL spectra of PM6 in CHCl3 intrinsically feature a single-band with a peak at 600 nm. As a control, we also measured the PL spectra with different path lengths of photoexcitation (Fig. S1(c), ESI†). With a longer path length, self-absorption was evident for the 600 nm band. We note that if self-absorption prevails, for example, at [PM6] = 4.1 mg mL−1 in Fig. 2(b), the PL spectrum is distorted and a peak at 680 nm appears, as widely reported in the literature.42,43,45–48It is surprising that the steady-state PL band is located at a higher energy than the lowest absorption band. This indicates that the emitting species, excited at 520 nm, is not the major conformation absorbing light at 620 nm, but the minor one that is excited with higher energy. To confirm this, we measured the PL spectra with a series of excitation wavelengths. Fig. 2(c) shows that upon excitation at longer wavelengths (with lower energies) approaching the maximum absorption wavelength, the intensity of the steady-state PL greatly decreased; when the excitation wavelength was changed from 520 nm to 620 nm, the intensity was reduced by approximately 16-fold. In addition, the normalised PL spectra show the bathochromic shift of the peak wavelengths from 600 nm to approximately 650 nm. It follows that the major species of PM6 in CHCl3 are short-lived and/or weakly radiative.
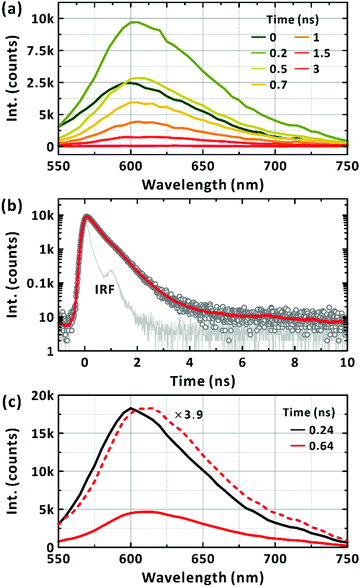
Fig. 2(d) presents the excitation spectra of the minor conformations. The peak corresponding to the maximum absorption wavelength of the minor conformations, but dominating the steady-state PL spectrum, was located at approximately 500 nm. With increasing the monitored wavelength, in the excitation spectra the additional band at around 630 nm corresponding to the absorption maximum of PM6 appears. Thus, we infer that the PL from the major conformation is short-lived and locates at above 700 nm (see below). Considering the higher, electronic transition energy and the longer survival of the LE state, as witnessed from PL intensity, we infer that the minor conformations are highly bent ones with limited π-conjugation across the chromophoric moiety and suppressed formation of the CT state as a result. By exciting the minor conformations at 510 nm, the picosecond-resolved PL spectra were obtained (Fig. 3(a)). At the peak wavelength of 600 nm, the LE state decayed on two timescales: 340 ± 10 ps and 650 ± 20 ps (Fig. 3(b)). To check for the coexistence of different long-lived conformers, we constructed lifetime-associated spectra with two global time constants as shown in Fig. 3(c). The deconvoluted spectra show slightly different peak wavelengths indicating the possible coexistence of two representative bent conformations in the ground state, which do not undergo interconversion within their excited-state lifetimes.
3.2 Charge transfer
To track the ultrafast photophysics of PM6 single chains, we measured the femtosecond-resolved TA spectra with excitation at 570 nm, at which the excitation of the trace species is minimised. Since TA spectroscopy records ground-state bleach (GSB), stimulated emission (SE), and photoinduced absorption (PIA), it reveals the generation and relaxation of the LE, CT, and CS states and charge carriers. The fluence was chosen to generate one or fewer LE state per chain (Fig. S2, ESI†).The TA spectra in Fig. 4(a) show a GSB band that mirrors the absorption spectrum in Fig. 2(a); the TA spectra for the full time window is presented as a 2D map in Fig. S3 (ESI†). In addition, there is a broad PIA above 670 nm extending beyond 1300 nm. The two band features of the PIA centred at approximately 900 nm and 1200 nm have been reported to originate from the absorption of the CT and LE states, respectively.42,43 Accordingly, we analysed the TA kinetic profiles at several representative wavelengths of 635 nm, 730 nm, 900 nm, and 1200 nm without invoking a chemical kinetics model as shown in Fig. 4(b). All the transients were fitted to the sum of the exponential functions with the time constants listed in Table 1; five time constants were necessary to fit the transients across the spectral range of our experiments. When the GSB band was inspected, the ground state was found to replenish on the timescales of 270 ± 13 fs (27.5 ± 0.8%), 3.0 ± 0.1 ps (17.1 ± 0.4%), 34 ± 1 ps (25.9 ± 0.4%), 211 ± 7 ps (23.1 ± 0.4%), and 3154 ± 197 ps (6.5 ± 0.2%). The two transients monitored at the representative bands for PIA showed similar nonexponential behaviours.
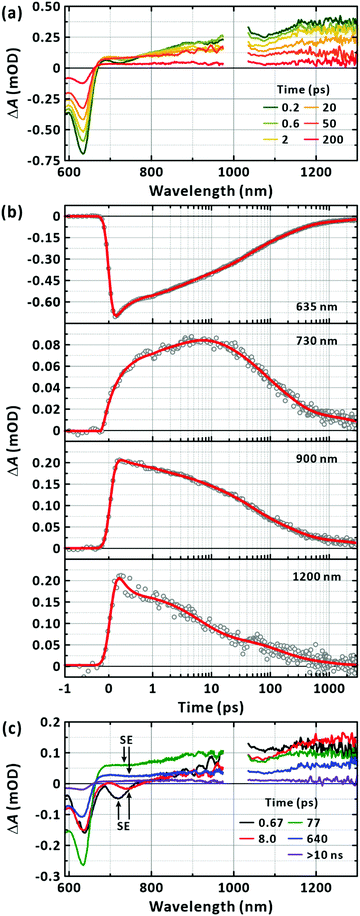 | ||
| Fig. 4 Transient-absorption (TA) spectroscopy of PM6 in the CHCl3. (a) TA spectra obtained with the excitation at 570 nm. Mn = 40.3 kDa. [PM6] = 15 μg mL−1. Representative time delays are given in the panel (two-dimensional TA map is in the ESI,† Fig. S3). (b) TA kinetic profiles. Probed wavelengths are given in the corresponding panels. Multi-exponential fits are also given in solid lines. (c) Lifetime-associated TA spectra. Global lifetime analysis is performed with five time constants. Time constants for the corresponding deconvoluted spectra are given in the panels. | ||
| λ mon (nm) | A 1 (%) | τ 1 (ps) | A 2 (%) | τ 2 (ps) | A 3 (%) | τ 3 (ps) | A 4 (%) | τ 4 (ps) | A 5 (%) | τ 5 (ps) |
|---|---|---|---|---|---|---|---|---|---|---|
| a Amplitude of a decay component. b Lifetime of a decay component. c The errors were obtained from the fitting procedures. | ||||||||||
| 635 | −27.5 ± 0.8c | 0.27 ± 0.01 | −17.1 ± 0.4 | 3.0 ± 0.1 | 25.9 ± 0.4 | 34.0 ± 1.1 | −23.1 ± 0.4 | 211 ± 7 | −6.5 ± 0.2 | 3154 ± 197 |
| 730 | −51.5 ± 6.8 | 0.38 ± 0.07 | −26.3 ± 3.9 | 3.3 ± 1.0 | 31.7 ± 8.0 | 44.1 ± 14.5 | 49.7 ± 8.3 | 195 ± 36 | 18.6 ± 1.8 | 4438 ± 1080 |
| 900 | 3.8 ± 4.5 | 0.58 ± 0.97 | 16.7 ± 4.4 | 3.0 ± 1.1 | 36.8 ± 2.4 | 37.1 ± 4.7 | 31.9 ± 2.4 | 225 ± 28 | 10.8 ± 1.1 | 4397 ± 1060 |
| 1200 | 23.4 ± 5.1 | 0.56 ± 0.26 | 43.8 ± 3.9 | 7.2 ± 1.6 | 20.0 ± 8.7 | 114.2 ± 71.5 | 12.9 ± 9.8 | 553 ± 384 | ||
The GSB, PIA, and SE bands are generally superimposed across the monitored wavelengths, complicating the interpretation of the observation with multiple time constants. To reduce uncertainty in determining the multitude of time constants and relate the components to each other, we performed a global lifetime analysis to fit the TA spectra for the whole spectral and temporal ranges as presented in Fig. 4(c).49 To cross-check the validity of the global analysis, we inspected the quality of the temporal fit at each wavelength and the spectral fit at each time (Fig. S4, ESI†). At least five global lifetimes were necessary for the successful fit results. The results are summarised as follows: first, the whole TA spectra were represented with five global time constants of 670 fs, 8 ps, 77 ps, 640 ps, and longer than 10 ns; second, all five lifetime-associated spectra in Fig. 4(c) showed strongly negative GSB recovery and positive PIA to near-infrared region; third, negative-going band features were clearly observed with the peaks at 720 nm and 740 nm for the 670 fs and 8 ps components, respectively. Based on the well-defined band feature, which has tails to lower energies, but does not cover the entire spectral range for the positive PIA, we attribute these bands to SE from the LE state. The lifetime-associated spectra for the 77 ps and 640 ps components also showed a weak, basin-like feature with a minimum at approximately 750 nm.
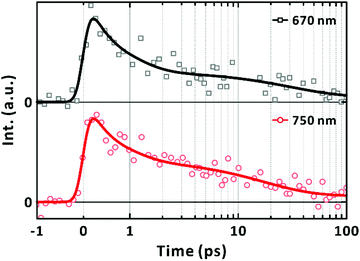
Complementary time-resolved PL measurements using FU spectroscopy unequivocally reveal the lifetime of the LE state because LE states are emissive. When excited at 570 nm, the PL signal at 670 nm was found to decay mainly in 700 ± 200 fs (Fig. 5). The prevalent short-lived component is unequivocally assigned to the relaxation of the LE state. The rest of the signals decayed with a time constant of 29 ± 19 ps with a trace signal (less than 7% of the total) persistent on the timescale of 100's ps. The time constants extracted from the fits to the exponential functions are summarised in Table 2. The major decay time (700 fs) of the PL kinetic profile in Fig. 5 coincides with the relaxation time (670 fs) of the SE band with the peak at 720 nm, as shown in Fig. 4(c). We note that the contribution of the 10's ps and 100's ps components increased to 40% of the total signal when the FU signals were collected at 750 nm. This agrees with the bathochromic shift of the SE bands with longer lifetimes (Fig. 4(c)). Finally, we also note that the short-lived PL of single-chain PM6 is located mainly in the range of 700–800 nm as revealed from the spectral feature of SE in the lifetime-associated TA spectra in Fig. 4(c).
| λ mon (nm) | A 1 (%) | τ 1 (ps) | A 2 (%) | τ 2 (ps) | A 3 (%) | τ 3 (ps) |
|---|---|---|---|---|---|---|
| a Amplitude of decay components. b Lifetime of the decay component. c Errors were obtained from fitting procedures. d The longest time constants were fixed as the weighted average time from Fig. 3(b). | ||||||
| 670 | 72.1 ± 9.0c | 0.68 ± 0.16 | 21.1 ± 4.6 | 29.3 ± 18.5 | 6.8 ± 4.8 | >400d |
| 750 | 60.7 ± 9.0 | 0.61 ± 0.17 | 31.9 ± 3.6 | 17.1 ± 5.0 | 7.4 ± 2.2 | >400d |
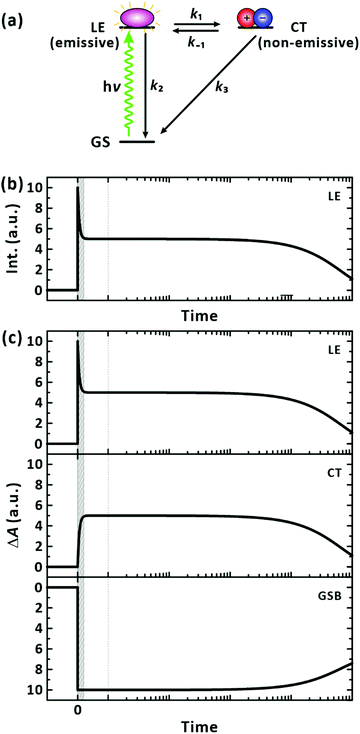
Considering that negative-going signals in the lifetime-associated spectra correspond to SE, and no negative band features appeared in the fingerprint region of the CT state in Fig. 4(c), which typically signifies kinetic entanglement among different transient species, we infer that the different time components originate from independent processes occurring in parallel upon photoexcitation. Moreover, the CT state and their precursors (the LE state) seem to establish an ultrafast equilibrium within the IRF of 200 fs from their coexistence at time zero in our measurements. In this scenario, the lifetime component of the CT state is subject to appear also for the LE state band. The ultrafast decay and rise components for the LE and CT states, respectively, which are related to their interconversion, were unresolvable. Using the simple two excited-states model in Fig. 6(a), we simulated the expected signals arising from the TA and FU measurements for the LE and CT states. According to the model, the decay of the FU signals representing the lifetime of the LE state, the decay of the PIA signals for the LE and CT states, and the recovery of the GSB signals by the recombination of the LE and CT states share a common time constant in the time range beyond the IRF. The simulation qualitatively reproduced our experimental results well, as presented in Fig. 6(b), validating the chemical kinetics based on the pre-equilibrium between the LE and CT states. In a poly(3-hexylthiophene) (P3HT), the equilibrium of an LE and CT states has been recently reported to establish driven by a coherent transition between them within 20 fs.50 Ultrafast equilibration between the LE and CT states has been observed for the same and other polymers.11,50–52 From the observation that the steady-state PL is overwhelmed by the PL of the trace conformers as shown in Fig. 2, we infer that the relaxation of the CT state is more facile than that of the LE state in equilibrium, resulting in weak PL in the steady state.
3.3 Charge separation
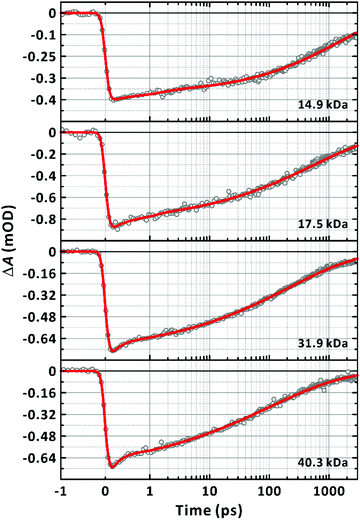
The series of parallel processes on a multitude of timescales may originate from the different combinations of the rotational conformation among the donor and acceptor units in a chain or from the distribution of a chain length that may affect the relaxation of a LE state and the associated CT state in a chain. To resolve this, we performed TA measurements for Mn values in the range of 14.9 kDa to 40.3 kDa, because the latter case is subject to depend on the length, while the former is not. The strong dependence of the relaxation of the LE and CT states on the chain length is clearly shown in Fig. 4 and Fig. S5–S7 (ESI†). These results rule out the effect of the distribution of the rotational conformation (torsional angle) among adjacent donor and acceptor units on the dynamics. From the global analyses, it was found that fewer number of time components were sufficient to fit the TA spectra for shorter chains. It follows that the multiple time components represent, parallel relaxations of different rate resulting from the distribution of the chain length.The stretched-exponential fit procedure is often applied to characterise inhomogeneous systems,53,54 and employs the Kohlrausch-Williams-Watts function as follows:
 | (1) |
| M n (kDa) | ΔA1a (mOD) | τ str (ps) | β | ΔA2a (mOD) | τ uf (ps) | PDIe |
|---|---|---|---|---|---|---|
| a Amplitude of decay components. b Lifetime of the stretched-exponential decay component. c Heterogeneity parameters. d Lifetime of ultrafast exponential decay component. e Polydispersity index. f Errors were obtained from fitting procedures. | ||||||
| 14.9 | −0.37 ± 0.00f | 1410 ± 40 | 0.46 ± 0.01 | −0.04 ± 0.00 | 1.12 ± 0.26 | 2.18 |
| 17.5 | −0.82 ± 0.01 | 554 ± 20 | 0.38 ± 0.01 | −0.13 ± 0.11 | 0.62 ± 0.11 | 3.4 |
| 31.9 | −0.73 ± 0.01 | 207 ± 5 | 0.36 ± 0.01 | −0.13 ± 0.04 | 0.26 ± 0.04 | 2.91 |
| 40.3 | −0.73 ± 0.01 | 99 ± 5 | 0.33 ± 0.01 | −0.17 ± 0.03 | 0.18 ± 0.03 | 3.22 |
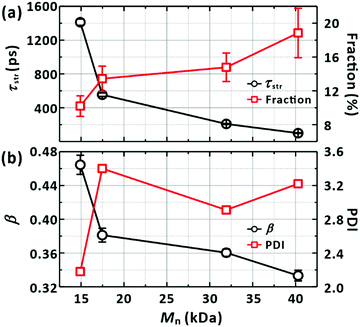 | ||
| Fig. 8 Dependence of the LE/CT state lifetime on the properties of a PM6 chain. (a) Average lifetimes (τstr from Fig. 7) against the molecular weights (Mn) of chains. The fractions of the ultrafast recombination component (ΔA2 in Fig. 7) are also depicted, as listed in Table 4. (b) Distributions of the lifetime against Mn. The parameter in the stretched-exponential fit functions is used to represent the distributions. Polydispersity indices (PDI) of the chains (Table 4) are also given to highlight the correlation between the distributions of the lifetimes and the PDI. | ||
The acceleration of quenching LE and CT states has been reported to occur via singlet–singlet annihilation under a high fluence of photoexcitation.42,55 This scenario does not apply to our case because we chose an excitation fluence that does not populate more than one LE state per chain. Specifically, the typical fluence of 4 μJ cm−2 in our study corresponds to a flux of 1.1 × 1013 cm−2. The concentration of 15 μg mL−1 for the longest-chain sample (Mn = 40.3 kDa) translates into 5.6 × 10¹⁰ chains per excitation volume. Considering the absorbance of 0.14 (path length = 2 mm) at the excitation wavelength of 570 nm, therefore, approximately one out of 14 chains absorbs a photon. This excludes the quenching of the LE or CT states by the bimolecular process; the GSB recovery for the longest chain was independent of the fluence, confirming that the bimolecular annihilation process was not operative under our experimental conditions (Fig. S2, ESI†).
With an increase in chain length, there is a higher chance of forming a chain folding. At the chain folding, a LE state (or a CT state) splits into a CT state with the charges on different sections of the chain, i.e., an interchain CT state (Fig. 9(a)). The interchain CT state quickly annihilates (crosses back onto the ground state) with a chance of being split into a long-lived, CS state (isolated charges on the chain).43 Indeed, we observed an increase in the fraction of the ultrafast (≤1 ps) recovery component of GSB with increasing chain length as shown in Fig. 8(a). We attribute the ultrafast component to the annihilation of the interchain CT state formed from the LE state generated at the chain folding upon photoexcitation, which competes with forming CS state. In a film, in which PM6 polymer chains are packed and entangled that chain foldings are prevalent, the LE state was found to dissociate to form the CS state in sub-picoseconds via the interchain CT state (Fig. S9, ESI†), which is consistent with a previous report.56 The configuration of the chain folding seems to be strong π–π stacking considering the timescale of the interchain CT annihilation. In addition, for long chains, a long-lifetime component (≥10 ns) without any trace of SE started to emerge in the lifetime-associated spectra (Fig. 4(c) and Fig. S5–S7, ESI†). The long-lifetime component with a featureless broad PIA is ascribed to the CS state. Under this scheme, as illustrated in Fig. 9, the lifetime of the LE state, initially generated in the chain, becomes shorten if the equilibrated LE and CT states diffuse to the folding and immediately transform into the short-lived interchain CT state. Accordingly, the lifetime reduction is expected to be greater for longer chains because the longer chains pose more chain foldings (or higher probability of forming the chain folding). The trend shown in Fig. 8(a) supports our interpretation.
The lifetime reduction of the LE/CT state with the chain length can be related to the average displacement (L) of a diffusing particle in an average time t in a one-dimensional system:
 | (2) |
| l ∝ L−1. | (3) |
| l ∝ τ−1/2. | (4) |
Fig. 10 shows a strong linear dependence of τ−1/2 on the chain length, thus, the number of the chain foldings, supporting proposed our model (Fig. 9).
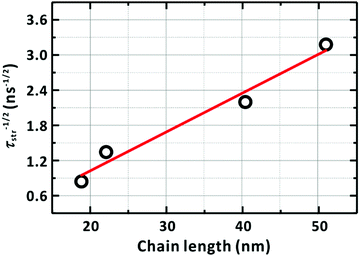 | ||
| Fig. 10 Dependence of the diffusion time of the LE/CT state on the chain length. The diffusion time is assumed to be identical to the average lifetime (τstr) in Table 4 of the LE/CT state. The solid line represents the linear relationship between τstr−1/2 and the chain length, l. The PM6 chain length was estimated by multiplying the reported length of a PM6 repeating unit (1.54 nm) by the degree of polymerization of each sample; see ref. 57. | ||
The nature of the heterogeneous dynamics leads us to note that the monotonic dependence of the SE peaks on their corresponding timescales (Fig. 4 and Fig. S5–S7, ESI†) should originate from the solvation of the LE state in the sub-picosecond range and from the associated segmental motion of the chain to search for the energy minimum that accommodates a new electronic structure.58 Owing to the correspondence of the peak positions to relaxing times, which is irrespective of the chain length because the ultrafast solvation was probed in proximity to a localised chromophore, we combined the peak positions arising from SE for all the samples of various Mn and plotted them together against their corresponding times, as shown in Fig. 11. The reconstructed plot represents the solvation correlation function. The simulated solvation correlation function using the reported parameters, i.e., 285 fs (35.6%) and 4.15 ps (64.4%), is also plotted for the same solvent.59 In the early time window, the simulated profile is in good agreement with our experimental data confirming the origin of the energy and time correspondence revealed in our study as the ultrafast solvation process in the vicinity of the LE state. Beyond the solvation dynamics further energy relaxation was observed (inset of Fig. 11). This slow relaxation is ascribed to originate from the segmental motion of the polymer coupled to solvent molecules as has been reported.60,61 The extent of energy relaxation by solvation in nonpolar CHCl3 was found to be approximately 800 cm−1 (100 meV). This highlights the equilibrated nature of the LE and CT states in PM6.
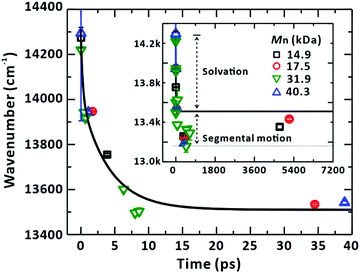 | ||
| Fig. 11 Solvation of the LE state and associated segmental motion of the chain. The stimulated-emission (SE) peak positions from the global analysis of the transient-absorption spectra are plotted against corresponding time delay. The peak shifts show the same relaxation dynamics regardless of the Mn of PM6 chains. The solid line represents the solvation correlation function for CHCl3, taken from ref. 59. Inset: The SE peak positions plotted against the extended x-axis. The axis labels are the same as those for the main panel. SE peaks show energy relaxation beyond the fully relaxed state by the solvation process. The additional relaxation is ascribed to the segmental motion of the PM6 chain. | ||
Finally, we conclude that the diffusion of the LE/CT state in a single chain of PM6 is mainly the Dexter type because the spectral position of the SE of PM6 is located beyond the onset of its absorption band, as revealed in the TA measurements of this study. This result is in contrast to the results from the conventional steady-state measurements prevalent in literature, where the weak steady-state PL from the majority of the LE state is not resolved.42,43,45–48
4. Summary
In recent years, studies on the LE- and CT-state dynamics of pristine PM6 have been performed to offer hints for designing the optimal configuration of the donor in bulk-heterojunction organic photovoltaic devices.42,43 In this work, using the two complimentary femtosecond-resolved spectroscopic methods of FU and TA, we tracked the dependence of the evolution of LE and CT states on the length of single-chain PM6 and revealed the diffusion of those states along the chain to form a CS state at a chain folding. The apparent nonexponential behaviours in the time-resolved spectroscopic measurements were found to result from the heterogeneity of the PM6's chain lengths. Upon photoexcitation, the generated LE state immediately relaxes to form a CT state within the time resolution of this study (<200 fs), establishing an equilibrium between them. As the dependence of their common lifetime on the length of a PM6 chain reveals, the equilibrated parent LE and CT states persist until they diffuse into chain folding, which is more abundant for longer chains. At the chain folding, the CT state quickly transits to an interchain CT, the annihilation of which competes with the dissociation into the CS state. The diffusion of the equilibrated LE/CT state seems to be the Dexter type because the stimulated emission of PM6 was found to develop beyond its absorption spectrum as revealed by the global lifetime analysis of the TA spectra. From the correlation of the spectral position of the stimulated emission to its timescale, ultrafast solvation and slower segmental relaxation were observed. This signifies the polar nature of the equilibrated LE and CT states. From our findings, we infer that for the bulk heterojunction blend, the intrachain, Dexter-type diffusion of LE and CT states into a chain folding is the key to generate the CS state deep in the PM6 domain, while a Förster-type energy transfer to an acceptor domain may compete with the intrachain process in the vicinity of the interface between the two domains.Conflicts of interest
There are no conflicts to declare.Acknowledgements
H.-W. N., W.-W. P., and O.-H. K. are grateful for the support granted by the National Research Foundation of Korea (NRF) and funded by the Ministry of Science and ICT (NRF-2020R1A2C1014203 and NRF-2019R1A4A1027934), O.-H. K. and H.-W. N. also received support from the Institute for Basic Science (IBS-R020-D1), Korea.References
- Z. Vardeny, E. Ehrenfreund, O. Brafman, M. Nowak, H. Schaffer, A. J. Heeger and F. Wudl, Phys. Rev. Lett., 1986, 56, 671–674 CrossRef CAS PubMed.
- R. Kersting, U. Lemmer, R. F. Mahrt, K. Leo, H. Kurz, H. Bässler and E. O. Göbel, Phys. Rev. Lett., 1993, 70, 3820–3823 CrossRef CAS PubMed.
- R. Kersting, U. Lemmer, M. Deussen, H. J. Bakker, R. F. Mahrt, H. Kurz, V. I. Arkhipov, H. Bässler and E. O. Göbel, Phys. Rev. Lett., 1994, 73, 1440–1443 CrossRef PubMed.
- P. B. Miranda, D. Moses and A. J. Heeger, Phys. Rev. B: Condens. Matter Mater. Phys., 2001, 64, 081201(R) CrossRef.
- E. Hendry, J. M. Schins, L. P. Candeias, L. D. A. Siebbeles and M. Bonn, Phys. Rev. Lett., 2004, 92, 196601 CrossRef CAS PubMed.
- H. Bässler, Nat. Phys., 2006, 2, 15–16 Search PubMed.
- T. Virgili, D. Marinotto, C. Manzoni, G. Cerullo and G. Lanzani, Phys. Rev. Lett., 2005, 94, 117402 CrossRef CAS PubMed.
- I. G. Scheblykin, A. Yartsev, T. Pullerits, V. Gulbinas and V. Sundström, J. Phys. Chem. B, 2007, 111, 6303–6321 CrossRef CAS PubMed.
- N. Banerji, S. Cowan, M. Leclerc, E. Vauthey and A. J. Heeger, J. Am. Chem. Soc., 2010, 132, 17459–17470 CrossRef CAS PubMed.
- G. Grancini, N. Martino, M. R. Antognazza, M. Celebrano, H. J. Egelhaaf and G. Lanzani, J. Phys. Chem. C, 2012, 116, 9838–9844 CrossRef CAS.
- C. X. Sheng, M. Tong, S. Singh and Z. V. Vardeny, Phys. Rev. B: Condens. Matter Mater. Phys., 2007, 75, 085206 CrossRef.
- R. Tautz, E. Da Como, T. Limmer, J. Feldmann, H.-J. Egelhaaf, E. von Hauff, V. Lemaur, D. Beljonne, S. Yilmaz, I. Dumsch, S. Allard and U. Scherf, Nat. Commun., 2012, 3, 970 CrossRef PubMed.
- B. S. Rolczynski, J. M. Szarko, H. J. Son, Y. Y. Liang, L. P. Yu and L. X. Chen, J. Am. Chem. Soc., 2012, 134, 4142–4152 CrossRef CAS PubMed.
- T. H. Lee, W.-W. Park, S. Y. Park, S. Cho, O.-H. Kwon and J. Y. Kim, Sol. RRL, 2021, 5, 2100326 CrossRef CAS.
- T. M. Clarke and J. R. Durrant, Chem. Rev., 2010, 110, 6736–6767 CrossRef CAS PubMed.
- Y. Liang, Z. Xu, J. Xia, S.-T. Tsai, Y. Wu, G. Li, C. Ray and L. Yu, Adv. Mater., 2010, 22, E135–E138 CrossRef CAS PubMed.
- Z. He, C. Zhong, X. Huang, W.-Y. Wong, H. Wu, L. Chen, S. Su and Y. Cao, Adv. Mater., 2011, 23, 4636–4643 CrossRef CAS PubMed.
- H.-Y. Chen, J. Hou, S. Zhang, Y. Liang, G. Yang, Y. Yang, L. Yu, Y. Wu and G. Li, Nat. Photonics, 2009, 3, 649–653 CrossRef CAS.
- Y. Cui, H. Yao, J. Zhang, T. Zhang, Y. Wang, L. Hong, K. Xian, B. Xu, S. Zhang, J. Peng, Z. Wei, F. Gao and J. Hou, Nat. Commun., 2019, 10, 2515 CrossRef PubMed.
- L. Meng, Y. Zhang, X. Wan, C. Li, X. Zhang, Y. Wang, X. Ke, Z. Xiao, L. Ding and R. Xia, Science, 2018, 361, 1094–1098 CrossRef CAS PubMed.
- H. Bin, L. Gao, Z.-G. Zhang, Y. Yang, Y. Zhang, C. Zhang, S. Chen, L. Xue, C. Yang, M. Xiao and Y. Li, Nat. Commun., 2016, 7, 13651 CrossRef CAS PubMed.
- A. Wadsworth, M. Moser, A. Marks, M. S. Little, N. Gasparini, C. J. Brabec, D. Baran and I. McCulloch, Chem. Soc. Rev., 2019, 48, 1596–1625 RSC.
- G. Zhang, J. Zhao, P. C. Y. Chow, K. Jiang, J. Zhang, Z. Zhu, J. Zhang, F. Huang and H. Yan, Chem. Rev., 2018, 118, 3447–3507 CrossRef CAS PubMed.
- R. Wang, J. Yuan, R. Wang, G. Han, T. Huang, W. Huang, J. Xue, H. C. Wang, C. Zhang, C. Zhu, P. Cheng, D. Meng, Y. Yi, K. H. Wei, Y. Zou and Y. Yang, Adv. Mater., 2019, 31, 1904215 CrossRef CAS PubMed.
- S. Chen, Y. Liu, L. Zhang, P. C. Y. Chow, Z. Wang, G. Zhang, W. Ma and H. Yan, J. Am. Chem. Soc., 2017, 139, 6298–6301 CrossRef CAS PubMed.
- J. Zhang, H. S. Tan, X. Guo, A. Facchetti and H. Yan, Nat. Energy, 2018, 3, 720–731 CrossRef CAS.
- L. Xiao, B. He, Q. Hu, L. Maserati, Y. Zhao, B. Yang, M. A. Kolaczkowski, C. L. Anderson, N. J. Borys, L. M. Klivansky, T. L. Chen, A. M. Schwartzberg, T. P. Russell, Y. Cao, X. Peng and Y. Liu, Joule, 2018, 2, 2154–2166 CrossRef CAS.
- Q. Liu, J. Yuan, W. Deng, M. Luo, Y. Xie, Q. Liang, Y. Zou, Z. He, H. Wu and Y. Cao, Nat. Photonics, 2020, 14, 300–305 CrossRef.
- C. Li, J. Zhou, J. Song, J. Xu, H. Zhang, X. Zhang, J. Guo, L. Zhu, D. Wei, G. Han, J. Min, Y. Zhang, Z. Xie, Y. Yi, H. Yan, F. Gao, F. Liu and Y. Sun, Nat. Energy, 2021, 6, 605–613 CrossRef CAS.
- Q. Liu, Y. Jiang, K. Jin, J. Qin, J. Xu, W. Li, J. Xiong, J. Liu, Z. Xiao, K. Sun, S. Yang, X. Zhang and L. Ding, Sci. Bull., 2020, 65, 272–275 CrossRef CAS.
- D. Hertel and H. Bässler, ChemPhysChem, 2008, 9, 666–688 CrossRef CAS PubMed.
- Z. D. Wang, S. Mazumdar and A. Shukla, Phys. Rev. B: Condens. Matter Mater. Phys., 2008, 78, 235109 CrossRef.
- M. Hallermann, S. Haneder and E. Da, Como, Appl. Phys. Lett., 2008, 93, 053307 CrossRef.
- X. Gong, M. H. Tong, F. G. Brunetti, J. Seo, Y. M. Sun, D. Moses, F. Wudl and A. J. Heeger, Adv. Mater., 2011, 23, 2272–2277 CrossRef CAS PubMed.
- X. Yang, J. Loos, S. C. Veenstra, W. J. H. Verhees, M. M. Wienk, J. M. Kroon, M. A. J. Michels and R. A. J. Janssen, Nano Lett., 2005, 5, 579–583 CrossRef CAS PubMed.
- A. C. Mayer, S. R. Scully, B. E. Hardin, M. W. Rowell and M. D. McGehee, Mater. Today, 2007, 10, 28–33 CrossRef CAS.
- S. D. Oosterhout, M. M. Wienk, S. S. van Bavel, R. Thiedmann, L. J. A. Koster, J. Gilot, J. Loos, V. Schmidt and R. A. J. Janssen, Nat. Mater., 2009, 8, 818–824 CrossRef CAS PubMed.
- R. A. Marsh, J. M. Hodgkiss, S. Albert-Seifried and R. H. Friend, Nano Lett., 2010, 10, 923–930 CrossRef CAS PubMed.
- I. A. Howard, R. Mauer, M. Meister and F. Laquai, J. Am. Chem. Soc., 2010, 132, 14866–14876 CrossRef CAS PubMed.
- W. Chen, T. Xu, F. He, W. Wang, C. Wang, J. Strzalka, Y. Liu, J. Wen, D. J. Miller, J. Chen, K. Hong, L. Yu and S. B. Darling, Nano Lett., 2011, 11, 3707–3713 CrossRef CAS PubMed.
- Y. Liang, D. Feng, Y. Wu, S.-T. Tsai, G. Li, C. Ray and L. Yu, J. Am. Chem. Soc., 2009, 131(22), 7792–7799 CrossRef CAS PubMed.
- K. Wang, H. Chen, J. Zhang, Y. Zou and Y. Yang, J. Phys. Chem. Lett., 2021, 12, 3928–3933 CrossRef CAS PubMed.
- K. Wang, H. Chen, S. Li, J. Zhang, Y. Zou and Y. Yang, J. Phys. Chem. B, 2021, 125, 7470–7476 CrossRef CAS PubMed.
- M. Jeong, J. Oh, Y. Cho, B. Lee, S. Jeong, S. M. Lee, S.-H. Kang and C. Yang, Adv. Funct. Mater., 2021, 31, 2102371 CrossRef CAS.
- D. Lee, S. G. Han, J. Mun, K. Yang, S. H. Kim, J. Rho, K. Cho, D. X. Oh and M. S. Jeong, Photonics Res., 2021, 9, 131–141 CrossRef CAS.
- J. Wu, J. Lee, Y.-C. Chin, H. Yao, H. Cha, J. Luke, J. Hou, J.-S. Kim and J. R. Durrant, Energy Environ. Sci., 2020, 13, 2422–2430 RSC.
- G. Liu, J. Jia, K. Zhang, X. Jia, Q. Yin, W. Zhong, L. Li, F. Huang and Y. Cao, Adv. Energy Mater., 2019, 9, 1803657 CrossRef.
- R. Li, G. Liu, R. Xie, Z. Wang, X. Yang, K. An, W. Zhong, X.-F. Jiang, L. Ying, F. Huang and Y. Cao, J. Mater. Chem. C, 2018, 6, 7046–7053 RSC.
- B. Lee, S. Kim, H.-W. Nho, J. Oh, G. Park, M. Jeong, Y. Cho, S. M. Lee, O.-H. Kwon and C. Yang, Adv. Energy Mater., 2021, 2102594 CrossRef CAS.
- A. De Sio, F. Troiani, M. Maiuri, J. Réhault, E. Sommer, J. Lim, S. F. Huelga, M. B. Plenio, C. A. Rozzi, G. Cerullo, E. Molinari and C. Lienau, Nat. Commun., 2016, 7, 13742 CrossRef CAS PubMed.
- R. Tautz, E. Da Como, T. Limmer, J. Feldmann, H.-J. Egelhaaf, E. von Hauff, V. Lemaur, D. Beljonne, S. Yilmaz, I. Dumsch, S. Allard and U. Scherf, Nat. Commun., 2012, 3, 970 CrossRef PubMed.
- Y. Song, S. N. Clafton, R. D. Pensack, T. W. Kee and G. D. Scholes, Nat. Commun., 2014, 5, 4933 CrossRef PubMed.
- K. C. Lee, J. Siegel, S. E. D. Webb, S. Lévêque-Fort, M. J. Cole, R. Jones, K. Dowling, M. J. Lever and P. M. W. French, Biophys. J., 2001, 81, 1265–1274 CrossRef CAS PubMed.
- H.-W. Nho, J.-H. Park, A. Adhikari and O.-H. Kwon, J. Mol. Liq., 2021, 326, 115270 CrossRef CAS.
- J. M. Hodgkiss, S. Albert-Seifried, A. Rao, A. J. Barker, A. R. Campbell, R. A. Marsh and R. H. Friend, Adv. Funct. Mater., 2012, 22, 1567–1577 CrossRef CAS.
- R. Wang, C. Zhang, Q. Li, Z. Zhang, X. Wang and M. Xiao, J. Am. Chem. Soc., 2020, 142, 12751–12759 CrossRef CAS PubMed.
- T. Wang and J.-L. Brédas, Matter, 2020, 2, 119–135 CrossRef.
- J. Pina, J. S. S. de Melo, N. Koenen and U. Scherf, J. Phys. Chem. B, 2013, 117, 7370–7380 CrossRef CAS PubMed.
- M. L. Horng, J. A. Gardecki, A. Papazyan and M. Maroncelli, J. Phys. Chem., 1995, 99, 17311–17337 CrossRef CAS.
- T. Böhmer, R. Horstmann, J. P. Gabriel, F. Pabst, M. Vogel and T. Blochowicz, Macromolecules, 2021, 54, 10340–10349 CrossRef.
- Y. Qin, L. Wang and D. Zhong, Proc. Natl. Acad. Sci. U. S. A., 2016, 113, 8424–8429 CrossRef CAS PubMed.
Footnotes |
| † Electronic supplementary information (ESI) available. See DOI: 10.1039/d1cp04093f |
| ‡ These authors contributed equally to this work. |
| This journal is © the Owner Societies 2022 |

![[thin space (1/6-em)]](https://www.rsc.org/images/entities/char_2009.gif) exp[−(
exp[−(