 Open Access Article
Creative Commons Attribution 3.0 Unported Licence
SDPD-SX: combining a single crystal X-ray diffraction setup with advanced powder data structure determination for use in early stage drug discovery†
Elena A.
Kabova
 *a,
Charles D.
Blundell
 b,
Christopher A.
Muryn
c,
George F. S.
Whitehead
 c,
Inigo J.
Vitorica-Yrezabal
 c,
Marta J.
Ross
 a and
Kenneth
Shankland
 a
a
aSchool of Chemistry, Food and Pharmacy, University of Reading, Whiteknights, Reading, Berks RG6 6AD, UK. E-mail: e.kabova@reading.ac.uk
bC4X Discovery, Manchester One, 53 Portland Street, Greater Manchester M1 3LD, UK
cDepartment of Chemistry, The University of Manchester, Oxford Road, Manchester M13 9PL, UK
First published on 24th May 2022
Abstract
We report a method for routine crystal structure determination on very small (typically 0.1 mg or less) amounts of crystalline material using powder X-ray diffraction data from a laboratory-based single-crystal diffractometer. The solved structures span a wide range of molecular and crystallographic complexity.
Introduction
Crystal structures provide not only an accurate description of molecular connectivity and conformation, but also a basis for the understanding of physical properties such as solubility. In the pharmaceutical industry, three-dimensional information obtained from the solid state is useful at all stages of drug development, from hit identification through to lead optimisation, and beyond into formulation. Whilst single crystal X-ray (SX) diffraction is the “gold standard” method of characterisation, in many cases it is not possible to easily grow single crystals large enough to permit SX experiments. In such cases, and providing the material is polycrystalline, structure determination from powder X-ray diffraction (SDPD) data is a powerful alterative. However, most conventional lab-based powder X-ray diffraction (PXRD) setups require ca. 10 mg of material for a good quality diffraction pattern to be collected; such amounts are simply not available in the very early stages of drug development. This is unfortunate, because 3D-structural information has significant potential to inform design (especially conformational design) earlier in the drug discovery process. Several groups have developed specialised diffraction approaches for dealing with very small single crystals1–3 or for collecting single-crystal data from oriented powder samples4–7 and electron crystallography is now poised to have a significant impact.8–10 Collecting PXRD data using SX instrumentation is well-established11 and has found applications in phase identification, QPA and structure refinement,12 but reports of its use for structure determination are extremely rare.13 The focus in this study is to demonstrate a method for crystal structure determination from powder diffraction data14,15 using very small amounts of polycrystalline material and a laboratory-based SX diffractometer for data collection. The broad applicability of this approach (henceforth referred to as SDPD-SX) is demonstrated with the crystal structure determination of 14 known compounds of pharmaceutical interest, chosen to represent the chemical and crystallographic complexity of real-world drug-like molecules.Methodology
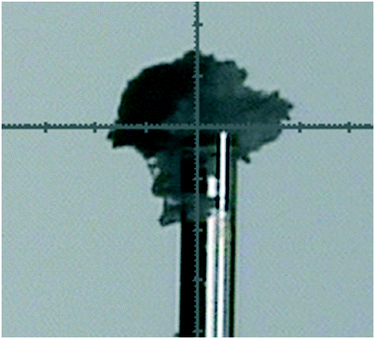
The 14 previously published crystal structures listed in Table 1 were first validated by periodic dispersion-correct DFT (DFT-D) calculations, following the approach of van de Streek.16,17 Powder X-ray diffraction data were collected on the University of Manchester's Rigaku FR-X laboratory single crystal X-ray diffractometer using CuKα (λ = 1.5418 Å) radiation.‡ A sub-milligram (typically <0.1 mg) amount of polycrystalline sample was mounted on a 100 μm glass fibre and secured with a minimum possible amount of Fomblin® YR-1800 oil (Fig. 1). Five 300° ϕ scans (beam divergence 1.0 mrad, detector distance 150 mm, 300 s per frame, range 1.8–60° 2θ) were collected at room temperature using Rigaku's CrysalisPro18 software and diffraction rings integrated using its built-in routines. For comparison purposes, PXRD data were collected from the same materials in transmission mode on a Bruker D8 Advance PXRD diffractometer using CuKα1 radiation.§ Samples were contained in a 0.7 mm borosilicate glass capillary.| Compound | V/Å3 | N at | DoF | d/Å | RMSD/Å | |
|---|---|---|---|---|---|---|
| DASH | Post-DFT | |||||
| V = unit cell volume; Nat = number of atoms in asymmetric unit; DoF = total degrees of freedom in DASH run; d = resolution of solved structure; RMSD = crystal packing similarity value of DASH solution with CSD structure, and DFT-optimised DASH solution with the DFT-optimised CSD structure. N/A: the water molecule was not accurately located, precluding DFT optimisation. | ||||||
| Mefenamic acid | 632 | 33 | 9 | 2.36 | 0.136 | 0.064 |
| Ibuprofen | 1225 | 33 | 10 | 2.14 | 0.099 | 0.049 |
| L-Glutamic acid | 618 | 19 | 10 | 1.75 | 0.027 | 0.008 |
| Sertraline·HCl | 1682 | 39 | 11 | 1.95 | 0.027 | 0.013 |
| Indomethacin | 848 | 41 | 11 | 2.23 | 0.118 | 0.027 |
| Lansoprazole | 1627 | 39 | 12 | 2.18 | 0.085 | 0.025 |
| Chloramphenicol | 2853 | 32 | 13 | 2.08 | 0.130 | 0.031 |
| Cefadroxil·H2O | 1786 | 45 | 14 | 2.25 | 0.101 | 0.028 |
| Imatinib | 1301 | 68 | 14 | 2.34 | 0.174 | 0.093 |
| Carvedilol | 2117 | 56 | 16 | 2.69 | 0.241 | 0.084 |
| Furosemide | 1333 | 64 | 22 | 2.72 | 0.490 | 0.100 |
| Ritonavir | 3832 | 98 | 28 | 2.38 | 0.376 | 0.161 |
| Sildenafil citrate·H2O | 6423 | 87 | 30 | 2.77 | 0.377 | N/A |
| Paroxetine·HCl·1/2H2O | 1845 | 46.5 | 31 | 2.37 | 0.082 | 0.020 |
 | ||
| Fig. 1 A very small amount of powder (ca. 0.01 mg) mounted on the top of a glass fibre in the single crystal X-ray diffractometer. Each major tick represents 0.1 mm. | ||
All powder indexing and crystal structure solution attempts were carried out using the DASH software,19,20 utilising the optimised simulated annealing parameter settings and recommended number of runs/simulated annealing moves reported by Kabova.21¶ The best (i.e., lowest profile χ2; see Fig. S1–S14†) crystal structures resulting from each of the DASH runs were compared with the known single-crystal structures taken from the Cambridge Structural Database using the “Crystal Packing Similarity” feature of Mercury.22
Results and discussion
Of the 15 materials studied, 14 (Table 1) were solved to a high degree of accuracy using DASH. Only γ-carbamazepine (P![[1 with combining macron]](https://www.rsc.org/images/entities/char_0031_0304.gif) , 28 DoF, Z′ = 4, Nat = 120), which could be solved from capillary data, could not be solved using SDPD-SX; the low space group symmetry and large asymmetric unit led to a degree of reflection overlap that precluded stable Pawley fitting in DASH.
, 28 DoF, Z′ = 4, Nat = 120), which could be solved from capillary data, could not be solved using SDPD-SX; the low space group symmetry and large asymmetric unit led to a degree of reflection overlap that precluded stable Pawley fitting in DASH.
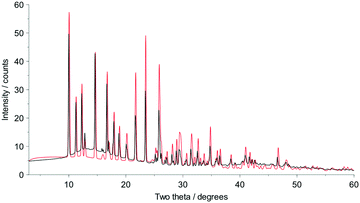
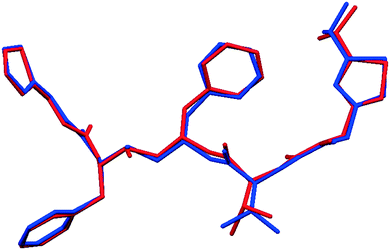
Fig. 2 shows that whilst the SDPD-SX data are in generally good agreement with the capillary PXRD data, they do not exhibit as good instrumental resolution. This, coupled with the CuKα2 contribution leads to a higher degree of reflection overlap, limiting the accuracy with which individual reflection intensity information can be extracted. Despite this, the crystal structures obtained using DASH are in predominantly very good agreement with their known SX counterparts; DFT-D optimisation confirms this high level of accuracy in the solved structures (see Fig. S15–S28†). The relatively low real-space resolution of the SDPD-SX datasets is therefore not a serious impediment to structure solution using a global optimisation approach such as the one implemented in DASH and subsequent Rietveld refinement is straightforward (see Fig. S29–S31†) with results in good agreement with those obtained from capillary data. The solved structures span a wide range of molecular and crystallographic complexity and include highly flexible molecules such as ritonavir (Fig. 3), demonstrating a broad range of applicability of SDPD-SX for synthetic and structural chemists. Additionally, sample preparation does not require light grinding and, in general, preferred orientation is not a significant issue. Some spottiness was observed in the diffraction rings of a few samples, suggesting the presence of larger crystallites in the sample, but this did not hamper structure determination. We have also obtained comparable success (results not shown) with a Rigaku Synergy diffractometer equipped with a sealed microfocus Cu source (0.1 mrad divergence) and a Hypix 6000HE single-photon counting detector.
Conclusions
The SDPD-SX approach outlined here shows the capability to determine crystal structures from sub-milligram amounts using powder X-ray diffraction on a single crystal X-ray diffractometer. The method can be justifiably classified as routine, in that it uses standard instrumentation and software at all stages of the process. There is no doubt that data collection in transmission capillary mode on a dedicated powder diffractometer (be it laboratory-based or central facility based) is the preferred option for SDPD from polycrystalline materials. However, we envisage that the SDPD-SX approach will be of significant value to those who only have access to sub-milligram amounts of powder that are insufficient to fill a capillary or whose loss (e.g. by radiation damage on a synchrotron beamline) cannot be risked. Furthermore, the wide availability of appropriate SX instrumentation provides a very useful route to structure determination for those who do not have easy access to suitable, dedicated PXRD instrumentation. Whilst it is unlikely that it will give sufficiently good data for the successful application of direct-methods based structure solution (at least, for crystal structures of the complexity used herein), any global-optimisation based SDPD method should prove effective.Author contributions
EAK: investigation, methodology, project administration, writing – review & editing; CDB: conceptualization, investigation, methodology, project administration, writing – review & editing; CAM: investigation, methodology; GFSW: conceptualization, investigation, methodology; IJV-Y: conceptualization, investigation, methodology; MJR: investigation, methodology, writing – original draft; KS: validation, writing – original draft, review & editing.Conflicts of interest
There are no conflicts of interest to declare.Acknowledgements
This study was funded by C4X Discovery. We are grateful to the University of Manchester's Department of Chemistry for access to the rotating anode SX diffractometer for the data collection. We also thank EPSRC (UK) for funding the X-ray diffractometer (EP/K039547/1). We are also grateful to the University of Reading's Chemical Analysis Facility for capillary PXRD and Nick Spencer for his technical assistance. We are grateful to the UK Materials & Molecular Modelling Hub for computational resources, which is partially funded by EPSRC (EP/P020194/1 and EP/T022213/1), for DFT-D calculations.||Notes and references
- N. Yasuda, H. Murayama, Y. Fukuyama, J. Kim, S. Kimura, K. Toriumi, Y. Tanaka, Y. Moritomo, Y. Kuroiwa, K. Kato, H. Tanaka and M. Takata, J. Synchrotron Radiat., 2009, 16, 352–357 CrossRef CAS PubMed.
- T. Zhang, S. F. Jin, Y. X. Gu, Y. He, M. Li, Y. Li and H. F. Fan, IUCrJ, 2015, 2, 322–326 CrossRef CAS PubMed.
- E. A. Schriber, D. W. Paley, R. Bolotovsky, D. J. Rosenberg, R. G. Sierra, A. Aquila, D. Mendez, F. Poitevin, J. P. Blaschke, A. Bhowmick, R. P. Kelly, M. Hunter, B. Hayes, D. C. Popple, M. Yeung, C. Pareja-Rivera, S. Lisova, K. Tono, M. Sugahara, S. Owada, T. Kuykendall, K. Y. Yao, P. J. Schuck, D. Solis-Ibarra, N. K. Sauter, A. S. Brewster and J. N. Hohman, Nature, 2022, 601, 360–365 CrossRef CAS PubMed.
- K. Aburaya, C. Tsuboi, F. Kimura, K. Matsumoto, M. Maeyama and T. Kimura, Acta Crystallogr., Sect. A: Found. Adv., 2014, 70, C1136 Search PubMed.
- C. Tsuboi, K. Aburaya, F. Kimura, M. Maeyama and T. Kimura, CrystEngComm, 2016, 18, 2404–2407 RSC.
- C. Tsuboi, F. Kimura, T. Tanaka and T. Kimura, Cryst. Growth Des., 2016, 16, 2810–2813 CrossRef CAS.
- C. Tsuboi, S. Tsukui, F. Kimura, T. Kimura, K. Hasegawa, S. Baba and N. Mizuno, J. Appl. Crystallogr., 2016, 49, 2100–2105 CrossRef CAS.
- T. Gruene, J. T. C. Wennmacher, C. Zaubitzer, J. J. Holstein, J. Heidler, A. Fecteau-Lefebvre, S. De Carlo, E. Muller, K. N. Goldie, I. Regeni, T. Li, G. Santiso-Quinones, G. Steinfeld, S. Handschin, E. van Genderen, J. A. van Bokhoven, G. H. Clever and R. Pantelic, Angew. Chem., Int. Ed., 2018, 57, 16313–16317 CrossRef CAS PubMed.
- S. Ito, F. J. White, E. Okunishi, Y. Aoyama, A. Yamano, H. Sato, J. D. Ferrara, M. Jasnowski and M. Meyer, CrystEngComm, 2021, 23, 8622–8630 RSC.
- M. Gemmi, E. Mugnaioli, T. E. Gorelik, U. Kolb, L. Palatinus, P. Boullay, S. Hovmoller and J. P. Abrahams, ACS Cent. Sci., 2019, 5, 1315–1329 CrossRef CAS PubMed.
- N. S. P. Bhuvanesh and J. H. Reibenspies, J. Appl. Crystallogr., 2003, 36, 1480–1481 CrossRef CAS.
- T. Stuerzer, M. Adam, V. Smith and H. Ott, Acta Crystallogr., Sect. A: Found. Adv., 2019, 75, e221 Search PubMed.
- C. Schurmann, Rigaku Webinar: Micro Powder Diffraction with a Single Crystal Diffractometer, 2021, https://tinyurl.com/2ew9wt3j Search PubMed.
- K. Shankland, M. J. Spillman, E. A. Kabova, D. S. Edgeley and N. Shankland, Acta Crystallogr., Sect. C: Cryst. Struct. Commun., 2013, 69, 1251–1259 CrossRef CAS PubMed.
- W. I. F. David and K. Shankland, Acta Crystallogr., Sect. A: Found. Crystallogr., 2008, 64, 52–64 CrossRef CAS PubMed.
- J. van de Streek and M. A. Neumann, Acta Crystallogr., Sect. B: Struct. Sci., 2010, 66, 544–558 CrossRef CAS PubMed.
- J. van de Streek and M. A. Neumann, Acta Crystallogr., Sect. B: Struct. Sci., Cryst. Eng. Mater., 2014, 70, 1020–1032 CrossRef CAS PubMed.
- CrysAlisPro, Rigaku Corporation, 2021 Search PubMed.
- W. I. F. David, K. Shankland, J. van de Streek, E. Pidcock, W. D. S. Motherwell and J. C. Cole, J. Appl. Crystallogr., 2006, 39, 910–915 CrossRef CAS.
- T. A. N. Griffin, K. Shankland, J. V. van de Streek and J. Cole, J. Appl. Crystallogr., 2009, 42, 360–361 CrossRef CAS.
- E. A. Kabova, J. C. Cole, O. Korb, M. Lopez-Ibanez, A. C. Williams and K. Shankland, J. Appl. Crystallogr., 2017, 50, 1411–1420 CrossRef CAS.
- C. F. Macrae, I. Sovago, S. J. Cottrell, P. T. A. Galek, P. McCabe, E. Pidcock, M. Platings, G. P. Shields, J. S. Stevens, M. Towler and P. A. Wood, J. Appl. Crystallogr., 2020, 53, 226–235 CrossRef CAS PubMed.
Footnotes |
| † Electronic supplementary information (ESI) available: DASH profile fits, full data ranges and asymmetric unit overlays, and selected Rietveld refinement information available. See DOI: https://doi.org/10.1039/d2ce00387b |
| ‡ Quarter-chi AFC-11 goniometer with a 2.97 kW FR-X rotating anode microfocus source with VariMAX™ optics, divergence slits set to 1.0 mR and HyPix 6000HE detector. Standard 300°, 300 s ϕ scans with a detector distance of 150 mm were run. A total of five 300 s frames were collected (two at −5°, one at 0°, one at 22.6° and one at 45.30° theta). Total collection time ca. 25 min. |
| § Sealed 2 kW tube with curved Johansson-type primary monochromator, LynxEye PSD and 8 mm detector aperture slit. |
| ¶ For compounds with 16 or fewer degrees of freedom (a molecule typically has 3 positional, 3 orientational and N torsional degrees of freedom, where N is the number of torsion angles in the molecule whose values cannot be specified in advance and which need to be determined as part of the structure solution process) the number of simulated annealing steps per run varied between 1 × 10⁶ and 5 × 10⁶. For compounds with a greater number of DoF, the SA was set to 5 × 10⁷ steps per run. |
| || Periodic density functional theory with van der Waals dispersion corrections (DFT-D) was used for geometry optimization. The functional was used with PAW wave pseudopotentials Grimme's D3 correction, as implemented in the pw.x executable of QuantumEspresso. Automatic k-point sampling was used; the KE cutoffs for plane waves and charge density were 50 & 400 Ry, respectively. Convergence thresholds on total energy and forces were set to 0.0001 and 0.001 a.u., respectively. Initial geometry optimizations were carried out with lattice parameters fixed at their crystallographic values, with subsequent variable cell geometry optimizations starting from the endpoint of the fixed-cell calculations. All calculations were carried out on the UK's National Tier 2 High Performance Computing Hub in Materials and Molecular Modelling, “Young”. |
| This journal is © The Royal Society of Chemistry 2022 |


