 Open Access Article
Understanding the effect of the high hydrophobicity of the laser-prepared Ti/SnO2–Sb–La2O3 anode on its electrocatalytic properties†
Géssica
de Oliveira Santiago Santos
 ab,
Aline Resende
Dória
ab,
Caio Vinícius da
Silva Almeida
ab,
Marilia
Pupo
ac,
Ronaldo Santos
da Silva
d,
Katlin Ivon Barrios
Eguiluz
*ab and
Giancarlo Richard
Salazar-Banda
ab,
Aline Resende
Dória
ab,
Caio Vinícius da
Silva Almeida
ab,
Marilia
Pupo
ac,
Ronaldo Santos
da Silva
d,
Katlin Ivon Barrios
Eguiluz
*ab and
Giancarlo Richard
Salazar-Banda
 *ab
*ab
aLaboratory of Electrochemistry and Nanotechnology, Institute of Technology and Research (ITP), 49.032-490, Aracaju, Sergipe, Brazil. E-mail: katlinbarrios@gmail.com; gianrsb@gmail.com
bProcess Engineering Graduate Program (PEP), Tiradentes University, 49.032-490, Aracaju, Sergipe, Brazil
cDepartment of Process & Energy, Faculty of Mechanical, Maritime & Materials Engineering, Delft University of Technology, Delft, The Netherlands
dFunctional Nanomaterials Group, Department of Physics, Federal University of Sergipe, São Cristóvão-SE, Brazil
First published on 4th May 2021
Abstract
SnO2-Based materials have attracted much attention in the electrochemical oxidation field due to their high electrocatalytic activity. However, efforts are still required to improve their physical and electrochemical properties. Here we employed a CO2 laser thermal process, as a substitute to conventional furnace heating, for the synthesis of two SnO2-based anodes–Ti/SnO2–Sb2O5 and Ti/SnO2–Sb–La2O3. Compared with anodes made using conventional heating, the laser-prepared anodes show a more compact surface and a change from hydrophilic to super-hydrophobic wetting properties. Energy-dispersive X-ray spectroscopy and X-ray diffraction data reveal the uniform distribution of Sn, Sb, and La, as well as the formation of the desired oxides, respectively. The oxidation state and chemical composition were confirmed by X-ray photoelectron spectroscopy. Notably, the laser-prepared anodes exhibit a positive shift in the oxygen evolution overpotential, especially for the Ti/SnO2–Sb–La2O3 anode, and a 2-fold reduction in the charge transfer resistance. The electrochemical degradation of 4-nitrophenol (4-NP) was investigated in aqueous solutions by UV-Vis spectra employing all anodes produced. The results showed that laser-prepared Ti/SnO2–Sb–La2O3 displays the highest degradation efficiency at the lowest energy consumption. Also, a mechanism for the 4-NP oxidation at the SnO2-based anodes under the current working conditions is proposed. Finally, the notable reduction in processing time and energy spent using laser heating makes it a feasible alternative to produce SnO2-based anodes. Their improved properties enhance the potential of these anodes to be applied in the electrochemical treatment of polluted waters.
Introduction
Nitro-aromatic compounds are commonly found in many industrial wastewaters because they are widely used in the manufacture of pesticides, dyes, and other chemicals.1,2 4-Nitrophenol (4-NP, also known as p-nitrophenol) is one of those recalcitrant compounds, presenting high stability and solubility. Besides, it is recognized for its potential toxicity and mutagenic activity toward living organisms.3–5 Thus, the treatment of these polluted waters is of paramount importance. Hence, alternative efficient technologies capable of degrading such compounds in aqueous media are essential since conventional biological treatment has been found to be inadequate for the degradation of such nitro-aromatic compounds.Due to the advances in electrode materials and their high performance, electrochemically driven technologies have attracted attention due to their environmental compatibility and the ability to destroy organic compounds from aqueous wastes.6–10 In particular, mixed metal oxide (MMO) coatings on titanium substrates are widely used as anodes in environmental applications. Due to their unique properties and versatility, they are a good option as anode materials for electrochemical oxidation of organic pollutants in aqueous solutions.11–13 Among the different MMOs existing, SnO2-based binary anodes stand out as low cost and effective materials for the removal of various organic pollutants because of their high oxygen evolution overpotential. Several authors have introduced a third element such as a rare-earth (La, Ce, Eu, Gd, Dy, etc.), noble metal (Pt, Ru, Ir, etc.), or other metal (Fe, Co, Ni, Bi, etc.) in order to improve the electrocatalytic activity of these anodes making them attractive for practical applications.14–17
In this sense, considerable focus has been given to the various preparation methods available, which influence the physical and electrochemical properties of these anodes.18,19 Significant differences in the coating adhesion, morphology, and porous microstructure have been reported to be dependent on the preparation conditions and heating processes applied.20–22 Thermal decomposition methods are commonly employed to produce such materials where electric furnaces are typically used as the heating source, making it a prolonged and time-consuming process (considering the heating and cooling times).
Alternatively, CO2 laser heating appears as a substitute for conventional heating due to its faster heating and cooling processes.23 Besides, the CO2 laser can improve the electrocatalytic properties at a considerably lower cost of synthesis.22,23 Therefore, the study of the relationship between electrochemical oxidation performance and the electrode modification methods has important theoretical significance and practical value.
Here, we focus on the effect of CO2 laser heating to prepare the binary mixture of SnO2–Sb2O5 and a ternary anode with lanthanum addition (SnO2–Sb–La2O3). For comparison, those anodes were also made in a conventional furnace. The developed anodes were characterized by scanning electron microscopy (SEM) coupled to energy dispersive X-ray spectroscopy (EDS), X-ray diffraction (XRD), X-Ray Photoelectron Spectroscopy (XPS), electrochemical impedance spectroscopy (EIS), cyclic voltammetry (CV), and linear sweep voltammetry (LSV) techniques. Finally, chronopotentiometry experiments were carried out to evaluate the electrocatalytic activity of these anodes using 4-nitrophenol as a target organic molecule. The concentrations of the compound were analyzed through UV–Vis spectroscopy, with samples being collected at several time intervals during electrolysis.
Results and discussion
Physical characterization
From hereafter and for simplification, the two compositions of anodes prepared Ti/(SnO2)0.84(Sb)0.06(La2O3)0.10 and Ti/(SnO2)0.84(Sb2O5)0.16 will be simply denoted as Ti/SnO2–Sb–La2O3 and Ti/SnO2–Sb2O5, respectively. Fig. 1 shows the XRD patterns of the anodes prepared by both methods. Note that all samples exhibit SnO2 in a rutile-type structure (JCPDS 41-1445), as the majority phase, discreet peaks of Sb2O5 (JCPDS 01-0124) and La2O3 (JCPDS 022-0369), in this last case in La-doped anodes, and as expected, the metallic Ti peaks (JCPDS 44-1294) from the substrate. The almost imperceptible peaks related to Sb2O5 and La2O3 suggest that these ions were successfully inserted in the SnO2 matrix, and just small amounts of oxides segregate. This result agrees with previous studies that pointed out that up to 10% of Sb can be incorporated into the SnO2 lattice satisfying the Hume-Rothery rule.24 According to the Hume-Rothery rule,25 a complete solid solubility is expected when the difference between the ionic radii of the participating ions is smaller than 15%. In fact, Sb5+ has an ionic radius of 0.6 Å (coordination number – CN = 6), while for Sn4+ it is 0.69 Å, the difference being approximately 13%,26 close to the Hume-Rothery limit. Thus, phase segregation is expected when the Sb amount increases. For La3+ ions (1.032 Å, CN = 6), this difference is even more pronounced, approximately 50%, which is much larger than the Hume-Rothery limit for successful substitution (i.e., 15%).25 Therefore, the segregation of a La-rich phase is expected. Peaks related to the Ti support (JCPDS 44-1294) were also identified in both anodes due to the cracks in the anode surface, allowing for penetration of X-rays.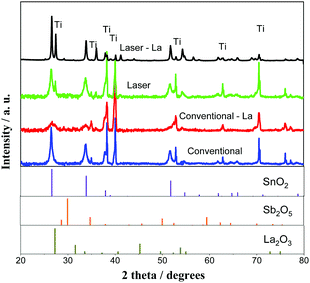 | ||
| Fig. 1 XRD diffraction patterns of Ti/SnO2–Sb2O5 (a) and Ti/SnO2–Sb–La2O3 (b) prepared by conventional heating (furnace) and laser heating processes. | ||
Fig. 2 (left-side) shows SEM images of the laser and conventionally prepared anodes for both studied compositions. The surface morphology of the conventional anode is deeply cracked, facilitating the formation of TiO2 through the infiltration of electrolyte in the coating layer, which leads to poor conductivity and the deactivation of the SnO2-based anode. Conversely, the laser-prepared anodes were more compact and had a better coating, corroborating with the XRD results (Fig. 1) in which these samples presented lower Ti intensity associated with the titanium substrate as compared with conventional samples. Additionally, the Ti/SnO2–Sb–La2O3 anodes exhibit a more homogeneous morphology than those of the Ti/SnO2–Sb2O5 samples. The elemental mappings of the surfaces of the four studied anodes are shown in Fig. 2 (right side). In these images, brightness differences are related to the different element proportions (i.e., darker regions are related to a lower concentration of an observed element). Some darker regions are observed in Sn, Sb, and La elemental mapping pictures for the conventionally prepared anodes, while for the laser-prepared anodes, these darker regions are much less pronounced, which means better ion homogeneity.23
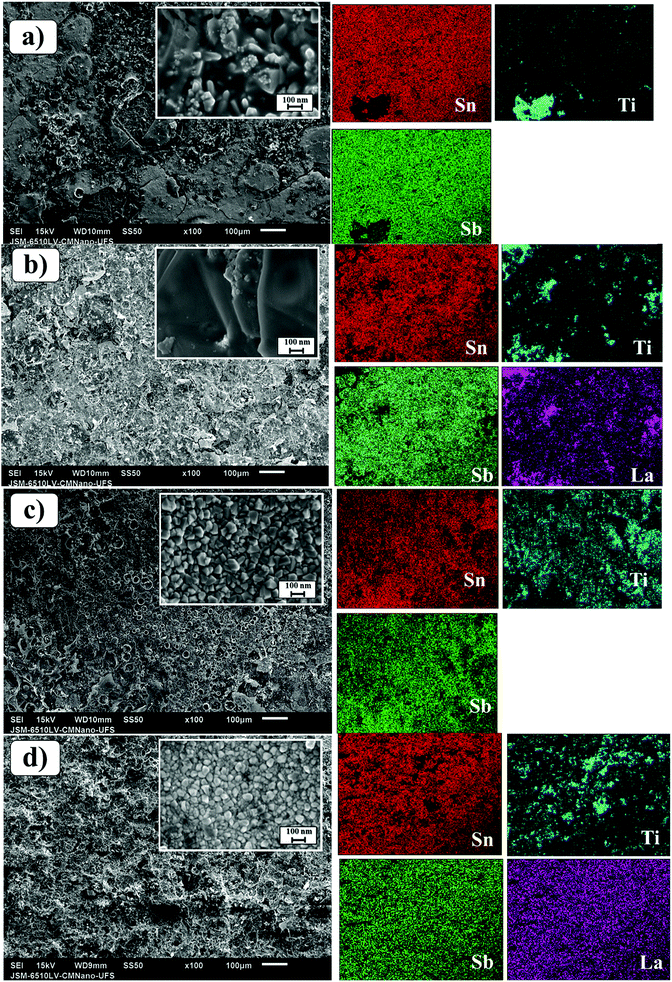 | ||
| Fig. 2 SEM images of the Ti/SnO2–Sb2O5 (a and c) and SnO2–Sb–La2O3 (b and d) anodes employing conventional (furnace) (a and b) and CO2 laser (c and d) heating. | ||
The composition of the coating layer was semi-quantitatively determined by EDS (Table 1), where slight discrepancies are observed mainly for the Sn:Sb proportion. This behavior has been already reported by several authors working with Sn/Sb anodes as a consequence of the small energy separation between the spectral lines of these elements.20,27,28
| Anode | Heating method | Nominal concentration/% | Real concentration/% | ||||
|---|---|---|---|---|---|---|---|
| Sn/MαT | Sb/MαT | La/MαT | Sn/MαT | Sb/MαT | La/αT | ||
| MαT = total metal content. | |||||||
| Ti/SnO2–Sb2O5 | Conventional | 84 | 16 | — | 87.7 | 12.3 | — |
| Ti/SnO2–Sb–La2O3 | 84 | 6 | 10 | 86.8 | 7.2 | 6.0 | |
| Ti/SnO2–Sb2O5 | Laser | 84 | 16 | — | 91.5 | 8.4 | — |
| Ti/SnO2–Sb–La2O3 | 84 | 6 | 10 | 91.0 | 3.6 | 5.4 | |
The contact angle measurements for all anodes were investigated to understand the effect of the heating method on the surface hydrophobicity. Fig. 3a and b show a super hydrophilic feature for both conventionally prepared anodes. On the other hand, both laser-prepared anodes display hydrophobic surfaces, the highest contact angle value being 126.7° ± 9.8 for the Ti/SnO2–Sb–La2O3 anode and 73.8° ± 3.3 for the Ti/SnO2–Sb2O5 anode. This behavior can be related to the dual surface roughness reduction in micro- and nano-scale as a result of the more compact surface. This reduction reduces the surface porosity and the smaller particle size, in nanometric scale,22 of the laser-prepared anodes (as can be seen in the inset of Fig. 2c and d), in particular for the Ti/SnO2–Sb–La2O3 ensuring remarkable hydrophobicity (Fig. 2d).
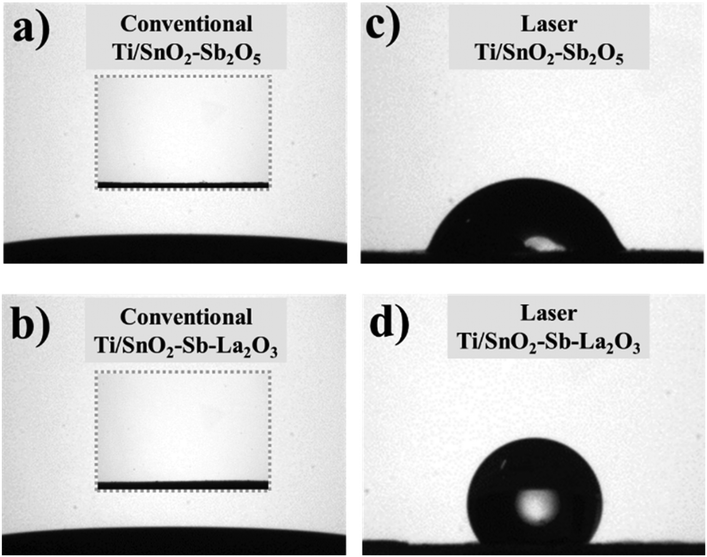 | ||
| Fig. 3 Contact angle data of the surfaces of coatings, taken for laser- (c and d) and conventionally (a and b) prepared anodes. Inset images correspond to coating surfaces before measurement. | ||
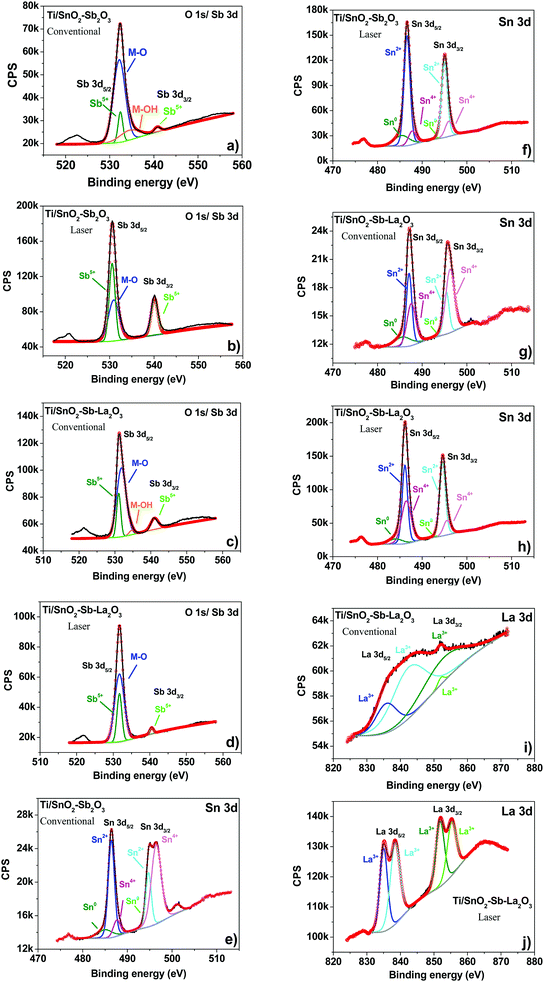
XPS was used to investigate the oxidation state, chemical composition, and constituent elements of the Ti/SnO2–Sb2O5 and Ti/SnO2–Sb–La2O3 electrodes. The binding energy values were calibrated based on the adventitious carbon 1 s peak (284.8 eV). As presented in Fig. S1 (ESI†), the XPS survey spectra indicate that Ti, O, Sb, Sn, and C elements are present in all prepared electrodes. Excluding the carbon contribution, Table S1 confirmed Sn as the most prominent phase, corroborating with EDS (Table 1). A major discrepancy is observed for the Sb content, probably related to the overlapping of the O 1s peak.
In the case of Ti/SnO2–Sb–La2O3 electrodes (Fig. S1c and S1d, ESI†), the presence of La species is not obvious in the electrode prepared by the conventional heating process (Fig. S1c, ESI†) due to the lower content of La in this anode. The observation of Ti 2p signals in all spectra is probably originated from the bottom of the cracks. Additionally, Ti peaks showed lower intensity for the laser-prepared anodes, which agree with the XRD (Fig. 1) and SEM (Fig. 2) results. The presence of C 1s is a result of the reference used during the XPS analysis.
The deconvolution of the high-resolution spectra of O 1s/Sb 3d (Fig. 4a–d) (Sb 3d5/2/Sb3d3/2 pair) identified the oxidation state of Sb as +5, suggesting the formation of Sb2O5 in all anodes.29 The O 1s region was deconvoluted into two and one peaks for the anodes prepared by conventional (Fig. 4a and c) and laser (Fig. 4b and d) heating processes, respectively. In agreement with the literature,30–32 the first peak (531–532 eV) corresponds to the oxygen metal bond (M–O), and the second peak (533–534 eV) is ascribed to adsorbed water on the surface of the anodes. It is worth mentioning that the absence of the peak related to adsorbed water on the laser-prepared anodes can indicate the hydrophobicity of these surfaces, which is consistent with the contact angle measurements (Fig. 3).
The oxidation states of Sn were identified from the deconvoluted XPS spectra of the Ti/SnO2–Sb–La2O3 anode and Ti/SnO2–Sb2O5 anodes (Fig. 4e–h). The Sn 3d5/2/3d3/2 spin–orbit pair were deconvoluted into three peaks, corresponding to the Sn oxidation state of 0, +2, and +4.29,30,33 The XPS analysis suggests that the SnO (Sn2+) is the dominant phase for the electrodes; however, the formation of SnO2 (Sn4+) in relevant quantities was also evident.
Regarding the La 3d spectrum (Fig. 4i and j), the binding energies of the La 3d5/2 (835 eV) and La 3d3/2 (838.4 eV) peaks are consistent with the reported results of La3+,34,35 in an oxidation state of La(III), confirming the formation of La2O3. It is worth mentioning that the La 3d peaks for the Ti/SnO2–Sb–La2O3 anode, prepared by conventional heating, are not very evident due to its low amount.
Electrochemical characterization
Fig. 5 shows the cyclic voltammograms obtained in the potential interval between 0.0 and 1.8 V vs. Ag/AgCl for the Ti/SnO2–Sb2O5 and Ti/SnO2–Sb–La2O3 anodes and obtained in 0.5 mol L−1 H2SO4. Interestingly, regardless of the composition, the laser-prepared anodes presented a displacement of the OER to more positive potentials. It means that these anodes may have a better performance in the electrooxidation of organic compounds. Inhibition of the OER means a higher formation of hydroxyl radicals as well as minimal energy loss on oxygen generation.36,37 Moreover, the anodes with lanthanum presented a more pronounced potential shift, which indicates that La addition can increase the oxygen evolution overpotential. This observation can be correlated with the change in the surface wettability from hydrophilic to hydrophobic, thereby inhibiting the adsorption of hydrophilic ˙OH. At this point, it is worth mentioning that the relationship between water adsorption and electrode oxidation ability may be related to the change in the wetting property of the materials. The shift from a hydrophilic surface to a highly hydrophobic surface inhibits the surface adsorption of OH-species. The hydrophobic nature of the laser-prepared anodes hinders the water adsorption. Thus, the generated OH- is released as free OH-species instead of combining for the evolution of oxygen, shifting the OEP to higher values, thus improving oxidation efficiency. This correlation between hydrophobicity and oxygen evolution reactions has been discussed by Wu et al.38 They observed a direct effect of the hydrophobicity of TiO2-NTs/SnO2–Sb–PTFE electrode on the improvement of oxygen evolution potential and, as a consequence, an enhancement in the electrochemical oxidation of phenol.38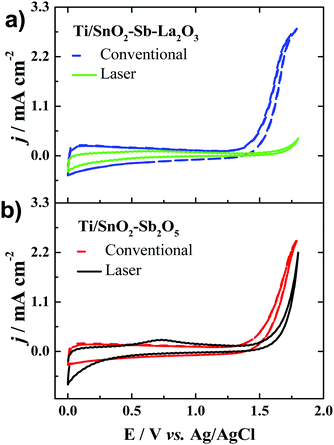 | ||
| Fig. 5 Cyclic voltammograms recorded at 50 mV s−1 for the anodes of (a) Ti/SnO2–Sb–La2O3 and (b) Ti/SnO2–Sb2O5. Electrolyte: 0.5 mol L−1 H2SO4. | ||
The total voltammetric charges, q*, are calculated integrating the voltammetry curves between 0.0 and 1.8 V (vs. Ag/AgCl), considering both anodic and cathodic charges. This parameter can be used as a relative measure of the electrochemically active area (Table 2).39 The laser heating provokes a reduction in the total voltammetric charges, especially for the Ti/SnO2–Sb–La2O3. The higher area observed for the conventionally prepared anodes is probably related to the cracked morphology, which is not always advantageous because deactivation may be faster due to the penetration of the electrolyte through wide cracks. Alternatively, laser-prepared anodes presented a reduction in the superficial area due to their more compact structure.
| Anode | Heating method | q* (mC cm−2) | C d | C d,e | C d,i | ϕ m |
|---|---|---|---|---|---|---|
| Ti/SnO2–Sb2O5 | Conventional | 1.339 | 0.68 | 0.57 | 0.11 | 0.16 |
| Ti/SnO2–Sb–La2O3 | 1.663 | 0.98 | 0.94 | 0.04 | 0.04 | |
| Ti/SnO2–Sb2O5 | Laser | 0.435 | 1.65 | 1.58 | 0.07 | 0.04 |
| Ti/SnO2–Sb–La2O3 | 0.204 | 1.75 | 1.74 | 0.01 | 0.01 |
The morphology factors of the oxide layers were calculated to understand the differences among methods better.40 Fig. S2 (ESI†) shows the capacitive current density versus the scan rate, where two linear segments are observed, located in the low and high domain, respectively. From them, the values of total differential capacitance (Cd), the external differential capacitance (Cd,e), internal differential capacitance, Cd,i (= Cd–Cd,e) and finally the morphology factor (ϕ) were calculated, and the values are presented in Table 2. The morphology factor value can vary from 0 to 1, where 0 and 1 indicate small and large internal areas.
Table 2 reveals that the laser-prepared anodes presented morphology factor values of 0.01 ≤ ϕ ≤ 0.04, i.e., less than 4% of the electrochemically active area is related to the internal area. For the conventionally prepared anodes, these values are slightly higher (0.04 ≤ ϕ ≤ 0.16).
The low morphology factor values observed for all anodes (i.e., close to 0) can be attributed to the high calcination temperature required to produce these anodes. This observation is in good agreement with the literature, where the increase in the calcination temperature represents a decrease in the morphology factor due to sintering effects.21,23,41,42 In other words, as the temperature increases, agglomeration of grains and layer crystallization occurs, thereby reducing the internal surface area. However, note that morphology factors are even lower for the laser-prepared anodes, which may be associated with the rapid heating and cooling rates in this synthesis methodology. This finding was seen in our previous report,23 where laser-prepared SnO2–Sb anodes presented lower morphology factors than those conventionally prepared, regardless of the temperatures studied. Besides, among the temperatures studied (from 400 to 600 °C), the lowest internal area values are found for the highest temperature.
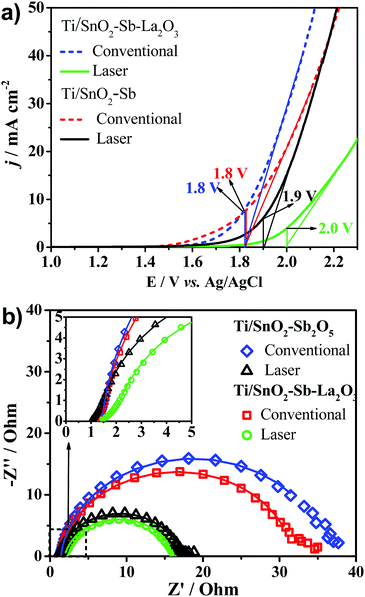
The LSV profiles (Fig. 6a) show that both Ti/SnO2–Sb2O5 and Ti/SnO2–Sb–La2O3 laser-prepared anodes showed a shift in the OER overpotential to more positive potentials, as previously discussed in the CV results (Fig. 5). The OER overpotential values taken from LSV were applied during the EIS tests. Fig. 6b shows the Nyquist plots of the studied anodes. All anodes show well-developed semicircles, which are characteristics of the charge-transfer process for the OER. Comparing the two compositions prepared by laser (Table 3), the charge transfer resistance reduction indicates that probably better electrocatalytic performance can be achieved when laser heating is employed.
| Anode | Heating method | OEP (V vs. Ag/AgCl) | R Ω/Ω | R ct/Ω | Q dl | n dl |
|---|---|---|---|---|---|---|
| Ti/SnO2–Sb2O5 | Conventional | 1.8 | 1.4 | 34.5 | 0.003 | 0.95 |
| Ti/SnO2–Sb–La2O3 | 1.8 | 1.4 | 30.6 | 0.002 | 0.93 | |
| Ti/SnO2–Sb2O5 | Laser | 1.9 | 1.3 | 15.8 | 0.001 | 0.92 |
| Ti/SnO2–Sb–La2O3 | 2.0 | 1.9 | 14.61 | 0.003 | 0.88 |
Finally, one of the main parameters related to the costs for the production of MMO anodes is the operational costs. For conventionally prepared samples, a specific heating rate and some intermediate temperatures are required, and the cooling process occurs when the furnace is switched off, and the material is kept inside the furnace until it reaches room temperature. The total time, i.e., the sum of time required for each heating/cooling step, to produce the SnO2–Sb anodes used in the present study was 37 h for the required 4 coating layers. Conversely, for the laser-prepared samples, a first step is conducted in the furnace, which takes 9.7 h, then the time for the remaining three layers required was 45 min (i.e., 15 min for each layer). In the laser heating method, the cooling occurs instantaneously, which means the total time required to produce the same anode is around 3.5-fold lower (10.45 h) (Fig. 7a). Moreover, and considering the average electric power monitored during the laser and furnace processing, the calculated energy consumption is reduced 2.5-fold for the laser heating compared with the conventional method (i.e., furnace) (Fig. 7b). Therefore, taking into account not only the improved electrocatalytic properties but the use of laser heating is also advantageous in reducing manufacturing costs of synthesis compared with the respective conventional anodes prepared in the present work, as already pointed out by our research group.22
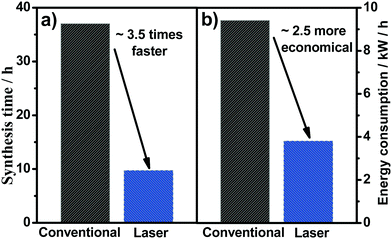 | ||
| Fig. 7 Total time (a) and energy consumption (b) used for the synthesis of the laser and conventionally prepared anodes. | ||
Electrochemical oxidation
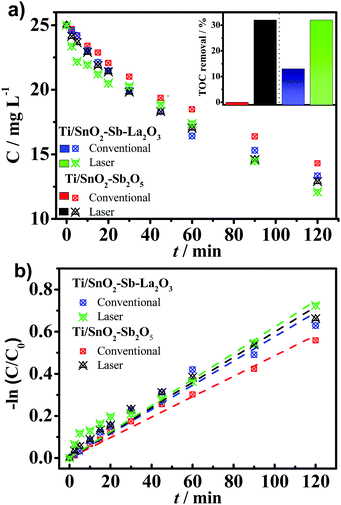
The electrochemical oxidation of aqueous wastes using “non-active” anodes, such as those studied in the present work, is mainly based on the hydroxyl radicals electrogenerated on the anode's surface (generically denominated as M) [M + H2O → M (˙OH) + H+ + e−], which reacts to degrade recalcitrant organic compounds (such as aromatic, chlorinated and phenolic compounds). Thus, in order to evaluate the electrocatalytic activity of the synthesized anodes, the electrochemical oxidation of 25 mg L−1 of 4-nitrophenol was monitored for 120 min applying a fixed current density of 30 mA cm−2 in Na2SO4 0.25 mol L−1. As a result, Fig. 8a shows that the Ti/SnO2–Sb2O5 prepared by laser and the conventional anode were able to degrade, respectively, 42.8% and 46.8% of 4-NP after 120 min of electrolysis. Likewise, when La was added, the laser and conventional Ti/SnO2–Sb–La2O3 anodes degraded 48.4% and 51.6% of the 4-nitrophenol, respectively. Moreover, total organic carbon (TOC) measurements were carried out to evaluate the mineralization ability of the anode materials. As expected, the mineralization degree after 2 h of electrolysis was more remarkable for the laser-prepared anodes (∼32% for both compositions). Whereas, for the conventionally prepared anodes, no reduction on TOC was observed using the Ti/SnO2–Sb2O5 anode, while only 13.9% removal was attained using the Ti/SnO2–Sb–La2O3 anode (inset in Fig. 8a). These outcomes confirm the superior performance of the laser-prepared anodes to convert the contaminant into CO2, H2O, and inorganic ions.Quenching experiments were carried out using isopropanol (at 0.4 mol L−1)43 to confirm that the primary mechanism for the removal rates observed at the distinct electrodes is related to the presence of ˙OH species (Fig. S2, ESI†). Clearly, in the presence of isopropanol (scavenger for ˙OH), the removal rate of 4-NP decreases from ∼50% to around 15% for all electrodes. It translates to a reduction of ∼70% of the degradation efficiency, thereby indicating that the ˙OH radicals are the dominant oxidative species for all electrodes studied under the experimental conditions. On the other hand, the degradation percentage of the contaminant in the presence of isopropanol (∼15%) can be attributed to other mechanisms, such as direct oxidation involving electron-transfer reactions occurring onto the anode's surface as well as the presence of other reactive oxygen species (e.g., O2−˙, HO2˙).
The exponential profile of the 4-nitrophenol as a function of the time points to pseudo-first-order kinetics (Fig. 8b). The apparent kinetic rate (kapp) constants for the contaminant removal observed for conventional anodes is lower (Table 4) than those on laser-prepared anodes. It can be seen that the laser heating slightly increases the kinetic rate constant by 1.27 and 1.0 fold when the Ti/SnO2–Sb2O5 anode is employed.
| Anode | Heating method | k app (min−1) | R 2 | 4-Nitrophenol removal (%) | E EO (kW h m−3 order−1) |
|---|---|---|---|---|---|
| Ti/SnO2–Sb2O5 | Conventional | 0.00485 | 0.99 | 42.8 | 3.03 |
| Ti/SnO2–Sb–La2O3 | 0.00576 | 0.98 | 46.8 | 2.69 | |
| Ti/SnO2–Sb2O5 | Laser | 0.00598 | 0.98 | 48.4 | 2.57 |
| Ti/SnO2–Sb–La2O3 | 0.00622 | 0.97 | 51.6 | 2.45 |
Similar results were pointed out by Xu et al.,17 which showed that the insertion of La improved the electronic conducting performance of the SnO2–Sb anodes for phenol removal and was accompanied by an improvement of the anodes electrochemical properties.17 The addition of lanthanum oxide in the composition improved the 4-NP removal, corroborating with the electrochemical characterization that showed a shift of the OEP to more positive values (Fig. 6a), representing an improvement in the electrocatalytic properties. Cui et al.44 studied the influence of diverse rare earth element (Ce, Eu, Gd, and Dy) doping on Ti/SnO2–Sb, noticing that the doping increased by 7–13% the degradation rates of phenol when compared with non-doped samples.44 Xu et al.17 synthesized anodes of Ti/SnO2–Sb doped with lanthanum and ruthenium through thermal decomposition and tested the electrochemical performance of these electrodes using phenol as the model compound.17 UV-Vis absorption spectroscopy showed that both phenol and its intermediary were more rapidly decomposed when La and Ru were used. The chemical oxygen demand (COD) reduction of 86.4% and 82.1% for the Ti/SnO2–Sb–La and Ti/SnO2–Sb–Ru were also higher than the removal taken with the non-doped anode (60%).17
At this point, it is worth considering that although the 4-NP removal efficiency only slightly increases for laser-prepared anodes, TOC removal data (inset in Fig. 8a) provide information about the mineralization extent at different anodes. The much superior mineralization observed for the laser-prepared anodes could be attributed to the more significant amount of ˙OH radicals electrogenerated at the surface of these anodes. Hence, it must be considered that the ˙OH radicals are the dominant oxidative species for all anodes studied, mainly for the laser-prepared anodes (Fig. S2, ESI†). These outcomes corroborate with CV (Fig. 5) and LSV (Fig. 6a) data since as the OER shifts to more positive overpotential values, it means a higher formation of this powerful oxidant. This behavior has been previously reported; some studies showed a little effect of the anode material on the pollutant decay but a considerable effect on the TOC removal. The greater production of ˙OH was responsible for the faster conversion of by-products into CO2, H2O, and inorganic ions.45,46 For instance, Sopaj et al.45 observed that the four different anodes (platinum, boron-doped diamond – BDD, graphite felt, and a dimensionally stable anode – DSA) were applied to remove sulfamethazine by electro-Fenton and displayed almost similar efficiencies. However, the BDD anode led to almost complete mineralization due to a greater amount of ˙OH radicals produced at the surface of this anode. It can also be observed if considering its highest overpotential for the oxygen evolution reaction among the anodes studied. Another study by Murillo-Sierra et al.46 demonstrated that similar degradation rates of sulfamethoxazole (SMX) + trimethoprim (TMP) are attained with IrO2-based, Pt, and BDD anodes plus an air diffusion cathode (kSMX-values from 0.3–0.37 min−1; kTMP, close to 0.43–0.50 min−1), due to the main attack of ˙OH in the bulk solution. In contrast, much faster TOC removal was observed at the BDD anode due to the more considerable ˙OH radicals produced.
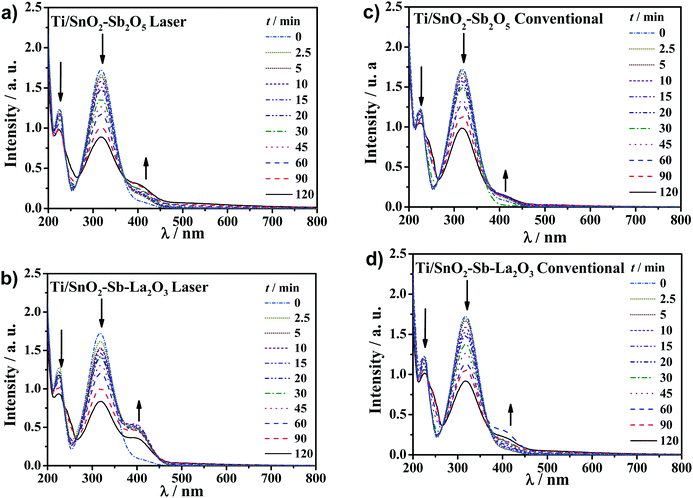
Further investigation of UV spectra can be used to point out some intermediates (Fig. 9). The UV spectra present an absorbance band centered at 317 nm related to the 4-NP that decreased with electrolysis time for all anodes. In parallel, the appearance of a new band centered at 400 nm can be associated with the conversion of 4-nitrophenol to 4-aminophenol as a contribution of cathode reduction, which has been reported to be the most probable intermediate accumulated from the reduction of 4-NP or to the formation of p-nitrophenolate ions.47–49 Moreover, the presence of a shoulder in the spectra at 240 nm suggests benzoquinone formation, as pointed out in previous studies on the removal of phenolic compounds.17,50–53 Benzoquinone and hydroquinone are known as redox couples in equilibrium in an aqueous solution; thus, it is reasonably likely the occurrence of both by-products due to oxidation by hydroxyl radicals.3,54,55 Besides, high-performance liquid chromatography (HPLC) analysis was performed for a representative sample of the treated solution collected at the beginning of the reaction (i.e., 5 min) using the laser-prepared Ti/SnO2–Sb–La2O3 anode to identify, in the C-18 column, the aromatic by-products formed (Fig. S3, ESI†). HPLC data show a band with overlapped peaks between 2.9 and 3.3 min of retention time appearing during electrolysis. These signals correspond to hydroquinone and benzoquinone as the principal by-products formed during the electrochemical oxidation of 4-NP in a Na2SO4 medium; they match very well with their standard solutions, agreeing well with some previous reports.56–58 Moreover, a peak that appears at 5.6 min may be due to 4-aminophenol or to the formation of p-nitrophenolate ions.47–49,56 Likewise, a low-intensity peak that appears at 5.8 min could be of 1,2,4-trihydroxybenzene or 3,4,5-trihydroxy-nitrobenzene at quite low concentrations, according to previous reports where hydroxyl radicals are the main oxidant species.59
Quiroz et al.57 investigated the electrocatalytic degradation of 4-nitrophenol at Pb/PbO2 anodes under different experimental conditions. The maximum removal of 4-NP (97%) was achieved after 7 h in alkaline media at 20 mA cm−2 and 60 °C, whereas benzoquinone was the main by-product accumulated.57 Chu et al.60 reported the 4-NP removal at the Ti/SnO2–Sb2O5–IrO2 electrode and the electro-Fenton oxidation with two cathodes (a gas diffusion electrode and a graphite electrode). Under the best conditions, 4-NP (200 mg L−1) was removed entirely after around 6 h of treatment.60 Cañizares et al.56 studied the electrochemical treatment of 4-NP containing wastes using a diamond thin-film anode at 30 mA cm−2 in sulfate media.56 They achieved complete removal of the organic matter, applying around 32 A h L−1 of specific electrical charge passed (approximately 7 h of treatment). Quinones (hydroquinone and benzoquinone) or phenol were found as the first stage intermediates due to the release of the nitro group from the aromatic ring, while on the cathode, the reduction to 4-aminophenol takes place.56
In electrochemical oxidation technology, the chief operating costs are related to the energy demand required during the process. Therefore, energy consumption is an essential factor in assessing the economic viability of the process. In this sense, the electrical energy needed to reduce the concentration of the contaminant in order of magnitude (EEO) was used here as an important parameter of comparison with the literature. The EEO values obtained considering each anode material (Table 4) show a reduction of 15 and 9% for the laser-prepared anodes of Ti/SnO2–Sb2O5 and Ti/SnO2–Sb–La2O3, respectively. Moreover, the low EEO value obtained for the Ti/SnO2–Sb–La2O3 anode (2.45 kW h m−3 order−1) can be positively compared with other highly efficient AOPs, as reported by Vilhunen et al.,61 which used UV LEDs and H2O2 for the phenol photodecomposition (H2O2![[thin space (1/6-em)]](https://www.rsc.org/images/entities/char_2009.gif) :
:![[thin space (1/6-em)]](https://www.rsc.org/images/entities/char_2009.gif) phenol molar ratio = 50) and found EEO of 352 kW h m−3 order−1.61 Another report by Benito et al. studied the degradation of aniline in wastewater by EO, UV, and UV/H2O2 and found EEO values of 270.1, 899.3, and 187.9 kW h m−3 order−1, respectively.62
phenol molar ratio = 50) and found EEO of 352 kW h m−3 order−1.61 Another report by Benito et al. studied the degradation of aniline in wastewater by EO, UV, and UV/H2O2 and found EEO values of 270.1, 899.3, and 187.9 kW h m−3 order−1, respectively.62
Finally, summed to the anodes with improved properties obtained, the advantage of a significant reduction in processing time makes the laser method quite attractive from the economic point of view.
Experimental
Chemicals
All solutions were prepared using ultrapure water (Gehaka MS 2000) and chemical reagents with analytical grade without further purification. SnCl2 (99.99%), SbCl3 (99.99%), LaCl3 (99.9%), anhydrous citric acid (CA) (99%) ethylene glycol (EG) (99.8%) and isopropanol (99.5%) were purchased from Sigma-Aldrich®. Hydrochloric acid (38% – Vetec®) and oxalic acid (99.5% – Neon®) were employed for the pre-treatment of the Ti substrate. Electrochemical measurements were carried out using sulfuric acid (95–98%) or sodium sulfate (99.0%) from Sigma-Aldrich®.Preparation of the anodes
The anodes were prepared by the Pechini method, as described by Santos et al.23 First, EG was heated up to 60 °C, and then, under stirring, CA was added. After total acid dissolution, tin, antimony, and lanthanum chlorides were added at the molar ratios of EG![[thin space (1/6-em)]](https://www.rsc.org/images/entities/char_2009.gif) :
:![[thin space (1/6-em)]](https://www.rsc.org/images/entities/char_2009.gif) AC
AC![[thin space (1/6-em)]](https://www.rsc.org/images/entities/char_2009.gif) :
:![[thin space (1/6-em)]](https://www.rsc.org/images/entities/char_2009.gif) metal molar ratio (6
metal molar ratio (6![[thin space (1/6-em)]](https://www.rsc.org/images/entities/char_2009.gif) :
:![[thin space (1/6-em)]](https://www.rsc.org/images/entities/char_2009.gif) 3
3![[thin space (1/6-em)]](https://www.rsc.org/images/entities/char_2009.gif) :
:![[thin space (1/6-em)]](https://www.rsc.org/images/entities/char_2009.gif) 1). A precursor solution of the oxide material was prepared with a nominal composition of Ti/(SnO2)0.84(Sb2O5)0.16 (named Ti/SnO2–Sb2O5) and Ti/(SnO2)0.84(Sb)0.06(La2O3)0.10 (named Ti/SnO2–Sb–La2O3).
1). A precursor solution of the oxide material was prepared with a nominal composition of Ti/(SnO2)0.84(Sb2O5)0.16 (named Ti/SnO2–Sb2O5) and Ti/(SnO2)0.84(Sb)0.06(La2O3)0.10 (named Ti/SnO2–Sb–La2O3).
Titanium substrates were initially polished with sand-papers 360 and 400, then rinsed with water. After that, the titanium substrates were chemically treated in sequence in 20% HCl and 10% oxalic acid, both for 10 min at 100 °C, being finally rinsed with ultrapure water. The support was then brushed with the precursor solution, followed by calcination. For the conventionally prepared anodes, the materials were first treated, in an electric furnace, at 130 °C for 30 min, then 250 °C for 15 min, and finally at the final calcination temperature (600 °C), following a heating rate of 5 °C min−1.23 For the CO2 laser-prepared anodes, the power density was raised to 0.3 W mm−2 to achieve a temperature of 600 °C (almost instantaneously), which was kept constant for 15 min. After that, the laser was shut off, and then the samples were cooled immediately to room temperature.23 It is worth mentioning that, for the laser process, the first layer is calcinated using the furnace, and the three subsequent layers required to achieve the mass load are carried out using laser heating only. This procedure was repeated until a total mass of 1.2 mg cm−2 of metallic oxides was deposited over the substrate surface,63 which was attained after four calcination steps for both methods.
Physical and electrochemical characterization
The surface morphology and composition of the coatings were analyzed employing a field emission scanning electron microscope with high resolution (FE-SEM; Zeiss GeminiSEM 500) and by SEM coupled with EDS in a JEOL JSM-5700 LV microscope. The XPS analysis was carried out using a commercial spectrometer (UNI-SPECS with UHV system PHOIBOS 150 9MCD power analyzer). An Al Kα line was used (hν = 1486.6 eV), and the analyzer pass energy was set to 50 eV during the survey scans and to 20 eV for region scans. The binding energy scale of the spectra corrected using the C 1s C–H group of carbon (284.8 eV). The spectra were fitted without placing constraints with multiple Voigt profiles using the CasaXPS software. The XRD patterns were recorded in a diffractometer (Bruker), with Cu Kα radiation (λ = 0.15406 nm) in a scanning interval of 2θ between 20° and 80°, in a continuous scan mode of 0.02° min−1. The contact angle measurements were carried out on a pendant drop tensiometer (Teclis Tracker, IT Concept).The electrochemical system consisted of a one-compartment three-electrode cell coupled to a potentiostat (Autolab PGSTAT 302N). The reference and counter electrodes were Ag/AgCl (3.0 mol L−1 KCl) and a platinum plate (1 cm2). The working electrodes used were the Ti/SnO2–Sb2O5 or Ti/SnO2–Sb–La2O3 anodes prepared here.
Cyclic voltammetry experiments were performed at 50 mV s−1 in 0.1 mol L−1 Na2SO4, between the potential limits from 0.0 to 1.8 V vs. Ag/AgCl. The EIS measurements were performed in 0.5 mol L−1 H2SO4 medium covering a frequency range of 0.1–104 Hz using an AC sine signal amplitude of 5 mV. The potential applied for each anode corresponded to their respective oxygen evolution reaction (OER) overpotential determined by LSV in the same electrolyte conditions.
The morphology factor of the anodes was determined using the data obtained from cyclic voltammetry profiles at several scan rates (10–300 mV s−1) in a 0.1 mol L−1 Na2SO4 electrolyte, according to the methodology described by Da Silva et al.40
Electrolysis
The electrolysis experiments were carried out in a single three-electrode cell where a Pt plate was used as the counter electrode, an Ag/AgCl as the reference electrode, and the anodes produced in this study as the working electrodes (2 cm2 of the exposed area). A volume of 150 mL aqueous solution containing 25 mg L−1 (1.8 × 10⁻⁴ mol L−1) of 4-nitrophenol in 0.25 mol L−1 Na2SO4 as a supporting electrolyte was treated applying a current density of 30 mA cm−2. Samples were collected at given times of reaction and analyzed in the UV-Vis spectra (BIOCHROM- Libra S22) from 200 to 800 nm. The 4-NP concentration was monitored by using a calibration curve of 4-NP concentrations versus absorbance at 317 nm. The total organic carbon (TOC) was measured using a TOC-VCPH, TOC-Control V software, Shimadzu. High-performance liquid chromatography (HPLC) was used to identify the intermediates formed during the electrochemical oxidation of 4-NP. A Shimadzu Prominence chromatograph equipped with a diode array detector (DAD) and a Phenomenex reversed-phase C18 column was used. The stationary phase (150 × 4.6 mm, 5 μm particle size) and a mixture of 50% acetonitrile and 50% ultrapure water as mobile phase at a flow rate of 0.7 mL min were used. The sample injection volume was 20 μL considering a detection wavelength of 270 nm, and the retention time was around 5.16 min (for 4-NP).The electrical energy per order (EEO), defined as the electrical energy (kW h) required to reduce the concentration of pollutants by one order of magnitude (i.e., by 90%) in 1 m3 of water, was estimated. The EEO can be calculated from eqn (1) considering a batch system, where Ecell is the cell potential (V), I is the average applied current density (A), Vs is the volume (L) k1 is the pseudo-first-order constant (min−1), and 38.4 × 10⁻⁴ is a conversion factor (1 h/60 min/0.4343).64–66
 | (1) |
Conclusions
In this study, SnO2-based anodes were successfully produced by a thermal laser process allowing more compact and homogeneous coatings than the conventionally-made anodes. The laser-prepared anodes display a more positive shift in the oxygen evolution reaction onset potential than the anodes produced in the furnace, regardless of the composition, which translates into an improvement in the electrocatalytic activity. Charge transfer resistance is reduced 2-fold with the use of laser heating, which can be reflected in savings in energy consumption. From the emerging contaminant (4-nitrophenol) electrolysis, laser-prepared anodes led to an increase in up to 1.27-fold in the kinetics rate on the contaminant removal, which was attributed to their improved electrocatalytic and conductivity properties. Higher efficiencies of the laser-prepared anodes clearly show that these materials are excellent candidates to be used in water and wastewater treatment. Finally, the proposed synthesis method resulted in anodes with enhanced electrochemical and electrocatalytic behavior in a shorter synthesis time than the conventionally-made anodes.Conflicts of interest
There are no conflicts to declare.Acknowledgements
Financial support from the Brazilian agencies Conselho Nacional de Desenvolvimento Científico e Tecnológico – CNPq (grants 304419/2015-0, 305438/2018-2, 311856/2019-5, and 310572/2016-9), Coordenação de Aperfeiçoamento de Pessoal de Nível Superior – CAPES (88882.365552/2018-01, and 88881.187890/2018-01) and FAPITEC/SE. We also thank Iago Oliveira from Núcleo de Estudos Coloidais (NUESC/ITP) for the contact angle measurements and Profa. Dra. Luciane Pimenta Cruz Romão from the Federal University of Sergipe for the access to HPLC.Notes and references
- Y.-P. Li, H.-B. Cao, C.-M. Liu and Y. Zhang, J. Hazard. Mater., 2007, 148, 158–163 CrossRef CAS PubMed.
- H.-l. Zhang and J.-B. Cai, Environ. Sci. Technol., 2011, 34, 113–117 Search PubMed.
- S. Kumar, S. Singh and V. C. Srivastava, Chem. Eng. J., 2015, 263, 135–143 CrossRef CAS.
- Y. Yavuz and A. S. Koparal, J. Hazard. Mater., 2006, 136, 296–302 CrossRef CAS PubMed.
- F. M. M. Tchieno and I. K. Tonle, Rev. Anal. Chem., 2018, 37 Search PubMed.
- A. R. Dória, M. Pupo, G. O. S. Santos, D. da Silva Vilar, N. H. Torres, L. F. R. Ferreira, E. B. Cavalcanti, K. I. B. Eguiluz and G. R. Salazar-Banda, Ecotoxicol. Environ. Saf., 2020, 198, 110659 CrossRef.
- I. M. Gonzaga, A. Moratalla, K. I. Eguiluz, G. R. Salazar-Banda, P. Cañizares, M. A. Rodrigo and C. Saez, Sci. Total Environ, 2020, 736, 139536 CrossRef CAS PubMed.
- Y. Jiang, X. Zhu, H. Li and J. Ni, Chemosphere, 2010, 78, 1093–1099 CrossRef CAS PubMed.
- J. D. García-Espinoza and P. M. Nacheva, Sci. Total Environ., 2019, 691, 417–429 CrossRef PubMed.
- G. O. S. Santos, I. M. D. Gonzaga, A. R. Dória, A. Moratalla, R. S. da Silva, K. I. B. Eguiluz, G. R. Salazar-Banda, C. Saez and M. A. Rodrigo, Chem. Eng. J., 2020, 398, 125568 CrossRef CAS.
- C. A. Martínez-Huitle, M. A. Rodrigo, I. Sirés and O. Scialdone, Chem. Rev., 2015, 115, 13362–13407 CrossRef PubMed.
- M. J. Santos, M. C. Medeiros, T. M. Oliveira, C. C. Morais, S. E. Mazzetto, C. A. Martínez-Huitle and S. S. Castro, Electrochim. Acta, 2016, 212, 95–101 CrossRef CAS.
- W. Wu, Z.-H. Huang and T.-T. Lim, Appl. Catal., A, 2014, 480, 58–78 CrossRef CAS.
- R. Berenguer, J. M. Sieben, C. Quijada and E. Morallón, ACS Appl. Mater. Interfaces, 2014, 6, 22778–22789 CrossRef CAS.
- A. N. S. Rao and V. T. Venkatarangaiah, Environ. Sci. Pollut. Res., 2014, 21, 3197–3217 CrossRef PubMed.
- M. M. S. Pupo, L. M. da Silva, G. O. S. Santos, K. I. B. Eguiluz and G. R. Salazar-Banda, Chem. Eng. Commun., 2020, 207, 1736–1754 CrossRef.
- H. Xu, A.-P. Li, Q. Qi, W. Jiang and Y.-M. Sun, Korean J. Chem. Eng., 2012, 29, 1178–1186 CrossRef CAS.
- C. W. A. Bezerra, G. O. S. Santos, M. M. S. Pupo, M. A. Gomes, R. S. Silva, K. I. B. Eguiluz and G. R. Salazar-Banda, J. Electroanal. Chem., 2020, 859, 113822 CrossRef CAS.
- R. de Mello, L. H. Santos, M. M. S. Pupo, K. I. Eguiluz, G. R. Salazar-Banda and A. Motheo, J. Solid State Electrochem., 2018, 22, 1571–1580 CrossRef CAS.
- L. M. da Silva, G. O. S. Santos, M. M. D. S. Pupo, K. I. B. Eguiluz and G. R. Salazar-Banda, J. Electroanal. Chem., 2018, 813, 127–133 CrossRef.
- M. O. Santos, G. O. S. Santos, S. Mattedi, S. Griza, K. I. B. Eguiluz and G. R. Salazar-Banda, J. Electroanal. Chem., 2018, 829, 116–128 CrossRef CAS.
- G. O. S. Santos, L. R. A. Silva, Y. G. S. Alves, R. S. Silva, K. I. B. Eguiluz and G. R. Salazar-Banda, Chem. Eng. J., 2019, 355, 439–447 CrossRef CAS.
- G. O. S. Santos, V. M. Vasconcelos, R. S. da Silva, M. A. Rodrigo, K. I. B. Eguiluz and G. R. Salazar-Banda, Electrochim. Acta, 2020, 332, 135478 CrossRef.
- Q. Bi, W. Guan, Y. Gao, Y. Cui, S. Ma and J. Xue, Electrochim. Acta, 2019, 306, 667–679 CrossRef CAS.
- W. Hume-Rothery, The structure of metals and alloys, Institute of Metals, London, 1936 Search PubMed.
- R. D. Shannon, Acta Crystallogr., Sect. A: Cryst. Phys., Diffr., Theor. Gen. Crystallogr., 1976, 32, 751–767 CrossRef.
- I. C. Goncalves, W. T. dos Santos, D. V. Franco and L. M. da Silva, Electrochim. Acta, 2014, 121, 1–14 CrossRef CAS.
- Z. Sun, H. Zhang, X. Wei, X. Ma and X. Hu, J. Solid State Electro Chem., 2015, 19, 2445–2456 CrossRef CAS.
- K. R. Deepthi, G. V. Ramesh, R. Kodiyath, P. S. M. Kumar, A. Dakshanamoorthy and H. Abe, J. Mater. Chem. A, 2017, 5, 1667–1671 RSC.
- F. H. Aragón, I. Gonzalez, J. A. H. Coaquira, P. Hidalgo, H. F. Brito, J. D. Ardisson, W. A. A. Macedo and P. C. Morais, J. Phys. Chem. C, 2015, 119, 8711–8717 CrossRef.
- H. Zhuang, W. Xu, L. Lin, M. Huang, M. Xu, S. Chen and Z. Cai, J. Mater. Sci. Technol., 2019, 35, 2312–2318 CrossRef.
- L. Ran, D. Zhao, X. Gao and L. Yin, CrystEngComm, 2015, 17, 4225–4237 RSC.
- M. Z. Ansari, N. Parveen, D. K. Nandi, R. Ramesh, S. A. Ansari, T. Cheon and S.-H. Kim, Sci. Rep., 2019, 9, 10225 CrossRef PubMed.
- S. Chen, B. Pan, L. Zeng, S. Luo, X. Wang and W. Su, RSC Adv., 2017, 7, 14186–14191 RSC.
- D. Barreca, A. Gasparotto, C. Maragno, E. Tondello, E. Bontempi, L. E. Depero and C. Sada, Chem. Vap. Deposition, 2005, 11, 426–432 CrossRef CAS.
- C. Comninellis, Electrochim. Acta, 1994, 39, 1857–1862 CrossRef CAS.
- C. A. Martínez-Huitle and M. Panizza, Curr Opin Electrochem, 2018, 11, 62–71 CrossRef.
- W. Wu, Z.-H. Huang and T.-T. Lim, RSC Adv., 2015, 5, 32245–32255 RSC.
- C. De Pauli and S. Trasatti, J. Electroanal. Chem., 1995, 396, 161–168 CrossRef.
- L. Da Silva, L. De Faria and J. Boodts, Electrochim. Acta, 2001, 47, 395–403 CrossRef CAS.
- Y.-Y. Hou, J.-M. Hu, L. Liu, J.-Q. Zhang and C.-N. Cao, Electrochim. Acta, 2006, 51, 6258–6267 CrossRef CAS.
- A. Terezo and E. Pereira, Electrochim. Acta, 1999, 44, 4507–4513 CrossRef CAS.
- I. Sanchez-Montes, N. Wachter, B. F. Silva and J. M. Aquino, Chem. Eng. J., 2020, 386, 123986 CrossRef CAS.
- Y.-H. Cui, Y.-J. Feng and Z.-Q. Liu, Electrochim. Acta, 2009, 54, 4903–4909 CrossRef CAS.
- F. Sopaj, N. Oturan, J. Pinson, F. Podvorica and M. A. Oturan, Appl. Catal. B: Environ., 2016, 199, 331–341 CrossRef CAS.
- J. C. Murillo-Sierra, I. Sirés, E. Brillas, E. J. Ruiz-Ruiz and A. Hernández-Ramírez, Chemosphere, 2018, 192, 225–233 CrossRef CAS PubMed.
- X. Zhu and J. Ni, Electrochim. Acta, 2011, 56, 10371–10377 CrossRef CAS.
- S. Yuan, M. Tian, Y. Cui, L. Lin and X. Lu, J. Hazard. Mater., 2006, 137, 573–580 CrossRef CAS PubMed.
- W.-Y. Ahn, S. A. Sheeley, T. Rajh and D. M. Cropek, Appl. Catal., B, 2007, 74, 103–110 CrossRef CAS.
- T. M. do Prado, F. Lindo Silva, G. Grosseli, P. Sergio Fadini, O. Fatibello-Filho and F. C. Moraes, Materials, 2020, 13, 1322 CrossRef CAS PubMed.
- M. Loloi, A. Rezaee, M. Aliofkhazraei and A. S. Rouhaghdam, Environ. Sci. Pollut. Res., 2016, 23, 19735–19743 CrossRef CAS PubMed.
- X.-Y. Li, Y.-H. Cui, Y.-J. Feng, Z.-M. Xie and J.-D. Gu, Water Res., 2005, 39, 1972–1981 CrossRef CAS PubMed.
- X. Zhu, S. Shi, J. Wei, F. Lv, H. Zhao, J. Kong, Q. He and J. Ni, Environ. Sci. Technol., 2007, 41, 6541–6546 CrossRef CAS PubMed.
- P. H. Rieger, Electrochemistry, Prentice-Hall, Englewood Cliffs, London, 1987 Search PubMed.
- I. C. Monge-Romero and M. F. Suárez-Herrera, Synth. Met., 2013, 175, 36–41 CrossRef CAS.
- P. Canizares, C. Saez, J. Lobato and M. Rodrigo, Ind. Eng. Chem. Res., 2004, 43, 1944–1951 CrossRef CAS.
- M. A. Quiroz, S. Reyna, C. A. Martinez-Huitle, S. Ferro and A. De Battisti, Appl. Catal., B, 2005, 59, 259–266 CrossRef CAS.
- A. R. Dória, G. O. S. Santos, M. M. Pelegrinelli, D. C. Silva, D. B. de Matos, E. B. Cavalcanti, G. R. Salazar-Banda and K. I. B. Eguiluz, Environ. Sci. Pollut. Res., 2021 DOI:10.1007/s11356-020-10451-6.
- N. Rabaaoui, M. E. K. Saad, Y. Moussaoui, M. S. Allagui, A. Bedoui and E. Elaloui, J. Hazard. Mater., 2013, 250, 447–453 CrossRef PubMed.
- Y. Y. Chu, Y. Qian, W. J. Wang and X. L. Deng, J. Hazard. Mater., 2012, 199, 179–185 CrossRef PubMed.
- S. Vilhunen, E. V. Rokhina and J. Virkutyte, J. Environ. Eng., 2010, 136, 274–280 CrossRef CAS.
- A. Benito, A. Penadés, J. L. Lliberia and R. Gonzalez-Olmos, Chemosphere, 2017, 166, 230–237 CrossRef CAS PubMed.
- A. R. Dória, R. S. Silva, P. H. O. Júnior, E. A. dos Santos, S. Mattedi, P. Hammer, G. R. Salazar-Banda and K. I. Eguiluz, Electrochim. Acta, 2020, 354, 136625 CrossRef.
- J. R. Bolton, K. G. Bircher, W. Tumas and C. A. Tolman, Pure Appl. Chem., 2001, 73, 627–637 CAS.
- S. Garcia-Segura and E. Brillas, Appl. Catal., B, 2016, 181, 681–691 CrossRef CAS.
- M. Lanzarini-Lopes, S. Garcia-Segura, K. Hristovski and P. Westerhoff, Chemosphere, 2017, 188, 304–311 CrossRef CAS PubMed.
Footnote |
| † Electronic supplementary information (ESI) available. See DOI: 10.1039/d1ma00004g |
| This journal is © The Royal Society of Chemistry 2021 |

