 Open Access Article
Improved insights in time-resolved photoelectron imaging
Nikoleta
Kotsina
a and
Dave
Townsend
 *ab
*ab
aInstitute of Photonics & Quantum Sciences, Heriot-Watt University, Edinburgh, EH14 4AS, UK. E-mail: d.townsend@hw.ac.uk
bInstitute of Chemical Sciences, Heriot-Watt University, Edinburgh, EH14 4AS, UK
First published on 28th April 2021
Abstract
Time-resolved photoelectron imaging (TRPEI) is a highly differential technique for the detailed study of non-adiabatic energy redistribution dynamics operating in the electronically excited states of molecules following the absorption of ultraviolet light. This Perspective briefly reviews the main elements of the TRPEI method but also seeks to address some of its limitations. With the help of various examples drawn from our own recent work, we illustrate some of the challenges commonly encountered during the analysis and interpretation of experimental data and introduce some initial thoughts on approaches to help deal with them. We also discuss some novel methods that aim to expand the capabilities and utility of the TRPEI technique by extending the observation window along the photochemical reaction coordinate(s) and improving the temporal resolution. Given the widespread use of TRPEI and related ultrafast spectroscopies, we anticipate that this Perspective will be of broad interest to a sizeable research community. Furthermore, we hope it will also serve as a useful overview for those engaging with this topic for the first time.
I. Introduction
Our understanding and interpretation of molecular energy levels and structural dynamics is based on the central foundation provided by the Born–Oppenheimer approximation.1 This adiabatic picture introduces the concept of potential energy surfaces over which the much slower nuclear motion of a molecular framework (rotation and vibration) evolves. The specific morphology of these surfaces then dictates the feasibility and timescales of chemical processes. Following ultraviolet (UV) absorption, however, the coupling between nuclear and electronic degrees of freedom within the excited state manifold is often not negligible, leading to a rapid intramolecular redistribution of the excess energy. Such non-adiabatic effects are now known to be of fundamental importance in many light–molecule interactions,2–5 including numerous examples of biological, environmental, and technological relevance.6–14 Efforts to develop a more detailed understanding of non-adiabatic molecular dynamics – with particular emphasis on the interplay between chemical structure and mechanistic function – are therefore an important endeavor. In many real-world scenarios, intramolecular energy redistribution pathways will compete and/or work in tandem with intermolecular processes involving a solvent (e.g. electronic quenching and vibrational energy transfer). The intrinsic photophysics of a given system may be decoupled from any solvation effects, however, by performing experiments under collision-free conditions in the gas phase.Modern laser sources facilitate a wide range of experimental strategies for interrogating the complex non-adiabatic dynamics operating in the excited states of molecules with extremely high accuracy and precision. These may be broadly separated into frequency- and time-resolved variants, with a combination of different approaches (with different associated observables) typically being required to reveal a complete mechanistic picture. In the former category, quantum state resolved information may often be obtained using narrow linewidth lasers. This provides detailed information relating to the starting point on the photochemical reaction coordinate (via the absorption spectrum) and the asymptotic endpoints (i.e. the photoproducts). No direct observation of the intermediate pathways connecting these two limits is generally possible, though, due to the inherently long temporal duration of the laser pulses relative to the typical timescales of non-adiabatic energy redistribution processes. Nevertheless, frequency-resolved techniques can still provide a powerful tool for inferring the dynamics of photochemical events – particularly when, for example, phenomena such as photofragment vector correlations are taken into account.15–17 It is desirable, however, to also monitor the real-time evolution along the reaction coordinate as excited state population traverses the potential energy landscape, often via competing pathways that may operate in parallel and/or sequentially. This may typically be achieved in experiments conducted using (inherently broadband) laser pulses with temporal durations comparable to the ultrafast (i.e. sub-picosecond) timescales of vibrational motion. In these time-resolved measurements, an initial UV pump pulse interacts with the molecular sample of interest, optically preparing an excited state (or multiple states) within a narrow time window. The transitory dynamics are then interrogated by a second probe pulse at a series of incrementally varied delay times. The use of valence state photoionization in this second step is a commonly employed methodology, with options including time-resolved ion-yield (TRIY), time-resolved photoelectron spectroscopy (TRPES) and time-resolved photoelectron imaging (TRPEI). These techniques have proved highly instructive in revealing subtle mechanistic details of key relaxation pathways operating in a wide range of molecular systems. This is particularly true of the highly differential time-, energy- and angle-resolved TRPEI variant which will form the central theme of this Perspective. As expanded upon in Section II, at each individual pump–probe delay position, ejected photoelectrons are mapped onto a position-sensitive detector, generating a series of images that provide instantaneous snapshots of the energy redistribution dynamics at different points along the evolving reaction coordinate(s). Many aspects of the TRPES and TRPEI techniques have been extensively reviewed previously.18–28 There exist, however, certain restrictions in the application of the methodology, as well as associated challenges in the interpretation of some aspects of the data. The intended goal of this Perspective is therefore to present a more targeted focus on some of these limitations and, where possible, to propose some initial thoughts on new directions that potentially help overcome them. This will be guided by examples drawn from our own recent work in this area, pulling together several themes under a single coherent narrative. For greater technical detail and more extended discussion, the reader is directed to the original publications in which the various studies appeared.
The structure of this Perspective is as follows: we begin by providing a brief description of our TRPEI spectrometer and basic optical set-up, along with a summary of the approach commonly used for data analysis (Section II). We then consider an instructive case study of TRPEI measurements obtained for aniline and two of its methyl-substituted derivatives (Section III). This incorporates many key details of the overall methodology that will become common themes throughout later sections. It also provides a powerful initial demonstration of the detailed mechanistic insight afforded by the TRPEI approach – particularly regarding its angle-resolved aspect. This work additionally sets the scene for addressing the issue of relative detection sensitivity when observing competing non-adiabatic pathways in time-resolved measurements (Section IV). This is a critical (although often overlooked) consideration for improved insight into photochemical branching ratios. Attention then turns to the “observation window” in our measurements and how the extent of the view along the full photochemical reaction coordinate is influenced by the choice of probe wavelength (Section V). Using TRPEI measurements conducted on acetylacetone as an exemplar, the key advantages of exploiting short wavelength vacuum ultraviolet (VUV) probes will be demonstrated. We then discuss possibilities for improved access to the VUV region through recent technological developments using rare gas-filled capillaries and hollow-core photonic crystal fibres to exploit the phenomenon of resonant dispersive wave emission. These sources offer an extremely promising route for greatly extending the scope and utility of femtosecond pulse generation by providing widely tuneable output with extremely short temporal duration in a simple and compact setup. An initial demonstration of this general approach in TRPEI measurements is presented for the case of the styrene molecule (Section VI). Given its overall scope, we therefore anticipate this Perspective will provide several helpful insights that are of relevance to the widespread research community making use of time-resolved photoionization methods for the interrogation of photochemical dynamics.
II.A. Experimental approach
The pump and probe pulses employed in the selected TRPEI experiments discussed in later sections are derived from the fundamental beam of a 1 kHz regeneratively amplified Ti:Sapphire laser system operating with a central wavelength of 800 nm. The laser output is split into multiple beam lines, which are then utilized in different combinations to generate wavelengths in the UV or VUV spectral region through various non-linear optical processes. The exact wavelengths selected require careful consideration of the absorption bands of the molecule of interest as it is important to avoid any unwanted “probe–pump” signals in the photoelectron data close to zero delay times (see Section V for an expanded discussion). In most cases, UV pulses are produced using a series of birefringent crystals (β-barium borate, BBO) and half-waveplates. This can yield the second, third and/or fourth harmonics of the 800 nm fundamental (400 nm, 267 nm or 200 nm, respectively), or more widely tuneable pulses over the 320–220 nm range when using various multi-stage non-linear frequency up-conversion schemes incorporating the signal or idler output from (800 nm pumped) optical parametric amplifiers. Pulses in the VUV region are generated by non-collinear four-wave difference-frequency mixing of the laser fundamental (800 nm) and its 3rd harmonic (267 nm) in argon, as expanded upon in Section V. Tuneable UV pulses may also be generated using resonant dispersive wave emission in hollow-core photonic crystal fibres or capillaries, as discussed further in Section VI.Fig. 1 shows a cut-through section of the central apparatus used to conduct all the TRPEI measurements that will be discussed subsequently.29 This instrument consists of two differentially pumped chambers, arranged vertically and separated by a skimmer orifice. A lower (source) chamber houses a molecular beam valve for the generation of internally cooled gas phase molecular samples using helium as a carrier. Liquid and solid samples exhibiting low volatility are retained in a small cartridge mounted within the valve body itself (i.e. inside the source chamber), directly behind the exit nozzle. Normal operation of the solenoid driver then elevates the valve temperature sufficiently to obtain acceptable photoelectron signal levels. Samples exhibiting higher vapour pressures are, alternatively, placed in a pick-up vessel sitting external to the spectrometer. The valve nozzle may also be used as a continuous flow effusive source if required. This gives rise to more gentle gas expansion conditions, helping to restrict the formation of unwanted molecular clusters in some instances.
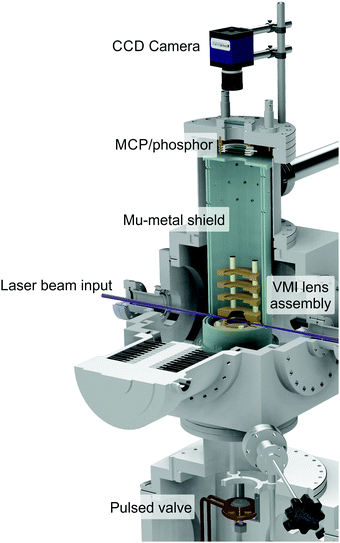 | ||
| Fig. 1 Cut-through illustration of the VMI spectrometer used to obtain the experimental TEPEI data present in this perspective. Figure adapted from Paterson and Townsend.58 | ||
An upper (main) chamber encloses an electrostatic lens assembly and a 40 mm dual microchannel plate (MCP) detector/P47 phosphor screen. The interaction between a molecular sample and the laser beams takes place between the first two plates of the lens stack (commonly known as the repeller and extractor electrodes). A recent upgrade to this setup – necessitated by the VUV experiments described in Section V – has involved coating the inner surfaces of these electrodes with a thin layer of a conductive material based on carbon nanotube arrays. This material is almost completely optically dark in the UV/VUV region and dramatically reduces background scattered light signals (which scale with 1/λ4 and so becomes increasingly problematic when moving to shorter wavelengths). Photoelectrons generated during sample ionization are guided along a short flight tube before hitting the imaging detector, where positional information is then recorded by an externally mounted CCD camera. By carefully tuning the ratio of voltages applied to the repeller and extractor, velocity map imaging (VMI) conditions may be realized,30 eliminating any spatial ionization volume effects and enhancing image resolution. The VMI lens assembly and flight tube are shielded from stray magnetic fields by a double layer mu-metal insulator. Relative pump and probe pulse energies are varied to optimize the contrast between two-colour (pump–probe) and one-colour (pump-alone and/or probe-alone) ionization under focused conditions at zero pump–probe delay. Here it is usually desirable to ensure the former scenario involves only a single pump and a single probe photon – a process denoted (1 + 1′) overall. Significant levels of competing (1 + 2′) pump–probe signals (where photoelectrons are produced via the absorption of one pump and two probe photons) can often complicate data analysis due to overlapping spectral bands originating from the two different ionization schemes (see Section V for an illustrative example). Pump energies must also be kept low to avoid saturation of the initial excitation step as this can influence the shape of the photoelectron angular distribution.31
For time-resolved data collection, a high-precision translation stage fitted with a retroreflector is placed in either the pump or probe beam line. The stage is repeatedly scanned between a series of pre-set positions corresponding to specific pump–probe delay times, Δt. Linear timesteps (typically of 30–50 fs) are taken in the region close to Δt = 0, with exponentially increasing increments used to sample more extended system dynamics out to hundreds of picoseconds (if required). As well as the pump–probe image, one-colour measurements of the pump-alone and probe-alone ionization may also be recorded at each pump–probe delay position for subsequent background subtraction. Accurate determination of the Δt = 0 position, the pixel-to-energy image calibration, and the temporal instrument response (i.e. the pump–probe cross-correlation function) is required in order to perform fully quantitative data analysis (as discussed below). This is ideally achieved in a single preliminary measurement using non-resonant (1 + 1′) ionization of an atom or molecule with a well-characterized photoelectron spectrum. Gaussian cross-correlations are typically in the 120–180 fs (FWHM) region, with the exact value depending on the specific pump and probe wavelengths being used.
II.B. Data analysis
The images collected in our TRPEI measurements result from projecting a three-dimensional charged particle distribution onto a two-dimensional detector plane, and additional processing of this raw data is required to permit quantitative energy- and angle-resolved analysis. This is often referred to as an inversion step and yields an image that is representative of the central slice through the original three-dimensional distribution. Numerous methods for carrying out this type of operation have been proposed previously, and the reader is directed to articles by Whitaker and co-workers32 and Hickstein et al.33 for a general overview. Image data presented in this Perspective have all been processed using a rapid matrix inversion scheme which has been detailed elsewhere.29In all experimental measurements presented here, photoelectron data were generated by the interaction of linear polarized light with a sample of randomly aligned molecules. The laser polarization directions are aligned parallel to the imaging plane of the photoelectron spectrometer. In this scenario, the photoelectron angular distributions (PADs) are described by a linear expansion of even Legendre polynomials, Pl(cos![[thin space (1/6-em)]](https://www.rsc.org/images/entities/char_2009.gif) θ). For the specific case of (1 + 1′) pump–probe ionization, the overall expression for the photoelectron angular anisotropy is as follows:23,34
θ). For the specific case of (1 + 1′) pump–probe ionization, the overall expression for the photoelectron angular anisotropy is as follows:23,34
 | (1) |
Detailed analysis of angle-integrated photoelectron spectra S(E,Δt) is undertaken using a standard Levenberg–Marquardt global fitting routine. The data are modelled by a series of n exponentially decaying functions that are convolved with the experimentally determined Gaussian cross-correlation function g(Δt):
 | (2) |
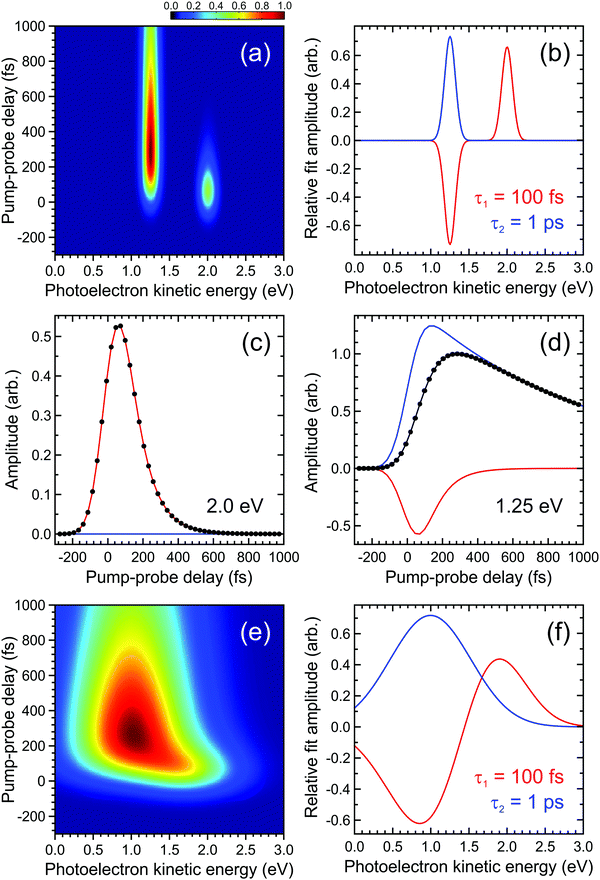 | ||
| Fig. 2 (a) Simulated time-dependent photoelectron spectrum exhibiting two narrow bands. The feature centred at 2.0 eV decays with a 1/e lifetime of 100 fs and this feeds population into the feature centred at 1.25 eV, which subsequently decays with a 1/e lifetime of 1 ps. (b) DAS plots extracted from a parallel global fit to the photoelectron spectrum using eqn (2) with a pair of exponentially decaying functions (labelled τ1 and τ2). In (c) and (d) the contributions of each function to modelling the overall transient pump–probe signal (black dots/line) at energies corresponding to the maximum intensity of each photoelectron band is clearly seen. Plots (e) and (f) are analogous to (a) and (b), respectively, but illustrate a situation where the photoelectron bands are no longer fully spectrally resolved from each other. For more details see main text. | ||
III. TRPEI of anilines
This section considers an instructive TRPEI study conducted on the aniline molecule and two of its methyl-substituted derivatives. Aniline-based motifs provide useful prototypes that approximate chemical functionality found within the purine DNA bases, as well as various synthetic dyes and pigments. It is therefore of great interest to better understand the non-radiative pathways for excess energy redistribution in these sub-units following potentially damaging UV absorption. Based on this rationale, the excited state dynamics operating in aniline and some of its derivatives have received considerable attention both theoretically and in experimental studies exploiting both time- and frequency-resolved spectroscopic techniques.46–55 Despite this, the nature of the interaction between the two lowest lying electronically excited states is not fully reconciled. Specifically, these are the S1(ππ*) valence state and a state exhibiting predominantly 3s Rydberg character in the Franck–Condon region that becomes increasingly πσ* valence in nature at extended N–H bond distances. We therefore use the label S2(3s/πσ*) to reflect this mixed composition. More generally, we also highlight that states of such mixed Rydberg/valence character are common to a broad range of small organic systems containing O, N or S hetero atoms and an expanded perspective may be gained from several detailed reviews.56–58 A key area of contention in aniline is the direction of non-adiabatic population transfer between the S1(ππ*) and S2(3s/πσ*) states. At higher excitation energies (<240 nm) the influence of a second ππ* state and influence of the 3p Rydberg manifold is also not yet fully resolved.Given the issues outlined above, we have previously employed TRPEI to investigate the excited state dynamics of aniline extensively over a range of pump wavelengths spanning 273 to 240 nm.59–61 Here, though, we concentrate on a small sub-set of measurements made using 250 nm excitation in three structurally related molecules: aniline, N,N-dimethylaniline (N,N-DMA) and 3,5-dimethylaniline (3,5-DMA), which are shown inset in Fig. 3. Simultaneous excitation of both the S1(ππ*) and S2(3s/πσ*) states is expected in all cases.62 Selected methylation of sites on the molecular skeleton impacts directly on the motions of the nuclei, and this is a helpful strategy for distinguishing the contributions of various vibrational modes to the overall energy redistribution dynamics. In this instance, our choice of specific target sites is guided by previous work implicating motion along the N–H stretch and deformations of the aromatic ring system as relevant coordinates.53,55 3,5-DMA was specifically selected over other possible methyl group substitutions to minimise proximity effects altering the NH2 group geometry with respect to the aromatic ring system and to maintain C2v symmetry (assuming free rotation of the CH3 groups).
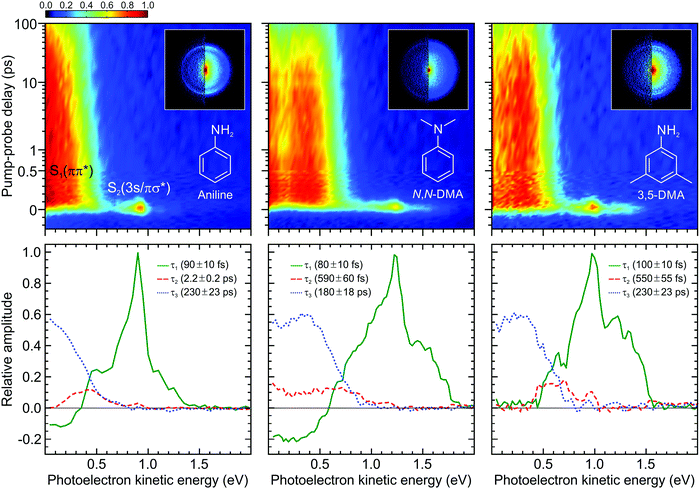 | ||
| Fig. 3 (top) Time-dependent (1 + 1′) photoelectron spectra of aniline, N,N-DMA, and 3,5-DMA obtained using a 250 nm pump and 300 nm (aniline) or 310 nm (N,N-DMA and 3,5-DMA) probe. The data is presented on a mixed linear/logarithmic time axis. Photoelectron images at Δt = 0 are inset, with the left half showing the result following application of inversion processing. (bottom) Corresponding DAS plots extracted from global fits to the photoelectron spectra (see main text for more details). The uncertainty in the quoted lifetimes τ1–3 is one standard deviation. Figure adapted from Thompson et al.60 | ||
The top row of Fig. 3 presents time-resolved photoelectron spectra resulting from (1 + 1′) ionization of aniline, N,N-DMA, and 3,5-DMA. VMI images at zero pump–probe delay are also overlaid. Upon first inspection, the overall features of the three data sets appear broadly similar. The images exhibit a narrow outer ring displaying a high degree of spatial anisotropy and a broad, unstructured inner component with much lower variation in angular intensity. As discussed in more detail elsewhere,58,60 the two distinct features may be assigned to ionization of the S2(3s/πσ*) and S1(ππ*) states, respectively. As seen in the spectra, these exhibit very different temporal behaviour, with S1(ππ*) giving rise to a very long-lived feature spanning the low (<0.7 eV) photoelectron kinetic energy region and S2(3s/πσ*) showing extremely rapid decay at higher energies. No resonant absorption is induced by our selected probe wavelength (300 nm for aniline, 310 nm otherwise) and so the spectra are free from any unwanted “probe–pump” contributions evolving towards negative Δt values. In all cases, three exponentially decaying functions are required to achieve a satisfactory fit to the data using the procedure outlined in Section II.B. We label these using their respective decay constants τ1–3 and the associated DAS plots are presented in the bottom row of Fig. 3. In the first of these (τ1 ≤ 100 fs), a prominent narrow peak is evident in the DAS at a photoelectron kinetic energy close to 1 eV. This sits on top of a broader, largely unstructured background. This overall spectral composition is indicative of extremely rapid Rydberg-to-valence evolution within the S2(3s/πσ*) state:58 At short N–H or N–CH3 bond extensions, “atomic-like” ionization of the dominant 3s component produces the narrow peak feature, whereas at increased bond distances the transition towards πσ* valence character now gives rise to a much broader photoelectron band. This dramatic change in orbital character is illustrated in Fig. 4, which also shows relevant calculated potential energy curves along the N–H stretch in aniline. As expanded upon below, the τ1 DAS may be attributed to a combination of internal conversion to the S1(ππ*) state and/or direct bond fission within S2(3s/πσ*). The second DAS (τ2 = 550 fs–2.2 ps) describes processes that may be attributed to rapid intramolecular vibrational redistribution (IVR) within the S1(ππ*) state, while the final function (τ3 = 180–230 ps) describes the much longer overall S1(ππ*) state lifetime.
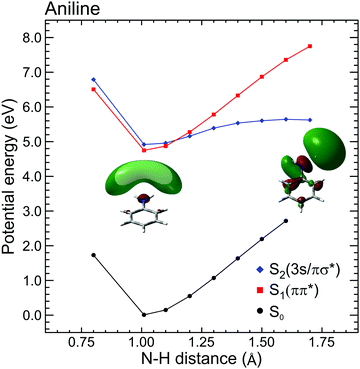 | ||
| Fig. 4 Diabatic EOM-CCSD/aug-cc-pVDZ potential energy cuts along the N–H stretching coordinate in aniline for the ground and first two electronically excited states. Inset images show S2(3s/πσ*) orbital plots at 1.01 Å and 1.7 Å. At equilibrium, the orbital is almost entirely 3s Rydberg in nature, but at increased N–H separation the evolution of πσ* valence character becomes readily apparent. Figure adapted from Thompson et al., which also contains additional computational details and some equivalent data for N,N-DMA and 3,5-DMA, (both of which exhibit similar behaviour to aniline).60 | ||
The DAS analysis also begins to reveal subtle variations in the dynamics of each system. As seen in Fig. 3, aniline and N,N-DMA exhibit a clear region of negative amplitude in their τ1 DAS at kinetic energies below ∼0.5 eV, whereas 3,5-DMA does not. This provides a useful illustration of the advantage offered by the parallel exponential decay model discussed earlier, as it may be inferred here that significant S2(3s/πσ*) to S1(ππ*) internal conversion is taking place in aniline and N,N-DMA, but that this is not an important pathway in 3,5-DMA. In the specific case of aniline, however, there is substantial evidence for an alternative deactivation channel (acting in competition with internal conversion) to which our TRPEI measurement is insensitive. Following 250 nm excitation, both the Ashfold and Stavros groups have previously reported extremely rapid N–H bond fission directly from the S2(3s/πσ*) state.53,55 This was inferred from the highly anisotropic H atom photofragment recoil distribution and, under time-resolved experimental conditions, also observed directly in the sub-picosecond generation of the photoproducts. The dissociative nature of the S2(3s/πσ*) state along the N–H coordinate is also apparent in Fig. 4. Since the τ1 = 100 fs lifetime seen in 3,5-DMA is still extremely short, exclusive dissociation along the N–H stretching coordinate therefore seems a likely candidate for the S2(3s/πσ*) state decay mechanism in this specific case.
Angular fits to our image data using eqn (1) reveal additional dynamical insight through the temporal evolution of the anisotropy parameters, which reflect the coupling between excited states via the induced mixing of their electronic character.63–65 This is illustrated in Fig. 5, which plots changes in the β2 anisotropy parameter for all three species under consideration as a function of pump–probe delay in the low kinetic energy region of the photoelectron spectrum (attributed to ionization of the S1(ππ*) state). The associated β4 values are not considered here due to their very small size and consequently high levels of associated statistical uncertainty. In aniline, the β2 parameter shows no significant variation in time. There are, however, clear indications from the DAS analysis to imply non-adiabatic coupling between S2(3s/πσ*)/S1(ππ*) states is occurring, as discussed earlier. The absence of any temporal variation therefore suggests that any changes in angular anisotropy associated with this deactivation pathway are too fast to discern properly within the temporal resolution of our experiment. In N,N-DMA, methylation of the N–H bond acts to slow down the S2(3s/πσ*)/S1(ππ*) coupling interaction. This is a small effect (as motion along the N–CH3 coordinate is still very rapid) but it nevertheless becomes apparent in the β2 anisotropy parameter variation, which takes ∼200 fs to reach a maximum value. This is comparable to the timescale of any direct dissociation and so internal conversion may still act as an effective competing pathway. In contrast, selected methylation of the aromatic ring in 3,5-DMA has a more dramatic effect on the internal conversion pathway for deactivation of the S2(3s/πσ*) state, as indicated by the much longer (∼1 ps) temporal evolution of β2. Since the direct dissociation process will not be slowed to the same extent, simple kinetic factors therefore dictate that in 3,5-DMA the population initially prepared in the S2(3s/πσ*) state will now be depleted almost exclusively via rapid H atom bond fission, long before the system can fully access the S1(ππ*)/S2(3s/πσ*) conical intersection and undergo internal conversion. Unlike aniline and N,N-DMA, no region of negative amplitude is consequently observed in the τ1 DAS of 3,5-DMA. Detailed examination of the PAD data therefore reveals a more detailed picture of the dynamics than that obtained from the DAS analysis of energy-resolved photoelectron spectra alone, clearly demonstrating the added benefit provided by the highly differential imaging aspect of the TRPEI measurements.
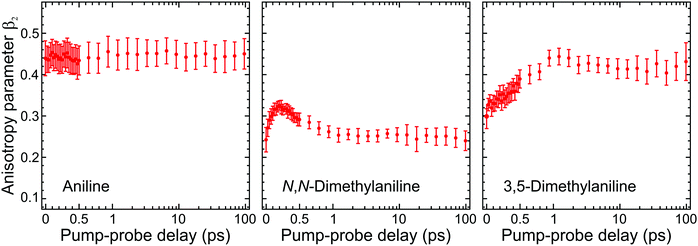 | ||
| Fig. 5 Time-dependent anisotropy parameter β2 averaged over specific kinetic energies for aniline (0.05–0.50 eV), N,N-DMA (0.05–0.80 eV), and 3,5-DMA (0.05–0.65 eV). This corresponds to regions in the photoelectron spectra where long-lived (≥180 ps) signals are observed (as modelled by the τ3 DAS in Fig. 3). Trends in the temporal variation of β2 are consistent across these regions and averaging only serves to provide improved data statistics. Error bars denote one standard deviation. Figure adapted from Thompson et al.60 | ||
IV. Relative detection sensitivity
Analysis of the TRPEI data presented in the previous section suggests two competing deactivation mechanisms for the S2(3s/πσ*) state in aniline and N,N-DMA. One key limitation, however, is that we are unable to assign a quantitative importance to each pathway (direct N–H or N–CH3 bond fission versus internal conversion). This issue arises due to significant variations in the relative effective sensitivity to ionization detection exhibited by dynamically evolving excited state populations during the overall energy redistribution dynamics. Since several factors may contribute simultaneously to the effective ionization detection sensitivity along a given reaction coordinate, and also between multiple competing reaction coordinates, this is an extremely challenging problem to address. Phenomena including excited state alignment, variations in relative electronic ionization cross-sections and vibrational Franck–Condon factors, coherent effects, the influence of laser pulse duration and relative differences in excited state lifetimes may all exert a non-negligible influence on the observed time-resolved ionization signals. Furthermore, these various processes may not only be apparent when transferring population non-adiabatically between different electronic states (inter-state detection) but can also arise due to changes in nuclear geometry within a given electronic state (intra-state detection). To therefore extract any information on the absolute extent of population transfer between various states, all of the factors mentioned above need to be deconvolved – a task which is extremely challenging. We can, however, start investigating at least some of these issues in a relatively simple manner. This permits a better initial understanding of their potential influence and, furthermore, places a general emphasis on the need to address the topic of relative detection sensitivity more widely.IV.A. State lifetime & laser pulse duration effects
Here we summarize some key results from an extensive generalized numerical modelling study that seeks to quantify the effective sensitivity to ionization detection of excited states as a function of their lifetime relative to the temporal duration of exciting/ionizing laser pulses.66 Although these parameters are a small subset of the many factors that may contribute to overall relative ionization detection efficiency, their role may be addressed in a straight-forward treatment using a simple kinetic model based on rate equations to describe the evolution of population in various states. This offers a simple, generalized description that can potentially assist interpretation of TRIY, TRPES and TRPEI data for realistic sets of experimental parameters.Within the framework of a kinetic model, and assuming excitation/ionization with similar Gaussian envelope pump/probe pulses in an overall (1 + 1′) process, it may be shown that the ionization signal S from a given excited electronic state undergoing exponential population decay with a 1/e lifetime τ may be modelled by the following:
 | (3) |
 .
.
Fig. 6 presents the variation of S as a function of state lifetime τ and pump–probe time delay Δt for selected temporal laser pulse widths. This is a useful result as it illustrates potential variations in relative photoionization efficiency under a given set of experimental conditions – specifically, where the laser pulse FWHM is constant, but different excited states (with different associated lifetimes) evolve in parallel following direct optical preparation. There exists a clear trend for more efficient detection of states with longer lifetimes, and the magnitude of this bias varies dramatically with pulse duration. For the 25 fs FWHM example (Fig. 6a), relative detection sensitivity is enhanced by a factor of ∼3 as the state lifetime increases up to a value of 1 ps, while this effect is almost order of magnitude in size when 200 fs FWHM laser pulses are employed (Fig. 6c). This overall trend is consistent with a previous modeling study evaluating ionization efficiency through congested intermediate levels for mass spectrometry applications.67
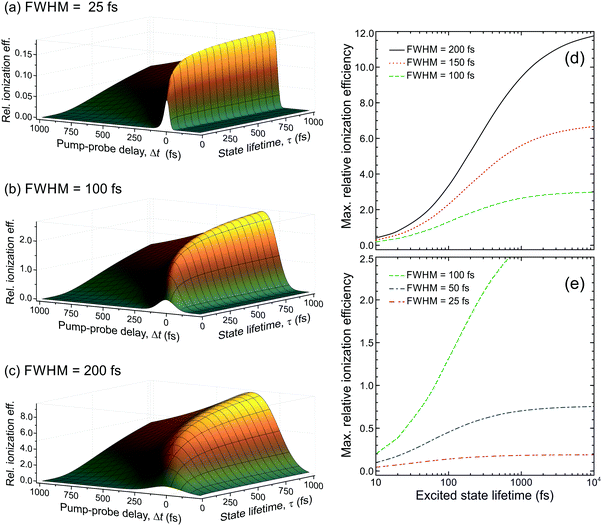 | ||
| Fig. 6 (left) Relative photoionization efficiency variation with respect to pump–probe delay Δt and state lifetime τ for selected FWHM laser pulse durations. The pump and probe pulses are taken to be near identical and the absorption/ionization cross-section of the overall (1 + 1′) process are assumed constant. (right) Maximum relative photoionization efficiency as a function of excited state lifetime for selected laser FWHM pulse widths. All plot intensities are scaled relative to that obtained at Δt = 0 for 100 fs FWHM pulses and τ = 100 fs. Figure adapted from Kotsina and Townsend.66 | ||
To provide data in a form more convenient for use in a practical context, Fig. 6d and e presents the maximum relative photoionization efficiency obtained as a function of state lifetime for selected laser pulse FWHM values. From this plot we may now extract relative detection sensitivity factors and apply them to real experimental data to account for any bias due to state lifetime and pulse width effects. To illustrate this point, we refer back to the TRPEI data obtained for aniline and its methyl-substituted derivatives, as summarized in the previous section. The particular focus here will be the aniline DAS plots and the three corresponding excited state lifetimes, which were extracted using a parallel fitting model. Here the Gaussian cross-correlation function was experimentally determined to be ∼130 fs and so we may reasonably assume deconvolved pump and probe pulses with FWHM durations of ∼100 fs. Using scaling factors obtained from Fig. 6, the relative detection sensitivity ratios for the state lifetimes τ1![[thin space (1/6-em)]](https://www.rsc.org/images/entities/char_2009.gif) :
:![[thin space (1/6-em)]](https://www.rsc.org/images/entities/char_2009.gif) τ2
τ2![[thin space (1/6-em)]](https://www.rsc.org/images/entities/char_2009.gif) :
:![[thin space (1/6-em)]](https://www.rsc.org/images/entities/char_2009.gif) τ3 are 2.46
τ3 are 2.46![[thin space (1/6-em)]](https://www.rsc.org/images/entities/char_2009.gif) :
:![[thin space (1/6-em)]](https://www.rsc.org/images/entities/char_2009.gif) 1.08
1.08![[thin space (1/6-em)]](https://www.rsc.org/images/entities/char_2009.gif) :
:![[thin space (1/6-em)]](https://www.rsc.org/images/entities/char_2009.gif) 1.00, respectively. This information may then be used to rescale the DAS for aniline, effectively correcting for the under-sampling of population passing through the very short-lived S2(3s/πσ*) state. As seen in Fig. 7, this increases the amplitude of the τ1 DAS relative to that of τ3. In the low kinetic energy region below ∼0.5 eV, this therefore indicates a considerably higher fraction of non-adiabatic population transfer between the S2(3s/πσ*) and S1(ππ*) states than would otherwise have been assumed – clearly indicating the importance of considering relative detection sensitivity effects. This is, however, still an incomplete picture, as expanded upon in Section IV.B.
1.00, respectively. This information may then be used to rescale the DAS for aniline, effectively correcting for the under-sampling of population passing through the very short-lived S2(3s/πσ*) state. As seen in Fig. 7, this increases the amplitude of the τ1 DAS relative to that of τ3. In the low kinetic energy region below ∼0.5 eV, this therefore indicates a considerably higher fraction of non-adiabatic population transfer between the S2(3s/πσ*) and S1(ππ*) states than would otherwise have been assumed – clearly indicating the importance of considering relative detection sensitivity effects. This is, however, still an incomplete picture, as expanded upon in Section IV.B.
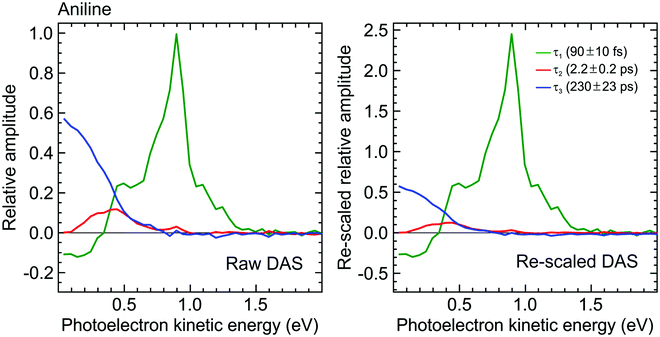 | ||
| Fig. 7 (left) DAS plot obtained from a global fit to the 250/300 nm pump/probe photoelectron spectrum of aniline (as presented in Fig. 3). (right) Rescaled DAS plot factoring in the detection sensitivity bias arising due to laser pulse duration and excited state lifetime effects. The τ1–3 scaling factors (from Fig. 6) are 2.46, 1.08 and 1.00, respectively, assuming a laser pulse FWHM of 100 fs. | ||
Eqn (3) describes the evolution of excited state populations following direct optical preparation by absorption of a pump pulse. We now extend our model to investigate how sequential energy deactivation processes impact on the detection sensitivity of indirectly populated states. Consider a system where state A is directly populated following pump excitation and exhibits a decay lifetime τ1. The decay of state A then provides a route for the indirect (i.e. non-adiabatic) population of state B, which has a lifetime τ2. The equation for the relative detection sensitivity under these conditions is as follows:66
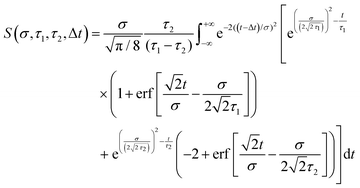 | (4) |
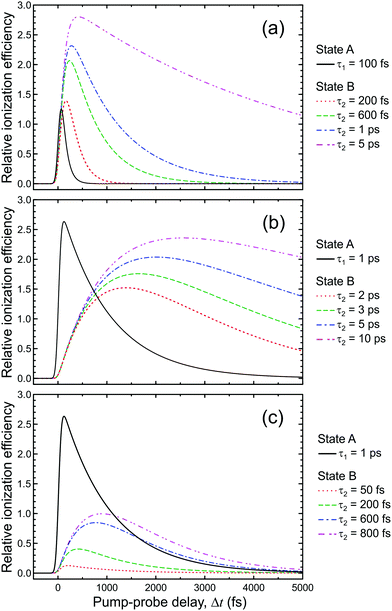 | ||
| Fig. 8 Comparison of the relative photoionization efficiency of a directly populated state (state A) with lifetime τ1 and a sequentially prepared state (state B) with lifetime τ2, populated via decay of state A. Figure adapted from Kotsina and Townsend.66 | ||
IV.B. The role of the ionization cross-section
The photoionization cross-section of a given state is an important factor contributing to its overall detection sensitivity. Despite absorption cross-sections from the ground state to a neutral excited state being relatively simple to accurately evaluate using standard computational packages, the same cannot be said for the ionization cross-sections of molecular excited states. These require more challenging and computationally expensive approaches, with the overall situation being further compounded by a lack of relevant experimental data with which to draw benchmark comparisons. Although software such as ezDyson36,37 is now improving this situation for non-specialist (i.e. predominantly experimental) research groups, an alternative (and appealingly uncomplicated) strategy is to seek correlations between photoionization cross-sections and specific physical molecular properties that can be evaluated in a very straightforward manner. This may provide a convenient heuristic tool that is easily exploited to stimulate improved (even if qualitative) discussion of relative branching ratios in a broad range of photoionization measurements. As a starting point, previous studies by Vallance and co-workers have shown there is a very strong linear correlation between ground state electron impact ionization cross-sections and the isotropic polarizability volume of various molecules.68,69 Motivated by these findings – and given that the isotropic polarizability volume of an excited state may be calculated with relative ease – exploratory studies were undertaken to investigate similar links with low energy photoionization cross-sections.As described in detail elsewhere,60,70 the ground state isotropic polarizability volume ![[small alpha, Greek, macron]](https://www.rsc.org/images/entities/i_char_e0c2.gif) was computationally evaluated for 37 different molecular systems and compared with previously reported 11.5 eV single-photon photoionization cross-sections. This data is plotted in Fig. 9, where a positive correlation may readily be seen. A linear fit returns a correlation coefficient of r = 0.93 (and a coefficient of determination R2 = 0.86) indicating a highly significant relationship. Although Fig. 9 shows sizable variation in ionization cross-section (almost an order of magnitude over the range of systems investigated), it is important to stress here that this is only a preliminary proof-of-principle exercise. A great deal of additional work will be required to establish if the observed trend extends consistently in the same manner to larger values of
was computationally evaluated for 37 different molecular systems and compared with previously reported 11.5 eV single-photon photoionization cross-sections. This data is plotted in Fig. 9, where a positive correlation may readily be seen. A linear fit returns a correlation coefficient of r = 0.93 (and a coefficient of determination R2 = 0.86) indicating a highly significant relationship. Although Fig. 9 shows sizable variation in ionization cross-section (almost an order of magnitude over the range of systems investigated), it is important to stress here that this is only a preliminary proof-of-principle exercise. A great deal of additional work will be required to establish if the observed trend extends consistently in the same manner to larger values of ![[small alpha, Greek, macron]](https://www.rsc.org/images/entities/i_char_e0c2.gif) , applies equivalently to electronically excited states, and persists when the ionizing photon energy is reduced (as is typical in the probe step of many (1 + 1′) measurements). It does, however, offer an interesting initial starting point for improved discussion and interpretation of relative branching ratios and detection sensitivity. To illustrate this, we once again return to consider the case of aniline, where quantum chemistry calculations predict an extremely large difference in the isotropic polarizability volumes of the S1(ππ*) and S2(3s/πσ*) states (
, applies equivalently to electronically excited states, and persists when the ionizing photon energy is reduced (as is typical in the probe step of many (1 + 1′) measurements). It does, however, offer an interesting initial starting point for improved discussion and interpretation of relative branching ratios and detection sensitivity. To illustrate this, we once again return to consider the case of aniline, where quantum chemistry calculations predict an extremely large difference in the isotropic polarizability volumes of the S1(ππ*) and S2(3s/πσ*) states (![[small alpha, Greek, macron]](https://www.rsc.org/images/entities/i_char_e0c2.gif) = 4.29 Å3 and 83.37 Å3, respectively, at the ground state equilibrium geometry).60 Neglecting Franck–Condon and excited-state alignment effects, it therefore seems reasonable to conservatively speculate that the maximum S2(3s/πσ*) ionization cross-section may exceed that of S1(ππ*) by at least an order of magnitude. Even for the rescaled DAS presented in Fig. 7 (where the maximum τ1 amplitude is approximately 4–5 times that of τ3), we therefore conclude that the fraction of initial population prepared in S2(3s/πσ*) is likely to be rather small relative to S1(ππ*) (i.e. it is relatively a minor contributor to the overall dynamics following 250 nm excitation). This is consistent with expectations based on the absorption cross-sections of the two states.60 On the basis of similar cross-section arguments, we may also infer that the sensitivity to tracking the S2(3s/πσ*) population is reduced considerably as it transfers non-adiabatically to S1(ππ*). Even though the size of the negative amplitude feature in the τ1 DAS below 0.5 eV is considerably smaller than the positive amplitude contribution at higher kinetic energies, this is therefore likely to be reflecting internal conversion of a relatively large fraction of the total (albeit small) starting population prepared in S2(3s/πσ*). The competing direct H atom dissociation mechanism is consequently assumed to be the less significant pathway for decay in this instance. Despite being just a simple, exploratory example, the need to try and place the role of the ionization cross-section on a more quantitative footing for improved discussion of photochemical branching ratios is readily apparent here – although this is still a challenging prospect at present.
= 4.29 Å3 and 83.37 Å3, respectively, at the ground state equilibrium geometry).60 Neglecting Franck–Condon and excited-state alignment effects, it therefore seems reasonable to conservatively speculate that the maximum S2(3s/πσ*) ionization cross-section may exceed that of S1(ππ*) by at least an order of magnitude. Even for the rescaled DAS presented in Fig. 7 (where the maximum τ1 amplitude is approximately 4–5 times that of τ3), we therefore conclude that the fraction of initial population prepared in S2(3s/πσ*) is likely to be rather small relative to S1(ππ*) (i.e. it is relatively a minor contributor to the overall dynamics following 250 nm excitation). This is consistent with expectations based on the absorption cross-sections of the two states.60 On the basis of similar cross-section arguments, we may also infer that the sensitivity to tracking the S2(3s/πσ*) population is reduced considerably as it transfers non-adiabatically to S1(ππ*). Even though the size of the negative amplitude feature in the τ1 DAS below 0.5 eV is considerably smaller than the positive amplitude contribution at higher kinetic energies, this is therefore likely to be reflecting internal conversion of a relatively large fraction of the total (albeit small) starting population prepared in S2(3s/πσ*). The competing direct H atom dissociation mechanism is consequently assumed to be the less significant pathway for decay in this instance. Despite being just a simple, exploratory example, the need to try and place the role of the ionization cross-section on a more quantitative footing for improved discussion of photochemical branching ratios is readily apparent here – although this is still a challenging prospect at present.
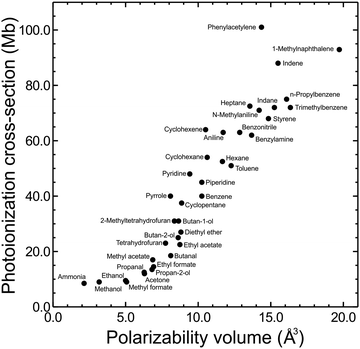 | ||
| Fig. 9 11.5 eV photoionization cross-sections for the ground states of 37 small molecules plotted against calculated isotropic polarizability volume (PBE0/Sadlej(H+d)). For additional details see main text and accompanying references. Figure adapted from Zawadzki et al.70 | ||
V. Extending the view along the reaction coordinate
A complicating aspect of time-resolved measurements using ionization-based detection stems from the fact that the various excited states of interest are not observed directly, but rather monitored via detection of their ionic counterpart (during the collection of photoelectrons or photoions). Properties of the cation state(s), as well as the chosen probe photon wavelength, are therefore highly significant in influencing the information that may be extracted from such measurements. Electronic transitions depend critically on the molecular orbital configurations of the participating states. For the case of photoionization, this effect is described by Koopmans’ correlations, which stipulate that there is a higher propensity for ionization between two states exhibiting similar molecular configurations. As a simple example: a ππ* excitation based predominantly on a HOMO to LUMO+1 transition should ionize preferentially the D0(π−1) state of the corresponding cation. An nπ* state built predominantly on a HOMO−1 to LUMO configuration would, on the other hand, be expected to show a much higher propensity for ionization into the D1(n−1) continuum. A detailed discussion of Koopmans’ correlations in the analysis of TRPEI experiments is beyond the scope of this Perspective, but it is nevertheless an important general consideration and the reader is directed to previous literature for additional information (including some illustrative diagrams).20,71–73 This issue of photoionization propensity is further influenced by the nuclear part of the wavefunction and relates to the associated Franck–Condon factors. This may also have a significant impact on the level of observed ionization signal, and for a transition to occur with high propensity there should be a significant overlap between the vibrational wavefunctions of the excited and cation states. If this condition is not met, efficient ionization will not occur – even when there is an ionic state (with favourable Koopmans’ correlations) within the energetically accessible detection window provided by the wavelength of the probe pulse. The extent of the “view” along a given photochemical reaction coordinate is therefore highly dependent on the probe ionization step, with shorter wavelengths potentially yielding far greater overall insight.To illustrate the points highlighted above, we initially consider the case of 200 nm excitation in 1,3-butadiene with subsequent ionization using a 267 nm probe of varying intensity. As seen in Fig. 10a, a weak probe inducing single-photon ionization in a (1 + 1′) process offers a rather limited view of the non-adiabatic dynamics, since only the ultrafast (<100 fs) decay of the initially prepared S2(1Bu) state is observed. Signatures of any subsequent dynamics are not captured, even though the probe photon carries sufficient energy to also induce ionization of the lower-lying S1(1Ag) state into which population is non-adiabatically transferred. The absence of signal here is a consequence of poor Franck–Condon overlap and unfavourable Koopmans’ correlations leading to a very restricted view along the photochemical reaction coordinate. Increasing the probe intensity, though, begins to induce significant two-photon ionization, and this (1 + 2′) process leads to a more “complete” dynamical map that fully spans the evolution from reactants to products: Higher-lying cation states with more favourable Franck–Condon factors are now accessible in this scenario, and ionization of the S1(1Ag) state becomes apparent over a range of photoelectron kinetic energies spanning 1.7–3.4 eV (see Fig. 10b). Moreover, longer-lived spectral features attributable to ionization from the hot S0 ground state – populated from S1(1Ag) – are also observed at energies <0.5 eV. This new information revealed by the multi-photon probe step is, however, seen only weakly in the photoelectron spectrum due to the reduced two-photon ionization probability relative to the competing (1 + 1′) scheme. Data originating from (1 + 2′) and (1 + 1′) processes are also not spectrally resolved from each other, greatly complicating any analysis – although we highlight that time-resolved photoelectron–photoion coincidence measurements have previously been used to undertake a comprehensive examination of this specific problem in 1,3-butadiene.44 More generally, though, the above example highlights the clear potential benefits of projecting deeply into the ionization continuum – particularly with a single-photon, short wavelength probe in the VUV region of the electromagnetic spectrum.
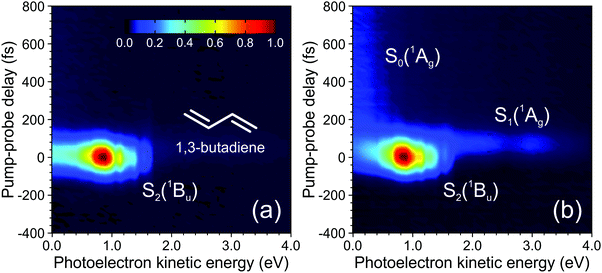 | ||
| Fig. 10 Time-dependent photoelectron spectra of 1,3-butadiene obtained using a 200 nm pump (50 nJ per pulse) and a 267 nm probe set to either 400 nJ per pulse (a) or 2.5 mJ per pulse (b). Spectral signatures originating from three different electronic states are indicated. Figure adapted from Kotsina et al.76 | ||
Tuneable ultrafast VUV pulses may be generated with free electron laser sources and utilized in TRPES experiments at central user facilities,74,75 although access opportunities are limited. Within a more conventional lab setting, the development of simple and inexpensive bench-top VUV sources is therefore extremely desirable, and we will expand on this topic further in Section VI. Here, we present the basic incorporation of a relatively simple VUV source into our TRPEI spectrometer to convey the advantages of short wavelength probes through a case study on the molecule acetylacetone.76 This makes use of an established methodology producing the fifth harmonic of a Ti:Sapphire laser (160 nm) in a static gas cell via non-collinear four-wave mixing.77,78 Such an approach has also been demonstrated previously for use as a probe in other time-resolved studies of non-adiabatic molecular processes,79–82 as have related variations employing the sixth harmonic (133 nm)83–86 and ninth harmonic (90 nm).87
To undertake experiments using a VUV probe beam, an auxiliary differentially pumped vacuum chamber is incorporated into the existing VMI spectrometer from Fig. 1. This is coupled to the side of the main chamber and houses high reflectance VUV mirrors mounted in piezo controlled steering mounts, plus diagnostic tools including a UV/VUV spectrometer and a calibrated photodiode to measure the VUV power. A schematic layout is shown in Fig. 11. The VUV probe beam (approx. 160 nm) is generated through non-colinear four-wave mixing of an intense fundamental laser pulse (800 nm) with its third harmonic (267 nm) in a pressurized argon-filled cell (3ω + 3ω − ω overall).77,78 The cell is mounted directly onto the auxiliary chamber described above, separated by only a thin CaF2 window. For successful four-wave mixing to occur, phase matching conditions must be fulfilled; the production of VUV wavelengths is critically sensitive to both the angle between the interacting beams and the pressure of the argon. See ref. 76 for more expanded details of this overall instrumentation.
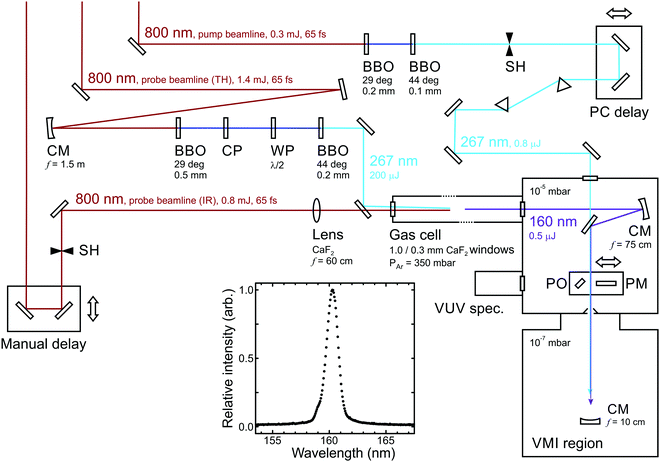 | ||
| Fig. 11 Schematic overview of an optical set-up for 267/160 nm pump/probe measurements. Abbreviations: BBO (β-barium borate crystal), CM (concave mirror), CP (calcite plate), WP (waveplate), PM (power meter), PO (pick-off optic), SH (shutter). A typical VUV output spectrum is also inset. Figure adapted from Kotsina et al.76 | ||
Our VUV probe generation setup was employed to interrogate the non-adiabatic dynamics of acetylacetone following excitation to the S2(ππ*) state using a 267 nm pump. Here we summarize the main experimental findings, with the primary focus for this Perspective being the advantages of the short wavelength ionization step. Acetylacetone forms part of the UV chromophore within larger molecules such as the commercial sunscreen avobenzone.88 It also finds uses in some industrial processes, and so improved knowledge of its photochemical fate in the atmosphere assists in understanding any potential environmental impact.89,90 In the gas phase, the ground state (at room temperature and below) exists predominantly in the enol tautomeric form,91 and this structure (see Fig. 12 inset) will now be implicitly assumed throughout. Numerous spectroscopy and dynamics studies have been conducted on acetylacetone using UV excitation in both the time- and frequency-resolved domains. A complete literature review of this subject is beyond the scope of this article and the reader is referred to our original publication for further details.76 The key issue to highlight here, however, is that previous time-resolved studies have only reported quantitative measurements for different subsections of the overall excited state reaction coordinate.75,92–95
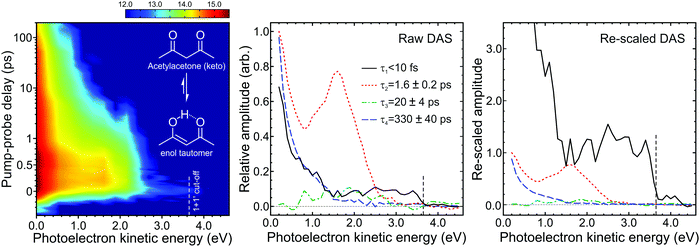 | ||
| Fig. 12 (left) Time-dependent (1 + 1′) photoelectron spectrum of acetylacetone (keto and enol structures inset) excited at 267 nm and probed at 160 nm. To enhance weaker spectral features, the intensity colour map is presented on a logarithmic scale. (middle) Corresponding DAS plots extracted from global fits to the photoelectron spectra (see main text for more details). The uncertainty in the quoted the lifetimes τ1–4 is one standard deviation. (right) Rescaled DAS plot factoring in the detection sensitivity bias arising due to laser pulse duration and excited state lifetimes effects. The relative τ1–4 scaling factors (from Fig. 6) are 13.90, 1.00, 0.92 and 0.91, respectively, assuming a laser pulse FWHM of 100 fs. Figure adapted from Kotsina et al.76 | ||
Fig. 12 shows a time-resolved (1 + 1′) photoelectron spectrum of acetylacetone, along with the DAS plots extracted from fitting to this data using the approach outlined in Section II. At photoelectron kinetic energies >2.4 eV an extremely short-lived feature (τ1 < 10 fs) is apparent, while between 1.2–2.4 eV a second spectral band (τ2 = 1.6 ± 0.2 ps) is observed. In the low kinetic energy region (<0.5 eV) the photoelectron signal decays on much longer timescales, exhibiting two distinct temporal signatures (τ3 = 20 ± 4 ps and τ4 = 330 ± 40 ps). Critically, a significant portion of this information would not have been revealed if a probe in the UV spectral region, rather than the VUV, had been used. For example, the extent of continuum projection using 200 nm (6.20 eV) for the ionization step is reduced by 1.55 eV relative to 160 nm (7.75 eV). Any spectral data appearing in Fig. 12 at photoelectron kinetic energies <1.55 eV (which includes signals exhibiting the two longest time constants) would therefore not be observed in this scenario. Our VUV data therefore reveal a more extended view along a complex photochemical reaction pathway that involves multiple steps: The ultrafast lifetime τ1 is associated with a DAS plot that extents up to the maximum (1 + 1′) cut-off energy and appears at zero pump–probe delay. It is assigned to internal conversion of the initially prepared S2(ππ*) state into the lower-lying S1(nπ*) state. This signal is very weak, but this is a consequence of detection sensitivity bias due to the extremely short lifetime (as discussed in Section IV). The rescaled DAS clearly indicates the sizeable impact of the effect in this instance, clearly illustrating the need to consider it more generally in these types of measurements. Information gained from the cut-off energies of the other three DAS plots, along with ESI from theory,75 then leads to the following picture for the subsequent dynamics: From the S1(nπ*) state, population transfers via rapid intersystem crossing (ISC) to the T1(ππ*) state. Although the timescale of τ2 = 1.6 ps is extremely fast for ISC (especially for a system containing only first row elements), this has been explained by the very small energetic separation between the participating states.75 More generally, we also highlight that “ultrafast” ISC has been reported in other systems containing structurally related motifs.96,97 Once on the T1(ππ*) potential energy surface, the system then relaxes to the minimum energy geometry in 20 ps (τ3) and eventually returns to the ground state following further ISC on a timescale of 330 ps (τ4). The numerical values of τ1, τ2, and τ4 are in good agreement with those stated in other time-resolved studies that sampled more limited subsections of the overall photochemical reaction coordinate. The time constant τ3 has not been previously reported, however, indicating the value of sampling the entire dynamics in a single measurement.
An additional consideration of relevance to the use of VUV photoionization probes is also highlighted in Fig. 12, where there is a weak but clearly discernible signal evolving towards negative pump–probe delay times at photoelectron kinetic energies <0.5 eV. This unwanted “probe–pump” process (160 nm excitation and 267 nm ionization) has the potential to significantly complicate the analysis of short-time dynamics. In this specific instance, however, its effect is minimized due to the small spectral range over which it extends. More generally, though, when planning TRPEI experiments it is desirable to choose a probe wavelength that lies away from absorption bands of the molecule under study to avoid this issue altogether. Unfortunately, satisfying this condition becomes challenging when employing a VUV probe as most molecules absorb strongly across the VUV region – although the differing nature of the pump and probe absorptions can potentially come to our aid here. This is illustrated in acetylacetone, where the two cross-sections are similar, but 160 nm excites a high lying ππ* state via electron promotion from a different molecular orbital to that at 267 nm.98,99 Consequently, the associated Koopmans’ correlations for the subsequent ionization step will also differ. Here the S2(ππ*) state prepared at 267 nm is expected to show a strong propensity for ionization to the D0(π−1) state of the cation. Alternatively, the higher lying ππ* state will preferentially ionize to a state sitting deeper in the continuum (D2 or above). Given the energetic position of the third photoelectron band seen in acetylacetone,100,101 any probe–pump dynamics will therefore not yield photoelectrons with energies exceeding 0.5 eV, as is observed. This is an extremely useful outcome, but to exploit it as a general principle in TRPEI and related measurements a fully wavelength tuneable VUV probe (as opposed to one derived from laser harmonics) is required. Prospects for realising this in the form of a compact, low-cost source are a key theme of the following section.
VI. Novel sources for improved measurements
Earlier case studies have highlighted the clear advantages of an extended observation window offered by short-wavelength VUV probes in time-resolved experiments using ionization-based detection. Achieving this via the fundamental infrared output of commercial ultrafast lasers is, however, a challenging task. Frequency up-conversion through conventional methods (e.g. the use of non-linear crystals) suffers from restrictive phase matching and bandgap absorption issues – although VUV production to ∼150 nm is possible in some novel non-linear media, such as KBe2BO3F2.102 Atomic gasses provide an attractive alternative for non-linear optics as, unlike solid-state materials, they also offer wide transparency windows and are not susceptible to irreparable optical damage at high intensities. Exploiting this medium, ionization probes may be generated in the deep VUV region using high harmonic generation schemes,103–109 although such measurements require relatively complex experimental infrastructure and have low efficiency. More straightforward setups exploiting four-wave mixing in gaseous non-linear media – as demonstrated in Section V – may be extended to achieve a degree of tunability by replacing the 800 nm fundamental frequency with the tuneable output from an optical parametric amplifier,110 but this reduces the efficiency further from an already low level (typically below 0.1%, relative to the starting 800 nm input). Given these limitations, an improved approach for production of UV/VUV femtosecond pulses that can be exploited in time-resolved spectroscopy would clearly be advantageous. One promising route for realizing this goal in a compact, bench-top set-up is through the use of soliton-driven resonant dispersive wave emission (RDWE) in gas-filled hollow core photonic crystal fibres (HC-PCFs) and capillaries.111,112 The development of these sources for use in time-resolved spectroscopy is still in its infancy and their properties, capabilities and full range of applications are yet to be fully realized. Here, though, we summarize a promising initial demonstration of the approach in TRPEI measurements made on the styrene molecule.113Fig. 13a presents the basic experimental setup for UV generation via RDWE in HC-PCFs. The fibre is made of silica with a hollow core and fine structured cladding pattern of diameter 26 μm (Fig. 13b). The 17 cm long fibre is stabilized in an argon-filled gas cell and aligned to be centred on the input/output windows. The optical beam path for the 800 nm input contains a pair of half waveplates and a Brewster polarizer for the full control of the pulse energy. A thin spherical lens is used to couple the input beam into the fibre. For generation of a specific UV wavelength, the argon pressure and the energy of the coupled beam must be finely balanced, with tunability achieved through careful regulation of the gas pressure and input pulse energy. For example, typical values for UV generation over the range 242–258 nm in the fibre shown in Fig. 13a are 4.5–6.0 bar at 2.2 μJ (using a 55 fs FWHM pulse). More generally, the energy and tuning range are defined by the design of the fibre structure (cladding, core size), as well as the coupling conditions, fibre length, choice of noble gas, and the input pulse characteristics. Fig. 13c demonstrates the vast tuning range which has previously been demonstrated using RDWE sources.111 Of particular note is the output spanning the VUV region from 190–115 nm.
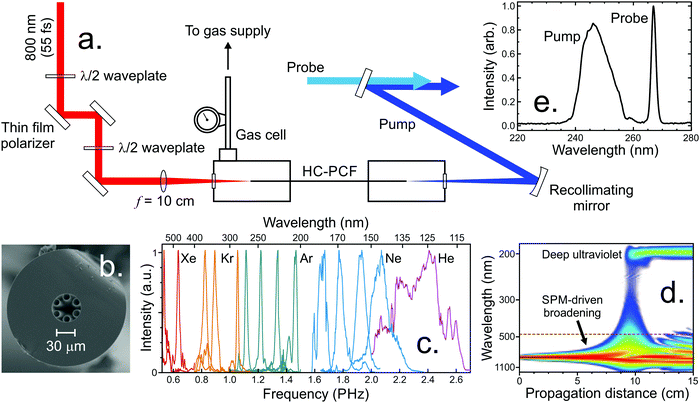 | ||
| Fig. 13 (a) Experimental setup for UV generation employing a HC-PCF. (b) Cross-section of the fibre employed in this study obtained by scanning electron micrograph. (c) Demonstration of the broad tuning range possible in HC-PCFs by varying the fill gas and associated pressure. (d) Numerical simulation showing the spectral evolution of an 800 nm, 1 μJ, 30 fs FWHM input pulse propagating through a 26 μm core diameter HC-PCF filled with 5 bar Ar. The colour scale is logarithmic. (e) Bandwidth comparison of a 247 nm output beam obtained by the HC-PCF set-up and a 267 nm beam generated in a series of thin BBO crystals. Figure adapted from Kotsina et al.113 | ||
The UV/VUV generation within a gas-filled HC-PCF is a consequence of the interplay between higher-order non-linear effects – in particular, those of self-phase modulation (SPM) and non-linear dispersion. SPM is usually apparent when an ultrashort intense laser pulse travels through matter. The high intensity of the pulse affects the refractive index properties of the optical medium, which in response modifies the pulse characteristics. Through this interaction, the pulse gains a broader spectral bandwidth that increases around its central wavelength. The leading edge in time shifts to lower frequencies (“redder” wavelengths) while the trailing edge shifts to higher frequencies (“bluer” wavelengths). The medium additionally influences the pulse duration and can induce wavelength dispersion effects (chirp) that can be either positive or negative. Positive (normal) dispersion results in the bluer parts of the pulse becoming temporally delayed with respect to the redder components. The reverse situation applies for negative (anomalous) dispersion. Upon propagating a broadband pulse through a set-up such as that show in Fig. 13a, the overall dispersion results from a superposition of effects: The fiber itself induces a negative dispersion while the fill gas exhibits a positive dispersion that increases with pressure – which provides an inherent tunability. To generate UV light through RDWE, the net overall dispersion provided by the gas and fibre in combination should be negative for the input beam. When an ultrashort pulse (<50 fs) enters the fibre, it is subject to SPM and quickly gains bandwidth. Since this broadening occurs in a negative dispersion environment, the pulse undergoes compression, which further enhances SPM. This cycle of bandwidth-broadening and recompression repeats as the pulse propagates along the fibre, further shortening the pulse. After many cycles, the process leads to the formation of a higher order soliton.114,115 Due to its extreme intensity, the soliton is subject to higher-order dispersion and a phase matched (or resonant) transfer of energy into a specific UV frequency band (Fig. 13d) occurs. As the process is transient, the emission is inherently ultrafast, with pulse durations of <5 fs having been successfully measured.116,117 Emission is in the fundamental mode and can contain more than 10% of the 800 nm input energy.116 This low driving requirement also makes it possible to scale the repetition rate to the megahertz range.118 Furthermore, the UV output polarization closely follows that of the 800 nm input pulse.119 This is an important consideration for TRPEI measurements, since a well-defined (linear) polarization in both the pump and probe is typically required.
Fig. 13e presents a typical spectrum of a 247 nm beam generated by our experimental setup. On the same plot an optical spectrum of the third harmonic centred at 267 nm, generated using more conventional means in a pair of thin BBO crystals is also shown. There is an obvious difference in the bandwidth content of the two spectra, with a FWHM of ∼1.5 nm versus ∼12 nm at 267 nm and 247 nm, respectively. The large difference in bandwidth is indicative of an extremely short pulse in the latter instance and, at the Fourier-transform limit, the 247 nm beam is expected to be ∼8 fs in duration. The output from HC-PCF sources therefore exhibits characteristics that are very appealing for TRPEI experiments: it is a relatively simple experimental setup for benchtop generation with wide tunability and the remarkably short pulse durations open up new possibilities for improved observation of extremely fast dynamical events. The prospect of access to tuneable probe pulses in the VUV has obvious benefits for improved mapping of photochemical reaction coordinates, as already detailed in Section V. The region between 200–170 nm also offers new opportunities for ultrafast pump measurements that systematically interrogate non-adiabatic dynamics in the low-lying excited states of small prototypical molecules containing specific chemical functionality (e.g. alcohols, ethers, simple alkenes and amides).
To ascertain the suitability of HC-PCF sources for time-resolved spectroscopy – particularly regarding the robustness and long-term stability required for extended periods of data acquisition – a (1 + 1′) TRPEI study was performed employing the pump and probe beams presented in Fig. 13e. For this initial demonstration, a single HC-PCF is used only for the generation of the pump, permitting a more straightforward assessment of performance. An initial measurement of the experimental cross-correlation function using non-resonant ionization of 1,3-butadiene exhibited no significant energy offset versus time in the photoelectron spectrum, indicating that dispersion effects are adequately controlled. The temporal experimental resolution was ∼150 fs, limited by the temporal duration of the longer 267 nm pulse. For experiments involving RDWE sources as both the pump and the probe, however, we note that more careful dispersion management strategies will be required to fully exploit the enormous potential gains in time resolution. Even for UV pulses, this will include propagation of the fibre outputs directly into a vacuum environment.116,120
Fig. 14 presents a 247/267 nm pump/probe photoelectron spectrum of styrene. A very short-lived feature is observed at photoelectron kinetic energies spanning from 0.7 eV up to the (1 + 1′) cut-off energy. For kinetic energies <0.7 eV, a second spectral band persists on a much longer timescale. Analysis of this data using the procedure described by eqn (2) required a total of three exponential decaying function to obtain a satisfactory fit. The extracted lifetimes τ1–3 and corresponding DAS are also presented in Fig. 14. The DAS of the short-lived feature (τ1 = 40 fs) exhibits negative amplitudes indicating a sequential dynamical process with spectrally well-resolved photoelectron bands – as previously seen in the aniline systems discussed in Section III. Here this is attributed to non-adiabatic population transfer between the initially prepared S2(ππ*) state and the energetically lower-lying S1(ππ*) state. The long-lived spectral band with lifetime τ3 = 48 ps coincides energetically with the negative component of the τ1 DAS and is attributed to the decay of S1(ππ*). Finally, the DAS corresponding to τ2 = 610 fs has not been reported by previous similar studies121,122 and may be attributed to IVR occurring within the S1(ππ*) state. More importantly, for this initial demonstration, the output power and central wavelength output from the fibre remained stable over many days of repeated data acquisition. This paves the way for wider adoption and will serve to motivate uptake of a new technology that has considerable potential to transform the field of ultrafast spectroscopy over the coming years. Work is currently ongoing in our laboratory to continue this development.
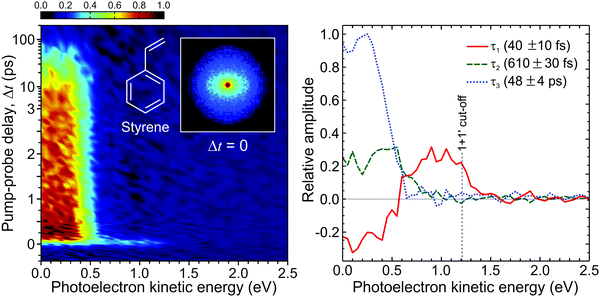 | ||
| Fig. 14 (left) Time-dependent (1 + 1′) photoelectron spectrum of styrene obtained from a 247 nm pump beam generated in a HC-PCF and probed with 267 nm generated from a series of BBO crystals. A background subtracted, 4-fold symmetrized pump–probe VMI image at zero pump–probe delay is inset. (right) Corresponding DAS plots extracted from global fits to the photoelectron spectrum (see main text for more details). The uncertainty in the quoted lifetimes τ1–3 is one standard deviation. Figure adapted from Kotsina et al.113 | ||
VII. Summary
This Perspective highlights the benefits of the highly differential time-, energy- and angle-resolved data afforded by the TRPEI approach, but also seeks to discuss some of its limitations. Several illustrative examples have been drawn upon to help underline these issues and also propose strategies to help deal with them. This includes the role and influence of relative detection sensitivity effects, along with the advantages of exploiting short-wavelength VUV probes and developing novel RDWE sources for accessing improved tunability, efficiency and temporal resolution in a simple laboratory set-up. Taken in combination, these various advances offer interesting prospects for greatly improved insights from measurements using TRPEI and related spectroscopies to investigate non-adiabatic excited state molecular dynamics. It will be extremely interesting to follow new developments in this research area over the next few years – particularly those driven by new light source technologies.Conflicts of interest
There are no conflicts to declare.Acknowledgements
We thank our various co-workers and collaborators who have made numerous significant contributions to the work highlighted here: F. Belli, E. A. Burgess, M. Candelaresi, S. W. Crane, R. J. Donaldson, S.-f. Gao, M. Iljina, R. A. Livingstone, M. J. Paterson, L. Saalbach, C. Sparling, B. J. Sussman, J. O. F. Thompson, J. C. Travers, P. Wang, Y.-y. Wang, and M. M. Zawadzki. We also acknowledge the Engineering and Physical Sciences Research Council for funding (grants EP/G041717/1, EP/K021052/1, EP/P001459/1 and EP/R030448/1), and Heriot-Watt University for providing PhD studentships to S. W. C., R. A. L., L. S., C. S., J. O. F. T. and M. M. Z.References
- H. Mustroph, ChemPhysChem, 2016, 17, 2616 CrossRef CAS PubMed.
- M. S. Schuurman and A. Stolow, Annu. Rev. Phys. Chem., 2018, 69, 427 CrossRef CAS PubMed.
- S. Mahapatra, Acc. Chem. Res., 2008, 42, 1004 CrossRef PubMed.
- G. A. Worth and L. S. Cederbaum, Annu. Rev. Phys. Chem., 2004, 55, 127 CrossRef CAS PubMed.
- D. R. Yarkony, J. Phys. Chem. A, 2001, 105, 6277 CrossRef CAS.
- L. A. Baker, L. C. Grosvenor, M. N. R. Ashfold and V. G. Stavros, Chem. Phys. Lett., 2016, 664, 39 CrossRef CAS.
- S. Maeda, T. Taketsugu, K. Ohno and K. Morokuma, J. Am. Chem. Soc., 2015, 137, 3433 CrossRef CAS PubMed.
- M. Pollum and C. E. Crespo-Hernández, J. Chem. Phys., 2014, 140, 071101 CrossRef PubMed.
- G. Cui and W. Fang, J. Chem. Phys., 2013, 138, 044315 CrossRef PubMed.
- J. C. Tully, J. Chem. Phys., 2012, 137, 22A301 CrossRef PubMed.
- M. Pederzoli, J. Pittner, M. Barbatti and H. Lischka, J. Phys. Chem. A, 2011, 115, 11136 CrossRef CAS PubMed.
- V. Sundström, Annu. Rev. Phys. Chem., 2008, 59, 53 CrossRef PubMed.
- P. Kukura, D. W. McCamant, S. Yoon, D. B. Wandschneider and R. A. Mathies, Science, 2005, 310, 1006 CrossRef CAS PubMed.
- C. E. Crespo-Hernández, B. Cohen, P. M. Hare and B. Kohler, Chem. Res., 2004, 104, 1977 Search PubMed.
- A. G. Suits and O. S. Vasyutinskii, Chem. Rev., 2008, 108, 3706 CrossRef CAS PubMed.
- A. J. Alexander and R. N. Zare, Acc. Chem. Res., 2000, 33, 199 CrossRef CAS PubMed.
- G. E. Hall and P. L. Houston, Annu. Rev. Phys. Chem., 1989, 40, 375 CrossRef CAS.
- H. H. Fielding and G. A. Worth, Chem. Soc. Rev., 2018, 47, 309 RSC.
- T. Suzuki, Int. Rev. Phys. Chem., 2012, 31, 265 Search PubMed.
- G. Wu, P. Hockett and A. Stolow, Phys. Chem. Chem. Phys., 2011, 13, 18447 RSC.
- R. Mabbs, E. R. Grumbling, K. Pichugin and A. Sanov, Chem. Soc. Rev., 2009, 38, 2169 RSC.
- A. Stolow and J. G. Underwood, Adv. Chem. Phys., 2008, 139, 497 CrossRef CAS.
- T. Suzuki, Annu. Rev. Phys. Chem., 2006, 57, 555 CrossRef CAS PubMed.
- A. Stolow, A. E. Bragg and D. M. Neumark, Chem. Rev., 2004, 104, 1719 CrossRef CAS PubMed.
- A. Stolow, Int. Rev. Phys. Chem., 2003, 22, 377 Search PubMed.
- A. Stolow, Annu. Rev. Phys. Chem., 2003, 54, 89 CrossRef CAS PubMed.
- D. M. Neumark, Annu. Rev. Phys. Chem., 2001, 52, 255 CrossRef CAS PubMed.
- T. Suzuki and B. J. Whitaker, Int. Rev. Phys. Chem., 2001, 20, 313 Search PubMed.
- R. A. Livingstone, J. O. F. Thompson, M. Iljina, R. J. Donaldson, B. J. Sussman, M. J. Paterson and D. Townsend, J. Chem. Phys., 2012, 137, 184304 CrossRef PubMed.
- A. T. J. B. Eppink and D. H. Parker, Rev. Sci. Instrum., 1997, 68, 3477 CrossRef CAS.
- S. N. Dixit and P. Lambropoulos, Phys. Rev. A: At., Mol., Opt. Phys., 1983, 27, 861 CrossRef CAS.
- A. T. J. B. Eppink, S.-M. Wu and B. J. Whitaker, in Imaging in Molecular Dynamics: Technology and Applications, ed. B. J. Whitaker, Cambridge University Press, Cambridge, 2003 Search PubMed.
- D. D. Hickstein, S. T. Gibson, R. Yurchak, D. D. Das and M. Ryazanov, Rev. Sci. Instrum., 2019, 90, 065115 CrossRef PubMed.
- K. L. Reid, Annu. Rev. Phys. Chem., 2003, 54, 397 CrossRef CAS PubMed.
- A. Humeniuk, M. Wohlgemuth, T. Suzuki and R. Mitrić, J. Chem. Phys., 2013, 139, 134104 CrossRef PubMed.
- S. Gozem, A. O. Gunina, T. Ichino, D. L. Osborn, J. F. Stanton and A. I. Krylov, J. Phys. Chem. Lett., 2015, 6, 4532 CrossRef CAS PubMed.
- S. Gozem and A. I. Krylov, ezDyson, http://iopenshell.usc.edu/downloads/ezdyson Search PubMed.
- M. Bixon and J. Jortner, J. Chem. Phys., 1968, 48, 715 CrossRef CAS.
- G. Wu, A. E. Boguslavskiy, O. Schalk, M. S. Schuurman and A. Stolow, J. Chem. Phys., 2011, 135, 164309 CrossRef PubMed.
- O. Schalk, A. E. Boguslavskiy and A. Stolow, J. Phys. Chem. A, 2010, 114, 4058 CrossRef CAS PubMed.
- A. Röder, A. B. Skov, A. E. Boguslavskiy, R. Lausten and A. Stolow, Phys. Chem. Chem. Phys., 2020, 22, 26241 RSC.
- J. A. Sánchez-Rodríguez, A. Mohamadzade, S. Mai, B. Ashwood, M. Pollum, P. Marquetand, L. González, C. E. Crespo-Hernández and S. Ullrich, Phys. Chem. Chem. Phys., 2017, 19, 19756 RSC.
- L. B. Klein, T. J. Morsing, R. A. Livingstone, D. Townsend and T. I. Sølling, Phys. Chem. Chem. Phys., 2016, 18, 9715 RSC.
- A. E. Boguslavskiy, O. Schalk, N. Gador, W. J. Glover, T. Mori, T. Schultz, M. S. Schuurman, T. J. Martínez and A. Stolow, J. Chem. Phys., 2018, 148, 164302 CrossRef PubMed.
- S. P. Neville, Y. Wang, A. E. Boguslavskiy, A. Stolow and M. S. Schuurman, J. Chem. Phys., 2016, 144, 014305 CrossRef PubMed.
- W. R. Jhang, H. Y. Lai, Y.-C. Lin, C. Lee, S.-H. Lee, Y.-Y. Lee, C.-K. Ni and C.-M. Tseng, J. Chem. Phys., 2019, 151, 141101 CrossRef PubMed.
- N. C. Cole-Filipiak and V. G. Stavros, Phys. Chem. Chem. Phys., 2019, 26, 14394 RSC.
- J. Ray and S. G. Ramesh, Chem. Phys., 2018, 515, 77 CrossRef CAS.
- O. M. Kirkby, M. Sala, G. Balerdi, R. de Nalda, L. Bañares, S. Guérin and H. H. Fielding, Phys. Chem. Chem. Phys., 2015, 17, 16270 RSC.
- M. Sala, O. M. Kirkby, S. Guérin and H. H. Fielding, Phys. Chem. Chem. Phys., 2014, 16, 3122 RSC.
- R. Spesyvtsev, O. M. Kirkby, M. Vacher and H. H. Fielding, Phys. Chem. Chem. Phys., 2012, 14, 9942 RSC.
- R. Spesyvtsev, O. M. Kirkby and H. H. Fielding, Faraday Discuss., 2012, 157, 165 RSC.
- G. M. Roberts, C. A. Williams, J. D. Young, S. Ullrich, M. J. Paterson and V. G. Stavros, J. Am. Chem. Soc., 2012, 134, 12578 CrossRef CAS PubMed.
- R. Montero, Á. P. Conde, V. Ovejas, R. Martínez, F. Castaño and A. Longarte, J. Chem. Phys., 2011, 135, 054308 CrossRef PubMed.
- G. A. King, T. A. A. Oliver and M. N. R. Ashfold, J. Chem. Phys., 2010, 132, 214307 CrossRef PubMed.
- M. N. R. Ashfold, G. A. King, D. Murdock, M. G. D. Nix, T. A. A. Oliver and A. G. Sage, Phys. Chem. Chem. Phys., 2010, 12, 1218 RSC.
- G. M. Roberts and V. G. Stavros, Chem. Sci., 2014, 5, 1698 RSC.
- M. J. Paterson and D. Townsend, Int. Rev. Phys. Chem., 2020, 39, 517 Search PubMed.
- M. M. Zawadzki, M. Candelaresi, L. Saalbach, S. W. Crane, M. J. Paterson and D. Townsend, Faraday Discuss., 2016, 194, 185 RSC.
- J. O. F. Thompson, L. Saalbach, S. W. Crane, M. J. Paterson and D. Townsend, J. Chem. Phys., 2015, 142, 114309 CrossRef PubMed.
- J. O. F. Thompson, R. A. Livingstone and D. Townsend, J. Chem. Phys., 2013, 139, 034316 CrossRef PubMed.
- T. Ebata, C. Minejima and N. Mikami, J. Phys. Chem. A, 2002, 106, 11070 CrossRef CAS.
- D. A. Horke, H. M. Watts, A. D. Smith, E. Jager, E. Springate, O. Alexander, C. Cacho, R. T. Chapman and R. S. Minns, Phys. Rev. Lett., 2016, 117, 163002 CrossRef CAS PubMed.
- J. O. F. Thompson, L. B. Klein, T. I. Sølling, M. J. Paterson and D. Townsend, Chem. Sci., 2016, 7, 1826 RSC.
- C. Z. Bisgaard, O. J. Clarkin, G. Wu, A. M. D. Lee, O. Gessner, C. C. Hayden and A. Stolow, Science, 2009, 323, 1464 CrossRef CAS PubMed.
- N. Kotsina and D. Townsend, Phys. Chem. Chem. Phys., 2017, 19, 29409 RSC.
- J. Matsumoto and T. Imasaka, Anal. Chem., 1999, 71, 3763 CrossRef CAS PubMed.
- J. N. Bull, J. W. L. Lee and C. Vallance, Phys. Chem. Chem. Phys., 2014, 16, 10743 RSC.
- J. N. Bull, P. W. Harland and C. Vallance, J. Phys. Chem. A, 2012, 116, 767 CrossRef CAS PubMed.
- M. M. Zawadzki, J. O. F. Thompson, E. A. Burgess, M. J. Paterson and D. Townsend, Phys. Chem. Chem. Phys., 2015, 17, 26659 RSC.
- V. Blanchet, M. Z. Zgierski, T. Seideman and A. Stolow, Nature, 1999, 401, 52 CrossRef CAS.
- V. Blanchet, M. Z. Zgierski and A. Stolow, J. Chem. Phys., 2001, 114, 1194 CrossRef CAS.
- M. Schmitt, S. Lochbrunner, J. P. Shaffer, J. J. Larsen, M. Z. Zgierski and A. Stolow, J. Chem. Phys., 2001, 114, 1206 CrossRef CAS.
- S. Pathak, L. M. Ibele, R. Boll, C. Callegari, A. Demidovich, B. Erk, R. Feifel, R. Forbes, M. Di Fraia, L. Giannessi, C. S. Hansen, D. M. P. Holland, R. A. Ingle, R. Mason, O. Plekan, K. C. Prince, A. Rouzée, R. J. Squibb, J. Tross, M. N. R. Ashfold, B. F. E. Curchod and D. Rolles, Nat. Chem., 2020, 12, 795 CrossRef CAS PubMed.
- R. J. Squibb, M. Sapunar, A. Ponzi, R. Richter, A. Kivimäki, O. Plekan, P. Finetti, N. Sisourat, V. Zhaunerchyk, T. Marchenko, L. Journel, R. Guillemin, R. Cucini, M. Coreno, C. Grazioli, M. Di Fraia, C. Callegari, K. C. Prince, P. Decleva, M. Simon, J. H. D. Eland, N. Došlić, R. Feifel and M. N. Piancastelli, Nat. Commun., 2018, 9, 63 CrossRef CAS PubMed.
- N. Kotsina, M. Candelaresi, L. Saalbach, M. M. Zawadzki, S. W. Crane, C. Sparling and D. Townsend, Phys. Chem. Chem. Phys., 2020, 22, 4647 RSC.
- M. Ghotbi, M. Beutler and F. Noack, Opt. Lett., 2010, 35, 3492 CrossRef CAS PubMed.
- M. Beutler, M. Ghotbi, F. Noack and I. V. Hertel, Opt. Lett., 2010, 35, 1491 CrossRef CAS PubMed.
- S. L. Horton, Y. Liu, R. Forbes, V. Makhija, R. Lausten, A. Stolow, P. Hockett, P. Marquetand, T. Rozgonyi and T. Weinacht, J. Chem. Phys., 2019, 150, 174201 CrossRef PubMed.
- S. L. Horton, Y. Liu, P. Chakraborty, P. Marquetand, T. Rozgonyi, S. Matsika and T. Weinacht, Phys. Rev. A, 2018, 98, 053416 CrossRef CAS.
- S. L. Horton, Y. Liu, P. Chakraborty, S. Matsika and T. Weinacht, Phys. Rev. A, 2017, 95, 063413 CrossRef.
- R. Spesyvtsev, T. Horio, Y.-I. Suzuki and T. Suzuki, J. Chem. Phys., 2015, 142, 074308 CrossRef CAS PubMed.
- V. Svoboda, C. Wang, M. D. J. Waters and H. J. Wörner, J. Chem. Phys., 2019, 151, 104306 CrossRef PubMed.
- V. Svoboda, N. Bhargava Ram, R. Rajeev and H. J. Wörner, J. Chem. Phys., 2017, 146, 084301 CrossRef PubMed.
- T. Horio, R. Spesyvtsev, Y. Furumido and T. Suzuki, J. Chem. Phys., 2017, 147, 013932 CrossRef PubMed.
- T. Horio, R. Spesyvtsev, K. Nagashima, R. A. Ingle, Y.-I. Suzuki and T. Suzuki, J. Chem. Phys., 2016, 145, 044306 CrossRef PubMed.
- S. Adachi and T. Suzuki, Appl. Sci., 2018, 8, 1784 CrossRef.
- N. A. Shaath, Photochem. Photobiol. Sci., 2010, 9, 464 CrossRef CAS PubMed.
- G. Zhang, B. Wu and S. Zhang, Environ. Pollut., 2017, 225, 691 CrossRef CAS PubMed.
- S. Zhou, I. Barnes, T. Zhu, I. Bejan, M. Albu and T. Benter, Environ. Sci. Technol., 2008, 42, 7905 CrossRef CAS PubMed.
- N. V. Belova, H. Oberhammer, N. H. Trang and G. V. Girichev, J. Org. Chem., 2014, 79, 5412 CrossRef CAS PubMed.
- A. Bhattacherjee and S. R. Leone, Acc. Chem. Res., 2018, 51, 3203 CrossRef CAS PubMed.
- A. Bhattacherjee, C. Das Pemmaraju, K. Schnorr, A. R. Attar and S. R. Leone, J. Am. Chem. Soc., 2017, 139, 16576 CrossRef CAS PubMed.
- L. Poisson, P. Roubin, S. Coussan, B. Soep and J.-M. Mestdagh, J. Am. Chem. Soc., 2008, 130, 2974 CrossRef CAS PubMed.
- S. Xu, S. T. Park, J. S. Feenstra, R. Srinivasan and A. H. Zewail, J. Phys. Chem. A, 2004, 108, 6650 CrossRef CAS.
- T. S. Chwee, G. S. Lim, Z. C. Wong, M. B. Sullivan and W. Y. Fan, Phys. Chem. Chem. Phys., 2016, 18, 7404 RSC.
- O. Schalk, M. S. Schuurman, G. Wu, P. Lang, M. Mucke, R. Feifel and A. Stolow, J. Phys. Chem. A, 2013, 118, 2279 CrossRef PubMed.
- H. Nakanishi, H. Morita and S. Nagakura, Bull. Chem. Soc. Jpn., 1978, 51, 1723 CrossRef CAS.
- H. Nakanishi, H. Morita and S. Nagakura, Bull. Chem. Soc. Jpn., 1977, 50, 2255 CrossRef CAS.
- N. S. Hush, M. K. Livett, J. B. Peel and G. D. Willett, Aust. J. Chem., 1987, 40, 599 CrossRef CAS.
- S. Evans, A. Hamnett, A. F. Orchard and D. R. Lloyd, Faraday Discuss. Chem. Soc., 1972, 54, 2270 RSC.
- C. T. Chen, G. L. Wang, X. Y. Wang and Z. Y. Xu, Appl. Phys. B: Lasers Opt., 2009, 97, 9 CrossRef CAS.
- A. Ciavardini, M. Coreno, C. Callegari, C. Spezzani, G. De Ninno, B. Ressel, C. Grazioli, M. de Simone, A. Kivimäki, P. Miotti, F. Frassetto, L. Poletto, C. Puglia, S. Fornarini, M. Pezzella, E. Bodo and S. Piccirillo, J. Phys. Chem. A, 2019, 123, 1295 CrossRef CAS PubMed.
- S. Adachi, T. Schatteburg, A. Humeniuk, R. Mitrić and T. Suzuki, Phys. Chem. Chem. Phys., 2019, 21, 13902 RSC.
- A. von Conta, A. Tehlar, A. Schletter, Y. Arasaki, K. Takatsuka and H. J. Wörner, Nat. Commun., 2018, 9, 3162 CrossRef CAS PubMed.
- A. D. Smith, E. M. Warne, D. Bellshaw, D. A. Horke, M. Tudorovskya, E. Springate, A. J. H. Jones, C. Cacho, R. T. Chapman, A. Kirrander and R. S. Minns, Phys. Rev. Lett., 2018, 120, 183003 CrossRef CAS PubMed.
- J. Nishitani, C. W. West, C. Higashimura and T. Suzuki, Chem. Phys. Lett., 2017, 684, 397 CrossRef CAS.
- R. Iikubo, T. Sekikawa, Y. Harabuchi and T. Taketsugu, Faraday Discuss., 2016, 194, 147 RSC.
- M. Koch, T. J. A. Wolf and M. Gühr, Phys. Rev. A: At., Mol., Opt. Phys., 2015, 91, 031403(R) CrossRef.
- M. Ghotbi, P. Trabs, M. Beutler and F. Noack, Opt. Lett., 2013, 38, 486 CrossRef PubMed.
- C. Markos, J. C. Travers, A. Abdolvand, B. J. Eggleton and O. Bang, Rev. Mod. Phys., 2017, 89, 045003 CrossRef.
- P. St. J. Russell, P. Hölzer, W. Chang, A. Abdolvand and J. C. Travers, Nat. Photonics, 2014, 8, 278–286 CrossRef CAS.
- N. Kotsina, F. Belli, S. Gao, Y. Wang, P. Wang, J. C. Travers and D. Townsend, J. Phys. Chem. Lett., 2019, 10, 715 CrossRef CAS PubMed.
- J. C. Travers, W. Chang, J. Nold, N. Y. Joly and P. St. J. Russell, J. Opt. Soc. Am. B, 2011, 28, A11 CrossRef CAS.
- N. Y. Joly, J. Nold, W. Chang, P. Hölzer, A. Nazarkin, G. K. L. Wong, F. Biancalana and P. St. J. Russell, Phys. Rev. Lett., 2011, 106, 203901 CrossRef CAS PubMed.
- C. Brahms, D. R. Austin, F. Tani, A. S. Johnson, D. Garratt, J. C. Travers, J. W. G. Tisch, P. St. J. Russell and J. P. Marangos, Opt. Lett., 2018, 44, 731 CrossRef PubMed.
- A. Ermolov, H. Valtna-Lukner, J. C. Travers and P. St. J. Russell, Opt. Lett., 2016, 41, 5535 CrossRef PubMed.
- F. Köttig, F. Tani, C. M. Biersach, J. C. Travers and P. St. J. Russell, Optica, 2017, 4, 1272 CrossRef.
- J. C. Travers, T. F. Grigorova, C. Brahms and F. Belli, Nat. Photonics, 2019, 13, 547 CrossRef CAS.
- C. Brahms, F. Belli and J. C. Travers, Opt. Lett., 2020, 45, 4456 CrossRef PubMed.
- A. D. G. Nunn, R. S. Minns, R. Spesyvtsev, M. J. Bearpark, M. A. Robb and H. H. Fielding, Phys. Chem. Chem. Phys., 2010, 12, 15751 RSC.
- S.-H. Lee, K.-C. Tang, I.-C. Chen, M. Schmitt, J. P. Shaffer, T. Schultz, J. G. Underwood, M. Z. Zgierski and A. Stolow, J. Phys. Chem. A, 2002, 106, 8979 CrossRef CAS.
| This journal is © the Owner Societies 2021 |
