Investigations into CTA-differentiation-involving polymerization of fluorous monomers: exploitation of experimental variances in fine-tuning of molecular weights†
Yu
Gu
,
Zongtao
Wang
,
Honghong
Gong
and
Mao
Chen
 *
*
State Key Laboratory of Molecular Engineering of Polymers, Department of Macromolecular Science, Fudan University, Shanghai 200438, China. E-mail: chenmao@fudan.edu.cn
First published on 6th November 2020
Abstract
Accessing well-defined ultra-high-molecular-weight (UHMW) polymers has long been one of the paramount challenges in polymer synthesis. Apart from the existing strategies, the CTA-differentiation-involving polymerization implemented facile generation of UHMW fluoropolymers with narrow polydispersities. Herein, aiming at achieving logical control of the differentiation process and accurate regulation of the molecular weight, we investigated the impact of different conditions and substrates on the reaction outputs. Moreover, the Mn effects on the thermal and mechanical performances of the derived materials were also examined. The results revealed that the obtained Mn can be easily directed upon alteration of the polymerization rate and the substrate structure (6.13 × 10⁵–3.52 × 10⁶ Da, Đ = 1.06–1.28), improving the efficiency and practicability of this approach for producing UHMW fluorinated materials to tailor for diverse applications.
1. Introduction
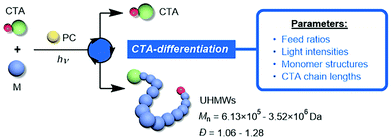
As rapidly developed polymerization methods are expanding the scope of attainable macromolecular architectures, chemists have recently shown much interest in pursuing well-defined ultra-high-molecular-weight (UHMW) polymers which has long been a challenging task even with reversible deactivation radical polymerizations (RDRPs).1–4 The dramatically increased chain length for UHMW polymers brings forth several appealing merits such as improved mechanical strength, high thermal stability and large domain size during self-assembly,5 stimulating the applications of the derived materials in high-performance elastomers,6 hydrogels,7 photonic crystals8 and other nanostructures.9–11 The critical consideration for accessing UHMW polymers is to maintain the livingness of the growing chain without the occurrence of irreversible termination or other side reactions during the extremely repeated propagation period (>104 times of monomer addition). In the RDRP regime, this requires (1) a high propagating rate (Rp) to shorten the time period in which undesired reactions can take place, and (2) a higher tendency for the radical to undergo the deactivation process (reversible termination or degenerative chain transfer) compared with termination (Rd ≫ Rt, where Rd and Rt represent the rates of deactivation and termination, respectively). Following these kinetic guidelines, different strategies have been devised utilizing high pressure12 and dispersed conditions13–15 as well as highly robust catalytic systems.16–18 For example, the Sumerlin19,20 and An21,22 groups reported the preparation of a variety of UHMW polymers through the photoiniferter and enzymatic catalysis technique, respectively.However, the preparation of UHMW fluorinated polymers has rarely been implemented due to extra impediments of solubility and phase separation issues during fluorine-involving polymerizations,23–26 where the incorporation of C–F bonds can endow the corresponding materials with advantageous characteristics (super-hydrophobicity, low surface energy, excellent chemical resistance, etc.).25,27,28 Recently, our group developed the chain transfer agent (CTA)-differentiation-involving polymerization method29 based on the photo-controlled RDRP,30–44 which afforded a variety of UHMW fluoropolymers with low molecular weight distributions. Taking advantage of the spontaneous differentiation process of CTA driven by fluorous association, this dispersion polymerization can proceed at elevated Rp because of the heterogeneous nature with a high local monomer concentration. Meanwhile, the two differentiated CTA groups simultaneously meet the requirements of a high ratio of monomer to growing chain and the effective degenerative chain transfer process (high Rd), which overcame the mechanistic limitations in previous RDRPs.
Despite the robustness of the CTA-differentiation-involving polymerization in generating UHMW polymers, what remains uninvestigated is the effect of different reaction conditions and substrate species on the differentiation process, which plays a decisive role in determining the resulting molecular weights. Herein, we studied the impact of various factors (including feed ratios, light intensity and the length of the initial CTA) on the percentage of differentiation (POD) of CTA, providing guidance for the fine-tuning of the molecular weight as well as delivering mechanistic implications (Scheme 1). Furthermore, the influence of molecular weight on the thermal and mechanical properties of the UHMW fluoropolymers was also explored for the first time, promoting the bridging between synthesis and applications for this novel kind of material.
2. Experimental section
2.1. Materials
All the reagents or catalysts were purchased from Sigma-Aldrich, Adamas or TCI. Monomers including nonafluorohexyl methacrylate (NFHMA), dodecafluoroheptyl methacrylate (DDFHMA) and N,N-dimethylacrylamide (DMA) were filtered through a plug of anhydrous basic alumina to remove inhibitors before use. Solvents including dimethyl sulfoxide (DMSO) and N,N-dimethylformamide (DMF) were freshly distilled with CaH2 before use. 2,2′-Azobis(2-methylpropionitrile) (AIBN) was recrystallized in ethanol before use. Other reagents were used as received without further purification. A white LED bulb (13 W) was purchased from PHILIPS Lighting and used as a light source.2.2. Characterization
Nuclear magnetic resonance (NMR) analysis was conducted on an Advance III 400 MHz Bruker spectrometer at 298 K. 1H NMR signals were measured using deuterochloroform (CDCl3) as a reference, and were reported in δ units, parts per million (ppm). Size exclusion chromatography (SEC) measurements were performed at 50 °C in DMF ([LiBr] = 0.02 mol L−1) with the elution rate of 1.0 mL min−1 on an Agilent 1100 instrument equipped with a G1310A pump and connected with a G1362A refractive index detector. Three columns were employed consisting of one 5 μm LP gel column (molecular weight range from 500 to 2 × 10⁴ g mol−1) and two 5 μm LP gel mixed bed columns (molecular weight range from 200 to 3 × 10⁶ g mol−1). The calibration was performed using PMMA standards. Mn,MALLS was measured with a WyattDawn HELEOS-II 18-Angle Laser Light detector. Gas chromatography (GC) measurements were conducted on a SHIMADZU GC-2014 instrument with chiral capillary columns. Light intensities were determined with the optical power meter of Thorlabs. Differential scanning calorimetry (DSC) measurements were conducted on a TA Q2000 thermal analysis system at a heating rate of 10 °C min−1 from −30 °C to 100 °C after eliminating the thermal history. Tensile test experiments were performed using dumbbell-shaped samples (effective gauge length = 12 mm, width = 2 mm, thickness = 0.5 mm) using an Instron 5966 electronic universal testing machine equipped with a 1 kN sensor. The measurements were performed at room temperature using a preload of 0.01 N and a pulling speed at 10 mm min−1 until failure of the samples. The hydrodynamic radius (rH) was determined with a 3D LS Spectrometer of LS Instruments in DMF at 25 °C.2.3 General procedures of CTA-differentiation-involving polymerization
An oven-dried 4 mL vial equipped with a stir bar was charged with monomer, CTA (poly(N,N-dimethylacrylamide, PDMA), the photoredox catalyst (PC) (tris(2-phenylpyridine)iridium, Ir(ppy)3) (chain lengths of PDMA, monomer concentrations and [M]/[CTA]/[PC] ratios were varied in individual experiments) and DMSO (1.0 mL). The solution contained in the vial was first frozen using liquid N2 and kept under vacuum to remove oxygen. Afterwards, the liquid N2 was removed to let the solution thaw. This freeze–pump–thaw cycle was repeated three times for effective deoxygenation. Then, the mixture was stirred (500 rpm) in front of a 13 white LED light bulb (at different distances for individual experiments) while cooling with compressed air to maintain room temperature. For all the reactions, the irradiation times were controlled to reach full monomer conversion. After the reaction, an internal standard (ethyl benzoate, with an equivalent amount as the monomer) was added into the solution while stirring; then the mixture was sampled and analyzed using 1H NMR and SEC instruments to determine the monomer conversion, molecular weight (Mn) and molecular weight distribution (Đ).3. Results and discussion
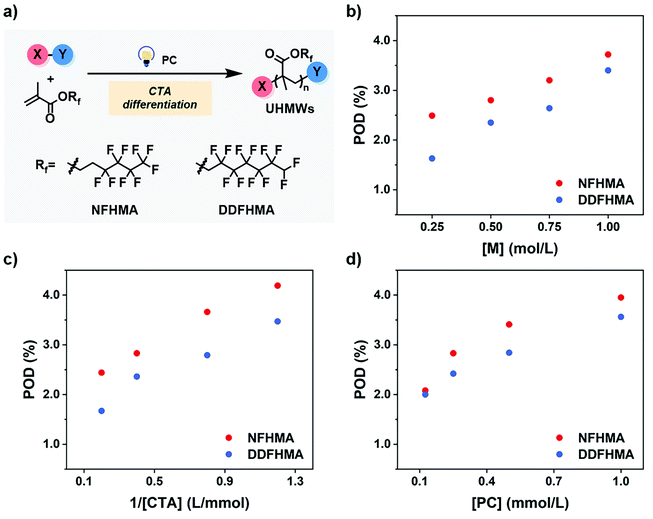
As preliminary exploration, we first conducted CTA-differentiation-involving polymerization of nonafluorohexyl methacrylate (NFHMA) and dodecafluoroheptyl methacrylate (DDFHMA) in dimethyl sulfoxide (DMSO) at different feed ratios, using a trithiocarbonate substituted poly(N,N-dimethyl acrylamide) (PDMA, Mn = 5.03 × 10³ Da) and tris(2-phenylpyridine)iridium (Ir(ppy)3) as the CTA and photocatalyst (PC), respectively (Fig. 1a). Irradiation times for different reactions were controlled to obtain full monomer conversion. The reactions afforded UHMW polymers with varied molecular weights and low polydispersities (6.72 × 10⁵–3.46 × 10⁶ Da, Đ = 1.06–1.25, Table 1, Fig. S6–S11†). To quantitatively interpret the differentiation process and elucidate its correlation with the resulted Mn, we defined the indicator as percentage of differentiation (POD) which exhibits the proportion of the actual propagating chain in the initial amount of CTA according to eqn (1): | (1) |
| Entry | Monomer | [M] (mol L−1) | [M]/[CTA]/[PC] |
M
n![[thin space (1/6-em)]](https://www.rsc.org/images/entities/char_2009.gif) b (Da) b (Da) |
Đ | POD (%) |
|---|---|---|---|---|---|---|
| a All reactions were performed in 1.0 mL DMSO, PC = Ir(ppy)3. A 13 W white LED bulb (light intensity = 33 mW cm−2) was used as a light source. Irradiation times were controlled to reach full monomer conversion (0.5–3 h). b M n and Đ were determined by SEC measurements in DMF at 50 °C. | ||||||
| 1 | NFHMA | 0.25 | 50/1/0.1 | 6.72 × 10⁵ | 1.18 | 2.49 |
| 2 | NFHMA | 0.50 | 100/1/0.1 | 1.18 × 10⁶ | 1.25 | 2.83 |
| 3 | NFHMA | 0.75 | 150/1/0.1 | 1.56 × 10⁶ | 1.06 | 3.20 |
| 4 | NFHMA | 1.00 | 200/1/0.1 | 1.79 × 10⁶ | 1.18 | 3.72 |
| 5 | NFHMA | 0.50 | 300/1/0.3 | 2.38 × 10⁶ | 1.18 | 4.19 |
| 6 | NFHMA | 0.50 | 200/1/0.2 | 1.82 × 10⁶ | 1.08 | 3.66 |
| 7 | NFHMA | 0.50 | 50/1/0.05 | 6.86 × 10⁵ | 1.20 | 2.44 |
| 8 | NFHMA | 0.50 | 100/1/0.4 | 8.45 × 10⁵ | 1.32 | 3.95 |
| 9 | NFHMA | 0.50 | 100/1/0.2 | 9.80 × 10⁵ | 1.16 | 3.41 |
| 10 | NFHMA | 0.50 | 100/1/0.05 | 1.60 × 10⁶ | 1.08 | 2.08 |
| 11 | DDFHMA | 0.25 | 50/1/0.1 | 1.38 × 10⁶ | 1.18 | 1.45 |
| 12 | DDFHMA | 0.50 | 100/1/0.1 | 1.70 × 10⁶ | 1.09 | 2.36 |
| 13 | DDFHMA | 0.75 | 150/1/0.1 | 2.27 × 10⁶ | 1.10 | 2.64 |
| 14 | DDFHMA | 1.00 | 200/1/0.1 | 2.36 × 10⁶ | 1.12 | 3.40 |
| 15 | DDFHMA | 0.50 | 300/1/0.3 | 3.46 × 10⁶ | 1.11 | 3.47 |
| 16 | DDFHMA | 0.50 | 200/1/0.2 | 2.87 × 10⁶ | 1.11 | 2.79 |
| 17 | DDFHMA | 0.50 | 50/1/0.05 | 1.20 × 10⁶ | 1.17 | 1.67 |
| 18 | DDFHMA | 0.50 | 100/1/0.4 | 1.13 × 10⁶ | 1.11 | 3.56 |
| 19 | DDFHMA | 0.50 | 100/1/0.2 | 1.41 × 10⁶ | 1.16 | 2.84 |
| 20 | DDFHMA | 0.50 | 100/1/0.05 | 2.01 × 10⁶ | 1.07 | 2.00 |
We then investigated the effects of different reaction parameters on POD. As shown in Table 1 and Fig. 1b–d, for both monomers, the POD displayed positive relationships with the concentrations of monomer ([M]) and PC ([PC]), yet exhibited an inverse trend with the concentration of CTA ([CTA]) (Fig. 1c). This indicated a distinct condition-result correlation scenario where Mn is synergistically influenced by all the reaction components, which is different from a photo-induced electron transfer-reversible addition-fragmentation transfer (PET-RAFT) process.35 However, we noticed that this effect pattern is similar to the polymerization rate of PET-RAFT, which has been investigated and explained as eqn (2):45
 | (2) |
We hypothesized that, at the beginning of the reaction, a higher polymerization rate will raise the probability of the original CTA to be initiated and undergo monomer-addition, leading to a larger proportion of CTA evolving into the propagating species before the reaction gets into the equilibrium state (no monomer left in the solvent phase), exhibiting a higher POD. To validate this assumption, we conducted a series of reactions at a similar polymerization rate by keeping constant [M] and [PC]/[CTA] values according to eqn (2) (the impact of kt is negligible since kt ≪ kt,crossKRAFT[CTA]). The polymerization results are tabulated in Table 2, while the SEC curves showed no shoulder peaks for all the reactions (Fig. 2a and b), indicating excellent livingness of this approach. When [M] and [PC]/[CTA] were respectively fixed at 0.5 mol L−1 and 0.1, POD values stabilized at 2.80 for NFHMA and 2.40 for DDFHMA, resulting in linear relationships between the initial ratio of [M]/[CTA] and the obtained molecular weights (Fig. 2c), providing convenience for tailoring specific Mn values. Based on this evidence, we also attempted to extrapolate quantitative regression models correlating Mn with the reaction parameters with eqn (3):
 | (3) |
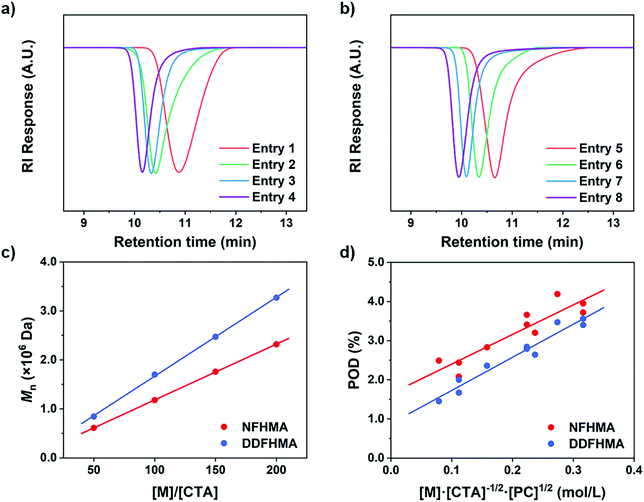 | ||
| Fig. 2 (a) SEC curves for entries 1–4 in Table 2. (b) SEC curves for entries 5–8 in Table 2. (c) Linear relationships between Mn and the initial [M]/[CTA] values. (d) Linear regressions between the POD values and polymerization rates based on eqn (3). For NFHMA, POD = 7.56[M][CTA]−1/2[PC]1/2 + 1.65, goodness-of-fitting R2 = 0.84. For DDFHMA, POD = 8.46[M][CTA]−1/2[PC]1/2 + 0.88, goodness-of-fitting R2 = 0.95. For red dots, the monomer is NFHMA; for blue dots, the monomer is DDFHMA. | ||
| Entry | Monomer | [M]/[CTA]/[PC] |
M
n![[thin space (1/6-em)]](https://www.rsc.org/images/entities/char_2009.gif) b (Da) b (Da) |
Đ | POD (%) |
|---|---|---|---|---|---|
| a All reactions were performed in 1.0 mL DMSO, PC = Ir(ppy)3, [M] = 0.5 mol L−1. A 13 W white LED bulb (light intensity = 33 mW cm−2) was used as a light source. Irradiation times were controlled to reach full monomer conversion (0.5–3 h). b M n and Đ were determined by SEC measurements in DMF at 50 °C. | |||||
| 1 | NFHMA | 50/1/0.1 | 6.13 × 10⁵ | 1.21 | 2.73 |
| 2 | NFHMA | 100/1/0.1 | 1.18 × 10⁶ | 1.25 | 2.83 |
| 3 | NFHMA | 150/1/0.1 | 1.76 × 10⁶ | 1.08 | 2.84 |
| 4 | NFHMA | 200/1/0.1 | 2.32 × 10⁶ | 1.08 | 2.78 |
| 5 | DDFHMA | 50/1/0.1 | 8.43 × 10⁵ | 1.27 | 2.39 |
| 6 | DDFHMA | 100/1/0.1 | 1.70 × 10⁶ | 1.09 | 2.36 |
| 7 | DDFHMA | 150/1/0.1 | 2.47 × 10⁶ | 1.11 | 2.43 |
| 8 | DDFHMA | 200/1/0.1 | 3.27 × 10⁶ | 1.09 | 2.45 |
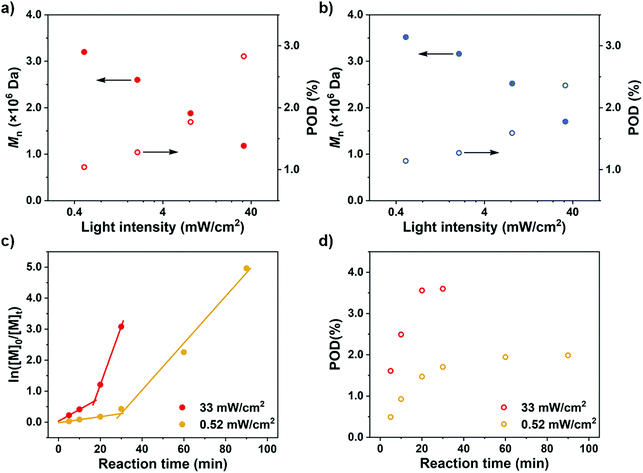
To further confirm the rate-dependence of the CTA-differentiation process, we next investigated the impact of light intensity, which has been acknowledged as an influential factor for the polymerization rate of PET-RAFT reaction.35 While other parameters were kept constant, different distances of the reaction mixture from the LED light bulb were employed to create various light intensities (0.52–33 mW cm−2). As displayed in Fig. 3a and b, at the same feed ratio of [M]/[CTA]/[PC] = 100/1/0.1, an enhanced light intensity resulted in a lower Mn, representing a higher POD. This trend is in correspondence with our recent research on the polymerization of pentafluorostyrene, where a weak light intensity was employed to fabricate large nanoparticles by generating less propagating chains compared with strong light.46
To further observe the dispersion polymerization process at different rates, we conducted kinetic experiments with NFHMA ([M]/[CTA]/[PC] = 200/1/0.2). As shown in Fig. 3c, the reaction proceeded with a two-stage regime when employing either a strong or weak light intensity. The evolvement of POD also follows a two-stage pattern where the values first increase and then remain steady under both conditions (Fig. 3d). Moreover, the stage transition points of POD and polymerization rate were in great correspondence (Fig. 3c and d, at 17 min and 30 min for reactions under strong and weak light, respectively). We believe that the first stage is the differentiation process which displayed a relatively low propagation rate, attributing to that the polymerization took place in both the solvent phase and the fluorous particles. When all monomers migrated into the particles, the polymerization site located entirely in the particles with higher local monomer concentrations, leading to elevated polymerization rates (the second stage in the kinetic curves). In contrast, the reaction under weak light irradiation underwent a longer differentiation process but ended with a lower POD, validating our assumption that a reduced polymerization rate would result in a less propagating chain.
After rationalization of the POD fluctuations under different conditions, we then investigated the influence of the PDMA length on the differentiation process in order to generate UHMW fluoropolymers with diverse block ranges. Since the CTA-differentiation involves in situ nucleation of fluorinated particles, we envisioned that the dispersion polymerization with a longer PDMA will require a longer time for CTA to reach enough fluorine incorporation to aggregate,47 extending the differentiation process. As shown in Table 3 and Fig. 4, when we employed PDMA of different lengths (Mn = 5.03 × 10³–2.05 × 10⁴ Da as determined by SEC measurements) as substituents on CTA, the polymerizations all generated UHMW polymers with narrow distributions (Đ < 1.28) (Fig. S16 and S17†), manifesting the robustness of the CTA-differentiation-involving polymerization. The resulted POD increased with the PDMA length under identical polymerization conditions ([M]/[CTA]/[PC] = 200/1/0.1) due to the extended differentiation period (Fig. 4a and b), which was also validated through kinetic experiments (Fig. 4c and d). Noticeably, the POD values for NFHMA were always higher than those for DDFHMA, which we believe is attributed to a faster assembly rate under a stronger fluorous interaction of the monomer with higher fluorine content. The above investigations evaluated the substrate-effect on the differentiation process, providing guidance for accessing well-defined UHMW fluoropolymers with versatile chemical compositions.
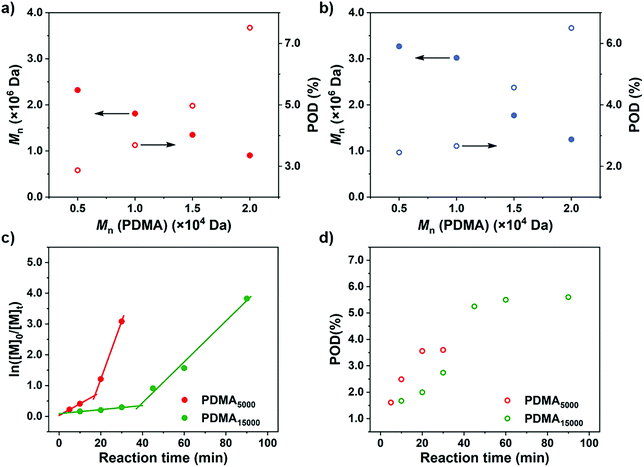 | ||
| Fig. 4 M n and POD values obtained via polymerization from PDMA of different chain lengths. (a) Monomer = NFHMA. (b) Monomer = DDFHMA. All reactions were performed in 1.0 mL DMSO, PC = Ir(ppy)3, [M] = 0.5 mol L−1, [M]/[CTA]/[PC] = 100/1/0.1. A 13 W white LED bulb (light intensity = 33 mW cm−2) was used as a light source. (c) ln[M]0/[M]tvs irradiation time and (d) POD evolution plots for polymerizations of NFHMA from PDMA with different chain lengths with feed ratio = [M]/[CTA]/[PC] = 200/1/0.2. For red dots, Mn (PDMA) = 5.03 × 10³ Da; for green dots, Mn (PDMA) = 1.58 × 10⁴ Da. Note: the red plots in (c) and (d) are the same as the ones in Fig. 3c and d. | ||
| Entry | Monomer | M n (PDMA)b (Da) |
M
n![[thin space (1/6-em)]](https://www.rsc.org/images/entities/char_2009.gif) b (Da) b (Da) |
Đ | POD (%) |
|---|---|---|---|---|---|
| a All reactions were performed in 1.0 mL DMSO, PC = Ir(ppy)3, [M] = 0.5 mol L−1, [M]/[CTA]/[PC] = 200/1/0.1. A 13 W white LED bulb (light intensity = 33 mW cm−2) was used as a light source. Irradiation times were controlled to reach full monomer conversion (0.5–4 h). b M n (PDMA), Mn and Đ were determined by SEC measurements in DMF at 50 °C. | |||||
| 1 | NFHMA | 5.03 × 10³ | 2.32 × 10⁶ | 1.08 | 2.87 |
| 2 | NFHMA | 1.08 × 10⁴ | 1.81 × 10⁶ | 1.13 | 3.69 |
| 3 | NFHMA | 1.48 × 10⁴ | 1.35 × 10⁶ | 1.18 | 4.97 |
| 4 | NFHMA | 2.05 × 10⁴ | 9.04 × 10⁵ | 1.14 | 7.51 |
| 5 | DDFHMA | 5.03 × 10³ | 3.27 × 10⁶ | 1.09 | 2.45 |
| 6 | DDFHMA | 1.08 × 10⁴ | 3.02 × 10⁶ | 1.09 | 2.66 |
| 7 | DDFHMA | 1.48 × 10⁴ | 1.77 × 10⁶ | 1.12 | 4.56 |
| 8 | DDFHMA | 2.05 × 10⁴ | 1.25 × 10⁶ | 1.28 | 6.50 |
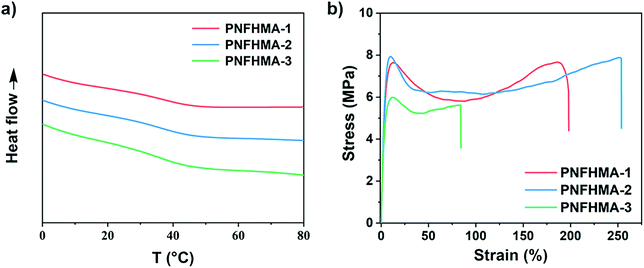
Finally, we probed the structure-property relationships of the UHMW fluoropolymers obtained from this approach to search for the potential applicability on materials design. Three poly(NFHMA) (PNFHMA) samples with varied molecular weights (PNFHMA-1, Mn = 6.72 × 10⁵ Da, Đ = 1.18; PNFHMA-2, Mn = 1.88 × 10⁶ Da, Đ = 1.12; PNFHMA-3, Mn = 3.20 × 10⁶ Da, Đ = 1.09) prepared from the same CTA (PDMA with Mn = 5.03 × 10⁴ Da) were selected and characterized for their thermal and mechanical performances. While the differential scanning calorimetry (DSC) measurements indicated similar Tg values for the three polymers (∼36 °C, Fig. 5a), a considerable difference in their mechanical performances on tensile test experiments was observed. As displayed in Fig. 5b, a polymer with the lowest Mn (PNFHMA-3) gave inferior tensile strength at 6.0 ± 0.2 MPa compared with the counterparts with higher Mn, while a further increase in Mn presented no improvements in the material's strength (tensile strength at 7.7 ± 0.3 and 7.9 ± 0.5 MPa for PNFHMA-1 and PNFHMA-2, respectively). Moreover, the highest elongation at break (254 ± 8%) of the UHMW fluoropolymers was afforded with medium Mn in the three samples, indicating that overhigh molecular weight will pose a negative effect on the toughness of the materials, which is caused by increased chain entanglements restraining chain straightening before break.48
4. Conclusion
In conclusion, we interrogated the condition and substrate effects on the CTA-differentiation-involving polymerization approach, and have discovered several influential factors of the resulted molecular weights and the percentage of differentiation (POD). Particularly, the POD values increased with the polymerization rate due to a higher probability of the generation of propagating species. Moreover, a prolonged differentiation process would also lead to a higher POD, which can be realized through the manipulation of monomer and CTA structures. At last, the tensile test experiments on polymers with different molecular weights suggested that a higher Mn can boost the strength yet hinder the toughness performances. Considering the promising virtues for both UHMW and fluorinated materials, this work rationalized the synthesis planning process for the CTA-differentiation-involving polymerization, creating opportunities for filling the gaps in developing novel UHMW fluorinated polymers towards superior performances.Conflicts of interest
There are no conflicts to declare.Acknowledgements
This research was financially supported by the NSFC (no. 21704016, 21971044), and start-up funding from Fudan University.References
- K. Matyjaszewski, Macromolecules, 2012, 45, 4015–4039 CrossRef CAS.
- G. Moad, E. Rizzardo and S. H. Thang, Aust. J. Chem., 2005, 58, 379–410 CrossRef CAS.
- J. Nicolas, Y. Guillaneuf, C. Lefay, D. Bertin, D. Gigmes and B. Charleux, Prog. Polym. Sci., 2013, 38, 63–235 CrossRef CAS.
- M. Ouchi and M. Sawamoto, Macromolecules, 2017, 50, 2603–2614 CrossRef CAS.
- Z. An, ACS Macro Lett., 2020, 9, 350–357 CrossRef CAS.
- M. Hayashi, A. Noro and Y. Matsushita, Macromol. Rapid Commun., 2016, 37, 678–684 CrossRef CAS.
- L. Despax, J. Fitremann, M. Destarac and S. Harrisson, Polym. Chem., 2016, 7, 3375–3377 RSC.
- J. Yoon, W. Lee and E. L. Thomas, Adv. Mater., 2006, 18, 2691–2694 CrossRef CAS.
- S.-Y. Hsu, Y. Kayama, K. Ohno, K. Sakakibara, T. Fukuda and Y. Tsujii, Macromolecules, 2020, 53, 132–137 CrossRef CAS.
- J. K. D. Mapas, T. Thomay, A. N. Cartwright, J. Ilavsky and J. Rzayev, Macromolecules, 2016, 49, 3733–3738 CrossRef CAS.
- Q. Quan, H. Wen, S. Han, Z. Wang, Z. Shao and M. Chen, ACS Appl. Mater. Interfaces, 2020, 12, 24319–24327 CrossRef CAS.
- J. Rzayev and J. Penelle, Angew. Chem., Int. Ed., 2004, 43, 1691–1694 CrossRef CAS.
- R. W. Simms and M. F. Cunningham, Macromolecules, 2007, 40, 860–866 CrossRef CAS.
- N. P. Truong, M. V. Dussert, M. R. Whittaker, J. F. Quinn and T. P. Davis, Polym. Chem., 2015, 6, 3865–3874 RSC.
- V. J. Cunningham, M. J. Derry, L. A. Fielding, O. M. Musa and S. P. Armes, Macromolecules, 2016, 49, 4520–4533 CrossRef CAS.
- V. Percec, T. Guliashvili, J. S. Ladislaw, A. Wistrand, A. Stjerndahl, M. J. Sienkowska, M. J. Monteiro and S. Sahoo, J. Am. Chem. Soc., 2006, 128, 14156–14165 CrossRef CAS.
- E. Read, A. Guinaudeau, D. J. Wilson, A. Cadix, F. Violleau and M. Destarac, Polym. Chem., 2014, 5, 2202–2207 RSC.
- Y. Wang, Q. Wang and X. Pan, Cell Rep. Phys. Sci., 2020, 1, 100073 CrossRef.
- R. N. Carmean, T. E. Becker, M. B. Sims and B. S. Sumerlin, Chem, 2017, 2, 93–101 CAS.
- R. N. Carmean, M. B. Sims, C. A. Figg, P. J. Hurst, J. P. Patterson and B. S. Sumerlin, ACS Macro Lett., 2020, 9, 613–618 CrossRef CAS.
- Z. Liu, Y. Lv and Z. An, Angew. Chem., Int. Ed., 2017, 56, 13852–13856 CrossRef CAS.
- Z. An and R. Li, Angew. Chem., Int. Ed., 2020 DOI:10.1002/anie.202010722.
- T. Imae, Curr. Opin. Colloid Interface Sci., 2003, 8, 307–314 CrossRef CAS.
- E. H. Discekici, A. Anastasaki, R. Kaminker, J. Willenbacher, N. P. Truong, C. Fleischmann, B. Oschmann, D. J. Lunn, J. R. de Alaniz, T. P. Davis, C. M. Bates and C. J. Hawker, J. Am. Chem. Soc., 2017, 139, 5939–5945 CrossRef CAS.
- S. A. Mohammad, S. Shingdilwar, S. Banerjee and B. Ameduri, Prog. Polym. Sci., 2020, 106, 101255 CrossRef CAS.
- K. Jiang, S. Han, M. Ma, L. Zhang, Y. Zhao and M. Chen, J. Am. Chem. Soc., 2020, 142, 7108–7115 CrossRef CAS.
- N. M. L. Hansen, K. Jankova and S. Hvilsted, Eur. Polym. J., 2007, 43, 255–293 CrossRef CAS.
- B. Ameduri, Chem. – Eur. J., 2018, 24, 18830–18841 CrossRef CAS.
- H. Gong, Y. Gu, Y. Zhao, Q. Quan, S. Han and M. Chen, Angew. Chem., Int. Ed., 2020, 59, 919–927 CrossRef CAS.
- M. Chen, M. Zhong and J. A. Johnson, Chem. Rev., 2016, 116, 10167–10211 CrossRef CAS.
- T. G. McKenzie, Q. Fu, M. Uchiyama, K. Satoh, J. Xu, C. Boyer, M. Kamigaito and G. G. Qiao, Adv. Sci., 2016, 3, 1500394 CrossRef.
- S. Dadashi-Silab, S. Doran and Y. Yagci, Chem. Rev., 2016, 116, 10212–10275 CrossRef CAS.
- N. Corrigan, J. Yeow, P. Judzewitsch, J. Xu and C. Boyer, Angew. Chem., Int. Ed., 2019, 58, 5170–5189 CrossRef CAS.
- B. P. Fors and C. J. Hawker, Angew. Chem., Int. Ed., 2012, 51, 8850–8853 CrossRef CAS.
- J. Xu, K. Jung, A. Atme, S. Shanmugam and C. Boyer, J. Am. Chem. Soc., 2014, 136, 5508–5519 CrossRef CAS.
- A. Anastasaki, V. Nikolaou, Q. Zhang, J. Burns, S. R. Samanta, C. Waldron, A. J. Haddleton, R. McHale, D. Fox, V. Percec, P. Wilson and D. M. Haddleton, J. Am. Chem. Soc., 2014, 136, 1141–1149 CrossRef CAS.
- X. Liu, L. Zhang, Z. Cheng and X. Zhu, Polym. Chem., 2016, 7, 689–700 RSC.
- W. Ma, X. Zhang, Y. Ma, D. Chen, L. Wang, C. Zhao and W. Yang, Polym. Chem., 2017, 8, 3574–3585 RSC.
- S. Li, G. Han and W. Zhang, Polym. Chem., 2020, 11, 1830–1844 RSC.
- L. Xia, B.-F. Cheng, T.-Y. Zeng, X. Nie, G. Chen, Z. Zhang, W.-J. Zhang, C.-Y. Hong and Y.-Z. You, Adv. Sci., 2020, 7, 1902451 CrossRef CAS.
- C. Tian, P. Wang, Y. Ni, L. Zhang, Z. Cheng and X. Zhu, Angew. Chem., Int. Ed., 2020, 59, 3910–3916 CrossRef CAS.
- G. Szczepaniak, M. Łagodzińska, S. Dadashi-Silab, A. Gorczyński and K. Matyjaszewski, Chem. Sci., 2020, 11, 8809–8816 RSC.
- B. L. Buss, C.-H. Lim and G. M. Miyake, Angew. Chem., Int. Ed., 2020, 59, 3209–3217 CrossRef CAS.
- S. Allison-Logan, Q. Fu, Y. Sun, M. Liu, J. Xie, J. Tang and G. G. Qiao, Angew. Chem., Int. Ed., 2020 DOI:10.1002/anie.202007196.
- P. N. Kurek, A. J. Kloster, K. A. Weaver, R. Manahan, M. L. Allegrezza, N. De Alwis Watuthanthrige, C. Boyer, J. A. Reeves and D. Konkolewicz, Ind. Eng. Chem. Res., 2018, 57, 4203–4213 CrossRef CAS.
- S. Han, Y. Gu, M. Ma and M. Chen, Chem. Sci., 2020, 11, 10431–10436 RSC.
- R. Wei, Y. Luo and P. Xu, J. Polym. Sci., Part A: Polym. Chem., 2011, 49, 2980–2989 CrossRef CAS.
- R. W. Nunes, J. R. Martin and J. F. Johnson, Polym. Eng. Sci., 1982, 22, 205–228 CrossRef CAS.
Footnote |
| † Electronic supplementary information (ESI) available. See DOI: 10.1039/d0py01366h |
| This journal is © The Royal Society of Chemistry 2020 |

