 Open Access Article
Hierarchical structure N, O-co-doped porous carbon/carbon nanotube composite derived from coal for supercapacitors and CO2 capture†
Jian
Hao
 *a,
Xiu
Wang
a,
Yanxia
Wang
a,
Xiaoyong
Lai
a,
Qingjie
Guo
a,
Jiupeng
Zhao
 b,
Yu
Yang
b and
Yao
Li
 c
c
aState Key Laboratory of High-efficiency Utilization of Coal and Green Chemical Engineering, College of Chemistry & Chemical Engineering, Ningxia University, Yinchuan 750021, China. E-mail: haojian2017@126.com
bSchool of Chemistry and Chemical Engineering, Harbin Institute of Technology, Harbin, 150001, China
cCenter for Composite Materials, Harbin Institute of Technology, Harbin, 150001, China
First published on 11th January 2020
Abstract
The energy and environmental crises have forced us to search for a new green energy source and develop energy storage and environmental restoration technologies. Fabrication of carbon functional materials derived from coal has attracted increasing attention in the energy storage and gas adsorption fields. In this study, an N, O-co-doped porous carbon/carbon nanotube composite was prepared by functionalizing coal-based porous carbon with carbon nanotubes (CNTs) and ionic liquid via annealing. The resulting material not only inherited the morphology of CNTs and porous carbon, but also developed a three dimensional (3D) hierarchical porous structure with numerous heteroatom groups. The N, O co-doped porous carbon/CNT composite (N, O-PC-CNTs) showed a surface area of 2164 m2 g−1, and a high level of N/O dopants (8.0 and 3.0 at%, respectively). Benefiting from such merits, N, O-PC-CNTs exhibited a rather high specific capacitance of 287 F g−1 at a current density of 0.2 A g−1 and a high rate capability (70% and 64% capacitance retention at 10 and 50 A g−1, respectively) in a three electrode system. Furthermore, an N, O-PC-CNT symmetrical supercapacitor showed a high cycling stability with 95% capacitance retention after 20![[thin space (1/6-em)]](https://www.rsc.org/images/entities/char_2009.gif) 000 cycles at 20 A g−1 and an energy density of 4.5 W h kg−1 at a power density of 12.5 kW kg−1 in 6 mol L−1 KOH electrolyte. As a CO2 adsorbent, N, O-PC-CNTs exhibited a high CO2 uptake of 5.7 and 3.7 mmol g−1 at 1 bar at 273 and 298 K, respectively. Moreover, N, O-PC-CNTs showed cycling stability with 94% retention of the initial CO2 adsorption capacity at 298 K over 10 cycles. This report introduces a strategy to design a coal based porous carbon composite for use in efficient supercapacitor electrodes and CO2 adsorbents.
000 cycles at 20 A g−1 and an energy density of 4.5 W h kg−1 at a power density of 12.5 kW kg−1 in 6 mol L−1 KOH electrolyte. As a CO2 adsorbent, N, O-PC-CNTs exhibited a high CO2 uptake of 5.7 and 3.7 mmol g−1 at 1 bar at 273 and 298 K, respectively. Moreover, N, O-PC-CNTs showed cycling stability with 94% retention of the initial CO2 adsorption capacity at 298 K over 10 cycles. This report introduces a strategy to design a coal based porous carbon composite for use in efficient supercapacitor electrodes and CO2 adsorbents.
Introduction
In recent decades, excessive use of fossil fuels has caused global climate change and resource depletion. Consequently, the research and development of clean energy have aroused worldwide research interest.1,2 Supercapacitors have received significant attention due to their superior power density, fast charge/discharge rate and long cycle life.3,4 The performance of supercapacitors intimately depends on the physical and chemical properties of the electrode materials. Although a great number of functional electrode materials with enhanced electrochemical characteristics have been developed to satisfy the requirement of sustainable energy storage devices in the past decades, carbon-based materials still dominate the supercapacitor applications due to their natural abundance, low cost, large surface area, good electrical conductivity and excellent chemical stability.5,6 In order to mitigate environmental crisis, CO2 capture and sequestration (CCS) has been considered as an effective method to reduce anthropogenic CO2 emissions.7,8 Porous carbon is a promising material for CO2 adsorption, due to its large surface area, and low-manufacturing cost.9,10 Thus, the delicate fabrication of suitable carbon materials that can be used as supercapacitor electrodes and CO2 adsorbents is extremely important to relieve fuel crisis and environmental damage.It is well known that coal is an abundant, natural source enriched with carbon. However, the direct combustion of coal (especially low-rank coals) for energy generation has led to severe environmental pollution.11 One of the most attractive strategies for using low-rank coal is to convert coal into a high value-added graphite material for more sustainable applications. Coal-based active carbon is an important value-added derivative material. However, most of the coal-based active carbon materials exhibit poor performance in gas separation and energy storage devices, limited by their specific surface area. Recently, coal-based porous carbons with a high specific surface area have been prepared by chemical activation. For example, through KOH activation, porous carbon with phrase surface area as high as 3000 m2 g−1 can be achieved.12 However, porous carbon as a supercapacitor electrode or CO2 adsorbent still exhibits poor performance, because excessive micropores will cause high ion (gas molecule) transport resistance and insufficient diffusion. The electrochemical performance of carbon materials is not totally associated with the surface area because part of the surface sites may not be accessible to the electrolyte ions.13,14 To achieve a high energy density and a high rate performance, the carbon electrode is expected to have a high surface area and a hierarchical pore size distribution. The hierarchically porous structure combining macropores, mesopores, and micropores provides an excellent solution to the ion transportation and accommodation issues in electrodes.6,15 Moreover, this structure provides a new strategy for CO2 capture, because it could accelerate the gas diffusion and increase the utilization of micropores.16 However, the common strategies for the synthesis of coal-based porous carbon are carbonation and activation, through which it is difficult to control the pore structure. Using coal-based porous composite materials is an effective method to gain a hierarchically porous structure, which could regulate the pore structure by controlling the compositions.
With excellent physical and chemical stability, low gravimetric density, and excellent electronic conductivity, carbon nanotubes (CNTs) have been used widely in energy conversion and storage.17–19 CNTs attached to the edges and surface of porous carbon as spacers can increase the electrolyte solution-accessible surface area and provide electrical conduction pathways. On the other hand, adding CNTs can build hierarchically porous structures. CNTs can construct a three-dimensional (3D) framework for porous carbon. These 3D frameworks can avoid pore overlapping, reduce specific surface area loss and favor diffusion of electrolyte ions for electrodes (or gas molecule diffusion) by providing shorter pathways. In recent years, CNTs composite materials have drawn significant research attention as electrodes for supercapacitors and have shown improved electrochemical properties.20–23 In addition to structural frameworks, heteroatom doping also helps to improve the performance of porous carbon with the introduction of pseudocapacitor behavior.24,25 Furthermore, the introduction of heteroatoms (such as more electron-rich N and S) can bring more electrons to the delocalized π-system of carbon and more heterogeneous species, which consequently increase the electrical conductivity, improve the wettability, and also enhance CO2 adsorption capacity.26,27 Nitrogen-doped porous carbon materials have been widely studied in supercapacitors, adsorption, catalysis, and so on.28–31
Ionic liquids have usually been used as carbon sources to prepare nitrogen-doped carbon materials due to the high heteroatom allowance in their molecular structure, compared to that of conventional nitrogen polymer precursors. Lee et al.32 prepared nitrogen-doped carbon via the pyrolysis of 1-ethyl-3-methylimidazolium tricyanomethanide ([EMIm][C(CN)3]). Ko et al.33 prepared ionic-liquid-derived N-doped carbon (ILC) by the pyrolysis of an ionic liquid, 1-ethyl-3-methylimidazolium dicyanamide ([EMIm]-dca), at different pyrolysis temperatures.
In this study, we have developed a facile strategy to achieve the effective conversion of inferior coal to a high value-added porous carbon functional material via simple chemical activation, functional modification with CNTs and ionic liquid via annealing. The obtained porous carbon exhibited a 3D interconnected hierarchical porous structure with high phrase surface area (2164 m2 g−1), high N/O doping content (about 8.0 at% for N, and 3.0 at% for O), outstanding specific capacitance (287 and 183 F g−1 at the current densities of 0.2 and 50 A g−1 in a 6 mol L−1 KOH electrolyte, respectively), and high cycling stability (capacitance retention of 95% after 20![[thin space (1/6-em)]](https://www.rsc.org/images/entities/char_2009.gif) 000 cycles) for symmetric supercapacitor applications. More impressively, the carbon material also presented a high CO2 adsorption capacity of 5.7 and 3.7 mmol g−1 at atmospheric pressure and temperatures of 273 K and 298 K, respectively. Moreover, there are almost no adsorption capacity losses during 10 cycles at 298 K. The excellent electrochemical performance and CO2 capture capacity, endow the product with a great potential for supercapacitor applications and CO2 capture.
000 cycles) for symmetric supercapacitor applications. More impressively, the carbon material also presented a high CO2 adsorption capacity of 5.7 and 3.7 mmol g−1 at atmospheric pressure and temperatures of 273 K and 298 K, respectively. Moreover, there are almost no adsorption capacity losses during 10 cycles at 298 K. The excellent electrochemical performance and CO2 capture capacity, endow the product with a great potential for supercapacitor applications and CO2 capture.
Experimental
Synthesis of porous carbon
Coal (Yangchangwan Coal, Ningxia, China) was utilized as a precursor for the porous carbon (PC) preparation. Briefly, coal was powdered and sieved using 80 and 100 meshes and then dried at 120 °C for 24 h. Subsequently, the coal (2.0 g) was mixed with a certain amount of KOH (4.0 g) and K2CO3 (0.2 g) in DI water and then dried until all DI water evaporated. The remnant mixture was pyrolyzed in a tubular furnace at 450 °C for 1 h and then up to 900 °C for 40 min at a heating rate of 5 °C min−1 under N2 atmosphere. The resultant samples of PC were obtained by washing with HCl until the pH reached 7, followed by several washings with distilled water and drying at 120 °C overnight.Synthesis of N, O co-doped PC-CNTs
The ionic liquid, (1-ethyl-3-methylimidazolium bis(trifluoro-methylsulfonyl) amide ([EMIm]Tf2N); Ionic liquid technology, Germany), was used as an N source to synthesize N, O co-doped PC-CNTs (N, O-PC-CNTs). Typically, [EMIm]Tf2N (0.4 mL), PC (1.0 g), and CNTs (0.1 g) (Chendu Organic Chemicals Co. Ltd. Chinese Academy of Science, China) were mixed by grinding for 2 h. Then, thermal treatment was performed at 500 °C for 3 h at a heating rate of 2 °C min−1 under N2 atmosphere. The resulting samples of N, O-PC-CNTs were obtained by washing with DI water and drying at 90 °C overnight. For comparison, the N, O-doped porous carbon without CNTs (N, O-PC) was also prepared by mixing [EMIm]Tf2N (0.4 mL) and PC (1.0 g) at the same thermal condition. Then, the CNTs, ionic liquid-annealed CNTs, and N, O-PC-CNTs samples with different CNT content were also been prepared and denoted as CNTs, IL-CNTs, N, O-PC-CNTs-5%, and N, O-PC-CNTs-20%, respectively.Material characterization
The morphology and microstructure of the samples were characterized by field-emission scanning electron microscopy (SEM, Quanta 400, FEI NanoPorts) and high-resolution transmission electron microscopy (HRTEM, Tecnai G20, FEI NanoPorts). X-ray diffraction (XRD) measurements were obtained by a TD-3500 X-ray powder diffractometer (BRUKER AXS GMBH, D8 ADVANCE A25). X-ray photoelectron spectroscopy (XPS) was performed using a Kratos XSAM 800 spectrometer (Manchester, UK). Raman spectroscopy analysis was performed using HR800 (Horiba Jobin Yvon) with a 514.5 nm laser source. The pore structure was determined through N2 adsorption/desorption isotherms at 77 K using an automatic physical sorption analyzer (Autosorb IQ, Quantachrome). Before the adsorption measurements, all samples were degassed at 200 °C for more than 6 h under high vacuum conditions.Electrochemical measurements
The electrochemical performance of the samples was determined in a three-electrode cell. The as-prepared samples were used as working electrodes, Pt and an Hg/HgO electrode were used as the counter and reference electrodes, respectively, and KOH solution (6 mol L−1) was used as the electrolyte. The working electrode was prepared by mixing the as-prepared samples and acetylene black with polytetrafluoroethylene (PTFE) in a weight ratio of 80![[thin space (1/6-em)]](https://www.rsc.org/images/entities/char_2009.gif) :
:![[thin space (1/6-em)]](https://www.rsc.org/images/entities/char_2009.gif) 15
15![[thin space (1/6-em)]](https://www.rsc.org/images/entities/char_2009.gif) :
:![[thin space (1/6-em)]](https://www.rsc.org/images/entities/char_2009.gif) 5 and then, the mixture was pressed onto a nickel foam. The electrodes were dried at 110 °C for 12 h under vacuum. The mass loading of the working electrode was about 1–2 mg cm−2. The electrochemical performance of N, O-PC-CNTs was further examined by constructing a two-electrode device. The button-type supercapacitor was assembled by using two similar electrodes (about 1.7 mg cm−2) separated by a piece of polypropylene membrane in 6 mol L−1 KOH aqueous electrolyte. The galvanostatic charge/discharge (GCD) curves were obtained at various current densities using a Neware battery test system (Shenzhen, China). Cyclic voltammetry (CV) at different scanning rates and electrochemical impedance spectroscopy (EIS) in the frequency range from 100 kHz to 0.1 Hz at an amplitude of 5 mV were performed using a CHI660e electrochemical workstation (Shanghai Chenhua Device Company, China).
5 and then, the mixture was pressed onto a nickel foam. The electrodes were dried at 110 °C for 12 h under vacuum. The mass loading of the working electrode was about 1–2 mg cm−2. The electrochemical performance of N, O-PC-CNTs was further examined by constructing a two-electrode device. The button-type supercapacitor was assembled by using two similar electrodes (about 1.7 mg cm−2) separated by a piece of polypropylene membrane in 6 mol L−1 KOH aqueous electrolyte. The galvanostatic charge/discharge (GCD) curves were obtained at various current densities using a Neware battery test system (Shenzhen, China). Cyclic voltammetry (CV) at different scanning rates and electrochemical impedance spectroscopy (EIS) in the frequency range from 100 kHz to 0.1 Hz at an amplitude of 5 mV were performed using a CHI660e electrochemical workstation (Shanghai Chenhua Device Company, China).
CO2 adsorption measurements
The CO2 adsorption behavior of the as-prepared samples was examined by recording CO2 adsorption isotherms by autosorb IQ in the range of 0–1 bar at 298 K and 273 K. Prior to adsorption analysis, the samples were degassed under high vacuum conditions at 200 °C for 6 h. Moreover, the CO2 adsorption–desorption cycles were performed on the autosorb IQ several times at 298 K to acquire the cycling performance of the as-prepared samples.Results and discussion
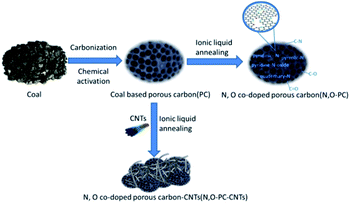
The N, O-PC-CNTs sample was prepared via facile carbonization and activation, followed by an effective ionic liquid pyrolysis and modification of CNTs. Fig. 1 shows the schematic of the fabrication process of N, O-PC-CNTs. Typically, coal powder was used as the raw material. First, to prepare PC, coal powder was mixed with KOH aqueous solution (with 5% K2CO3) and heated for carbonization and activation. Second, the obtained PC sample was mixed with ionic liquid and CNTs. After grinding, CNT-coated PC samples are formed by an ionic liquid self-assembly process. After carbonization treatment, the ionic liquid as an N source was doped into PC samples and finally, the resultant sample of N, O-PC-CNTs was obtained. For comparison, the N, O-doped porous carbon without CNTs (N, O-PC) was prepared by annealing with the ionic liquid at the same thermal condition.Structural characterization
The microstructure and morphologies of the obtained materials were observed by scanning electron microscopy (SEM). The SEM image of the coal powder without KOH activation shows a bulk structure with no pores (Fig. 2a). After KOH activation, PC reveals a 3D honeycomb-like porous structure (Fig. 2b), which can effectively prevent the pore from agglomerating on a large scale. The activation mechanism of coal with KOH is described as 6KOH + 2C →2K + 3H2 + 2K2CO3, followed by the decomposition of K2CO3 and the reaction of K/K2CO3/CO2 with carbon.34,35 After the ionic liquid annealing process, N, O-PC also exhibits a honeycomb-like hierarchical porous structure, but the structure collapsed partly due to the pyrolysis of the ionic liquid (Fig. 2c). It is worth noting that the sample with added CNTs can retain the 3D honeycomb-like hierarchical porous structure during pyrolysis process (Fig. 2d). The CNTs dispersed uniformly into PC, which can create mesopores and macropores (Fig. S1†), providing more electrical conduction pathways.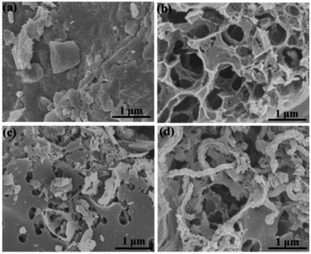 | ||
| Fig. 2 SEM images of as-prepared samples of (a) coal powder, (b) PC samples, (c) N, O-PC samples, and (d) N, O-PC-CNTs samples. | ||
Fig. 3a–c exhibit the TEM images of the PC, N, O-PC and N, O-PC-CNTs samples, respectively. It can be seen that the product (PC) obtained by KOH activation shows a layered structure with some wrinkles and pores (Fig. 3a). After ionic liquid modification, some pore structures were reconstructed and more pore structures can be gained (Fig. 3b), since ionic liquid pyrolysis leads to re-activation of PC. Compared with the PC and N, O-PC samples, the sample of N, O-PC-CNTs possesses a large amount of meso- and macropores (Fig. 3c and d), which is more favorable for the fast diffusion of ions and hence results in a high rate performance of the electrode materials. The formation of a hierarchical porous architecture is attributed to a combined self-assembly of ionic liquid-modified CNTs as well as the etching by KOH. The high-resolution TEM (HRTEM) image of N, O-PC-CNTs is shown in Fig. 3d. The graphitized wall structure of CNTs with a lot of pores can be found. This indicated that CNTs occupied PC (or coated onto theirs surface).
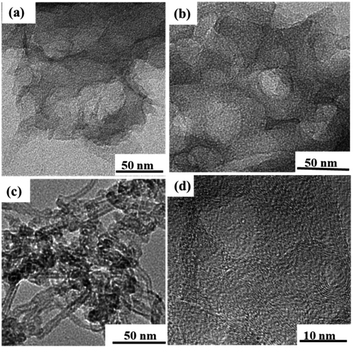 | ||
| Fig. 3 TEM images of as prepared samples (a) PC, (b) N, O-PC, (c) N, O-PC-CNTs samples, and (d) the HRTEM image of N, O-PC-CNTs samples. | ||
Nitrogen adsorption–desorption isotherms were obtained to investigate the pore structures present in the as-prepared samples. From the Brunauer–Emmett–Teller (BET) analysis, the phrase specific surface area of the obtained samples showed a significant decrease with the addition of ionic liquid and CNTs (3253 m2 g−1 for PC, 2600 m2 g−1 for N, O-PC and 2164 m2 g−1 for N, O-PC-CNTs). As we can see from Fig. 4a, for PC and N, O-PC samples, the isotherms were determined to be type I according to the IUPAC classification; the steep uptake at P/P0 < 0.01 in the N2 sorption isotherm indicates the presence of a large number of micropores.36 It is noted that the N, O-PC-CNT sample displays combined characteristics of type I/IV isotherms with a H2 hysteresis loop at a relative pressure ranging from 0.4 to 0.9; the crescent-like hysteresis loop at 0.40 < P/P0 < 1 exhibited no clear boundary between the sorption regions corresponding to meso- and macropores.37 These results indicate the existence of a hierarchical pore structure in N, O-PC-CNTs. Fig. 4b shows the pore size distribution of the obtained samples. It is clear that most of the pores fall in the diameter range of 1–4 nm for all the samples, which is the most suitable condition for the diffusion of hydrated ions during electrochemical tests. There is a sharp peak in the pore size distribution plots of PC and N, O-PC samples centered at about 2.0 nm for PC and 3.0 nm for N, O-PC. For N, O-PC-CNTs, there are three sharp peaks in the pore size distribution plots at about 2.0 nm, 3.0 nm and 4.0 nm, and a broad peak at 6.0–10.0 nm. Meanwhile, it can be seen that the pore size distribution plots of CNTs and IL-CNTs (Fig. S1a†) have an obvious hysteresis loop at relative pressure from 0.4 to 0.9, indicating the presence of abundant mesopores. The pore size distributions (Fig. S1b†) show that after ionic liquid modification, some mesopores structure can be gained. These results indicate that ionic liquid pyrolysis affects the pore texture. Adding CNTs introduce mesopores, which is in agreement with the observations in SEM and TEM images. The pore structure parameters of all the samples are summarized in Table 1.
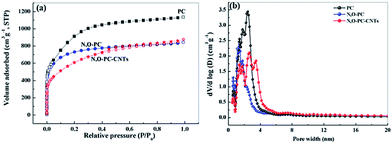 | ||
| Fig. 4 (a) Nitrogen adsorption desorption isotherms, and (b) pore size distribution of PC, N, O-PC, and N, O-PC-CNTs. | ||
| Samples | Textural properties | ||||
|---|---|---|---|---|---|
| S BET (m2 g−1) | S micro (m2 g−1) | V total (cm3 g−1) | V micro (cm3 g−1) | V micro/Vtotal (%) | |
| PC | 3253 | 2172 | 1.76 | 0.98 | 0.56 |
| N, O-PC | 2600 | 2188 | 1.30 | 0.96 | 0.74 |
| N, O-PC-CNTs | 2164 | 1079 | 1.36 | 0.49 | 0.36 |
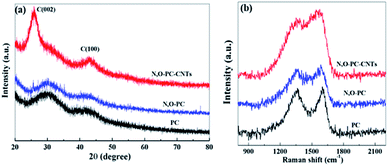
The structure of the as-prepared samples was studied by XRD and Raman spectroscopy. As shown in Fig. 5a, no sharp peaks were observed in the XRD pattern of PC and N, O-PC, indicative of the amorphous state of carbon.38 In the sample of N, O-PC-CNTs, CNTs show a relatively sharper peak at ∼26° belonging to (002) diffraction peak![[thin space (1/6-em)]](https://www.rsc.org/images/entities/char_2009.gif) of
of![[thin space (1/6-em)]](https://www.rsc.org/images/entities/char_2009.gif) graphite due to the greater order degree of carbon walled layer.39 The Raman spectra (Fig. 5b) clearly indicate the well-known D-band peak at 1350 cm−1 and G-band at 1580 cm−1.40,41 Samples PC and N, O-PC show a strong D-band peak. However, the sample of N, O-CP-CNTs shows a stronger G band peak, suggesting that the degree of graphitization increased with added CNTs, which can also be confirmed by the HRTEM image (Fig. 3d).The intensity ratios of the D to G bands (ID/IG) for PC, N, O-PC and N, O-PC-CNTs are 1.5, 1.4 and 0.8, respectively; the high intensity of the D band reveals that PC and N, O-PC have lower degree of graphitization and contained a significant amount of disordered sections and defects, which is consistent with the XRD results described above.
graphite due to the greater order degree of carbon walled layer.39 The Raman spectra (Fig. 5b) clearly indicate the well-known D-band peak at 1350 cm−1 and G-band at 1580 cm−1.40,41 Samples PC and N, O-PC show a strong D-band peak. However, the sample of N, O-CP-CNTs shows a stronger G band peak, suggesting that the degree of graphitization increased with added CNTs, which can also be confirmed by the HRTEM image (Fig. 3d).The intensity ratios of the D to G bands (ID/IG) for PC, N, O-PC and N, O-PC-CNTs are 1.5, 1.4 and 0.8, respectively; the high intensity of the D band reveals that PC and N, O-PC have lower degree of graphitization and contained a significant amount of disordered sections and defects, which is consistent with the XRD results described above.
XPS measurements were performed to gain insight into the chemical configurations of PC, N, O-PC, and N, O-PC-CNTs (Fig. 6a). Compared with the case of PC, we can clearly see the existence of N in N, O-PC and N, O-PC-CNTs after ionic liquid pyrolysis. The N and O contents are similar for N, O-PC and N, O-PC-CNTs and can reach about 8 at% and 3 at%, respectively. The element contents of as-prepared sample determined by XPS are listed in Table S1,† and the corresponding N 1s, C 1s, and O 1s spectra of N, O-PC-CNTs are shown in Fig. 6b–d. The high-resolution N 1s spectra can be resolved into four individual peaks: pyridinic-N (N-6, 398.2 eV), pyrrolic-N (N-5, 399.9 eV), quaternary-N (N-Q, 401.0 eV), and pyridine-N-oxide (N-X, 402.5 eV), respectively,42 as shown in Fig. 6b, revealing that the doped nitrogen atoms are bonded within the carbon lattice, rather than dangling on the carbon surface. The pyridinic-N configuration is sp2-hybrided, which can promote the electron donor/acceptor properties of neighboring carbon atoms, such as electronic conductivity. And some studies reported that the pyridinic-N and pyrrolic-N are considered to be electrochemically active in an alkaline aqueous solution to provide main pseudocapacitance, which can increase the capacitance of porous carbon.43,44 The core-level C 1s spectrum in Fig. 6c can be deconvoluted into four peaks at around 284.6 eV, 285.5 eV, 286.4 eV, 288.5 eV, corresponding to C![[double bond, length as m-dash]](https://www.rsc.org/images/entities/char_e001.gif) C, C–N, C–O, C
C, C–N, C–O, C![[double bond, length as m-dash]](https://www.rsc.org/images/entities/char_e001.gif) O functional groups, respectively.45 The O 1s spectrum (Fig. 6d) can be resolved into three peaks with binding energies of 531.2, 532.5, and 533.7 eV, representing quinone, C
O functional groups, respectively.45 The O 1s spectrum (Fig. 6d) can be resolved into three peaks with binding energies of 531.2, 532.5, and 533.7 eV, representing quinone, C![[double bond, length as m-dash]](https://www.rsc.org/images/entities/char_e001.gif) O, C–OH, respectively.42,46 Table S2† summarizes the fitting peak areas of C 1s, N 1s and O 1s spectra for all the samples. The data reveals that the pyridinic-N and pyrrolic-N are predominant, corresponding to more than 80% of the total nitrogen atoms present in the samples after ionic liquid pyrolysis. XPS analysis reveals that after KOH activation and ionic liquid pyrolysis, the samples possess some amount of N and O species. It is worth noting that the presence of N and O elements not only improves the carbon surface affinity to electrolyte, but also may contribute additional pseudocapacitance to the total capacitance.
O, C–OH, respectively.42,46 Table S2† summarizes the fitting peak areas of C 1s, N 1s and O 1s spectra for all the samples. The data reveals that the pyridinic-N and pyrrolic-N are predominant, corresponding to more than 80% of the total nitrogen atoms present in the samples after ionic liquid pyrolysis. XPS analysis reveals that after KOH activation and ionic liquid pyrolysis, the samples possess some amount of N and O species. It is worth noting that the presence of N and O elements not only improves the carbon surface affinity to electrolyte, but also may contribute additional pseudocapacitance to the total capacitance.
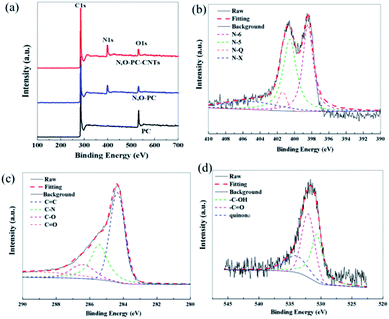 | ||
| Fig. 6 (a) XPS survey spectra of PC, N, O-PC, N, O-PC-CNTs, (b) N 1s, (c) C 1s, and (d) O 1s of N, O-PC-CNTs. | ||
Electrochemical studies
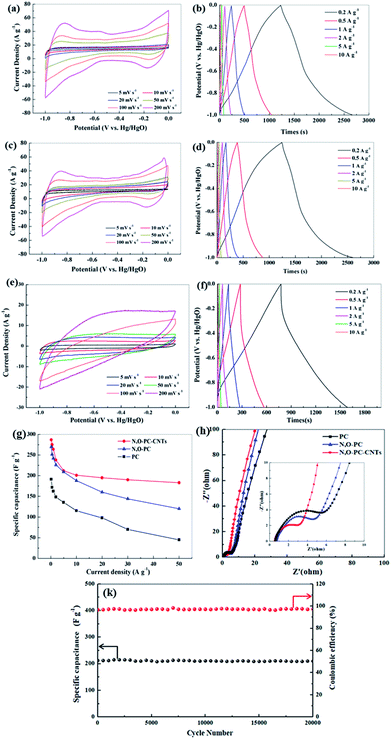
The electrochemical performance of the as-prepared samples for supercapacitors was evaluated using a three-electrode system in a 6 mol L−1 KOH electrolyte. Fig. 7a, c and e show CV curves of PC, N, O-PC and N, O-PC-CNTs electrodes at various scan rates ranging from 5 to 200 mV s−1. PC presents triangle-like CV and its current density is much lower than that of other samples, indicating the smallest capacitance. For N, O-PC and N, O-PC-CNTs, the quasirectangular CV curves with an obvious hump shape indicate a combined effect of electrical double-layer capacitance and pseudocapacitance.47 The pseudocapacitive contribution may have originated from redox reactions of the doped heteroatoms such as nitrogen and oxygen functional groups. Comparing the CV curves of all the samples, the rectangular areas significantly increase after the ionic liquid treatment, indicating the enhanced capacitances of N, O-PC and N, O-PC-CNTs; and N, O-PC-CNTs showed the highest specific capacitance. It is important to note that the CV curves of the N, O-PC-CNTs electrode maintained a good rectangular shape even at a high scan rate of 200 mV s−1, indicating rapid charge transfer and facile ion transport, which is ascribed to the hierarchical pore structure, doped heteroatoms, suitable specific surface area and a moderate degree of graphitization. Fig. 7b, d and f show GCD profiles of the as-prepared electrodes at different current densities ranging from 0.2 to 10 A g−1. The charge/discharge curves are nearly linear and symmetrical with a slight curvature, again confirming a good capacitive behavior of electrical double layer capacitance (EDLC) and little pseudo-capacitance.45 The specific capacitances are calculated from the discharge curves. The N, O-PC-CNTs electrode delivers a high specific capacitance of 287 F g−1 at 0.2 A g−1, which is much higher than that of N, O-PC (269 F g−1) and of PC (191 F g−1). More remarkably, owing to the high specific surface area, the 3D honeycomb-like hierarchical porous structure, and the effective N and O binary doping, the N, O-PC and N, O-PC-CNTs show high specific capacitances at the current densities of 1, 5, and 10 A g−1 (264, 212, 201 F g−1 for N, O-PC-CNTs, and 242, 209, 188 F g−1 for N, O-PC, respectively). However, when the current density increased form 10 A g−1 to 50 A g−1, N, O-PC and PC show a fast capacity decrease, which is attributed to the poor electronic conductivity of the porous carbon. In contrast, sample N, O-PC-CNTs exhibits excellent capacitance retention. Even at a high current density of 50 A g−1, N, O-PC-CNTs maintained specific capacitances of 183 F g−1 with a capacitance retention ratio of 64%, which is much higher than that of N, O-PC (120 F g−1 at 50 A g−1, 45% retention), and PC electrodes (45 F g−1 at 50 A g−1, 26% retention), as shown in Fig. 7g. The results indicate adding CNTs to the porous carbon can improve the electronic conductivity of the composite material, and aggregation of the CNTs. Fig. 7k reveals that the N, O-PC-CNTs show a long-term cycling stability with 98.5% of the initial capacitance retention after 20![[thin space (1/6-em)]](https://www.rsc.org/images/entities/char_2009.gif) 000 cycles at a current density of 10 A g−1.
000 cycles at a current density of 10 A g−1.
It is well known that CNTs have low specific capacitance. Moreover, increasing the CNT content in samples sacrifices its dispersion in aqueous solution due to the strong Van de Waals forces.48 The electrochemical performance of the CNTs and IL-CNTs for supercapacitors was evaluated using a three-electrode system in a 6 mol L−1 KOH electrolyte. As shown in Fig. S2a and c,† the sample of CNTs presents a triangle-like CV and its current density is lower than that of samples of IL-CNTs, indicative of smaller capacitance. For IL-CNTs, the quasirectangular CV curve with an obvious hump shape indicates a combined effect of electrical double-layer capacitance and pseudocapacitance. Fig. S2b and d† shows GCD profiles of the CNTs and IL-CNTs electrodes at current densities going from 0.2 to 10 A g−1. The IL-CNTs electrode delivers a specific capacitance of 231, 226, 211, 200, 195, 185, 185, 179, 173 F g−1 at 0.2, 0.5, 1, 2, 5, 10, 20, 30, 50 A g−1, respectively. The CNTs electrode delivers a specific capacitance of 196.2, 191.5, 183.8, 164.8, 163, 141, 137, 133, 130 F g−1 at 0.2, 0.5, 1, 2, 5, 10, 20, 30, 50 A g−1, respectively. IL-CNTs have higher specific capacitances compared with CNTs, due to pseudocapacitance effect. The capacitance of CNTs decreases slowly compared with PC and N, O-PC, especially at higher current densities. This indicated the high conductivity of carbon nanotubes could improve the rate performance of the electrode. But the addition of too many carbon nanotubes will inevitably lead to a decrease in the capacitance. Fig. S3† showed the electrochemical performance of the N, O-PC-CNTs-5% and N, O-PC-CNTs-10%, and N, O-PC-CNTs-20%. The results indicate that the composite exhibits an excellent electrochemical performance with 10 wt% CNTs. Therefore, 10 wt% CNTs is sufficient to serve the purpose of improving the electronic conductivity of the composite electrode.
To further investigate the electrochemical properties of the as-prepared samples, the EIS has been measured, and the Nyquist plots are displayed in Fig. 7h and S2f.† All the impedance spectra show a semicircle from medium to high frequency and a sloped line at the low-frequency region. The nearly vertical plot in the low-frequency region for all the electrodes indicates ideal capacitive behavior, benefiting from the 3D hierarchical pore structure. A semicircle located at high-to-medium frequency region is associated with the charge transfer impedance,49 the smallest semicircular diameter suggests that N, O-PC-CNTs sample has good electrical conductivity, which is beneficial for the capacitive performance. This is consistent with the CV and charge/discharge test results. The Nyquist plots (Fig S2f†) show that N, O-PC-CNTs, CNTs and IL-CNTs have smaller semicircular diameter suggesting that CNTs play an important role in improving electrode conductivity. For N, O-PC-CNTs, the high specific surface area of 2164 m2 g−1 provides sufficient electrode–electrolyte interface for high charge capacity and 3D hierarchical porous structure (the amounts of mesopores) benefit the retention and immersion of the electrolyte, providing convenient channels for ion transportation. The rich N, O-containing functional groups introduce pseudocapacitance in the sample. Meanwhile, CNTs provide high conductivity. Therefore, when compared with reported carbon electrodes as illustrated in Table S3,† N, O-PC-CNTs electrode shows superb specific capacitance.
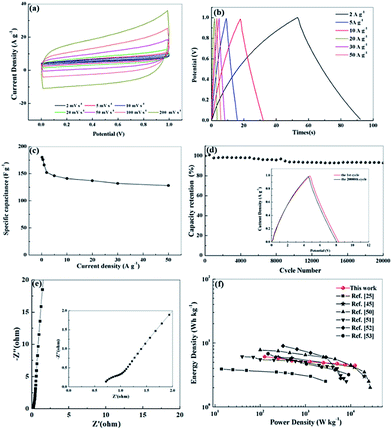
We further investigated the electrochemical performance of N, O-PC-CNTs in a two-electrode system with 6 mol L−1 KOH electrolyte. Fig. 8 a exhibits the CV curves of N, O-PC-CNTs at various scan rates. The CV curves maintain a good rectangular shape from 2 to 200 mV s−1, confirming that the N, O-PC-CNTs supercapacitors have the characteristics of an ideal electrochemical capacitor. Even at a high scan rate of 200 mV s−1, the rectangular shape still remains intact with a little change. Furthermore, the triangular charge discharge curves (Fig. 8b) also exhibit typical electrochemical capacitor behavior and an excellent rate performance of N, O-PC-CNTs in the fabricated symmetrical supercapacitor over a wide range of current density. The N, O-PC-CNTs exhibit a specific capacitance of 176 F g−1 at 0.5 A g−1, and with the current densities increasing from 0.5 to 50 A g−1, the capacitance retention still keeps at 73% (Fig. 8c). In addition, the N, O-PC-CNTs electrode displays a minor capacitance loss and a high retention of 95% is noted after 20![[thin space (1/6-em)]](https://www.rsc.org/images/entities/char_2009.gif) 000 cycles at a current density of 20 A g−1, demonstrating an outstanding long-term cycling stability (Fig. 8d). The charge/discharge curves of the N, O-PC-CNTs electrode before and after the 20
000 cycles at a current density of 20 A g−1, demonstrating an outstanding long-term cycling stability (Fig. 8d). The charge/discharge curves of the N, O-PC-CNTs electrode before and after the 20![[thin space (1/6-em)]](https://www.rsc.org/images/entities/char_2009.gif) 000th cycle exhibit similar profiles with little change, again indicating the excellent cycle life (inset of Fig. 8d). In addition, the Nyquist plot of N, O-PC-CNTs electrode for the KOH-based supercapacitor (Fig. 8e) shows a short intersection and a small semicircle radius, indicating that N, O-PC-CNTs have good electrode conductivity, fast electron transfer rate and good electrolyte ions diffusion ability. Fig. 8f shows the Ragone plots of the N, O-PC-CNTs. The energy density of N, O-PC-CNTs supercapacitor is 5.3 W h kg−1 at a power density of 500 W kg−1. In contrast, an energy density of 4.5 W h kg−1 is still retained even when the power density was increased to 12.5 kW kg−1, which shows an enhanced rate performance among porous materials reported in literature.25,45,50–53
000th cycle exhibit similar profiles with little change, again indicating the excellent cycle life (inset of Fig. 8d). In addition, the Nyquist plot of N, O-PC-CNTs electrode for the KOH-based supercapacitor (Fig. 8e) shows a short intersection and a small semicircle radius, indicating that N, O-PC-CNTs have good electrode conductivity, fast electron transfer rate and good electrolyte ions diffusion ability. Fig. 8f shows the Ragone plots of the N, O-PC-CNTs. The energy density of N, O-PC-CNTs supercapacitor is 5.3 W h kg−1 at a power density of 500 W kg−1. In contrast, an energy density of 4.5 W h kg−1 is still retained even when the power density was increased to 12.5 kW kg−1, which shows an enhanced rate performance among porous materials reported in literature.25,45,50–53
CO2 adsorption
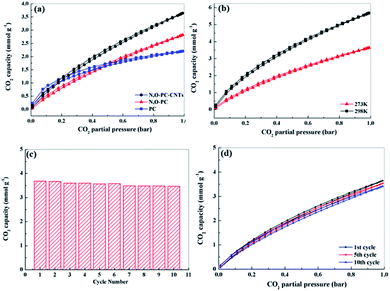
Well-developed hierarchical porous structure and high surface area are the main characteristics responsible for the enhancement of electrochemical performance of porous carbon materials. These key features are also of great importance in the applications for CO2 adsorption. Moreover, porous carbon materials with functionalities (such as N-functionalities, especially pyridine-N) could facilitate the CO2 uptake, being of great importance for alleviating greenhouse effect.54 Thus, we investigated CO2 adsorption capacities of the as-prepared samples. Fig. 9a shows CO2 adsorption isotherms at 298 K under pressure up to 1 bar. The CO2 adsorption capacity of N, O-PC-CNTs is 3.7 mmol g−1 at 298 K and 1 bar pressure, higher than that of N, O-PC (2.8 mmol g−1) and that of PC (2.4 mmol g−1). Although PC has the highest specific surface area (3253 m2 g−1), it performs the lowest performance property in CO2 adsorption. This can be ascribed to the unreasonable pore size distribution. In general, micropores are responsible for enhancing CO2 capacity, meso-, and macropore structures are suitable for the transportation and diffusion of CO2 molecules but their contribution to the total amount of adsorption is relatively small. PC has effective pores for CO2 adsorption, but increased number of micropores will hinder the diffusion of gas molecules; not all the micropores in the porous carbon are effectively utilized by CO2 molecule. Fig. S4† shows the CO2 adsorption isotherms of CNTs and ILCNTs at 298 K under pressure up to 1 bar. Due to low pore volume and micropores, CNTs and IL-CNTs show poor CO2 uptake performance. The CO2 adsorption capacity of CNTs and IL-CNTs is 0.51 and 1.0 mmol g−1 at 298 K and 1 bar, respectively, which is much lower than that of N, O-PC-CNTs. The CO2 sorption by N, O-PC-CNTs up to 1 bar pressure at a temperature of 273 K was also investigated as shown in Fig. 9b. The adsorption of CO2 at 273 K and 1 bar on N, O-PC-CNTs is 5.7 mmol g−1. The higher adsorption with a lower temperature is widely described in the literature.34,55,56 This is attributed to physisorption that takes place between CO2 and porous carbon, where van der Waals forces play as the main molecular forces. They are stronger at low temperature and become weaker as the temperature increases. Fig. 9c shows the cycle stability of N, O-PC-CNTs as a CO2 sorbent. The sample of N, O-PC-CNTs shows 94% retention of the initial CO2 adsorption capacity at 298 K over 10 cycles. Fig. 9d presents 1st, 5th, 10th, adsorption isotherms. No obvious changes in the CO2 adsorption after the 10th cycle were observed because of the highly developed microporous structure and 3D hierarchical porous structure which provide effective sites for CO2 adsorption and convenient channels for gas molecular diffusion. Meanwhile, nitrogen species formed through the mechanisms of base–acid reaction and hydrogen bonds interaction improved the CO2 uptake amount into the sample. Compared with the reported porous carbon materials illustrated in Table S4,† N, O-PC-CNTs show an enhanced CO2 uptake capacity. The results indicate that N, O-PC-CNTs is a stable CO2 sorbent and it can be regenerated during post-combustion capture without losing the CO2 sorption capacity.The enhanced supercapacitor and CO2 sorption performance of N, O-PC-CNTs are due to the collaboration of structural characteristics and heteroatoms doping. First, the high surface area and rational pore size distribution (macro-, meso-, micro-porous hierarchically porous structure) can provide a good amount of surface storage sites, faster ion (gas molecule) transfer and better target absorption. Second, the N-doping and oxygen-containing groups could improve the surface wettability and electrical conductivity, offering minimized diffusive resistance, and generate considerable pseudocapacitance. For CO2 capture, the N-doping basic functional surface can enhance adsorption potentials and increase CO2 affinity, due to the overlapping of potential fields from the neighboring walls. Third, the 3D architecture reduces the ion (gas molecule) diffusion distance and promotes rapid ion (gas molecule) transfer into the internal pore sites, which can result in excellent long-term cycle stability. Moreover, the CNTs improve the electronic conductivity and graphitize the composite electrode. It can also provide N, O-PC-CNTs electrode with an enhanced rate performance when combined with a 3D honeycomb-like hierarchical porous structure. Lastly, the 3D hierarchical porous structure, N, O-doping, and CNTs have favorable multiple synergistic effects, interactions and easy transportation to improve the N, O-PC-CNT material performance for supercapacitor and CO2 capture applications.
Conclusions
In summary, we report a facile and scalable synthesis of N, O-PC-CNTs material from low-rank coals, using chemical activation, and ionic liquid annealing. N, O-PC-CNTs with high surface area, proper pore size, honeycomb-like morphology and high N/O content presented excellent performance as a supercapacitor electrode and CO2 adsorbent. N, O-PC-CNTs exhibited a high specific capacitance of 287 F g−1 at a current density of 0.2 A g−1, and a high rate capability (70% and 64% capacitance retention at 10 and 50 A g−1, respectively) as a part of a three electrode system prepared in 6 mol L−1 KOH aqueous electrolyte. Furthermore, an energy density of 5.3 W h kg−1 was obtained at a power density of 500 W kg−1 for a N, O-PC-CNT symmetric supercapacitor in 6 mol L−1 KOH electrolyte, whereas the energy density remained at 4.5 W h kg−1 even when the power density increased to 12.5 kW kg−1. Furthermore, the symmetric supercapacitor showed excellent cycling stability with 95% capacitance retention after 20![[thin space (1/6-em)]](https://www.rsc.org/images/entities/char_2009.gif) 000 cycles at a current density of 20 A g−1. Furthermore, due to their hierarchical porous structure, 3D morphology and heteroatom doping, N, O-PC-CNTs exhibited a high CO2 uptake of 5.7 and 3.7 mmol g−1 at 1 bar at 273 and 298 K, respectively. Moreover, N, O-PC-CNTs showed cycling stability with 94% retention of the initial CO2 adsorption capacity at 298 K over 10 cycles. This method would open up a new avenue to synthesize functional porous carbon materials derived from coal with potential applications in supercapacitors and CO2 capture.
000 cycles at a current density of 20 A g−1. Furthermore, due to their hierarchical porous structure, 3D morphology and heteroatom doping, N, O-PC-CNTs exhibited a high CO2 uptake of 5.7 and 3.7 mmol g−1 at 1 bar at 273 and 298 K, respectively. Moreover, N, O-PC-CNTs showed cycling stability with 94% retention of the initial CO2 adsorption capacity at 298 K over 10 cycles. This method would open up a new avenue to synthesize functional porous carbon materials derived from coal with potential applications in supercapacitors and CO2 capture.
Conflicts of interest
There are no conflicts to declare.Acknowledgements
The authors thank the Natural Science Foundation of Ningxia Province (No. 2018AAC03022), the Key Research and Development Program of Ningxia Province of China (No. 2018BEE03012), the National First-rate Discipline Construction Project of Ningxia (Chemical Engineering & Technology, NXYLXK2017A04).Notes and references
- M. M. Titirici, R. J. White, C. Falco and M. Sevilla, Energy Environ. Sci., 2012, 5, 6796–6822 RSC.
- X. H. Lu, M. H. Yu, G. M. Wang, Y. X. Tong and Y. Li, Energy Environ. Sci., 2014, 7, 2160–2181 RSC.
- Y. W. Zhu, S. Murali, M. D. Stoller, K. J. Ganesh, W. W. Cai, P. J. Ferreira, A. Pirkle, R. M. Wallace, K. A. Cychosz, M. Thommes, D. Su, E. A. Stach and R. S. Ruoff, Science, 2011, 332, 1537–1541 CrossRef CAS PubMed.
- C. Merlet, B. Rotenberg, P. A. Madden, P. L. Taberna, P. Simon, Y. Gogotsi and M. Salanne, Nat. Mater., 2012, 11, 306–310 CrossRef CAS PubMed.
- Z. Ling, Z. Y. Wang, M. D. Zhang, C. Yu, G. Wang, Y. F. Dong, S. H. Liu, Y. W. Wang and J. S. Qiu, Adv. Funct. Mater., 2016, 26, 111–119 CrossRef CAS.
- H. Jiang, P. S. Lee and C. Z. Li, Energy Environ. Sci., 2013, 6, 41–53 RSC.
- E. S. Sanz-Perez, C. R. Murdock, S. A. Didas and C. W. Jones, Chem. Rev., 2016, 116, 11840–11876 CrossRef CAS PubMed.
- M. G. Plaza, S. Garcia, F. Rubiera, J. J. Pis and C. Pevida, Chem. Eng. J., 2010, 163, 41–47 CrossRef CAS.
- X. Yang, M. Yu, Y. Zhao, C. Zhang, X. Y. Wang and J. X. Jiang, J. Mater. Chem. A, 2014, 2, 15139–15145 RSC.
- J. J. Manya, B. Gonzalez, M. Azuara and G. Arner, Chem. Eng. J., 2018, 345, 631–639 CrossRef CAS.
- Z. L. Zhu, H. B. Zuo, S. J. Li, J. G. Tu, W. Guan, W. L. Song, J. Zhao, D. H. Tian and S. Q. Jiao, J. Mater. Chem. A, 2019, 7, 7533–7540 RSC.
- K. Jurewicz, R. Pietrzak, P. Nowicki and H. Wachowsk, Electrochim. Acta, 2008, 53, 5469–5475 CrossRef CAS.
- G. Gryglewicz, J. Machnikowski, E. Lorenc-Grabowska, G. Lota and E. Frackowiak, Electrochim. Acta, 2005, 50, 1197–1206 CrossRef CAS.
- J. H. Hou, C. B. Cao, F. Idrees and X. L. Ma, ACS Nano, 2015, 9, 2556–2564 CrossRef CAS PubMed.
- L. J. Xie, G. H. Sun, F. Y. Su, X. Q. Guo, Q. Q. Kong, X. M. Li, X. H. Huang, L. Wan, W. Song, K. X. Li, C. X. Lv and C. M. Chen, J. Mater. Chem. A, 2016, 4, 1637–1646 RSC.
- C. Zhang, R. Kong, X. Wang, Y. F. Xu, F. Wang, W. F. Ren, Y. H. Wang, F. B. Su and J. X. Jiang, Carbon, 2017, 114, 608–618 CrossRef CAS.
- M. G. Hahm, A. L. M. Reddy, D. P. Cole, M. Rivera, J. A. Vento, J. Nam, H. Y. Jung, Y. L. Kim, N. T. Narayanan, D. P. Hashim, C. Galande, Y. J. Jung, M. Bundy, S. Karna, P. M. Ajayan and R. Vajtai, Nano Lett., 2012, 12, 5616–5621 CrossRef CAS PubMed.
- D. T. Wang, K. Wang, L. Sun, H. C. Wu, J. Wang, Y. X. Zhao, L. J. Yan, Y. F. Luo, K. L. Jiang, Q. Q. Li, S. S. Fan, J. Li and J. P. Wang, Carbon, 2018, 139, 145–155 CrossRef CAS.
- J. Hao, L. Pan, H. C. Zhang, C. X. Chi, Q. J. Guo, J. P. Zhao, Y. Yang, X. X. Liu, X. X. Ma and Y. Li, Chem. Eng. J., 2018, 346, 427–437 CrossRef CAS.
- X. Y. Hou, T. Peng, J. B. Cheng, Q. H. Yu, R. J. Luo, Y. Lu, X. M. Liu, J. K. Kim, J. He and Y. S. Luo, Nano Res., 2017, 10, 2570–2583 CrossRef CAS.
- B. Brown, B. Swain, J. Hiltwine, D. B. Brooks and Z. G. Zhou, J. Power Sources, 2014, 272, 979–986 CrossRef CAS.
- Y. Z. Wang, Y. Wang, Y. Y. Liu, A. Ohuchi and X. M. Wang, Nano, 2015, 10, 1550068 CrossRef CAS.
- W. W. Zhou, Y. Du, J. J. Zeng, F. Liu and Y. M. Zhu, Nanoscale, 2019, 11, 7624–7633 RSC.
- L. Miao, D. Z. Zhu, M. X. Liu, H. Duan, Z. W. Wang, Y. K. Lv, W. Xiong, Q. J. Zhu, L. C. Li, X. L. Chai and L. H. Gan, Chem. Eng. J., 2018, 347, 233–242 CrossRef CAS.
- Y. M. Lian, M. Ni, Z. H. Huang, R. J. Chen, L. Zhou, W. Utetiwabo and W. Yang, Chem. Eng. J., 2019, 366, 313–320 CrossRef CAS.
- H. M. Wei, W. Qian, N. Fu, H. J. Chen, J. B. Liu, X. Z. Jiang, G. X. Lan, H. L. Lin and S. Han, J. Mater. Sci., 2017, 52, 10308–10320 CrossRef CAS.
- J. Wang, P. X. Zhang, L. Liu, Y. Zhang, J. F. Yang, Z. L. Zeng and S. G. Deng, Chem. Eng. J., 2018, 348, 57–66 CrossRef CAS.
- K. L. Liu, X. W. Zheng, K. K. Wang, C. Y. Wang and M. M. Chen, Carbon, 2019, 153, 265–273 CrossRef CAS.
- J. Hao, Y. X. Wang, C. X. Chi, J. Wang, Q. J. Guo, Y. Yang, Y. Li, X. X. Liu and J. P. Zhao, Sustainable Energy Fuels, 2018, 2, 2358–2365 RSC.
- J. W. F. To, J. J. He, J. G. Mei, R. Haghpanah, Z. Chen, T. Kurosawa, S. C. Chen, W. G. Bae, L. J. Pan, J. B. H. Tok, J. Wilcox and Z. N. Bao, J. Am. Chem. Soc., 2016, 138, 1001–1009 CrossRef CAS PubMed.
- Z. X. Pei, H. F. Li, Y. Huang, Q. Xue, Y. Huang, M. S. Zhu, Z. F. Wang and C. Y. Zhi, Energy Environ. Sci., 2017, 10, 742–749 RSC.
- J. S. Lee, X. Q. Wang, H. M. Luo and S. Dai, Adv. Mater., 2010, 22, 1004–1007 CrossRef CAS PubMed.
- Y. J. Ko, H. G. Kim, M. G. Seid, K. Cho, J. W. Choi, W. S. Lee and S. W. Hong, ACS Sustainable Chem. Eng., 2018, 6, 14857–14865 CrossRef CAS.
- J. Serafin, M. Baca, M. Biegun, E. Mijowska, R. J. Kalenczuk, J. Srenscek-Nazzar and B. Michalkiewicz, Appl. Surf. Sci., 2019, 497, 143722 CrossRef.
- M. N. Patel, X. Q. Wang, D. A. Slanac, D. A. Ferrer, S. Dai, K. P. Johnston and K. J. Stevenson, J. Mater. Chem., 2012, 22, 3160–3169 RSC.
- Y. J. Kang, S. J. Chun, S. S. Lee, B. Y. Kim, J. H. Kim, H. Chung, S. Y. Lee and W. Kim, ACS Nano, 2012, 6, 6400–6406 CrossRef CAS PubMed.
- L. Yao, Q. Wu, P. X. Zhang, J. M. Zhang, D. R. Wang, Y. L. Li, X. Z. Ren, H. W. Mi, L. B. Deng and Z. J. Zheng, Adv. Mater., 2018, 30, 1706054 CrossRef PubMed.
- H. B. Feng, H. Hu, H. W. Dong, Y. Xiao, Y. J. Cai, B. F. Lei, Y. L. Liu and M. T. Zheng, J. Power Sources, 2016, 302, 164–173 CrossRef CAS.
- R. Andrews, D. Jacques, D. Qian and E. C. Dickey, Carbon, 2001, 39, 1681–1687 CrossRef CAS.
- M. Y. Song, Y. H. Zhou, X. Ren, J. F. Wan, Y. Y. Du, G. Wu and F. W. Ma, J. Colloid Interface Sci., 2019, 535, 276–286 CrossRef CAS PubMed.
- N. Shimodaira and A. Masui, J. Appl. Phys., 2002, 92, 902–909 CrossRef CAS.
- J. G. Wang, H. Z. Liu, H. H. Sun, W. Hua, H. W. Wang, X. R. Liu and B. Q. Wei, Carbon, 2018, 127, 85–92 CrossRef CAS.
- B. Liu, Y. J. Liu, H. B. Chen, M. Yang and H. M. Li, J. Power Sources, 2017, 341, 309–317 CrossRef CAS.
- G. Y. Zhao, C. Chen, D. F. Yu, L. Sun, C. H. Yang, H. Zhang, Y. Sun, F. Besenbacher and M. Yu, Nano Energy, 2018, 47, 547–555 CrossRef CAS.
- Y. Q. Zhao, M. Lu, P. Y. Tao, Y. J. Zhang, X. T. Gong, Z. Yang, G. Q. Zhang and H. L. Li, J. Power Sources, 2016, 307, 391–400 CrossRef CAS.
- J. Zhao, Y. J. Li, G. L. Wang, T. Wei, Z. Liu, K. Cheng, K. Ye, K. Zhu, D. X. Cao and Z. J. Fan, J. Mater. Chem. A, 2017, 5, 23085–23093 RSC.
- L. Qie, W. M. Chen, H. H. Xu, X. Q. Xiong, Y. Jiang, F. Zou, X. L. Hu, Y. Xin, Z. L. Zhang and Y. H. Huang, Energy Environ. Sci., 2013, 6, 2497–2504 RSC.
- X. Li, Y. Tang, J. H. Song, W. Yang, M. S. Wang, C. Z. Zhu, W. G. Zhao, J. M. Zheng and Y. H. Lin, Carbon, 2018, 129, 236–244 CrossRef CAS.
- J. Zhao, Y. F. Jiang, H. Fan, M. Liu, O. Zhuo, X. Z. Wang, Q. Wu, L. J. Yang, Y. W. Ma and Z. Hu, Adv. Mater., 2017, 254, 1604569 CrossRef PubMed.
- L. F. Chen, Z. H. Huang, H. W. Liang, H. L. Gao and S. H. Yu, Adv. Funct. Mater., 2014, 24, 5104–5111 CrossRef CAS.
- X. J. He, H. Ma, J. X. Wang, Y. Y. Xie, N. Xiao and J. S. Qiu, J. Power Sources, 2017, 357, 41–46 CrossRef CAS.
- J. T. Li, R. Xiao, M. Li, H. Y. Zhang, S. L. Wu and C. L. Xia, Fuel Process. Technol., 2019, 192, 239–249 CrossRef CAS.
- W. Yang, W. Yang, L. N. Kong, A. L. Song, X. J. Qin and G. J. Shao, Carbon, 2018, 127, 557–567 CrossRef CAS.
- Y. Wu, J. X. Wang, Y. Muhammad, S. Subhan, Y. B. Zhang, Y. Ling, J. Li, Z. X. Zhao and Z. X. Zhao, Chem. Eng. J., 2018, 349, 92–100 CrossRef CAS.
- G. Srinivas, V. Krungleviciute, Z. X. Guo and T. Yildirim, Energy Environ. Sci., 2014, 7, 335–342 RSC.
- A. E. Creamer and B. Gao, Environ. Sci. Technol., 2016, 50, 7276–7289 CrossRef CAS PubMed.
Footnote |
| † Electronic supplementary information (ESI) available: XPS dates, the comparison of electrochemical performance of N, O-PC-CNTs samples (CNTs from 5–10%), CNTs and IL-CNTs, the CO2 uptake performance of CNTs and IL-CNTs, and comparision of the supercapacitor performance and CO2 uptake performance of porous carbons in the literature. See DOI: 10.1039/c9na00761j |
| This journal is © The Royal Society of Chemistry 2020 |

