 Open Access Article
Effects of surface tension time-evolution for CCN activation of a complex organic surfactant†
Jack J.
Lin
 a,
Thomas B.
Kristensen
b,
Silvia M.
Calderón
 a,
Jussi
Malila
 a and
Nønne L.
Prisle
 *a
*a
aNano and Molecular Systems Research Unit, University of Oulu, P. O. Box 3000, Oulu, FI-90014, Finland. E-mail: nonne.prisle@oulu.fi
bLund University, Division of Nuclear Physics, S-22100 Lund, Sweden
First published on 20th December 2019
Abstract
The physical processes and time scales underlying the evolution of surface tension in atmospheric solution droplets are largely unaccounted for in present models describing cloud droplet formation. Adsorption of surface-active molecules at the surface of a solution droplet depresses the droplet surface tension but also depletes solute from the droplet bulk, which have opposing and sometimes canceling effects in cloud droplet formation. In this work, we study the effect of time-evolving surface tension for cloud droplet activation of particles composed of Nordic Aquatic Fulvic Acid (NAFA) mixed with sodium chloride (NaCl). We model the formation of cloud droplets using Köhler theory with surface tension depression and bulk/surface partitioning evaluated from two different thermodynamic surface models. Continuous ternary parameterizations were constructed from surface tension measurements of macroscopic droplets at different time steps after the formation of a droplet surface. The predicted results are compared to previous measurements of mixed NAFA–NaCl cloud condensation nuclei (CCN) activity and a bulk solution model that does not take the NAFA bulk/surface partitioning equilibrium into account. Whereas the bulk model shows a trend in cloud droplet formation following that of macroscopic surface tension depression with time, the variation with time essentially disappears when bulk/surface partitioning is taken explicitly into account during droplet activation. For all equilibrium time steps considered, the effect of surface tension depression in the NAFA–NaCl system is counteracted by the depletion of solute from the finite-sized droplet bulk phase. Our study highlights that a comprehensive data set is necessary to obtain continuous parameterizations of surface tension and other solution properties required to fully account for the bulk/surface partitioning in growing droplets. To our knowledge, no similar data set currently exists for other aqueous organic systems of atmospheric interest. Additional work is necessary to deconvolve the effects of bulk/surface partitioning in the context of time-evolution on cloud droplet activation and to determine whether the results presented here can be further generalized.
Environmental significanceThe time-evolution of aqueous surface tension is a well-known result of partitioning of surface-active compounds from the bulk to the surface. Surfactants are ubiquitous components of atmospheric organic aerosol. Equilibration time scales potentially impact interpretation of all measurements of cloud condensation nuclei (CCN) activity and modeled effects taking surface tension into account, including closure studies between instruments with different residence times and analysis using κ-Köhler theory. Using continuous surface tension parameterizations at different times, we provide a thermodynamically consistent analysis of the impact of time-dependency for predictions of CCN activity. We show that although time-evolution is clearly seen in surface partitioning, its signature decreases in droplet surface tension and we find no trends in CCN activity with time. |
1 Introduction
It is well-known that surface tension is an important parameter in the activation of aerosol particles into cloud droplets and that surface-active organic species can contribute to the depression of surface tension compared to that of pure water.1–6 It is also well-established that surface tension equilibrium can take a long time to be achieved and may involve several dynamic stages, such as reorganization and phase transitions in the surface layer following the initial surface adsorption.7–11 Such dynamic effects are currently not accounted for in atmospheric cloud and droplet models. Typically it is assumed that the droplets are so small that diffusion time scales are much shorter than the time scales for droplet growth and activation.12–14 Any reorganization of molecules or phase transitions – which are concentration-dependent – that may occur after the establishment of a surface layer have to our knowledge so far not been considered.When surface-active molecules adsorb and accumulate in the surface region of a solution, a distinct surface phase is formed, with a composition enriched in the surface-active species (surfactant). Surface-active refers exactly to the enhanced activity, or effective concentration, of the species in the surface. In macroscopic systems, the surface enrichment of a given species has negligible effect on the composition of the bulk phase, because the relative size of the surface to the bulk phase is vanishing (nbi = nti − nsi ≈ nti, where n{b,t,s}i are the bulk, total, and surface molar number concentrations of a surface-active species i, respectively). In finite-sized systems, such as the submicron droplets involved in cloud droplet activation, the surface can on the other hand comprise a significant fraction of the whole solution. For example, for a spherical solution, the surface area (A) to bulk volume (V) ratio scales as A/V = 6/d, where the diameter d is the characteristic dimension of the system.15 In a macroscopic droplet with diameter 1 mm, A/V = 6000 m−1, whereas in micron-sized activating cloud droplets, this ratio is several orders of magnitude larger. For 1 μm droplets, A/V = 6 × 10⁶ m−1. Surface adsorption may therefore lead to significant depletion of solute from the bulk phase (nbi = nti − nsi < nti).15 The distribution of surface-active species between the distinct bulk and surface phases of a solution is referred to as bulk/surface partitioning.
The effect of bulk/surface partitioning is critical to estimating composition-dependent properties of finite-sized systems, where solution properties typically cannot be measured directly. For example, although surface tension on the molecular level is reduced by the adsorption of surface-active species in the surface, the specific relation between surface tension and surface composition is typically unknown.16,17 The response in surface tension is therefore instead related to variations in the bulk composition via the gradient between bulk and surface compositions. For macroscopic solutions, this relation is readily established, because the bulk composition is practically identical to the total composition. For microscopic droplets, the surface partitioning and concurrent depletion of surfactant molecules from the solution bulk can be significant. The key to using surface tension–composition relations from measurements on macroscopic solutions for evaluating surface tension of microscopic droplets is therefore to first correct the bulk concentration for the fraction of surface adsorbed material, which is achieved with a partitioning model.15,18 Since surface tension is typically a decreasing function of surfactant (bulk) concentration, the result is that surface tensions of microscopic droplets are higher than for macroscopic solutions with the exact same total compositions (σmicro(xbmicro) > σmacro(xbmacro), where xbmicro and xbmacro are the bulk concentrations of a surface-active species in microscopic and macroscopic solutions, respectively, of the same total concentration xtmicro = xtmacro). This is illustrated in Fig. 1. Here, σw is the surface tension of pure water, corresponding to an aqueous solution with vanishing surfactant concentration.
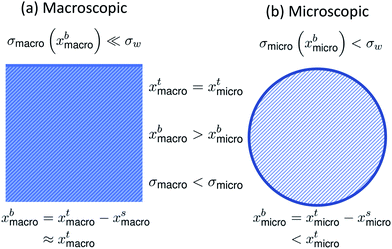 | ||
| Fig. 1 A schematic summarizing the difference in bulk concentration and surface tension for (a) macroscopic systems and (b) microscopic systems of the same total concentration. | ||
Including bulk/surface partitioning of surface-active aerosol components to the cloud condensation nuclei (CCN) activation framework has two effects due to the finite size of submicron solution droplets: (1) it significantly changes the droplet bulk concentration, which is used to evaluate the surface tension from macroscopic isotherms, and (2) in the cases of mixtures involving both surface-active and non-surface-active solutes, partitioning changes the relative solute composition in both surface and bulk phases from the nominal.15,18–20 The presence of surfactants can therefore have opposing effects on aerosol activation into cloud droplets in the framework of Köhler theory. While the depression of droplet surface tension by surface-active solute is expected to increase CCN activity via the Kelvin effect, the depletion of solute from the bulk will also decrease CCN activity via the Raoult effect. Furthermore, the surface tension decrease may be much smaller than indicated by the total concentration of surface-active material in the droplet.15,18–20 Therefore, continuous parameterizations of solution properties, such as surface tension, that encompass independent variations in all solution components are necessary to comprehensively account for these effects as droplets grow and both composition and surface to volume ratio changes.
Here, we investigate the effect of time-evolving surface tension as a surface-active component adsorbs in the surface of activating cloud droplets. To this effect, we measured time-dependent surface tension as a function of concentration for mixtures of Nordic Aquatic Fulvic Acid (NAFA) and sodium chloride (NaCl) at different mixing ratios spanning the full dry solute composition range from pure NAFA to pure NaCl. These measurements are used to generate continuous three-dimensional surface tension isotherms following previously established routines14 which are implemented to two different Köhler models including bulk/surface partitioning.15,18 This allows us to systematically evaluate the impact of surface tension time-dependence from diffusion/adsorption and possibly reorientation on the growth curves (although we do not directly establish the underlying causes of the change) and predict CCN activation of mixed surfactant–salt particles of atmospheric relevance.14,21 Our aim is to investigate the potential magnitude of such dynamic effects using NAFA, a model humic-like substance (HULIS), as a highly surface-active complex organic aerosol proxy.12,22,23 With the large estimated mean molecular mass of NAFA, we aim to maximize any potential effects of time-dependence to obtain the best possible resolution of such dependencies. We evaluate the significance for predicted CCN activity of assuming instantaneous surface tension equilibrium in growing droplets containing surface-active organic aerosol, as is typically done in both Köhler and cloud microphysics frameworks.21,24 For this analysis, we use a new, mass-based formulation14 of the traditional Gibbs adsorption partitioning model15 as well as the recently presented monolayer partitioning model of Malila and Prisle.18 Both models allow thermodynamically consistent evaluation of partitioning of complex molecules with unknown molecular mass and identity, by relying on a mass-based surface tension and water activity framework.14 Results of predicted CCN activity are compared to the previously measured values presented by Kristensen et al.21
2 Methods
2.1 Experimental
Surface tension measurements were carried out with four separate NAFA samples (1R105F) purchased from the International Humic Substances Society (IMSS) and NaCl (>99.5%, Sigma-Aldrich). Aqueous solutions containing NAFA![[thin space (1/6-em)]](https://www.rsc.org/images/entities/char_2009.gif) :
:![[thin space (1/6-em)]](https://www.rsc.org/images/entities/char_2009.gif) NaCl mass mixing ratios of 100
NaCl mass mixing ratios of 100![[thin space (1/6-em)]](https://www.rsc.org/images/entities/char_2009.gif) :
:![[thin space (1/6-em)]](https://www.rsc.org/images/entities/char_2009.gif) 0, 80
0, 80![[thin space (1/6-em)]](https://www.rsc.org/images/entities/char_2009.gif) :
:![[thin space (1/6-em)]](https://www.rsc.org/images/entities/char_2009.gif) 20, 50
20, 50![[thin space (1/6-em)]](https://www.rsc.org/images/entities/char_2009.gif) :
:![[thin space (1/6-em)]](https://www.rsc.org/images/entities/char_2009.gif) 50, 20
50, 20![[thin space (1/6-em)]](https://www.rsc.org/images/entities/char_2009.gif) :
:![[thin space (1/6-em)]](https://www.rsc.org/images/entities/char_2009.gif) 80, and 0
80, and 0![[thin space (1/6-em)]](https://www.rsc.org/images/entities/char_2009.gif) :
:![[thin space (1/6-em)]](https://www.rsc.org/images/entities/char_2009.gif) 100 were prepared with purified and de-ionized water. For each of the five stock solutions, 8–9 solutions were prepared with concentrations spanning about two orders of magnitude from 0.1 to 10 g L−1 in order to facilitate the parameterization of surface tension over a range of concentrations for both NAFA and NaCl independently. The surface tension of the solutions was measured with an FTA125 (First Ten Ångströms) pendant drop tensiometer at a temperature of about 22 °C (room temperature) as described in previous studies.21,25,26 The droplets produced during the surface tension measurements are of order 1 mm in size and therefore represent macroscopic systems. To capture the time-evolution of the droplet solution surface tension, multiple surface tension measurements were made on a single solution droplet for different times starting from the initial droplet formation up to 1100 s. Each data point is an average of 43 measurements made in rapid succession. Since we are not able to control the exact time step between each measurement, the measured data are presented for comparable times 0, 200, 400, 600, 800, and 1000 s after droplet formation by interpolation from the measured data points, to facilitate the comparison of measurements across different solution droplets. The first possible measurements designated at a time of t = 0 s in this study were typically carried out 5–10 seconds after the droplet had been created. It was not possible to control the relative humidity in the experimental set up, so the surface tensions measured after longer droplet lifetimes may be biased somewhat low due to increased concentration from evaporation.
100 were prepared with purified and de-ionized water. For each of the five stock solutions, 8–9 solutions were prepared with concentrations spanning about two orders of magnitude from 0.1 to 10 g L−1 in order to facilitate the parameterization of surface tension over a range of concentrations for both NAFA and NaCl independently. The surface tension of the solutions was measured with an FTA125 (First Ten Ångströms) pendant drop tensiometer at a temperature of about 22 °C (room temperature) as described in previous studies.21,25,26 The droplets produced during the surface tension measurements are of order 1 mm in size and therefore represent macroscopic systems. To capture the time-evolution of the droplet solution surface tension, multiple surface tension measurements were made on a single solution droplet for different times starting from the initial droplet formation up to 1100 s. Each data point is an average of 43 measurements made in rapid succession. Since we are not able to control the exact time step between each measurement, the measured data are presented for comparable times 0, 200, 400, 600, 800, and 1000 s after droplet formation by interpolation from the measured data points, to facilitate the comparison of measurements across different solution droplets. The first possible measurements designated at a time of t = 0 s in this study were typically carried out 5–10 seconds after the droplet had been created. It was not possible to control the relative humidity in the experimental set up, so the surface tensions measured after longer droplet lifetimes may be biased somewhat low due to increased concentration from evaporation.
2.2 Modeling
Droplet activation is evaluated using the Köhler equation which describes the water vapor equilibrium over an aqueous solution drop as | (1) |
The Köhler equation relates the saturation ratio S to the droplet water activity aw, surface tension σ, and partial molecular volume of water νw, as well as Boltzmann's constant k, temperature T in kelvin, and droplet radius R. In this work, both modeled and experimental results from the literature are expressed as an excess percentage above water saturation, or supersaturation, s = (S − 1) × 100%.
In eqn (1), aw, νw, and σ are evaluated as functions of the droplet bulk composition using relations based on measurements from macroscopic solutions. The droplet bulk composition {xbi} is found from the total composition {xti} by evaluating the bulk/surface partitioning of solute molecules in the droplet and any potential changes incurred to the bulk composition from depletion to the surface. The total composition at each step of the droplet growth is determined from the amount of solute in the original dry particle and water needed to grow the droplet to the given size.15 Here, we use two different bulk/surface partitioning schemes, which each capture different aspects of the complex effects of this process.
The Gibbs model14,15 calculates bulk/surface partitioning of the surfactant in terms of a surface excess nsi with respect to a conceptual two-dimensional dividing surface using the Gibbs adsorption equation:
 | (2) |
![[n with combining macron]](https://www.rsc.org/images/entities/i_char_006e_0304.gif) NAFA = mNAFA/
NAFA = mNAFA/![[M with combining macron]](https://www.rsc.org/images/entities/i_char_004d_0304.gif) NAFA determined from the NAFA mass mNAFA and number average molecular weight
NAFA determined from the NAFA mass mNAFA and number average molecular weight ![[M with combining macron]](https://www.rsc.org/images/entities/i_char_004d_0304.gif) NAFA = 4266 g mol−1.27 For convenience, we simply use the symbol nNAFA in the following, which then represents an average NAFA molecular quantity with some average molecular weight.
NAFA = 4266 g mol−1.27 For convenience, we simply use the symbol nNAFA in the following, which then represents an average NAFA molecular quantity with some average molecular weight.
The position of the Gibbs dividing surface is chosen such that the bulk-phase volume is equal to the total volume of all the droplet components. The adsorption equation is solved numerically by assuming volume additivity and conservation of mass to evaluate the molar quantities nbi of all components – water, NAFA, and NaCl – in the bulk and excess molar quantity of NAFA at the dividing surface.
In the monolayer model,18,20 the composition of the bulk and surface are related via the semi-empirical equation
 | (3) |
 are the bulk and surface mole fraction concentrations, respectively, corresponding to molar amounts nbi and nsi, of droplet component i, σ is the surface tension of the solution phase, σi is the surface tension of an individual pure component i, and vi is the liquid-phase molecular volume of droplet component i. Droplet components are partitioned into a physical surface layer of thickness given by
 | (4) |
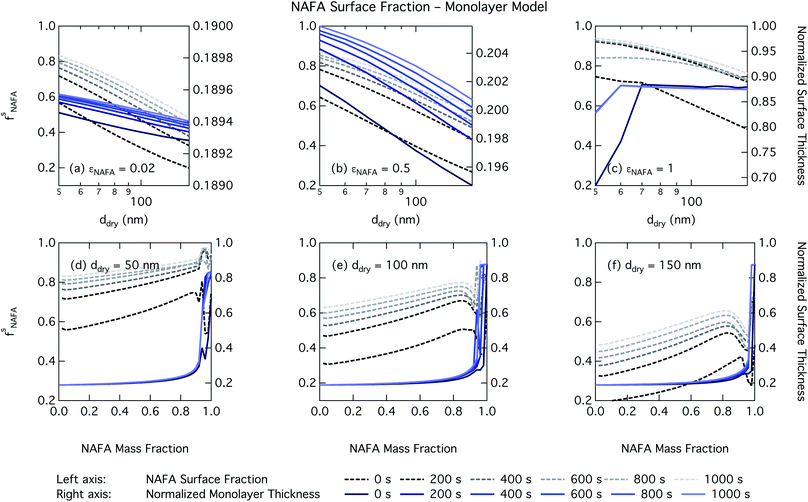
For both the Gibbs and monolayer models, the fraction of NAFA partitioned to the surface fsNAFA = nsNAFA/ntNAFA is calculated. As previously noted,20 this surface fraction quantity is conceptually different for the two frameworks. In the Gibbs model, only the surface-active component partitions between bulk and surface, whereas all other components remain uniformly distributed throughout the bulk. In the monolayer model, all components are distributed among both surface and bulk phases, with different concentrations in each phase. The monolayer surface fraction is therefore calculated from NAFA molecules occupying a physical surface phase while the Gibbs surface fraction is calculated from the surface excess of NAFA molecules with respect to the defined Gibbs dividing surface.
To demonstrate the effect of bulk/surface partitioning, Köhler model results from a bulk solution model13 that does not account for partitioning is also included. This model treats droplets as macroscopic solutions by not taking depletion of the droplet bulk from bulk/surface partitioning of surfactant into consideration ({xbi} = {xti}). A similar model was used to interpret the measurement data of Kristensen et al.21 but using a pseudo-ternary parameterization with respect to droplet composition (no continuous variation in solute mixing ratio) and without consideration of time-evolution in the surface tension. Here, we use fully continuous ternary parameterizations for all Köhler model calculations.
A conceptual schematic for the three models described above is given in Fig. 2. The bulk model corresponds to properties of the macroscopic solution in Fig. 1(a). The Gibbs and monolayer models both represent activating droplets according to the finite-sized (microscopic) solutions in Fig. 1(b), each with a different representation of surface thermodynamics. A similar schematic may be found in Fig. 1 of Prisle et al.29 where the Gibbs and monolayer models correspond to representation T and the bulk solution model to representation A. The difference between the Gibbs and monolayer models and their impact on the shape of the Köhler curve is illustrated in the table of contents figure of Lin et al.20
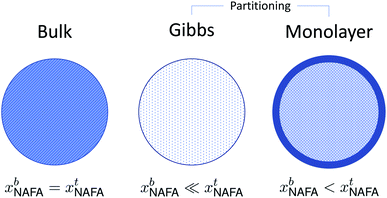 | ||
| Fig. 2 A conceptual schematic for the three droplet models in this work illustrating the treatment of the surfactant bulk concentration xb in the different frameworks. | ||
Measured surface tensions are parameterized for each (interpolated) time step after formation of the droplet surface using an augmented Szyszkowski–Langmuir relation14,15
 | (5) |
 and obtained from a linear fit to the data by Low.30 The fitting parameters a and b have units mN m−1 and g L−1, respectively, and have the form
 | (6) |
With the solute partitioning and droplet bulk composition evaluated, the Köhler equation may be solved for each droplet size along the growth curve.15 The surface tension in the Köhler equation is calculated from the surface tension parameterizations based on our measurements, using the bulk composition {xbi} from each individual model. The rest of the parameters in the Köhler equation are computed from {xbi} using parameterizations taken from literature and described elsewhere.18,20 Here, we calculate Köhler curves for dry particles composed of NAFA and NaCl of size 50–150 nm in 10 nm increments and NAFA mass fractions from 0–1 in 0.02 increments. The maximum of the Köhler curve identifies the point of droplet activation at which the critical supersaturation scrit, critical droplet size dc, and droplet surface tension at activation σc are calculated.
3 Results & discussion
3.1 Ternary surface tensions at different times
Two examples of measured surface tensions for ternary aqueous NAFA–NaCl solutions of varying compositions, corresponding to times t = 200 and 1000 s after forming the droplet surface are shown in Fig. 3, together with the corresponding ternary fits to eqn (5). Plots of measurement data and ternary fits for the remaining time steps t = 0, 400, 600, and 800 s are presented in the ESI† as well as the residuals for all the fits. Ternary surface tension parameters resulting from the fitting procedure described for eqn (5) are given in Table 1 for fits corresponding to all times steps. The surface tensions corresponding to time step t = 0 s were previously presented by Kristensen et al.,21 who also presented raw time-evolving surface tension data for a single NAFA![[thin space (1/6-em)]](https://www.rsc.org/images/entities/char_2009.gif) :
:![[thin space (1/6-em)]](https://www.rsc.org/images/entities/char_2009.gif) NaCl mass mixing ratio of 80
NaCl mass mixing ratio of 80![[thin space (1/6-em)]](https://www.rsc.org/images/entities/char_2009.gif) :
:![[thin space (1/6-em)]](https://www.rsc.org/images/entities/char_2009.gif) 20 at two single concentration points. Kristensen et al.21 noted the time-evolution of measured surface tensions, but did not include time-dependent effects in their analysis. They also presented two-dimensional, pseudo-ternary fits with respect to total solute concentration for each of the mixtures presented here. This is, however, the first time the measured surface tensions at different time steps >0 s and true ternary (3-dimensional) fits as a function of both NAFA and NaCl concentration to those measurement data have been presented.
20 at two single concentration points. Kristensen et al.21 noted the time-evolution of measured surface tensions, but did not include time-dependent effects in their analysis. They also presented two-dimensional, pseudo-ternary fits with respect to total solute concentration for each of the mixtures presented here. This is, however, the first time the measured surface tensions at different time steps >0 s and true ternary (3-dimensional) fits as a function of both NAFA and NaCl concentration to those measurement data have been presented.
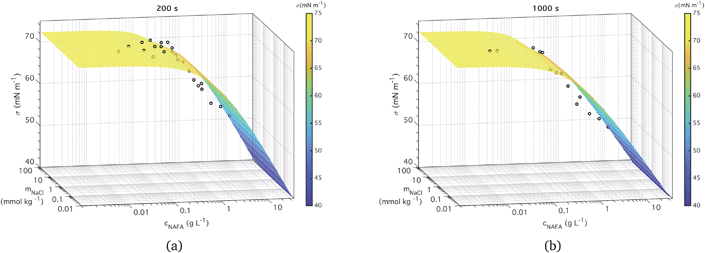 | ||
| Fig. 3 Measured time-dependent surface tension and fit to measurements for times (a) t = 200 s and (b) t = 1000 s. | ||
| Time (s) | a [mN m−1] | b [g L−1] | ||||
|---|---|---|---|---|---|---|
| a 0 | a 1 | a 2 | b 0 | b 1 | b 2 | |
| 0 | 182 | −398 | 222 | 49.8 | −113 | 63.4 |
| 200 | 66.9 | −143 | 85.3 | 9.17 | −21.9 | 13.7 |
| 400 | 48.1 | −97.1 | 56.7 | 5.19 | −11.9 | 7.32 |
| 600 | 72.1 | −158 | 93.5 | 6.56 | −15.5 | 9.43 |
| 800 | 43.4 | −86.7 | 50.6 | 3.47 | −8.00 | 4.94 |
| 1000 | 40.9 | −79.8 | 46.0 | 2.86 | −6.49 | 3.99 |
The ternary fits to the data are generally good – within 2 mN m−1 for the most part (see Fig. S5 in the ESI†) – and look very similar between all the measurement time steps. The measured macroscopic droplet surface tension decreases with increasing NAFA concentration for a given mixing ratio with NaCl. The measured surface tensions start near 72.73 mN m−1, the value for pure water, for solutions dilute in NAFA. Significant depression of surface tension from the pure water value starts above NAFA concentration around 0.1 g L−1. The lowest measured surface tension, 48 mN m−1, occurs for NAFA concentrations around 1 g L−1 for time steps longer than 0 s. For increasing measurement times, the surface tension depression becomes evident at lower NAFA concentrations, illustrating the effect of surface adsorption time scales in macroscopic solutions. The change in the surface tension of pure NAFA as a function of time is shown in Fig. S12 of the ESI.† The impact of changing NaCl concentration on surface tension of mixtures is more modest than that of NAFA, as expected. For NAFA concentrations between 0.1 and 1 g L−1, surface tension for a given NAFA concentration tends to decrease with increasing NaCl concentration due to salting out of NAFA by NaCl.31–38 This trend is however not uniform over the whole composition range. In particular for surface tensions at t = 0 s, a trough appears in the fitting surface, possibly due to the sensitivity of the fit to data points.
It must be emphasized that the experimental surface tensions are measured for macroscopic droplets with dimensions of order 1 mm. In submicron activating droplets, the bulk/surface partitioning introduces a complex relation between droplet growth and surface tension equilibrium. Essentially, the bulk/surface partitioning must be evaluated for each droplet size and composition before the surface tension can be found from eqn (5). This moves the droplet in composition space, possibly on both axes simultaneously, and the effect on evaluated droplet surface tension can be dramatic.
3.2 CCN activation and critical properties
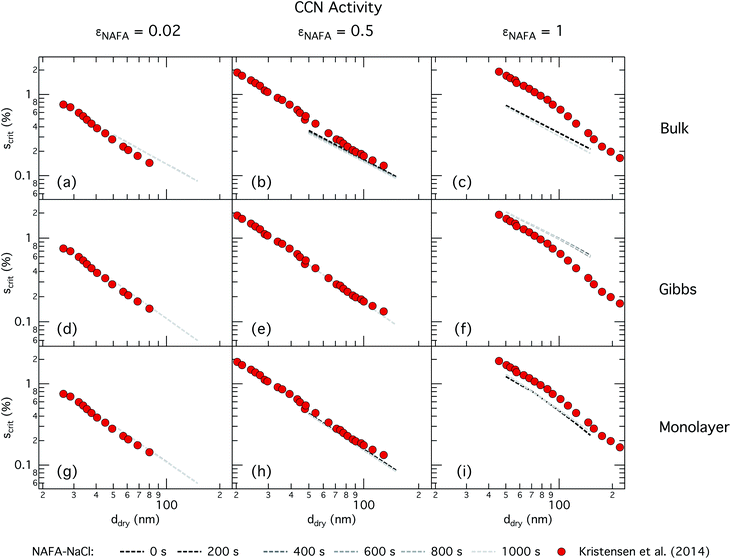 | ||
| Fig. 4 CCN activity of mixed NAFA–NaCl particles of size 50–150 nm predicted with the bulk model (top row), Gibbs model (middle row) and monolayer model (bottom row) for NAFA mass fractions 0.02 (left column), 0.5 (middle column), and 1 (right column). Measurements from Kristensen et al. are also shown,21 with measurements in the left-most column for pure NaCl particles shown for reference. | ||
For the bulk model, critical supersaturations decrease with time for fixed dry diameter and NAFA mass fraction as expected, reflecting the general decrease in the macroscopic surface tension with time. The bulk model tends to overestimate CCN activity – or underestimate critical supersaturation – with the effect more pronounced at higher NAFA dry mass fraction. The small underestimation of CCN activity for particles with small NAFA mass fractions are likely due to the differences in CCN activity between NaCl and NAFA, as experimental data represent pure NaCl particles.21 Differences may be further due to a salting out effect in the droplets that is not well represented in the model due to uncertainty in the ternary parameterization at low NAFA concentrations in solution.14
In the Gibbs partitioning model, small differences in predicted CCN activity between the different measured times start to become apparent for the largest pure NAFA particles. The prediction of CCN activity for NAFA mass fractions 0.02 and 0.5 match the measurements of Kristensen et al. quite well. This has also been seen in previous work15 and suggests that the presence of significant amounts of highly hygroscopic NaCl causes the associated Raoult effect to dominate any changes that might occur at the surface due to surfactant partitioning. The Gibbs model may overestimate the amount of surfactant partitioning to the droplet surface, due to the lack of physical constraints as it is evaluated purely with respect to a hypothetical two-dimensional dividing surface.18 This in turn leads to overestimation of critical supersaturation for pure NAFA particles from decreased Raoult effect and surface tension reduction. With the droplet bulk depleted of solute, the result is that there is not enough surfactant remaining for time-dependent changes in surface tension at a given composition to significantly impact the CCN activity. See Section 3.2.2 for discussion on the surface tension at activation.
The monolayer partitioning model captures the measured CCN activity about as well as the Gibbs model, also deviating from measurements at higher NAFA mass fractions but in the opposite direction towards higher CCN activity. To the extent that there are any noticeable differences in time as may be hinted at εNAFA = 0.5, the trend is for CCN activity to increase with time, although the effect is small. For pure NAFA particles, there is a slight deviation in CCN activity at t = 0 s compared to the rest of the time steps for the smallest and largest dry particles. This could again be due to uncertainties introduced by the surface tension fitting, which at t = 0 s has a trough in the fitting surface not observed at other times. The resolution of surface tension data in this range of composition space is not sufficient to unequivocally gauge whether the trough represents a physical phenomenon or is merely a feature of the fit. Since this was the best fit to the measured surface tensions at t = 0 s, we chose not to impose any unnecessary constraints on the fits. In contrast to the Gibbs model, partitioning in the monolayer model is limited by the finite volume of the physical surface layer. When the surface is comprised of a full monolayer, further partitioning is restricted and additional solute confined to the droplet bulk. For small droplets with large surface to bulk ratios that contain high amounts of NAFA, the large average molecular mass of NAFA causes the model to be highly sensitive to the addition of even a single unit of NAFA mass to the surface. At very high concentrations, the surface of a real droplet may be comprised by more than a single monolayer. In such cases, the monolayer model may be underestimating the magnitude of surfactant partitioning, leading to an overestimation of the CCN activity of pure NAFA particles.
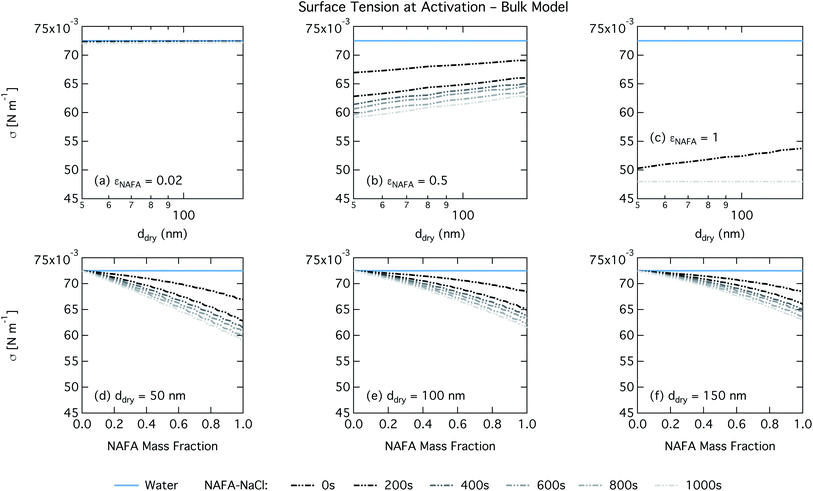
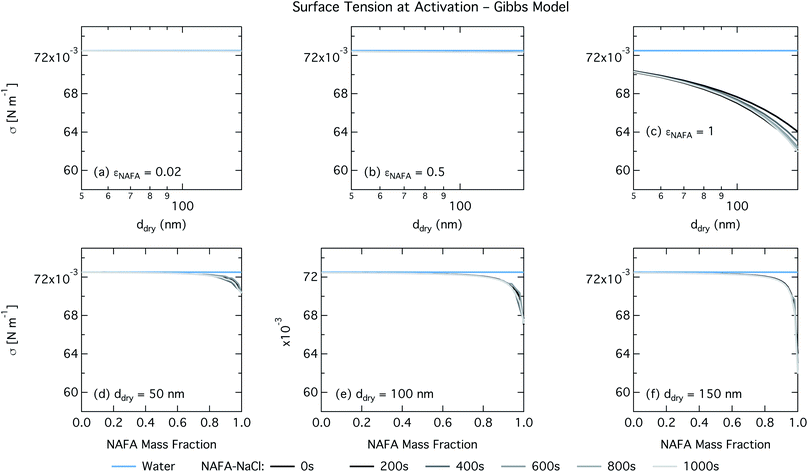
For the Gibbs partitioning model, the surface tension at activation does not appreciably deviate from the surface tension of pure water until dry particles reach a NAFA mass fraction around 0.8 and above. Due to the strong surface partitioning predicted in the Gibbs model, the droplet bulk is depleted of surfactant until reaching very high NAFA mass fractions. The critical droplet surface tension as a function of droplet bulk concentration of NAFA (according to eqn (5)) therefore remains close to that of pure water across most of the dry particle composition spectrum. For pure NAFA particles, the trend in surface tension at activation is not monotonic with time. This occurs due to the non-linear combination of simultaneous partitioning effects on the Raoult (bulk) and Kelvin (surface) effects in the Köhler equation, where the overall effect of bulk/surface partitioning stems from an intricate combination of total dry composition, dilution and decreasing surface/bulk ratio from droplet growth, and intrinsic surfactant strength. These mutually opposing and interconnected mechanisms are not easily untangled.15,20
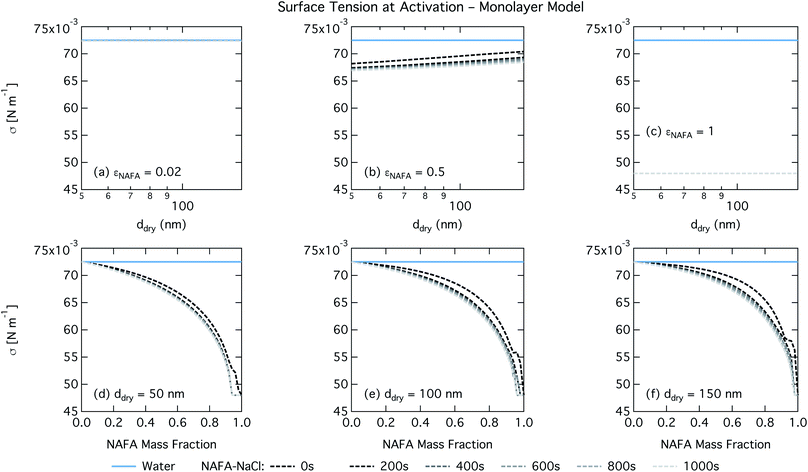
For the monolayer partitioning model, there is no observable dependence of droplet surface tension at activation with dry size for small and large NAFA mass fractions (panels (a) and (c) in Fig. 7, respectively). In the former case, the small overall amount of NAFA means droplet concentrations remain low and the surface tension remains close to that of pure water. In the latter case, all the NAFA is partitioned to the surface to form a nearly full monolayer. As with the bulk model, the minimum surface tension from the parameterization is reached, this time for all times considered. Otherwise, the trend with dry size is for the surface tension at activation to increase as larger particles activate into larger, more dilute droplets. The greatest difference between the two partitioning models in terms of surface tension at activation can be seen as a function of dry particle NAFA mass fraction. In the monolayer partitioning model, the surface tension at activation starts to decrease immediately with the addition of NAFA, eventually reaching a much lower surface tension than that in the Gibbs partitioning model. The depression in the surface tension at droplet activation increases with time. Due to the more pronounced impact of surface tension depression in the monolayer model, time-dependent effects are now noticeable although much more moderate than for the bulk model.
3.3 Discussion
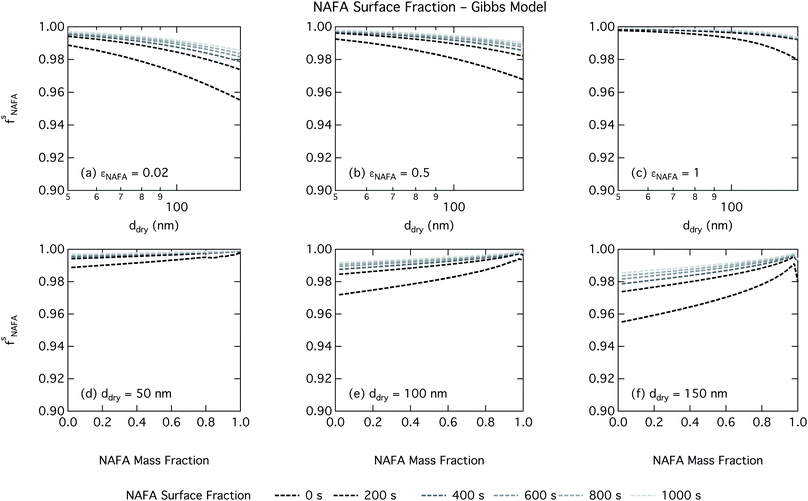
Effects of surface tension equilibration dynamics and time-evolution for aqueous surface-active organic aerosol properties is largely unexplored until now. Nozière and coworkers presented evidence of adsorption barriers that limited partitioning in droplets and enhanced CCN activity compared with current models that assume instantaneous surface tension equilibrium.39 Based on time-dependent surface tension measurements for fixed concentrations of surfactant fractions extracted from ambient PM10, they estimated the time necessary to attain surface tension equilibrium in an activated atmospheric droplet to be between 36 and 495 s. This time interval is well spanned by our presented measurements of NAFA surface tension evolution over 0–1000 s after formation of the aqueous surface. However, in calculating time-dependent Köhler curves, the effect of partitioning on the droplet water activity was not taken into account. The droplet water activity was calculated using macroscopic osmolality measurements of a separate sample, obtained from an instrument with an equilibrium time of 3.5 min,25 well beyond the characteristic time reported for the surface tension measurements to reach so-called meso-equilibrium.39 We show here, as in previous work13,15,18,20,40 that use of concentration-dependent solution properties obtained from macroscopic measurements can only be applied to finite sized systems if the orders of magnitude larger surface to bulk ratio and impact on bulk/surface partitioning is taken properly into account. In macroscopic bulk solutions, the partitioning of molecules to the surface does not sufficiently deplete the bulk to affect the water activity, which is therefore largely insensitive to any surface adsorption dynamics. However, in finite-sized microscopic solutions, surface partitioning is able to deplete the bulk enough to significantly affect the water activity. For example, the effect of surfactant surface partitioning becomes important for binary sodium decanoate solutions in droplets below approximately 1 μm.15 Therefore, although barriers to surface adsorption may indeed retain solute in the bulk and preserve a lower water activity, in microscopic systems this condition is incompatible with a reduction in surface tension corresponding to pronounced surface adsorption, because in finite systems, these two effects manifest at a mutual expense. This is distinct from macroscopic systems, where only surface tension, not water activity, is affected by adsorption time scales.Equilibration times for microscopic droplets are expected to be much smaller than for the macroscopic solutions for which surface tensions are typically measured. With the empirical relation for diffusivity D = 1.1 × 10⁻³M−0.81 of aquatic dissolved organic matter as a function of molecular weight M derived by Balch and Guéguen,41 we estimate the diffusivity of NAFA, with an average molecular weight of 4266 g mol−1,27 as 1.3 × 10⁻⁶ cm2 s−1. Assuming the time scale τ for an average NAFA molecule to diffuse from the center of a droplet to the surface is given by τ = R2/2D, a 1 μm droplet and a 1 mm droplet will attain adsorption equilibrium from diffusion in 4 ms and 4000 s, respectively. Nozière and coworkers estimated apparent diffusion coefficients Da of extracted PM10 surfactant samples to range from 10−8 to 10−6 cm2 s−1.39 Measurements of NAFA diffusivity have typically found higher values,12,42 possibly due to the break up of NAFA molecules during sample preparation and measurement as evidenced by a lower calculated mean molecular weight than the value of Mäkelä and Manninen27 used here. The time scale for aerosol to equilibrate with the instrument humidity field during measurements of CCN activity is 6–12 s, depending on the flow rate.43 With either of the different diffusivity estimates, we can therefore assume that the experimental data of Kristensen et al.44 shown in Fig. 4 represent droplets at equilibrium with respect to surface adsorption from diffusion. Furthermore, since the macroscopic droplets for which time-evolving surface tensions were measured are about 1 mm in size, it is reasonable to assume that our measurements capture at least the majority of surface tension variation from diffusion time. In this work, the effect of including surface tension parameterizations representing different time steps in our Köhler calculations is to capture the surface tension–composition relation at different stages of NAFA adsorption at the aqueous surface, regardless of the absolute time scales involved. The estimated NAFA surface fractions in Fig. 8 and 9 demonstrate that this is indeed the case.
The importance of accounting for partitioning in predictions of CCN activity of surface-active aerosol is well-known,13,15,45 and our present results illustrate the impact of partitioning from yet another perspective of the time-evolution of droplet surface tension. While the bulk model shows the behavior expected from measured macroscopic surface tension that decreases with time, the time-dependence of modeled CCN activity is not as expected from bulk solution measurements when partitioning is accounted for. This is seen consistently for both partitioning models used in this study.
The physical nature of the droplet surface from both the Gibbs and monolayer model can shed some insight on the behavior of CCN activity predicted with time-evolving surface tension. For both models, the fraction of NAFA partitioned to the surface clearly increases with time, as expected from the measured decrease in macroscopic surface tension with time (Fig. 8 and 9). The concurrent depletion of the finite droplet bulk with time however counteracts the increasing surface tension depression with time. For the Köhler curve predictions, the time-evolving decrease in droplet surface tension (Fig. 6 and 7) is much more modest than suggested by the predicted NAFA surface fractions, due to the large surface to volume ratios of the activating droplets. Finally, the concurrent increase in water activity from droplet bulk depletion largely counteracts the effect of moderate surface tension reduction for Köhler predictions (Fig. 4). This balancing of the Raoult and Kelvin effects in the Köhler equation has been demonstrated before for strong surfactants such as fatty acid salts13,15 as well as for less strong surfactants such as dicarboxylic acids comprised in sea salt aerosol mimics.46,47 For the NAFA–NaCl system studied here, we conclude from the results of the comprehensive thermodynamic models that the time-evolution observed for the macroscopic surface tension measurements does not significantly affect the predicted CCN activity. This conclusion is supported not only by the calculations of the critical supersaturation, but also by the calculations of droplet surface tension and NAFA surface fraction. However, even if time-dependency does not impact evaluated critical supersaturation, it may still have an impact on other droplet properties such as concentration-dependent surface reactivity or the activated droplet size spectrum.46,48
The time-evolution of surface tension for solutions of weaker atmospheric surfactants may have a different effect on CCN activity than demonstrated for the strongly surface-active NAFA–NaCl system studied here. Whether the behavior observed here is just the case for this system or a general feature of surface-active aerosol will require both comprehensive measurements and modeling for more diverse systems. However, obtaining the required experimental data, constructing the ternary parameterizations, as well as modeling the CCN activation is sample intensive, time consuming, and non-trivial. We are currently unaware of any other data set, comprising time-evolving surface tension with variation in all components and CCN activity for corresponding aerosol mixtures, which would allow a similar analysis.
4 Conclusions
Macroscopic surface tension measurements were made for a range of both NAFA and NaCl concentrations while following the evolution with time. Measured surface tensions were interpolated to yield data points corresponding to time steps of 0, 200, 400, 600, 800, and 1000 s after formation of the solution surface. These times capture the evolution in surface tension as NAFA adsorbs at the aqueous surface. For each time, a full 3-dimensional ternary surface tension parameterization was made that is continuous with respect to independent variations in all droplet components. These parameterizations are key to enabling thermodynamically consistent evaluation of surface partitioning and resulting droplet surface tension along the Köhler growth curve, and thus to understanding the effect of variations in particle composition and droplet size on their activation.The effects of time-dependent surface tension for the CCN activation of NAFA–NaCl particles were explored using two thermodynamic models that account for surface tension and bulk/surface partitioning and a bulk model that composition-dependent variation in droplet properties similar to a macroscopic solution. When bulk/surface partitioning is not taken into account, the modeled CCN activity of NAFA–NaCl particles increases with time, a seemingly intuitive result following the decreasing trend in macroscopic surface tension with time. However, when partitioning is explicitly taken into account using either the Gibbs or monolayer partitioning model, the dependence of CCN activity with time largely disappears, due to the opposing effects in the Kelvin and Raoult terms, where depletion of the bulk counteracts the depression of surface tension in the Köhler equation. This conclusion is supported by specific evaluation of the concurrent droplet surface tension and surface composition at the critical point of activation with each of the partitioning models.
Our results highlight the non-linearity of the competing bulk depletion and surface tension effects that surface-active compounds have in finite-size solutions such as activating droplets, also in the context of time-evolving surface adsorption. The result of this competition is not easy to anticipate for varying conditions. More measurements and modeling work such as we have presented here will therefore be necessary to determine the importance of surface tension temporal effects for other atmospherically relevant surface-active compounds, as well as the potential importance of surface tension equilibration times for cloud formation in the atmosphere.
Conflicts of interest
There are no conflicts to declare.Acknowledgements
This project has received funding from the European Research Council (ERC) under the European Union's Horizon 2020 Research and Innovation Programme, Project SURFACE (Grant Agreement No. 717022). NLP, JJL, and JM also gratefully acknowledge the financial contribution from the Academy of Finland (Grant No. 308238, 314175, and 290145). NLP is furthermore grateful to the Carlsberg Foundation for funding (2010_01_0391 and 2009_01_0366). TBK also acknowledges funding of Prof. Merete Bilde from the Carlsberg Foundation (2009_01_0515) and from the Nordic Center of Excellence CRAICC. We thank ACES, Stockholm University, for use of the tensiometer and osmometer, and we thank Sanna Silvergren for assistance with those instruments.Notes and references
- M. L. Shulman, M. C. Jacobson, R. J. Charlson, R. E. Synovec and T. E. Young, Dissolution behavior and surface tension effects of organic compounds in nucleating cloud droplets, Geophys. Res. Lett., 1996, 23, 277–280 CrossRef CAS.
- Z. Li, A. L. Williams and M. J. Rood, Influence of Soluble Surfactant Properties on the Activation of Aerosol Particles Containing Inorganic Solute, J. Atmos. Sci., 1998, 55, 1859–1866 CrossRef.
- V. Gérard, B. Noziere, C. Baduel, L. Fine, A. A. Frossard and R. C. Cohen, Anionic, Cationic, and Nonionic Surfactants in Atmospheric Aerosols from the Baltic Coast at Askö, Sweden: Implications for Cloud Droplet Activation, Environ. Sci. Technol., 2016, 50, 2974–2982 CrossRef PubMed.
- A. Kroflič, S. Frka, M. Simmel, H. Wex and I. Grgić, Size-Resolved Surface-Active Substances of Atmospheric Aerosol: Reconsideration of the Impact on Cloud Droplet Formation, Environ. Sci. Technol., 2018, 52, 9179–9187 CrossRef PubMed.
- A. A. Frossard, W. Li, V. Gérard, B. Noziere and R. C. Cohen, Influence of surfactants on growth of individual aqueous coarse mode aerosol particles, Aerosol Sci. Technol., 2018, 52, 1–12 CrossRef.
- A. A. Frossard, V. Gérard, P. Duplessis, J. D. Kinsey, X. Lu, Y. Zhu, J. Bisgrove, J. R. Maben, M. S. Long, R. Y. W. Chang, S. R. Beaupré, D. J. Kieber, W. C. Keene, B. Noziere and R. C. Cohen, Properties of Seawater Surfactants Associated with Primary Marine Aerosol Particles Produced by Bursting Bubbles at a Model Air–Sea Interface, Environ. Sci. Technol., 2019, 53, 9407–9417 CrossRef CAS PubMed.
- D. E. Graham and M. C. Phillips, Proteins at Liquid Interfaces I. Kinetics of Adsorption and Surface Denaturation, J. Colloid Interface Sci., 1979, 70, 403–414 CrossRef CAS.
- K. J. Mysels, Surface tension of solutions of pure sodium dodecyl sulfate, Langmuir, 1986, 2, 423–428 CrossRef CAS.
- P. Joos and G. Serrien, Adsorption kinetics of lower alkanols at the air/water interface: Effect of structure makers and structure breakers, J. Colloid Interface Sci., 1989, 127, 97–103 CrossRef CAS.
- H. Ohtaki and T. Radnai, Structure and dynamics of hydrated ions, Chem. Rev., 1993, 93, 1157–1204 CrossRef CAS.
- X. Wen, K. C. McGinnis and E. I. Franses, Unusually low dynamic surface tensions of aqueous solutions of sodium myristate, Colloids Surf., A, 1998, 143, 371–380 CrossRef CAS.
- I. Taraniuk, E. R. Graber, A. Kostinski and Y. Rudich, Surfactant properties of atmospheric and model humic-like substances (HULIS), Geophys. Res. Lett., 2007, 34, 594–595 CrossRef.
- N. L. Prisle, T. Raatikainen, R. Sorjamaa, B. Svenningsson, A. Laaksonen and M. Bilde, Surfactant partitioning in cloud droplet activation: a study of C8, C10, C12 and C14 normal fatty acid sodium salts, Tellus B, 2008, 60, 416–431 CrossRef.
- N. L. Prisle and B. Mølgaard, Modeling CCN activity of chemically unresolved model HULIS, including surface tension, non-ideality, and surface partitioning, Atmos. Chem. Phys. Discuss., 2018, 2018, 1–23 CrossRef.
- N. L. Prisle, T. Raatikainen, A. Laaksonen and M. Bilde, Surfactants in cloud droplet activation: mixed organic-inorganic particles, Atmos. Chem. Phys., 2010, 10, 5663–5683 CrossRef CAS.
- N. L. Prisle, N. Ottosson, G. Öhrwall, J. Söderström, M. Dal Maso and O. Björneholm, Surface/bulk partitioning and acid/base speciation of aqueous decanoate: direct observations and atmospheric implications, Atmos. Chem. Phys., 2012, 12, 12227–12242 CrossRef CAS.
- J. Werner, I. Persson, O. Björneholm, D. Kawecki, C.-M. Saak, M.-M. Walz, V. Ekholm, I. Unger, C. Valtl, C. Caleman, G. Öhrwall and N. L. Prisle, Shifted equilibria of organic acids and bases in the aqueous surface region, Phys. Chem. Chem. Phys., 2018, 20, 23281–23293 RSC.
- J. Malila and N. L. Prisle, A monolayer partitioning scheme for droplets of surfactant solutions, J. Adv. Model. Earth Syst., 2018, 10, 3233–3251 CAS.
- A. M. K. Hansen, J. Hong, T. Raatikainen, K. Kristensen, A. Ylisirniö, A. Virtanen, T. Petäjä, M. Glasius and N. L. Prisle, Hygroscopic properties and cloud condensation nuclei activation of limonene-derived organosulfates and their mixtures with ammonium sulfate, Atmos. Chem. Phys., 2015, 15, 14071–14089 CrossRef CAS.
- J. J. Lin, J. Malila and N. L. Prisle, Cloud droplet activation of organic–salt mixtures predicted from two model treatments of the droplet surface, Environ. Sci.: Processes Impacts, 2018, 20, 1611–1629 RSC.
- T. B. Kristensen, N. L. Prisle and M. Bilde, Cloud droplet activation of mixed model HULIS and NaCl particles: Experimental results and κ-Köhler theory, Atmos. Res., 2014, 137, 167–175 CrossRef CAS.
- G. Kiss, E. Tombácz and H.-C. Hansson, Surface Tension Effects of Humic-Like Substances in the Aqueous Extract of Tropospheric Fine Aerosol, J. Atmos. Chem., 2005, 50, 279–294 CrossRef CAS.
- I. Salma, T. Mészáros, W. Maenhaut, E. Vass and Z. Majer, Chirality and the origin of atmospheric humic-like substances, Atmos. Chem. Phys., 2010, 10, 1315–1327 CrossRef CAS.
- H. Abdul-Razzak and S. J. Ghan, A parameterization of aerosol activation 2. Multiple aerosol types, J. Geophys. Res.: Atmos., 2000, 105, 6837–6844 CrossRef CAS.
- Z. Varga, G. Kiss and H.-C. Hansson, Modelling the cloud condensation nucleus activity of organic acids on the basis of surface tension and osmolality measurements, Atmos. Chem. Phys., 2007, 7, 4601–4611 CrossRef CAS.
- S. Ekström, B. Nozière and H.-C. Hansson, The Cloud Condensation Nuclei (CCN) properties of 2-methyltetrols and C3-C6 polyols from osmolality and surface tension measurements, Atmos. Chem. Phys., 2009, 9, 973–980 CrossRef.
- J. Mäkelä and P. Manninen, Molecular Size Distribution and Structure Investigations of Humic Substances in Groundwater, Posiva Oy Technical Report 2008-36, 2008 Search PubMed.
- G. J. Janz, Molten Salts Data as Reference Standards for Density, Surface Tension, Viscosity, and Electrical Conductance: KNO3 and NaCl, J. Phys. Chem. Ref. Data, 1980, 9, 791–830 CrossRef CAS.
- N. L. Prisle, A. Asmi, D. Topping, A. I. Partanen, S. Romakkaniemi, M. Dal Maso, M. Kulmala, A. Laaksonen, K. E. J. Lehtinen, G. McFiggans and H. Kokkola, Surfactant effects in global simulations of cloud droplet activation, Geophys. Res. Lett., 2012, 39, L05802 CrossRef.
- R. Low, A Theoretical Study of Nineteen Condensation Nuclei, J. Rech. Atmos., 1969, 65–78 Search PubMed.
- J. E. Desnoyers and F. M. Ichhaporia, Salting-in and salting-out of polar nonelectrolytes, Can. J. Chem., 1969, 47, 4639–4643 CrossRef CAS.
- M. B. Almeida, A. M. Alvarez, E. M. D. Miguel and E. S. D. Hoyo, Setchenow coefficients for naphthols by distribution method, Can. J. Chem., 1983, 61, 244–248 CrossRef.
- X. Wen-Hui, S. Jing-Zhe and X. Xi-Ming, Studies on the activity coefficient of benzene and its derivatives in aqueous salt solutions, Thermochim. Acta, 1990, 169, 271–286 CrossRef.
- S. Endo, A. Pfennigsdorff and K.-U. Goss, Salting-Out Effect in Aqueous NaCl Solutions: Trends with Size and Polarity of Solute Molecules, Environ. Sci. Technol., 2012, 46, 1496–1503 CrossRef CAS PubMed.
- C. Wang, Y. D. Lei, S. Endo and F. Wania, Measuring and Modeling the Salting-out Effect in Ammonium Sulfate Solutions, Environ. Sci. Technol., 2014, 48, 13238–13245 CrossRef CAS PubMed.
- E. M. Waxman, J. Elm, T. Kurtén, K. V. Mikkelsen, P. J. Ziemann and R. Volkamer, Glyoxal and Methylglyoxal Setschenow Salting Constants in Sulfate, Nitrate, and Chloride Solutions: Measurements and Gibbs Energies, Environ. Sci. Technol., 2015, 49, 11500–11508 CrossRef CAS PubMed.
- C. Wang, Y. D. Lei and F. Wania, Effect of Sodium Sulfate, Ammonium Chloride, Ammonium Nitrate, and Salt Mixtures on Aqueous Phase Partitioning of Organic Compounds, Environ. Sci. Technol., 2016, 50, 12742–12749 CrossRef CAS PubMed.
- M. Toivola, N. L. Prisle, J. Elm, E. M. Waxman, R. Volkamer and T. Kurtén, Can COSMOTherm Predict a Salting in Effect?, J. Phys. Chem. A, 2017, 121, 6288–6295 CrossRef CAS PubMed.
- B. Nozière, C. Baduel and J.-L. Jaffrezo, The dynamic surface tension of atmospheric aerosol surfactants reveals new aspects of cloud activation, Nat. Commun., 2014, 5, 3335 CrossRef PubMed.
- N. L. Prisle, J. J. Lin, S. Purdue, H. Lin, J. C. Meredith and A. Nenes, Cloud condensation nuclei activity of six pollenkitts and the influence of their surface activity, Atmos. Chem. Phys., 2019, 19, 4741–4761 CrossRef CAS.
- J. Balch and C. Guéguen, Effects of molecular weight on the diffusion coefficient of aquatic dissolved organic matter and humic substances, Chemosphere, 2015, 119, 498–503 CrossRef CAS PubMed.
- K. F. Morris, B. J. Cutak, A. M. Dixon and C. K. Larive, Analysis of Diffusion Coefficient Distributions in Humic and Fulvic Acids by Means of Diffusion Ordered NMR Spectroscopy, Anal. Chem., 1999, 71, 5315–5321 CrossRef CAS PubMed.
- D. Rose, S. S. Gunthe, E. Mikhailov, G. P. Frank, U. Dusek, M. O. Andreae and U. Pöschl, Calibration and measurement uncertainties of a continuous-flow cloud condensation nuclei counter (DMT-CCNC)- CCN activation of ammonium sulfate and sodium chloride aerosol particles in theory and experiment, Atmos. Chem. Phys., 2008, 8, 1153–1179 CrossRef CAS.
- T. B. Kristensen, N. L. Prisle and M. Bilde, Cloud droplet activation of mixed model HULIS and NaCl particles: Experimental results and κ-Köhler theory, Atmos. Res., 2014, 137, 167–175 CrossRef CAS.
- R. Sorjamaa, B. Svenningsson, T. Raatikainen, S. Henning, M. Bilde and A. Laaksonen, The role of surfactants in Köhler theory reconsidered, Atmos. Chem. Phys., 2004, 4, 2107–2117 CrossRef CAS.
- C. R. Ruehl, J. F. Davies and K. R. Wilson, An interfacial mechanism for cloud droplet formation on organic aerosols, Science, 2016, 351, 1447–1450 CrossRef CAS PubMed.
- S. D. Forestieri, S. M. Staudt, T. M. Kuborn, K. Faber, C. R. Ruehl, T. H. Bertram and C. D. Cappa, Establishing the impact of model surfactants on cloud condensation nuclei activity of sea spray aerosol mimics, Atmos. Chem. Phys., 2018, 18, 10985–11005 CrossRef CAS.
- N. L. Prisle, M. Dal Maso and H. Kokkola, A simple representation of surface active organic aerosol in cloud droplet formation, Atmos. Chem. Phys., 2011, 11, 4073–4083 CrossRef CAS.
Footnote |
| † Electronic supplementary information (ESI) available. See DOI: 10.1039/c9em00426b |
| This journal is © The Royal Society of Chemistry 2020 |

