Compact and efficient gas diffusion electrodes based on nanoporous alumina membranes for microfuel cells and gas sensors†
Wanda V.
Fernandez
,
Rocío T.
Tosello
and
José L.
Fernández
 *
*
Instituto de Química Aplicada del Litoral (IQAL, CONICET-UNL) and Programa de Electroquímica Aplicada e Ingeniería Electroquímica (PRELINE, Facultad de Ingeniería Química), Universidad Nacional del Litoral, Santiago del Estero 2829, 3000 Santa Fe, Argentina. E-mail: jlfernan@fiq.unl.edu.ar
First published on 24th October 2019
Abstract
This work describes the fabrication, characterization and evaluation of thin gas diffusion electrodes (GDEs) that are capable of electrocatalyzing the reaction of dissolved gases operating at high diffusion limiting current densities and with fast response times. Nanoporous alumina membranes (NAMs) were used as supports of metal electrocatalysts. NAMs were hydrophobized by silanization and coated on one side with Pt, either over the whole alumina surface by sputtering or just onto the pore openings by local chemical deposition. The Pt-modified NAM-based GDEs were evaluated for hydrogen oxidation. They operated by exposing their coated side to the electrolyte solution and the hydrophobic uncoated side to the flowing gas. Due to the NAM hydrophobicity, flooding of the pores by the electrolyte was diminished, so they were quickly filled by the circulating gas. Simulations of the process on single-pore GDEs showed that the dissolved gas diffused into the solution both radially (ideal pore) and linearly (partially flooded pore), reaching the electrocatalyst film placed right around the pore, which guaranteed a fast mass transport. Hydrogen oxidation operated on these NAM-based GDEs at a steady state with limiting current densities as high as 0.5 A cm−2, which were attained in less than 5 s and were proportional to H2 concentrations over a wide range. Thus, their potential use in microfuel cells and gas sensors was demonstrated.
1. Introduction
Gas diffusion electrodes (GDEs) are important constituents of varied electrochemical devices whose operation relies on the reaction of dissolved gases onto the electrode surface, such as fuel cells,1 gas electrolysis cells,2 and gas (or gas-using) sensors.3 Cells for gas electrolysis and fuel cells employ gas diffusion layers (GDLs) coupled to the catalyst layers to efficiently dispense the flowing gas reactants over the dispersed electrocatalysts, seeking to decrease the limitations caused by the mass transport of dissolved gases across the electrolyte.1,2 In particular, the compact design of miniaturized fuel cells (or microfuel cells) requires the use of thin GDEs that combine the GDL and the electrocatalyst layer.4 Moreover, many successful configurations of membrane-based gas sensors use compact GDEs to promote a rapid intake and reaction of the dissolved gas reactant, which leads to faster response times.3 GDEs can also be employed as model electrode platforms for evaluating the mechanisms and kinetics of gas reactions on supported electrocatalysts under realistic conditions with very high mass transport rates.5 Compact GDEs reported so far are based on porous membranes with pore sizes below 10 μm and with a more or less degree of disordering. For example, GDEs made from mesoporous silicon, porous sintered alumina, and polymeric substrates (e.g. PTFE films, Nafion membranes, track-etched polycarbonate filters) have been used in microfuel cells,6 in amperometric gas sensors,7,8 and for testing electrocatalysts for fuel cells.9The working principle of GDEs is based on their ability to bring the reactant in the gas phase as close as possible to the immersed electrocatalyst surface, so the dissolved gas must diffuse into the electrolyte throughout a very short distance. In an ideal situation, the gas/liquid interface should be established exactly at the pore opening, so the electroactive surface stands right around the region with highest concentration of dissolved gas. The fast diffusion of the dissolved gas towards the adjacent electrode surface allows the attainment of high steady state limiting current densities in short times. Scheme 1 illustrates two possible GDL/catalyst arrangements that should accomplish this situation. In the type-A configuration (Scheme 1a) the catalyst film is very thin and smooth, so this GDE uses low catalyst load, is very compact, should reach steady state very fast due to radial diffusion, and is also ideal for reaction modelling. The type-B configuration (Scheme 1b) employs a porous and permeable catalyst layer deposited right on top of the pore openings, which increases the accessible electroactive surface area and brings it much closer to the gas access. Thus, it leads to higher limiting current densities due to a thin-layer-cell (TLC) type linear diffusion at each pore, although as it is thick and porous its modelling is more complicated.
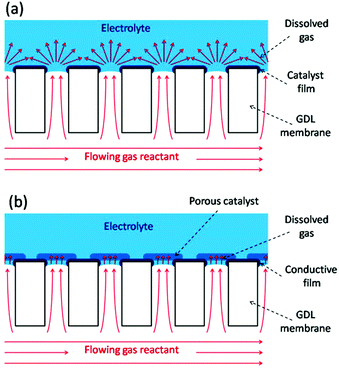 | ||
| Scheme 1 Schematics of two possible GDE configurations without (a) and with (b) a porous catalyst layer. | ||
Nanoporous alumina films are very interesting substrates to be used as GDL membranes in the GDE configurations described in Scheme 1, as they present a relatively smooth and definite array of nanopores. These films can be fabricated by well-established procedures that employ a number of strategies for controlling the pore sizes from a few to several hundreds of nanometers.10 Besides, they are widely used for filtration, so they are commercialized in very convenient formats, pore sizes, and thicknesses. Even though this material is being used in a variety of sensing methods,11 its employment as a GDL has not been explored. In this context, this work reports the fabrication of both types of GDEs described in Scheme 1 by employing commercially available nanoporous alumina membranes (NAMs) as supports and Pt as electrocatalysts. These Pt-modified NAM-based GDEs were evaluated for electrocatalyzing the oxidation of dissolved hydrogen, or hydrogen oxidation reaction (hor), for their potential application both as anodes in hydrogen microfuel cells4 and as membranes in H2-sensor electrodes.12
2. Materials and methods
Chemicals and materials
Octadecyl-trichlorosilane (OTS) ≥ 90% and hexachloroplatinic acid 99.9% were from Aldrich (USA), toluene was from Cicarelli (Argentina), and absolute ethanol, perchloric acid (70%), and sulphuric acid (98%) were from Merck (Germany). Alumina supports were commercial alumina oxide membranes (pore size: 0.2 μm, thickness: 0.1 mm, diameter: 13 mm) purchased from Sterlitech (USA). The adhesive-backed PTFE film (thickness: 0.005′′) was from McMaster-Carr (USA). Platinum and gold sputter targets (99.9%) were from Quorum Technologies (UK). Compressed gases (H2 and N2, 5.0) were from Indura (Argentina). Water was deionized with an exchange resin, doubly distilled, and treated with a Purelab purifier (Elga Labwater, resistivity ≥18.2 MΩ cm).Instrumentation
A PhenomWorld PROX benchtop scanning electron microscope (Netherlands) operating between 5 and 15 kV was used for the morphological characterization of bare membranes and Pt-modified NAMs. An Agilent model 5400 atomic force microscope (USA) was used for the estimation of Pt-film thicknesses on mica. A Mettler Toledo model MT5 analytical microbalance (readability: 0.001 mg) was employed for weighing the deposited metals. Contact angle measurements were carried out using a home-made instrument13 that employed a Hamilton syringe for dispensing 20 μL drops, a Point Grey model BFLY-PGE-05S2M-CS digital camera furnished with a magnification lens (6×), and the free software ImageJ for image acquisition and processing. The deposition of platinum and gold films by sputtering was done by using an Emitech (UK) model K500X sputter coater. The surface resistivity (ρs) of the deposited films in air was estimated through a standardized ASTM method14 by measuring the film resistance between two circular Pt electrodes (diameter: 1 mm, separation: 5 mm). Electrochemical experiments and uncompensated resistance (Ru) measurements15 were performed using a CH Instruments (USA) model CHI1140B potentiostat.Fabrication of Pt-modified NAM-based GDEs
NAMs were first hydrophobized by silanization with OTS following a previously reported procedure.16 The membrane was immersed in a freshly prepared 10 mM OTS solution in toluene for 24 h, then it was thoroughly washed with absolute ethanol, and finally thermally treated at 90 °C for 24 h. As only one face of these membranes contained a relatively smooth and well-defined array of nanopores, this face was identified by SEM examination. Then, over this ordered face a thin layer of gold was deposited by sputtering (4 min at 40 mA). On the one hand, for the fabrication of type-A GDEs, a thin layer of platinum was also deposited by sputtering (8 min at 40 mA). These conditions led to ∼60 nm thick films (as calibrated by AFM on mica substrates). On the other hand, type-B GDEs with varied degrees of Pt coverage were prepared by locally depositing this metal at the pore openings by chemical reduction of the metal salt with H2 at room temperature.17 More precisely, the Au/Pt-coated side of the membrane was placed over the surface of a solution containing 40 mM H2PtCl6 in 0.5 M H2SO4, leaving the uncoated hydrophobic side of the membrane heading toward the gas phase. Then H2 gas was flowed at 0.25 L min−1 directly on top of the NAM for reduction times (tR) that varied from 10 s to 120 s. After deposition, the coated side of the NAM was washed with water, dried in a vacuum oven, and stored in air. The amounts of the deposited noble metals were estimated on some GDEs by weighing the washed and dried membranes before and after each deposition step. Thus, the loadings of sputtered Au and Pt resulted in 0.05 ± 0.02 mg cm−2 and 0.12 ± 0.03 mg cm−2, respectively. Moreover, the amounts of Pt deposited by chemical reduction were detected and reliably measured only for tR ≥ 30 s, and resulted in 0.04 ± 0.03, 0.07 ± 0.05, and 0.09 ± 0.05 mg cm−2 for tR = 30, 60, and 90 s, respectively.Electrochemical experiments
For electrochemical testing of the Pt-modified NAMs, they were assembled as GDEs as shown in Scheme 2a. In order to provide good mechanical resistance for proper handling, the Pt-modified NAM was supported onto a PTFE plate from its uncovered side. This support had a hole at the centre to permit the intake of gas by the pores through the hydrophobic side of the membrane. A metallic strip (aluminium or copper) was then placed in contact with the Pt-covered side of the membrane and near its border (∼5 mm from the centre). This stack was stiffened using an adhesive PTFE film that contained an orifice similar and aligned to the hole at the PTFE support.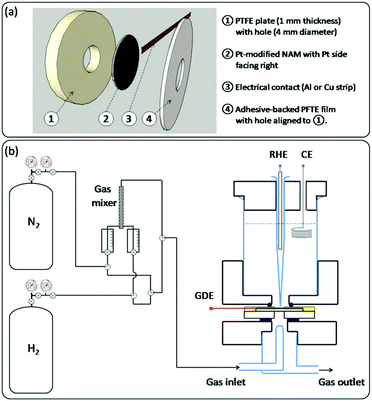 | ||
| Scheme 2 Schematics of: (a) the GDE assembly for electrochemical testing; (b) the gas feeding system (left) and the GDE-cell assembly (right). | ||
The GDEs prepared in this way were mounted on a three-electrode cell with a design similar to other setups previously reported for this type of experiment,5,18 which is described in Scheme 2b(right). The upper part of the cell contained the electrolyte and the other two electrodes, i.e. a counter electrode (CE) and a reference hydrogen electrode (RHE) placed inside a Luggin-Haber capillary. The lower part held the glass pipelines that permitted the blowing of the gas stream right over the exposed surface of the membrane. The GDEs were tightened between both cell parts with screws (not shown), ensuring a good sealing by inserting o-rings on both sides. The sketch of the gas connections that were employed to feed the cell with the gas stream is shown in Scheme 2b(left). When using pure gases (N2 or H2), the switching between them was done by turning a three-way valve, which allowed the quick evacuation of the pipelines with the new gas. When employing N2–H2 mixtures, these were made by driving the pure gases toward a gas mixer, and the flow rate of each gas was controlled by its individual flow meter. The resulting mixture was then directed to the cell.
All electrochemical experiments were carried out in quiescent 1 M HClO4 solutions, in order to evaluate the voltammetric, chronoamperometric or chronopotentiometric responses of GDEs while flowing the respective gas, either under inert conditions (N2) or for hydrogen oxidation (H2 and N2–H2 mixtures). The uncompensated resistance was estimated by using the method reported by P. He and L.R. Faulkner,15 which fits the periodic current measured when applying potential steps (±0.05 V) around a test potential (0.4 V vs. RHE) in N2-saturated solution with an RC circuit response.
Numerical simulations
The theoretical electrochemical responses of a single pore GDE operating for the hor under mass-transport limiting conditions were analyzed by numerical simulations carried out with COMSOL Multiphysics®. These simulations were done to obtain a better perception about the effects on the limiting current of pore inundation and of the electrocatalyst layer that is grown onto the pore opening. Three different scenarios were analyzed. The first one was the ideal situation where the gas/electrolyte boundary was located exactly at the pore opening (ideal type-A configuration). The second one included a certain height of electrolyte flooding the pore (partially flooded type-A configuration). The third one was a flooded pore with an electroactive layer partially covering the pore opening (type-B configuration). Details on the equations, mesh conditions, boundary conditions and on the designs of the geometric models are provided in the ESI.†3. Results and discussion
Fabrication of Pt-modified GDEs based on NAMs
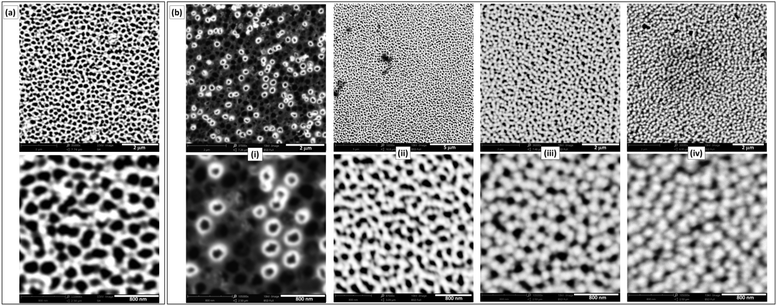
Commercially available NAMs provide one face with a relatively smooth surface and a well-defined arrangement of nanopores. For example, a commercial NAM as that shown in Fig. 1a has pores with radii rp = 110 ± 20 nm and pore surface density δp = 7.5 × 108 cm−2. Besides, they are sufficiently thin (0.1 mm thickness) and robust for a compact cell assembly, so they are good GDL candidates for this application. As NAMs are designed for filtration, flooding of the pores by the aqueous electrolyte is favoured and should be prevented for their use as GDLs, as this would increase the diffusion path length. Thus, although NAMs are naturally hydrophilic (contact angle ≅19°) as shown in Fig. 1b(left), they can be turned hydrophobic by different procedures. For example, modification of the alumina surface with silane by its immersion in a toluene-based solution of OTS and further thermal treatment provided a very durable hydrophobic surface. This was verified by the large and stable contact-angle values (158 ± 5°), as shown in Fig. 1b(right) and in the ESI.†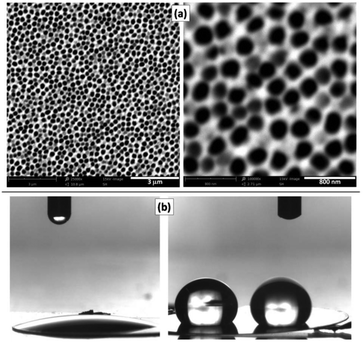 | ||
| Fig. 1 (a) SEM micrographs of the NAM surface. (b) Contact angle measurements of NAMs before (left) and after (right) hydrophobization with OTS. | ||
In order to obtain a type-A GDE configuration, the metal catalyst (Pt in this case) can be deposited onto the ordered surface of the membrane as a thin film. In this work this was done by sputtering, which led to thin (∼60 nm) and smooth films (Fig. 2a) covering just the alumina and not the pore openings. Even though the resulting pore sizes were just slightly smaller than those of the uncoated NAMs, the size dispersion was larger (rp = 90 ± 30 nm). The resulting noble metal loading was in the range 0.1–0.2 mg cm−2, which is acceptably low. For the preparation of type-B GDEs, the membranes were first coated in this same way with a metallic layer (Au/Pt in this case), just to provide a conductive surface. These electrodes were further modified to obtain a thin and porous layer of the catalyst, in this case Pt, over the pore openings by the reduction of Pt(IV) with hydrogen gas (which was filling the pores) at room temperature.17 SEM micrographs of the resulting Pt-modified NAM surfaces prepared at different tR values are shown in Fig. 2b. As the reducing agent operated right on the gas/liquid interface that was established at the pore openings, reduction occurred exclusively on this region. In this way, the load of catalyst could be reduced to just the necessary amount to catalyze the reaction of the dissolved gas that accessed through the membrane pores. In fact, the micrographs of the films obtained at very short deposition times (<10 s) show that the Pt deposits grew from the pore walls, probably catalyzed by the presence of previously sputtered Pt. Some pores were covered quickly compared to others, which may be associated with variations in the degree of penetration of the Pt-containing solution into the different pores. In a period of 15 to 30 s the surface became covered by a porous film conformed by interconnected overgrown nodules. The increase of the Pt loading was not detectable by direct weighing below these reduction times (indicating an increase of the Pt amounts in the μg ranges). Only at longer times (up to 2 min), where a continuous film was formed covering the whole surface, the amount of grown Pt was properly quantified, verifying a total increase of ∼0.1 mg cm−2 over the previous amount of Pt deposited by sputtering. Larger deposition times caused the formation of films with excessive thicknesses that detached from the NAM membrane.
The estimated ρs values varied between 25 ± 5 Ω sq−1 for type-A GDEs and 5.3 ± 0.9 Ω sq−1 for type-B GDEs (tR = 90 s). Even though these are values typical of conductive films, they indicate that the effective resistance that was established between the electrical contact and the electrode surface in the analyzed GDE assemblies was between ∼60 Ω (type A) and ∼15 Ω (type B). As will be shown below, such values caused important voltage drops when operating at high currents.
Evaluation of Pt-modified NAMs as potential fuel-cell GDEs
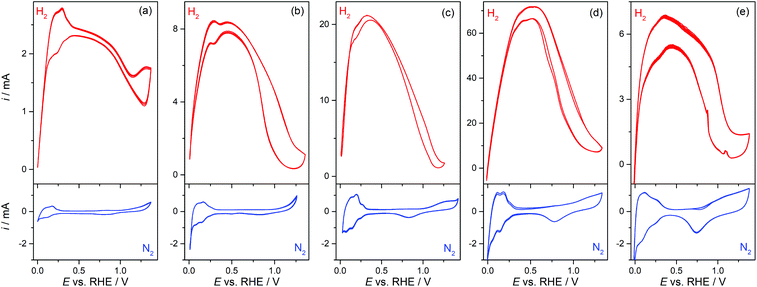
Pt-Modified NAMs were evaluated as GDEs for the hor, which is a very fast reaction on Pt19 and, in less extension, on some other noble metals such as Rh and Ir.20 Then, the hor can reach very high reaction rates on these catalysts before it becomes limited by the mass transport of dissolved hydrogen.9,21 Thus, the design of GDEs for the hor is particularly important in fuel cells, since the mass transport rate must be higher, or at least in the order, of the reaction rate.In this context, the operation of GDEs for the hor was analyzed by cyclic voltammetry and stationary current (i) vs. potential (E) polarization curves. Fig. 3 shows cyclic voltammograms (CVs) of type-A and type-B GDEs in the presence of hydrogen (up) and of nitrogen (down) at the pores. From the CVs without hydrogen, the Pt electroactive areas (AEA) and roughness factors (fR = AEA/AGEO, where AGEO = 0.13 cm2 is the geometric area) were estimated using the voltammetric charges for electro-adsorption of Hupd over the potential range 0.05 V < E vs. RHE < 0.2 V.22 The fR value for the sputtered film was quite large (fR ≅ 12), which is expected on this type of film,20 and it increased significantly upon chemical deposition of Pt from fR ≅ 30 (tR = 10 s) to fR ≅ 90 (tR = 90 s). The CVs measured in the presence of hydrogen show a response very similar to those of other previously reported membrane-based GDEs,9 with a peak (or in some cases just a shoulder) at E < 0.3 V vs. RHE, before it reached a maximum current (probably a mass-transport limiting current) that stayed for a short potential interval before falling at E > 0.5 V due to deactivation caused by the electro-oxidation of Pt.23 The maximum current that was attained in type-B GDEs increased upon the addition of Pt by localized chemical reduction, reaching values that are more than one order of magnitude larger (∼70 mA for tR = 60 s) to those verified on type-A GDEs (∼2.5 mA). However, the incorporation of an excess of Pt led to a decrease of the maximum current (∼6 mA for tR = 90 s), which was probably caused by the partial detachment of the excessively grown film or by the blocking of pores by a too compact film.
These responses were stable and repeatable along the time period of the electrochemical tests and after successive evaluations. This evidence, along with the examination of the used GDE surfaces by SEM, allowed the verification of the good chemical and mechanical stability of the deposited catalyst films. It should be remarked on that the CVs measured on all GDEs were clearly affected by resistive effects (especially in type-A GDEs), which are more evident in the H2-saturated CVs that sustained high currents. The estimated Ru values were 65 ± 10 Ω for type-A GDEs, but decreased down to 17 ± 5 Ω for type-B GDEs (tR = 90 s). As a Lugging-Haber capillary was used to avoid uncompensated resistances from the solution, the detected resistance most likely came from the thin metal film grown over the alumina membrane. This is consistent with the relatively high ρs values estimated on these films. Even though the deposition of Pt by chemical reduction over the pores improved the conductivity, it seems that such improvement still was not good enough to get rid of the resistive effects on the GDEs that supported higher currents, and should be an issue to solve for using these GDEs in microfuel cells.
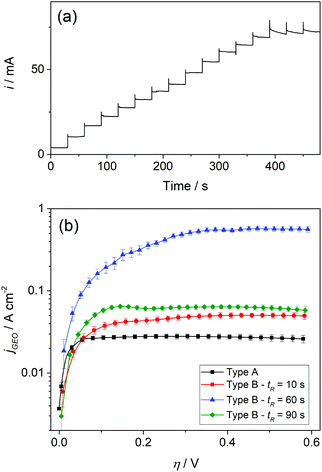
In order to evaluate the operation of GDEs in a steady state, the hor responses in chronoamperometric experiments were analyzed. Fig. 4a shows typical current–time dependences at different potentials, where it can be verified that the reaction quickly reached steady state in all cases. Thus, steady-state currents were measured at the end of each step. Moreover, Fig. 4b shows the resulting steady state polarization curves for the different electrodes in terms of the geometric current densities (jGEO = i/AGEO) vs. overpotential (η).
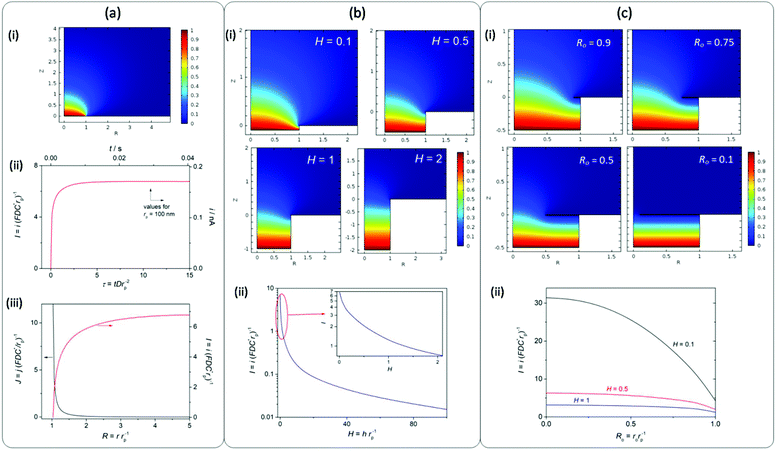
It is remarkable that high jGEO limiting values (jGEO,L), close to 0.6 A cm−2, could be sustained by type-B GDEs. In type-A GDEs this value was much smaller (jGEO,L ≅ 0.03 A cm−2), and the attainment of a steady state was a consequence of the radial diffusion of the dissolved gas at the individual pores. This can be better appreciated in the concentration profile that resulted from simulations performed on a single-pore GDE operating under mass-transport limiting conditions (Fig. 5a-i). These simulations also indicate the reaching of a steady-state limiting current whose value is iL = 6.75 × (FDC*rp) (Fig. 5a-ii), which for a 100 nm radius pore leads to iL = 1.7 × 10⁻¹⁰ A (adopting F = 96![[thin space (1/6-em)]](https://www.rsc.org/images/entities/char_2009.gif) 484 C mol−1, D = 3.7 × 10⁻⁵ cm2 s−1 and C* = 7.1 × 10⁻⁷ mol cm−3 for dissolved H2).24 These simulations also show that, under diffusion controlled conditions, the current density decreases exponentially from the pore border toward the catalyst surface, and becomes almost negligible at a distance from the pore center of ∼4rp.
484 C mol−1, D = 3.7 × 10⁻⁵ cm2 s−1 and C* = 7.1 × 10⁻⁷ mol cm−3 for dissolved H2).24 These simulations also show that, under diffusion controlled conditions, the current density decreases exponentially from the pore border toward the catalyst surface, and becomes almost negligible at a distance from the pore center of ∼4rp.
In the analyzed NAM membrane-based GDEs, the pore surface density was δp ≅ 7.5 μm−2, which would lead to a diffusion limiting current density jGEO,L = 0.13 A cm−2 (for rp = 100 nm). This value is much larger than those verified on type-A GDEs (around 0.03 A cm−2). However, as the pores in the membranes were slightly smaller than the nominal 100 nm radius value and they were typically spaced between 80 and 300 nm border-to-border distances (between 2.5rp and 5rp), partial overlap of the diffusion domains should be expected, which would cause a decrease of the whole current density.
Another phenomenon that a priori should affect the current at each individual pore, and so the whole GDE response, is the partial flooding of the pore with an electrolyte. Even though the coating of the NAM with Pt by sputtering was mostly superficial, as the deposition occurred from the gas phase, it is likely that part of the internal pore intakes would also be covered, thus losing its hydrophobic character. Then, the electrolyte may have penetrated to an uncertain deepness into the pores, causing an increase of the diffusion length of dissolved hydrogen into the pore volume before reaching the surface. In order to obtain a better perception of the effect of this new diffusion path, simulations of mass transport were performed on a single-pore GDE partially filled with varied electrolyte lengths (h) normalized with respect to the pore radius (H = h/rp). Fig. 5b shows some of the simulated concentration profiles and the resulting limiting current at a single pore as a function of H. These results indicate that the high current density that can be attained by radial diffusion on a single pore is dramatically lost when the electrolyte penetrates into the pore, causing an exponential drop of the current as the deepness increases. More specifically, for H values larger than 2rp the current decreases by more than one order of magnitude. Thus, even though the overlapping of concentration profiles on the NAM-based GDEs would explain a decrease of the current density, it is most likely that the low jGEO,L measured values (significantly lower than the theoretical value calculated for an ideal type-A GDE) were caused by the partial flooding of pores with the electrolyte. Thus for example, assuming that the type-A GDE whose jGEO(η) response is shown in Fig. 4b was completely uniform, the iL values on each single pore result in iL = jGEO,L/δp ≅ 4 × 10⁻¹¹ A (i.e. I = 1.58), which corresponds to 100 nm radius pores filled down to h ≅ 70 nm. This result remarks the importance of performing an efficient hydrophobization of the NAM.
On the other hand, the pores in type-B GDEs were partially or totally covered by a porous and thin layer of catalyst that grew from the edges toward the centre of the pores. Assuming that these pores were partially flooded, the radial mass transport of the dissolved gas toward the bulk solution should be combined with the linear diffusion that was established at the thin layer of electrolyte between the gas/liquid interface and the catalyst layer. As a limiting case, in GDEs that were totally covered by a porous Pt film, the mass-transport limiting current was determined just by the linear diffusion in the thin layer cell (TLC) inside the pores. These situations were simulated for different stages of film development from a radius of the pore opening (ro) close to the pore radius (Ro = ro/rp ≅ 1) to an almost completely covered pore (Ro ≅ 0). Fig. 5c-i shows some of the simulated concentration profiles that illustrate the transition from a purely radial diffusion to a TLC linear diffusion confined inside the pore.
As can be seen in Fig. 5c-ii, the resulting current strongly depends on Ro, and this dependence becomes particularly strong for small H values. For example, for H = 0.1 (10 nm deepness in a pore with 100 nm radius) the current increases almost five times in a totally covered pore. In fact, for a purely TLC linear diffusion the current density is inversely proportional to the diffusion distance,25 which in this case leads to a normalized current I = π/H. This result explains the reason why the limiting current significantly raised as Pt was increasingly deposited on the pore openings from their borders. It should be noted that the highest limiting current density that was attained with these GDEs was ∼0.6 A cm−2 (tR = 60 s), which leads to a single-pore current close to 0.8 nA (I ≅ 32). Such a high value could be explained, for example, assuming a mostly covered pore (Ro → 0) filled with a liquid height lesser than 10 nm (H < 0.1). However, when increasing the deposition time (and so the amount of Pt) a decrease of the limiting current was verified, which is probably caused by the partial detachment of the film or by the blocking of pores by a too compact film.
Evaluation of Pt-modified NAMs as gas sensor GDEs
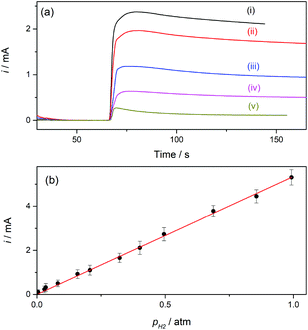
Hydrogen sensors are being increasingly required in a number of technologies, for example for implementing security protocols in H2 handling and transportation, in process control, in monitoring operation of fuel cells and water electrolyzers, and in biomedical diagnosis.26 The expected range of utility varies, according to the application, from the detection of trace amounts (in the order of ppm) to concentrations around the lower and higher explosive levels (∼4% in air to near 95%). Electrochemical H2 sensors have the advantages of good response time, simplicity and low operation cost; although some issues related to detection limit, contamination, long-term stability, and selectivity still need development.12 Particularly while amperometric sensors with a proper design have proved to reach ppm detection levels,27 potentiometric sensors provide good response at high concentrations.12,28Gas sensors that are based on a Clark-type configuration employ permeable membranes for separating the analyzed gas phase from the electrochemical cell.3,7,12 Pt-Modified NAM based GDEs can be used as a sensor component that integrates the membrane with the detector electrode. As these GDEs are capable of providing very high currents, the sensitivity and detection limit should be increased. In addition, another feature that becomes quite relevant and should be properly evaluated when using GDEs in gas sensors is the response time. Thus, this parameter was evaluated by chrono-experiments while changing the flowing gas from the reactive gas (H2) to an inert gas (N2), and vice versa. Some chronoamperometric curves measured on type-B GDEs are shown in Fig. 6. It is verified that, independent of the amount of Pt, as soon as the gas was varied the current rapidly changed reaching almost 90% of the steady-state value in less than two seconds. As the diffusion of dissolved gas was very fast, this response was probably mostly governed by the time required to evacuate the previous gas from the feeding chamber and to attain a stable gas concentration at the pore inlet. The limiting current registered, in this case at 0.5 V vs. RHE, should be linearly proportional to the concentration of dissolved H2, and so to the partial pressure of H2 (pH2). In order to evaluate this dependence, the GDEs were fed with H2–N2 mixtures at P = 1 atm with variable pH2 values over the range 0.001 ≤ pH2 (atm) ≤ 1.
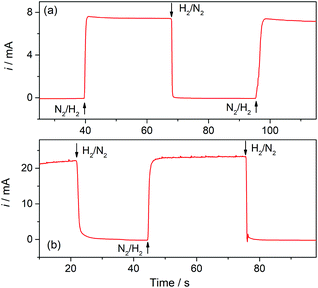 | ||
| Fig. 6 Current–time dependences registered on type-B Pt-modified NAM GDEs in 1 M HClO4 at E = 0.5 V vs. RHE while switching the flowing gas between H2 and N2 at 1 atm. tR = 10 s (a); 30 s (b). | ||
For a better appreciation of the smallest possible value that can be detected, a background current measured under a constant flow of pure N2 was first measured, and the mixture was then introduced by adding to this stream a controlled flow of H2 using a gas mixer. The current–time dependences registered on a type-B GDE while changing the feeding gas from pure N2 to different H2–N2 mixtures are shown in Fig. 7a. Upon starting the feeding of the GDE with the H2–N2 mixture the current increased, reached a maximum value in less than 10 s, and then slowly decreased before reaching a steady value after more than one minute. This current drop probably occurred during the time required to attain a stabilized H2 concentration in the gas flow. The lowest pH2 value that produced a detectable and quantifiable current change (over the background current) after the stabilization time was 0.005 atm, and a linear i(pH2) dependence was verified, as shown in Fig. 7b.
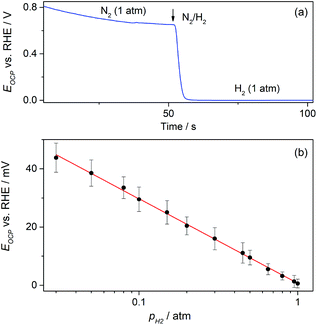
On the other hand, the possible application of these GDEs as potentiometric gas sensors was explored by examining the time response of the open circuit potential (EOCP) upon changing the flowing gas. A typical chronopotentiometric response is shown in Fig. 8a. It indicates that under N2 the EOCP of the GDE was quite undefined and variable over the range 0.6 V < EOCP < 0.8 V, but it quickly moved down as H2 was supplied, and reached a stable value in a few seconds. This value corresponds to the equilibrium potential of the hydrogen electrode reaction (HER) for pH2 = 1 atm (0 V vs. RHE). This suggests that under H2 the EOCP value is mostly governed by the catalyst surface that comes into contact with dissolved H2.
It is expected that, as the HER is a fast reaction on Pt, the potentiometric sensing of H2 should be feasible by relating the EOCP value to pH2 directly by the Nernst equation. Fig. 8b shows that, as expected, the EOCP value was indeed affected by pH2, and a Nernstian dependence of EOCP on pH2 (slope ≅59 mV dec−1) was accomplished for pH2 ≥ 0.03 atm. This evidence demonstrates that these Pt-modified NAM-based GDEs can be used as potentiometric H2 sensors with fast response time and over a wide concentration range. The use of an electrocatalyst other than Pt is feasible, provided that the HER be fast enough to be capable of defining a stable and Nernstian equilibrium potential. For example, other noble metals such as Ir, Rh, and Pd thin films22,29 define the HER equilibrium potential and could be used as electrocatalysts in these NAM-based H2 potentiometric sensors.
4. Conclusions
Gas diffusion electrodes based on hydrophobized nanoporous alumina membranes should be capable of performing very efficiently as gas diffusion layer/electrodes in microfuel cells and as components of Clark-type gas sensors that integrate the membrane and the detector electrode. In this work the operation of these electrodes containing Pt as the electrocatalyst was demonstrated both for oxidizing (fuel-cell anode, amperometric sensor) and for detecting (potentiometric sensor) H2 gas. A particular method was developed for depositing Pt in a localized way exactly over the pore openings, so the dissolved gas can reach the active sites immediately after dissolution.It was shown that these electrodes defined steady-state currents for hydrogen oxidation, which were caused by a combination of radial diffusion from the gas inlet at the pore opening toward the adjacent electrocatalyst film, with a linear diffusion established in the thin layer of electrolyte that flooded the pores. This configuration is quite advantageous for attaining very high current densities, as its value is mostly governed by the deepness of electrolyte into the pores (through an inverse relationship), which can be reduced to a few tens of nanometers by a proper hydrophobization of the membrane. The use of these GDEs in microfuel cells still demands optimization of the design. On the one hand, even though the noble metal loading was not high (0.1–0.3 mg cm−2), it still can be significantly decreased by using other reported strategies for Pt deposition.9,30 Besides, the configuration that was used in this work showed non-negligible resistive contributions. The conductivity of the thin metal layer that is deposited by sputtering onto the membrane as a first step seems to be insufficient. A possible way to overcome this issue is to incorporate an additional porous layer of graphite on top of the catalyst deposit, instead of using the metal layer (also decreasing in this way the noble metal loading).
Amperometric and potentiometric Clark-type hydrogen sensors that employed these GDEs showed excellent response times (due to the low diffusion path of dissolved gas) and good stability. The first ones also presented very low detection limits (due to the high currents). The detection of other gases with sensors based on these GDEs involves challenges that are particular for each gas. For example, the oxygen reduction demands more attention on the catalyst nature, as no catalyst defines the equilibrium potential of this electrode reaction at room temperature (which turns challenging the potentiometric detection of oxygen). A similar situation would occur for detecting CO2 through its electro-reduction.
Conflicts of interest
There are no conflicts to declare.Acknowledgements
This work was supported by Fondo para la Investigación Científica y Tecnológica (PICT 2017 1340), Consejo Nacional de Investigaciones Científicas y Técnicas (PIP 112-201101-00674 and PUE 229-201801-00008 CO) and Universidad Nacional del Litoral (CAI+D 501-201101-00333 LI). Special thanks are given to Gisela Luque for her assistance in contact angle measurements.Notes and references
- A. Jayakumar, Front. Energy, 2019, 13, 325–338 CrossRef; A. E. W. Horst, K.-M. Mangold and D. Holtmann, Biotechnol. Bioeng., 2015, 113, 260–266 CrossRef.
- K. Liu, W. A. Smith and T. Burdyny, ACS Energy Lett., 2019, 4, 639–643 CrossRef CAS.
- R. Knake, P. Jacquinot, A. W. E. Hodgson and P. C. Hauser, Anal. Chim. Acta, 2005, 549, 1–9 CrossRef CAS; J. R. Stetter and J. Li, Chem. Rev., 2008, 108, 352–366 CrossRef; T. Li, Y. Wu, J. Huang and S. Zhang, Sens. Actuators, B, 2017, 243, 566–578 CrossRef.
- S. Tanaka, WIREs Energy Environ., 2013, 2, 350–362 CrossRef CAS; D. C. Walther and J. Ahn, Prog. Energy Combust. Sci., 2011, 37, 583–610 CrossRef.
- M. Inaba, A. W. Jensen, G. W. Sievers, M. Escudero-Escribano, A. Zana and M. Arenz, Energy Environ. Sci., 2018, 11, 988–994 RSC; A. R. Kucernak and C. Zalitis, J. Phys. Chem. C, 2016, 120, 10721–10745 CrossRef CAS.
- G. Gautier and S. Kouassi, Int. J. Energy Res., 2015, 39, 1–25 CrossRef CAS.
- M. J. Tierney, H. O. L. Kim, M. Madou and T. Otagawa, Sens. Actuators, B, 1993, 13–14, 408–411 CrossRef CAS; M. J. Tierney and H. O. L. Kim, Anal. Chem., 1993, 65, 3435–3440 CrossRef.
- L. R. Jordan, P. C. Hauser and G. A. Dawson, Anal. Chem., 1997, 69, 558–562 CrossRef CAS.
- C. M. Zalitis, D. Kramer and A. R. Kucernak, Phys. Chem. Chem. Phys., 2013, 15, 4329–4340 RSC; C. M. Zalitis, J. Sharman, E. Wright and A. R. Kucernak, Electrochim. Acta, 2015, 176, 763–776 CrossRef CAS.
- H. Masuda, H. Yamada, M. Satoh, H. Asoh, M. Nakao and T. Tamamura, Appl. Phys. Lett., 1997, 71, 2770–2772 CrossRef CAS; A. P. Li, F. Müller, A. Birner, K. Nielsch and U. Gösele, J. Appl. Phys., 1998, 84, 6023–6026 CrossRef; C. T. Sousa, D. C. Leitao, M. P. Proenca, J. Ventura, A. M. Pereira and J. P. Araujo, Appl. Phys. Rev., 2014, 1, 031102 Search PubMed.
- A. Santos, T. Kumeria and D. Losic, Trends Anal. Chem., 2013, 44, 25–38 CrossRef CAS; J. Ferré-Borrull, J. Pallarès, G. Macías and L. F. Marsal, Materials, 2015, 7, 5225–5253 CrossRef; D. Ding, Z. Chen, S. Rajaputra and V. Singh, Sens. Actuators, B, 2007, 124, 12–17 CrossRef; F. Biró, G. Z. Radnóczi, M. Takács, Z. Baji, C. Dücső and I. Bársony, Procedia Eng., 2016, 168, 1148–1151 CrossRef.
- G. Korotcenkov, S. D. Han and J. R. Stetter, Chem. Rev., 2009, 109, 1402–1433 CrossRef CAS PubMed; J. Erusappan, M. Nachimuthu and R. Cheruvary, ChemistrySelect, 2019, 4, 4775–4784 CrossRef.
- L. Navarro, R. J. Minari, N. Ceaglio, M. Masin and S. E. Vaillard, J. Polym. Sci., Part A: Polym. Chem., 2018, 56, 1199–1209 CrossRef CAS.
- ASTM D4496-13, Standard Test Method for D-C Resistance or Conductance of Moderately Conductive Materials, ASTM International, West Conshohocken, PA, 2013 Search PubMed.
- P. He and L. R. Faulkner, Anal. Chem., 1986, 58, 517–523 CrossRef CAS.
- D. T. Ngo, T. Sooknoi and D. E. Resasco, Appl. Catal., B, 2018, 237, 835–843 CrossRef CAS.
- E. Santacesaria, C. Galli and S. Carrà, React. Kinet. Catal. Lett., 1977, 7, 361–366 CrossRef CAS; N. Miyashita, T. Yasuda and H. Kiuchi, Shigen to Sozai, 1994, 110, 1089–1093 CrossRef.
- M. C. Campagnolo, C. A. Marozzi, A. C. Chialvo and M. R. Gennero de Chialvo, J. Power Sources, 2013, 239, 207–216 CrossRef CAS.
- P. M. Quaino, M. R. Gennero de Chialvo and A. C. Chialvo, Electrochim. Acta, 2007, 52, 7396–7403 CrossRef CAS.
- M. A. Montero, J. L. Fernández, M. R. Gennero de Chialvo and A. C. Chialvo, J. Power Sources, 2014, 254, 218–223 CrossRef CAS; M. A. Montero, J. L. Fernández, M. R. Gennero de Chialvo and A. C. Chialvo, J. Phys. Chem. C, 2013, 117, 25269–25275 CrossRef.
- S. Chen and A. Kucernak, J. Phys. Chem. B, 2004, 108, 13984–13994 CrossRef CAS.
- R. Woods, J. Electroanal. Chem., 1974, 49, 217–226 CrossRef CAS.
- M. S. Rau, M. R. Gennero de Chialvo and A. C. Chialvo, J. Power Sources, 2013, 229, 210–215 CrossRef CAS.
- M. Auinger, I. Katsounaros, J. C. Meier, S. O. Klemm, P. U. Biedermann, A. A. Topalov, M. Rohwerder and K. J. J. Mayrhofer, Phys. Chem. Chem. Phys., 2011, 13, 16384–16394 RSC.
- J. L. Fernández, J. Electroanal. Chem., 2010, 650, 90–97 CrossRef.
- S. K. Arya, S. Krishnan, H. Silva, S. Jeana and S. Bhansali, Analyst, 2012, 137, 2743–2756 RSC; W. J. Buttner, M. B. Post, R. Burgess and C. Rivkin, Int. J. Hydrogen Energy, 2011, 36, 2462–2470 CrossRef CAS; T. Hübert, L. Boon-Brett, G. Black and U. Banach, Sens. Actuators, B, 2011, 157, 329–352 CrossRef.
- M. Rashid, A. Hussain, M. Shoaib, M. A. Basit, H. Khan and Y. S. Kim, J. Electroanal. Chem., 2019, 833, 173–180 CrossRef CAS; D.-D. La, C. K. Kim, T. S. Jun, Y. Jung, G. H. Seong, J. Choo and Y. S. Kim, Sens. Actuators, B, 2011, 155, 191–198 CrossRef; Y.-C. Weng and K.-C. Hung, Sens. Actuators, B, 2009, 141, 161–167 CrossRef; M. Sakthivel and W. Weppner, J. Solid State Electrochem., 2007, 11, 561–570 CrossRef.
- E. Siebert, S. Rosini, R. Bouchet and G. Vitter, Ionics, 2003, 9, 168–175 CrossRef CAS; N. Maffei and A. K. Kuriakose, Sens. Actuators, B, 2004, 98, 73–76 CrossRef.
- M. S. Rau, P. M. Quaino, M. R. Gennero de Chialvo and A. C. Chialvo, Electrochem. Commun., 2008, 10, 208–212 CrossRef CAS.
- M. Mougenot, A. Caillard, P. Brault, S. Baranton and C. Coutanceau, Int. J. Hydrogen Energy, 2011, 36, 8429–8434 CrossRef CAS.
Footnote |
| † Electronic supplementary information (ESI) available: Details of contact angle evaluation and of the models for digital simulations. See DOI: 10.1039/c9an01882d |
| This journal is © The Royal Society of Chemistry 2020 |

