 Open Access Article
Porous tal palm carbon nanosheets: preparation, characterization and application for the simultaneous determination of dopamine and uric acid
A. J. Saleh
Ahammad
 *a,
Noyon
Odhikari†
a,
Syed Shaheen
Shah†
b,
Md. Mahedi
Hasan
 a,
Tamanna
Islam
 a,
Poly Rani
Pal
a,
Mohammed Ameen
Ahmed Qasem
b and
Md. Abdul
Aziz
*b
a,
Poly Rani
Pal
a,
Mohammed Ameen
Ahmed Qasem
b and
Md. Abdul
Aziz
*b
aDepartment of Chemistry, Jagannath University, Dhaka 1100, Bangladesh. E-mail: ajsahammad@chem.jnu.ac.bd; Fax: +880 2 7113713; Tel: +880 2 9583794
bCenter of Research Excellence in Nanotechnology, King Fahd University of Petroleum and Minerals, Dhahran 31261, Saudi Arabia. E-mail: maziz@kfupm.edu.sa; Fax: +966-13-860-7264; Tel: +966-13-860-3744
First published on 4th October 2018
Abstract
A novel porous tal palm carbon nanosheet (PTPCN) material was synthesized from the leaves of Borassus flabellifer (tal palm) and used for developing an electrochemical sensor through modifying a glassy carbon electrode (GCE) simply by drop-casting on it a solution of the material for the sensitive simultaneous detection of dopamine (DA) and uric acid (UA), even in the presence of interfering species. The drop-casting solution was prepared by simply dispersing the PTPCNs in ethanol without using any other binding materials (e.g. Nafion). The surface morphologies of the PTPCNs were studied through field-emission scanning electron microscopy (FESEM), transmission electron microscopy (TEM) and high resolution TEM (HRTEM). Energy dispersive X-ray spectroscopy (EDS) and X-ray diffraction spectroscopy (XPS) studies revealed the chemical composition of the PTPCNs' surface. Their structural properties were studied using X-ray diffraction (XRD) and Raman spectroscopy. Brunauer–Emmett–Teller (BET) analysis confirmed the surface area and pore volume to be 1094.53 m2 g−1 and 0.74 cm3 g−1, respectively, while Barrett–Joyner–Halenda (BJH) pore-size distribution showed the average pore size to be 22 nm. The sufficiently large surface area and pore-size distribution suggested better electrocatalytic properties compared to the average modifying materials. The modified electrode (PTPCNs/GCE) was characterized through impedimetric and CV techniques in standard potassium ferricyanide solution for evaluating their charge-transfer resistance and electrochemical properties. The limits of detection (S/N = 3) were 0.17 μM and 0.078 μM and the sensitivities were 1.2057 μA μM−1 cm−2 and 2.693 μA μM−1 cm−2 for UA and DA, respectively. The possible interactions that took place between the PTPCNs and the analytes that aided in the enhancement of the electroanalytical performance of the PTPCNs/GCE are discussed based on the experimental findings and established theoretical concepts. The PTPCNs/GCE was successfully employed for analyzing real samples, like dopamine injection and urine.
1. Introduction
Dopamine (DA) is an organic catecholamine generally produced in the substantia nigra region of the central nervous system and serves as a neurotransmitter by means of sending signals from the midbrain to the other parts.1 The midbrain DA is projected to almost all regions of the human brain, including the nucleus accumbens, dorsal striatum and cortical areas via dopaminergic pathways or neurons, each of which has different neuropsychiatric functions, including human cognition, reward-motivated actions (desire, wanting, pleasure, etc.), motor nerve control as well as hormonal balance by controlling their release.2–4 Uric acid (UA), on the other hand, is an important natural antioxidant that primarily lessens the damage to neurons resulting from oxidative stress as well as DNA damage.5 Precursor metabolized purines form UA in the liver, intestine and muscles and exists mostly in urine, blood serum and brain tissue.6 Dysfunctions in the human body due to altered levels of DA and UA are linked to several health issues. For instance, Parkinson's, a neurodegenerative disease that causes motor disability, is the result of neuron death that hinders the generation of dopamine in the midbrain.7 It has been demonstrated that a reduced level of UA in the caudate of the midbrain accelerates DA oxidation, which eventually increases the risk of Parkinson's disease.7 Another neurological disorder, Alzheimer's, responsible for dementia and aging, is caused by the significant reduction of DA and its metabolites in the midbrain.2 An increased level of UA in blood serum is responsible for hyperuricemia and pneumonia as well as gout formation.6 DA concentration in extra cellular fluid is as low as 0.01–1 μM, while the normal UA level in the caudate of the brain is approximately 100 μM.8,9 However, their detection in such low levels is a challenging task for scientists since they coexist in the midbrain region along with other interferents, mainly ascorbic acid (AA). Electrochemical methods have come into the limelight in contrast to other spectroscopic, chromatographic or high-performance liquid chromatography (HPLC) methods, for the detection of analytes in the micro or nano level with high accuracy because of their foremost sensitivity, quick response time, cost effectiveness and negligible interference by other substances.10 Both DA and UA are electroactive species, which is a precondition for species to be detected by electrochemical methods. However, bare electrodes often exhibit poor reproducibility, a surface fouling effect and may ultimately fail to separate individual identities during concurrent detection.11Various modifiers, such as precious metal nanoparticle-modified carbon materials,8 reduced graphene oxide,10 graphene oxide,11 conducting polymer,12 carbon nanotube13 and porous carbon materials,14,15 have been reported for the modification of conventional electrodes. Among all of the above-stated materials, porous carbon has been most widely utilized as an electrode modifier. The preparation of porous carbon from biomass has been attracting widespread attention due to their novel properties. Though various type of porous carbon have been developed from different biomasses, such as disposable wastes, foods, plants, agricultural and animal products, the search for new sources (biomass) for the preparation of different types of porous carbon is still ongoing for different applications.16
Tal palm (Borassus flabellifer) from the Arecaceae family is an ancient plant. It is mainly found in Asian countries, such as Malaysia, Sri Lanka, Thailand, Myanmar, India and Bangladesh. Tal palm produces numerous products, like juice, sugar, mature nuts, flowers, sweet fruit pulp and seed-shoots. Recently, Sivachidambaram et al.17 reported the preparation of activated carbon with a BET surface area of 633.43 m2 g−1 from tal palm flower for supercapacitor applications. However, there are no reports in the literature regarding the preparation of porous carbon materials with a high BET surface area > 1000 m2 g−1 from tal palm leaves for electrochemical sensing applications. In ancient days, the leaves of tal palm were mainly used as a writing material and for making umbrellas, mats, hats, fans, thatching and baskets.18 However, in modern days, the tal palm leaves are thrown away to the soil, where they undergo degradation without any effective utilization. Hence, if the leaves of tal palm could be utilized as a starting material to prepare a porous carbon framework for electrochemical sensing applications, this would remarkably reduce the costs and minimize waste.
Several synthetic methods have been employed by researchers to obtain porous carbon with a high surface area.19,20 However, porous carbon can be prepared simply by carbonizing biomass using chemical and physical activating agents. The key role for using activating agents is to produce the required porosity, to increase the surface area and to make better sensing performance materials. Different kinds of activating agents, like H3PO4, NaOH, ZnCl2, K2CO3, KHCO3 and KOH, have been used for the preparation of carbon materials with a porous structure from different carbon sources.21–23 Recently, Anjon et al.24 showed the preparation of porous carbon sheets from eucalyptus leaves using KHCO3 as an activating agent and 850 °C as the standard carbonization temperature. Keeping this in mind, we attempted to develop new carbon materials as an electrode modifier for the simultaneous detection of DA and UA.
Herein, we report the preparation of porous carbon nanosheets from the leaves of tal palm. NaHCO3 was used as an activating agent as it is mostly known to be inexpensive, safe and nontoxic. The prepared porous tal palm carbon nanosheets (PTPCNs) were characterized by transmission electron microscopy (TEM), field-emission scanning electron microscopy (FESEM), energy dispersive spectroscopy (EDS), Raman spectroscopy, X-ray diffraction (XRD) spectroscopy and BET surface area analysis. The dispersed PTPCNs (in ethanol) were used as a modifier of a GCE through a simple drop-casting process without adding any other binding material. Finally, the modified electrode (PTPCNs/GCE) was applied for the first time for the sensitive and simultaneous electrochemical determination of DA and UA in the presence of interferents, mainly ascorbic acid (AA).
2. Experimental section
2.1. Materials
Leaves of tal palm (Borassus flabellifer) were first collected from the west side of Mominpur, Keshabpur, Jessore, Bangladesh. Dopamine hydrochloride, L-ascorbic acid, uric acid, sodium monobasic phosphate (NaH2PO4), sodium dibasic phosphate (Na2HPO4), ethanol, potassium ferricyanide [K3Fe(CN)6], potassium chloride (KCl), sodium bicarbonate (NaHCO3), sodium hydroxide (NaOH) and hydrochloric acid (HCl) were obtained from Sigma-Aldrich. All the reagents were of analytical grade and used as collected without any change. The nitrogen (N2) gas with a purity of 99.99% was provided by the SCG gas supply centre, Jubail, Kingdom of Saudi Arabia. De-ionized (DI) water, obtained from a water purification system (Barnstead Nanopure, Thermo Scientific, USA), was used in the whole experiment. Phosphate buffer solution (PBS) (0.1 M with pH 7.0) was used as the support electrolyte during the electrochemical experiments and was prepared by mixing Na2HPO4 and NaH2PO4 (0.1 M of each) unless stated otherwise.2.2. Preparation of porous tal palm carbon nanosheets (PTPCNs)
The leaves of tal palm were cleaned with DI water and cut into small pieces. The cleaned tal palm leaves were dried in an electric oven at 100 °C for 24 h. By using a household blender, the dried leaves were pulverized to powder and then passed through 100-micron mesh sieves for collecting the fine powder with a particle size of ≤100 micron. A specific amount (2 g) of the collected fine powders were mixed with sodium bicarbonate (NaHCO3) in a mortar and pestle with a mass ratio of 1![[thin space (1/6-em)]](https://www.rsc.org/images/entities/char_2009.gif) :
:![[thin space (1/6-em)]](https://www.rsc.org/images/entities/char_2009.gif) 4. The uniformly mixed fine powders were carbonized in a tube furnace at 850 °C for 5 h under a nitrogen atmosphere. The final products after carbonization were washed with 0.5 M HCl (two times), with DI water (three times), and then dried overnight at 60 °C to obtain the PTPCNs. Scheme 1 shows the preparation process of the PTPCNs.
4. The uniformly mixed fine powders were carbonized in a tube furnace at 850 °C for 5 h under a nitrogen atmosphere. The final products after carbonization were washed with 0.5 M HCl (two times), with DI water (three times), and then dried overnight at 60 °C to obtain the PTPCNs. Scheme 1 shows the preparation process of the PTPCNs.
2.3. Electrode modification
Approximately 0.5 mg of PTPCNs was dispersed in 3 mL of ethanol solution by sonicating for half an hour. Once a uniformly dispersed solution was obtained, drop-casting was carried out using a micropipette. Before that, the GCE was polished thoroughly with a polishing cloth using 0.5 μm slurry of alumina. Any trace of the slurry was removed from the GCE by washing it with excess DI several times. Finally, we modified the GCE using 5 μL of the dispersed solution through drop-casting and then dried it in the open air at room temperature. We used 5 μL of the PTPCNs solution as this showed a minimum charging current and maximum response towards the analytes. The PTPCNs/GCE preparation process is shown in Scheme 2.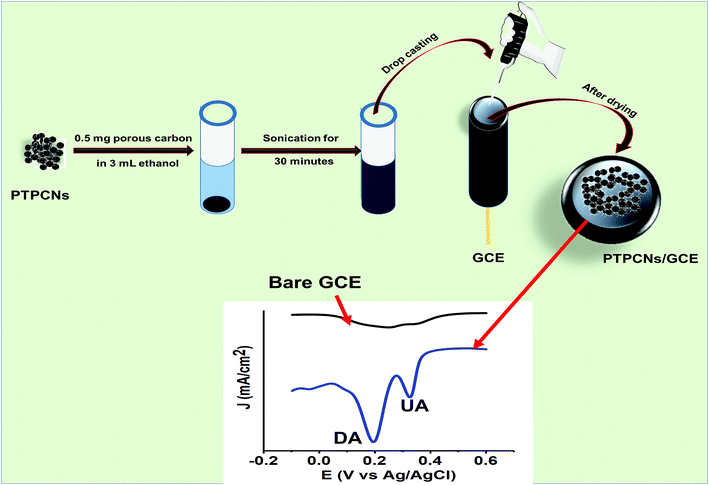 | ||
| Scheme 2 Schematic representation of the procedure used to prepare the PTPCNs/GCE and its electrochemical response to DA and UA. | ||
2.4. Instrumentation
FESEM (TESCAN LYRA 3, Czech Republic) was performed to obtain the FESEM images, with an Oxford Instruments Xmass detector equipped with the FESEM used for the energy dispersive X-ray spectra (EDS). Transmission electron microscopy (TEM) (JEM-2011; JEOL) was used to obtain the TEM images. A iHR320 with CCD detector, HORIBA, Raman spectrometer equipped with green laser (300 mW), excitation wavelength λo = 532 nm, was used for the study and detection of the graphite structure in the synthesized materials. X-ray diffraction analysis and chemical analysis of the prepared porous carbon nanosheets were achieved by means of a high-resolution Rigaku Ultima IV X-ray diffractometer equipped with Cu-K (alpha) radiation, and an XPS equipped with an Al K-alpha micro-focusing X-ray monochromator (ESCALAB 250Xi XPS Microprobe, Thermo Scientific, USA), respectively. Micromeritics ChemiSorb 2750 was used for the BET and BJH Analysis to measure the surface area and pore size of the porous carbon nanosheets. A Power Sonic 603 ultrasonic cleaner was used for sonication. All the voltammetric and impedimetric experiments were done on a single potentiostat (CHI 660E instrument, USA). Bare GCE and PTPCNs/GCE as the working electrode, Ag/AgCl (3 M KCl) as the reference electrode and Pt wire as the counter electrode were utilized for the three electrode system.3. Results and discussions
3.1. Characterization of the PTPCNs
Fig. 1(A–C) show the FESEM morphology of carbon prepared from tal palm leaves. These FESEM micrographs show that the as-prepared sample consisted of interconnected nanosheet structures. Fig. 1(B) and (C) clearly indicate a very regular nanosheet structure interconnected with each other with numerous pores. These well-organized interconnected porous carbon nanosheets are useful for the fast diffusion of an electrolyte throughout the electrochemical sensing applications. Fig. 1(D) shows the corresponding EDS spectrum, obtained from the indicated position of Fig. 1(B). These results show the presence of a pure elemental composition of carbon and oxygen only. The presence of extra elements, Sn and Si, in the EDS spectrum were due the fluorine doped tin oxide (FTO)-coated glass used as a substrate for the sample preparation of the EDS analysis.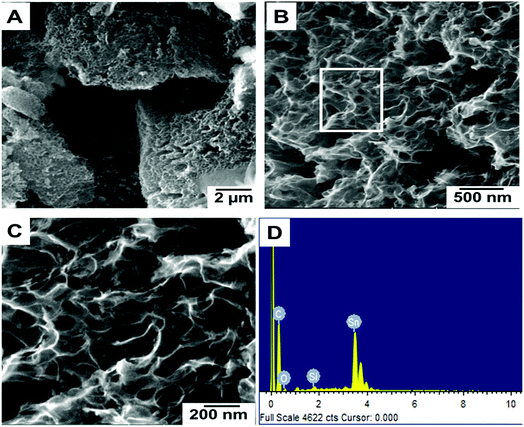 | ||
| Fig. 1 Different magnified FESEM images (A–C) of carbon nanosheets prepared from tal palm leaves. (D) is the corresponding EDS spectrum recorded from the white marked area of (B). | ||
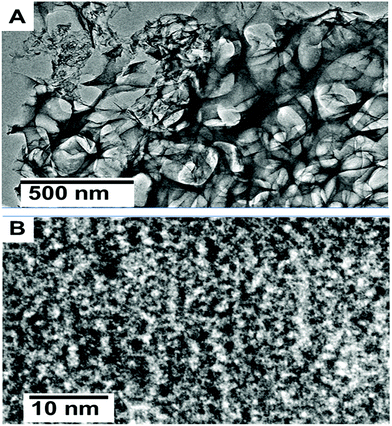
The carbon nanosheets with a porous morphology were further characterized by transmission electron microscopy (TEM). Fig. 2(A) shows the low magnified TEM image, which reveals the architecture of the interconnected nanosheets, which clearly highlight the huge amounts of channels and pores. Furthermore, large quantities of mesopores can be clearly observed in Fig. 2(B). These carbon nanosheets with interconnected properties and a porous nature can provide a promising route for sensing applications due to the easily diffusion of electrolyte ions. This behaviour is significant for fast ion transfer in sensing applications.25
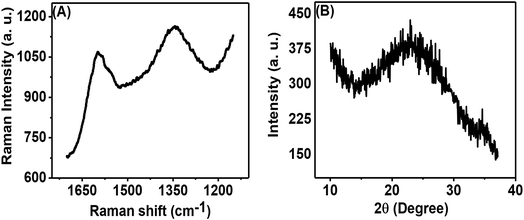
Fig. 3(A) shows the Raman spectrum of the porous carbon phase, which is composed of two peaks: the first peak in the range of 1580 to 1620 cm−1, called the G-band, and the second peak in the range of 1320 to 1360 cm−1, called the D-band. These bands appear from the sp2 hybridized carbon structure and are related to graphitic carbon. The obtained ID/IG (ID signifies the intensity of the D band and IG denotes the intensity of the G band) was 0.933. This high intensity ratio indicated the presence of a significant amount of disordered carbon in the prepared porous carbon nanosheets. The physical properties of carbon nanosheets are mainly dependent on C to C bonds.8Fig. 3(B) shows the XRD pattern of the porous carbon nanosheets prepared from tal palm leaves at 850 °C. The broad diffraction peak occurring in the 2θ range of 14° to 33° can be attributed to the typical activated carbon/amorphous carbon structure.26 However, a tiny and sharp peak at ∼23° on top of the broad peak indicates the presence of a small amount of graphitic carbon.
X-ray photoelectron spectroscopy (XPS) analysis was performed to examine the elemental composition of the prepared porous carbon nanosheets, which were heat-treated at 850 °C. All the XPS spectra were corrected with respect to the standard C1s peak at 284.6 eV. As shown in Fig. 4(A), the XPS survey spectrum of the porous carbon nanosheets consists of three different peaks located at 284.6, 488.6 and 531.6 eV, which can be assigned to C1s, Sn3d and O1s, respectively. Here, the peaks for C and O are expected to be from the carbon nanosheets. The reason for the additional Sn peak is due to the substrate FTO-coated glass as the carbon nanosheets were immobilized on that for recording the XPS spectra. The XPS spectrum of C1s [Fig. 4(B)] was deconvoluted into three peaks at 284.6 eV labelled as C–I, which is linked with the sp2 hybridized C–C bond.24 The additional peaks at 285.3 labelled as C-II and 286.7 labelled as C-III eV could be assigned to sp3 carbon (C–C bond) and C![[double bond, length as m-dash]](https://www.rsc.org/images/entities/char_e001.gif) O/C–O bonds, respectively.27Fig. 4(C) shows the O1s spectrum at 531.3 eV, related to numerous oxygen functionalities. The deconvolution of O1s peak resulted in four peaks at different binding energies. The one labelled as O-I and centred at 531.3 eV represents carbonyl oxygen (O
O/C–O bonds, respectively.27Fig. 4(C) shows the O1s spectrum at 531.3 eV, related to numerous oxygen functionalities. The deconvolution of O1s peak resulted in four peaks at different binding energies. The one labelled as O-I and centred at 531.3 eV represents carbonyl oxygen (O![[double bond, length as m-dash]](https://www.rsc.org/images/entities/char_e001.gif) C), the second peak labelled as O-II and centred at 532.4 eV can be attributed to carbonyl oxygen in carboxylic as well as oxygen atoms in hydroxyl groups (COOH), the overlapping O-I and O-II peaks represent Sn–O bonding, while the third peak labelled as O-III and centred at 533.2 eV represents the C–O.28–31 The peak at 536.1 eV labelled as O-IV shows evidence for the presence of nitrogen by the N–C
C), the second peak labelled as O-II and centred at 532.4 eV can be attributed to carbonyl oxygen in carboxylic as well as oxygen atoms in hydroxyl groups (COOH), the overlapping O-I and O-II peaks represent Sn–O bonding, while the third peak labelled as O-III and centred at 533.2 eV represents the C–O.28–31 The peak at 536.1 eV labelled as O-IV shows evidence for the presence of nitrogen by the N–C![[double bond, length as m-dash]](https://www.rsc.org/images/entities/char_e001.gif) O bonding.32 The presence of N was very trace as we failed to detect a N peak in the survey spectrum as well as failed to get a well-defined characteristic N1s spectrum.
O bonding.32 The presence of N was very trace as we failed to detect a N peak in the survey spectrum as well as failed to get a well-defined characteristic N1s spectrum.
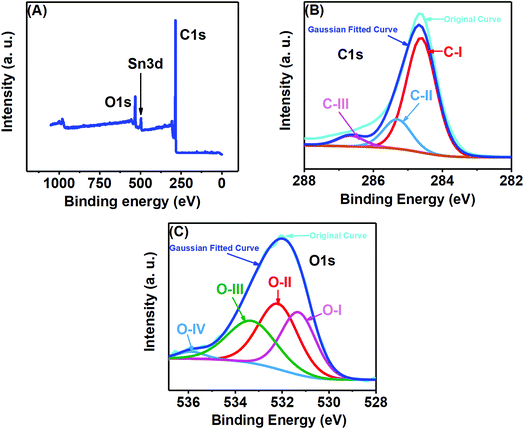 | ||
| Fig. 4 (A) XPS survey spectrum, (B) C1s and (C) O1s deconvoluted XPS spectra of the porous carbon nanosheets prepared from tal palm leaves. | ||
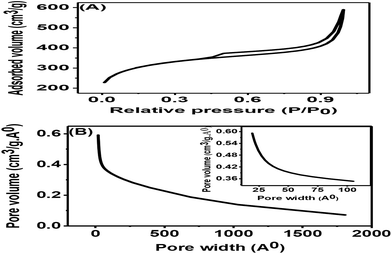
The nitrogen adsorption–desorption isotherms for the synthesized porous carbon nanosheets at 850 °C are shown in Fig. 5(A). This result indicated a type-II adsorption–desorption isotherm of the porous carbon nanosheets with a high nitrogen adsorption–desorption capacity.24 Due to the formation of mesopores, the sample showed a wider hysteresis loop from P/P0 = 0.01 to P/P0 = 1. The specific Brunauer–Emmett–Teller (BET) surface area of the porous carbon nanosheets was 1094.53 m2 g−1 and 0.74 cm3 g−1 respectively. The corresponding Barrett–Joyner–Halenda (BJH) pore-size distribution of porous carbon nanosheets is shown in Fig. 5(B). This result represents a wide distribution of pore width (range: 2 to 180 nm) with an average pore size of 22 nm, which shows the existence of macro- and mesopores.29 The coexisting of macro- and mesopores not only increases the specific surface area but also offers high availability for ions.30 Mostly, materials with a hierarchical porous structure and large specific surface area play a vital role for the improvement of electrochemical properties. Therefore, the porous carbon nanosheets were considered to have high-performance electrode properties for electrochemical sensors applications.
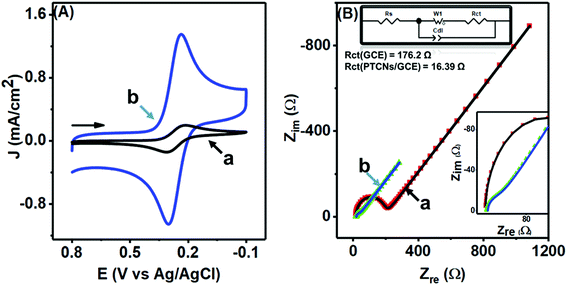
A comparable study was made to inspect closely the electron-transfer capacity of the prepared PTPCNs/GCE sensor at the interface region by CV and electrochemical impedance spectroscopy (EIS) analysis, where standard 5 mM ferricyanide in 1.0 M support KCl was chosen as the electroactive species. Fig. 6(A) shows the corresponding CVs of bare GCE (a) and the PTPCNs/GCE (b) for the electrochemical redox reaction of the active ferricyanides. A notable increase in both redox peak currents was observed in the proposed sensor. The enhancement of the cathodic to anodic peak currents was quite similar, confirming the facile electrochemical redox reactions and reversibility of the peak responses. Meanwhile, the peak-to-peak separation was small enough to be in good agreement with the theoretical value, which affirmed the diffusion controlled redox change at the proposed PTPCNs/GCE. This observation confirmed that the PTPCNs-modified GCE surface could effectively facilitate electron transfer with the ferricyanides. In contrast, the bare GCE although exhibited a reversible pair but the response was less significant compared to the modified GCE.
In Fig. 6(B), Nyquist plots of the respective bare electrode (a) and PTPCNs/GCE (b) are shown for the same 5 mM ferricyanide solution. The semicircle portion at the high-frequency region expresses the charge-transfer resistance (Rct), while the straight portion expresses the diffusion-controlled mass transfer related to the Warburg resistance (W), for the faradaic process. The larger value of the slope of the straight line refers to a low W. Here, a significant change in the semicircle shape was observed for the modified sensor in comparison to the conventional GCE. A lower value of Rct at PTPCNs/GCE indicated a low Rct or a fast electron transfer rate at the interface. This observation further evinced the presence of negative charges at PTPCNs as stated above. The presence of the graphitic structure in the carbon nanosheets could probably be the reason, offering the existence of a large number of free charges on the surface, which would facilitate electron transfer from PTPCNs to the redox probe. Besides, the presence of C–O or C![[double bond, length as m-dash]](https://www.rsc.org/images/entities/char_e001.gif) O, –OH, –COOH groups in the carbon nanosheets facilitated the electron-transfer reactions also.
O, –OH, –COOH groups in the carbon nanosheets facilitated the electron-transfer reactions also.
3.2. Electrochemical behaviour of DA and UA at the PTPCNs/GCE
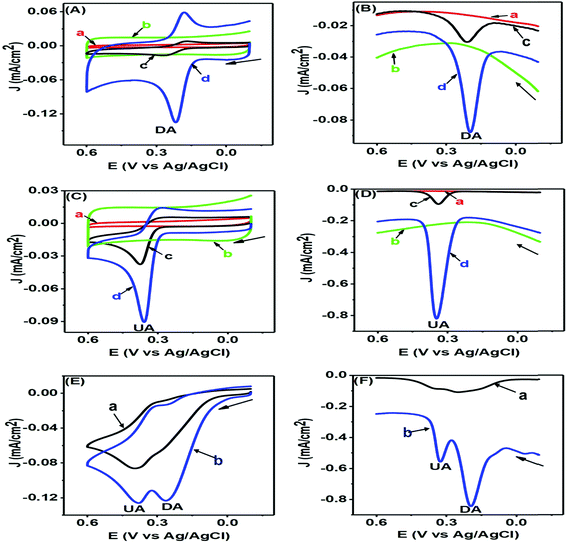
The CV and differential pulse voltammetry (DPV) responses of DA and UA are represented in Fig. 5 and assist us in understanding the electrochemical redox behaviours of these corresponding analytes at the modified PTPCNs/GCE. In all these experiments [Figs 7(A)–(F)], the bare GCE responses were accounted for too in order to make a quick comparison with the modified PTPCNs/GCE responses obtained for DA and UA. Fig. 7(A) shows the CVs of 50 μM DA in 0.1 M PBS of pH 7.0 at the GCE (c) and PTPCNs/GCE (d) and the corresponding CVs of blank PBS solution at the GCE (a) and PTPCNs/GCE (b). The CV of DA obtained at the PTPCNs/GCE exhibited two redox peaks with about 5 and 2 times enlargement of the corresponding oxidation and reduction peaks compared to those obtained at the bare GCE. This confirmed the successful electro-oxidation of DA to dopamine-o-quinone (DAQ) with successive reduction later in the reverse scan. However, the reduction peak was not amplified enough like the oxidation peak due to the low stability of the oxidized form DAQ, which underwent chemical cyclization.10 The peak separation (ΔEp −65 mV) was quite consistent with the theoretical value, reflecting a reversible redox reaction of DA at the PTPCNs/GCE. In Fig. 7(B), DPVs of 50 μM DA at the bare GCE (c) and PTPCNs/GCE (d) were obtained, displaying quite analogous responses as observed in the CV analysis. The oxidation peak observed in 0.19 V at PTPCNs/GCE was 5 times more enhanced compared to that of the bare GCE.The CVs of 100 μM UA at the bare GCE (c) and PTPCNs/GCE (d) in a similar 0.1 M buffer of pH 7.0 and the CVs of blank PBS solution at the bare GCE (a) and PTPCNs/GCE (b) are shown in Fig. 7(C). The CV of UA at the PTPCNs/GCE exhibited a sharp response at 0.35 V, confirming its fast oxidation to the quinoid diimine form at the modified electrode surface.33 However, no clear reduction peak was observed at the PTPCNs/GCE, as the oxidized quinoid diimine form was no longer capable of reducing back at the same rate. The DPV, on the other hand, in Fig. 7(D), of the same 100 μM UA showed a sharp peak for the oxidation of UA at the modified PTPCNs/GCE (d), which was about 5 times greater than that of the bare GCE (c), as expected.
Simultaneous changes in the electrochemical responses of both DA and UA at the PTPCNs/GCE were again studied by means of CV and DPV, as shown in Fig. 7(E) and (F). Both figures display the corresponding CV and DPV responses of the mixture of 50 μM DA and 200 μM UA in 0.1 M PBS solution at the bare GCE (a) and PTPCNs/GCE (b). Here in both CV and DPV, PTPCNs/GCE had successfully resolved the electro-oxidation peaks of both DA and UA at 0.21 and 0.35 V, respectively. The peak responses of DA in both CV and DPV were relatively more intense than that of UA at the PTPCNs/GCE, depicting a faster and more pronounced electron-transfer capacity between the electrode surface and DA. In contrast, the bare GCE failed to give well-resolved peak responses for the concurrent detection of DA and UA in both CV and DPV. These findings confirmed the suitability of the PTPCNs-modified GCE electrode for their (DA and UA) simultaneous detection.
3.3. Effect of the scan rate
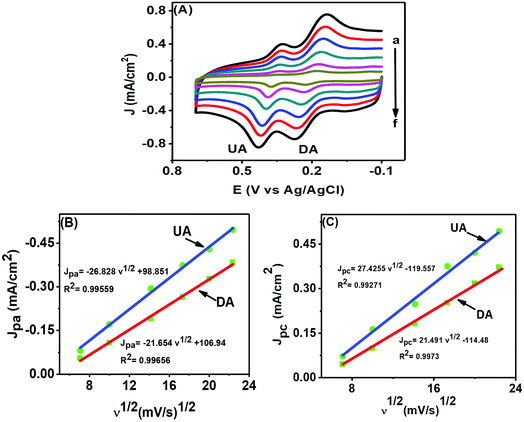
CV is of particular interest for studying the kinetics of an electrochemical reaction through the scan rate variation. Fig. 8(A) shows the electrochemical changes associated with the scan rate variation (50–500 mV s−1) in a mixture of 50 μM DA and 200 μM UA. The peak currents of both analytes increased with increasing scan rates, while the potential remained unaltered, further confirming that both analytes underwent reversible electrochemical changes. We can use the information obtained from the scan rate variation to determine whether an electrochemical process is diffusion (Jpvs. ν1/2) or adsorption (Jpvs. ν) controlled. The plots in Fig. 8(B) and (C) for DA and UA showed that both oxidation and reduction currents for DA and UA were linear from 50–500 mV s−1. The correlation coefficients for UA and DA were found to be 0.99559 and 0.99656 for oxidation and 0.99271 and 0.9973 for reduction peak currents, respectively, indicating that the electrochemical redox process was diffusion controlled for both analytes at the PTPCNs/GCE.343.4. Effect of pH
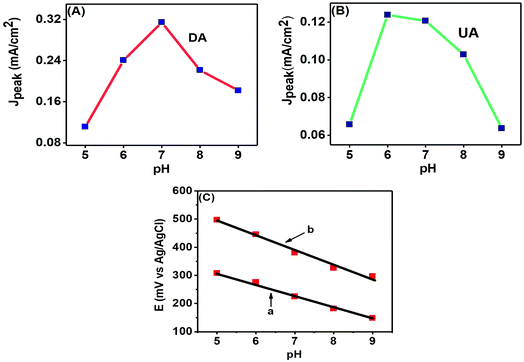
The pH of a solution is a measure of the proton (H+) strength of the solution. The analytes present in a solution are modified according to their protonated (in acidic medium) or deprotonated (in basic medium) forms with the change in pH of a solution.8 Here, we studied the effects of pH variation on electroanalytical detection of DA and UA through CV technique. Fig. 9 (A) shows the peak current response variations of DA from pH 5.0–9.0 with the maximum response at pH 7.0, while Fig. 9(B) shows the variations of peak current for UA from pH 5.0–9.0, with the maximum response observed near pH 6.0.The change of peak potentials and the potential difference between them are important criteria for determining the number of electrons and protons transported during the electrochemical reactions. Fig. 9(C) shows that the anodic peak potentials of both analytes are shifted towards more negative potentials with the increase in basicity of the solution and this shift was linear with the change of pH. DA and UA showed regression equations: Epa (mV) = −0.0414 pH + 517.6 and Epa (mV) = −0.052 pH + 753.2, respectively. The correlation coefficients were r2 = 0.9859 for UA and r2 = 0.99482 for DA. The close to 1 value of the correlation coefficients for the linear fitting of the negative potential shifts with increasing basicity evince the probability of an equal number of proton and electron transfer.35 Further analysis of the equations reveal that 2e− and 2H+ transfer may have taken place.10
3.5. Interference study
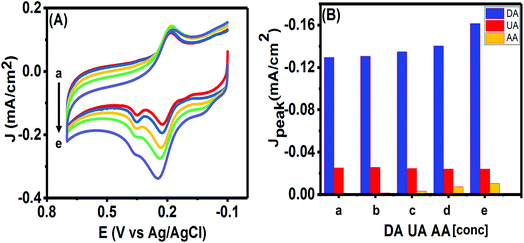
The ultimate purpose of developing any electrochemical sensor for detecting bioanalytes relies on its usability for in vivo detection. The excessively high concentration of ascorbic acid (AA) in biological systems and its close oxidation potential compared to UA and DA makes it one of the most important interfering species. Hence, we studied the effects of various concentrations of AA on the simultaneous analysis of UA and DA using the CV technique. As can be seen in Fig. 10(A), no clear peak was observed for concentrations till 300 μM of AA and almost insignificant current responses were obtained from 500 μM in the potential window of 0.0–0.1 V. We plotted the peak currents of DA and UA observed for varying concentrations of AA in Fig. 10(B). The presence of high concentrations of AA (till measured to 1 mM of AA) had only a slight effect on the charging current and on the peak current of the analytes. As the concentration of AA was increased from 100 μM to 1 mM, the DA and UA peak currents varied slightly (R.S.D. = 3.53% for DA and 3.03% for UA) and the peaks could be clearly identified. However, when 1.5 mM AA was in solution, the peak current changed drastically (R.S.D. = 9.34% for DA and 3.10% for UA), while the DA peak current increased, the UA peak started decreasing, making it difficult to separate the individual peaks. Since, the sensor was able to detect DA and UA simultaneously with limited interference from AA up to 1 mM, hence, the PTPCNs/GCE sensor could be suitable for the in vivo simultaneous detection of the analytes in the presence of AA.3.6. Theoretical discussion on possible interaction between the PTPCNs/GCE and analytes
From experimental observations, it was obvious that both DA and UA underwent simultaneous redox reaction at the PTPCNs/GCE. The diffusivity of DA and UA in that case was greatly influenced by the morphology and conductivity of the PTPCNs obtained from tal palm leaves. The specific surface area, nature of the porosity, pore size, nano framework and surface functionalities were the important parameters that could explain the high conductivity of such activated tal carbon nanosheets and their response to DA and UA. Here the possible explanation of how the electroactive species, DA and UA, interact with the proposed sensor are briefly discussed.A defect and chemical composition study by Raman and XPS of the porous carbon nanosheets confirmed the presence of a significant number of sp2 hybridized carbons (i.e. graphitized structure). This could possibly result from the high-temperature carbonization of the NaHCO3-treated carbon mass.36 The graphitic domain of PTPCNs possessed a comparable amount of free electrons, which induced a great number of non-covalent type interactions, namely pi–pi, with electroactive species DA and UA.10 In addition, the specific nano level thickness of the PTPCNs could have provided an effective and suitable interface between the electrode and solution that minimized the pathway for mass and electron transfer, thus increasing the rate of electron transfer for DA and UA.37
BET isotherm and pore size distribution curves affirmed the firmly distributed porous framework of the carbon nanosheets, consisting of an interconnected network of meso and macro pores. During the pyrolysis, the pulverized mass released O and H elements as H2O, CO and CO2 for producing porous carbon nanosheets.36,38 The FESEM image in Fig. 1(C) as well as the wider hysteresis loop observed in the BET isotherm in Fig. 5(A) revealed that the porous frame was developed appreciably in an ordered hierarchical form that enhanced the diffusivity of DA and UA at the PTPCNs/GCE by reducing the tortuosity.39 The mass transport capacity often becomes difficult through ultra as well as micro porous frameworks due to its short diameter, which eventually declines the accessibility of electrolytic species to the sensor. Here, the hierarchical macro and meso porous structure of the PTPCNs were most likely allowed a marked diffusion of electroactive species by making use of the internal porous network.38 Hence, the resultant large specific surface area facilitated the electrochemical reactions of DA and UA at the PTPCNs/GCE. Such porous carbon formed from tal palm leaves also exhibited high capacitive currents when being drop-casted as more than 5 μL on the GCE. This capacitive current lowered the oxidation peak current height for both DA and UA due to enlargement of the double layer thickness. This is why 5 μL of PTPCNs was chosen as the optimized amount for electrode modification.
Surface functionalities are very important because they offer preferable interactions at the interface between analytes and functional groups. EDS study confirmed the presence of surficial elemental O atoms, while XPS analysis proved the existence of –C–O, –C![[double bond, length as m-dash]](https://www.rsc.org/images/entities/char_e001.gif) O, –COOH and –OH functional groups on the PTPCNs. The high-temperature carbonization at 850 °C, however, considerably reduced the oxygenated groups by means of releasing H2O, CO and CO2, but some of the groups could still be saved at this temperature level.36 These functional groups were mostly hydrophilic in nature and thus provided a suitable surface for interacting with analytes.37 The comparatively higher sensitivity of DA towards the PTPCNs/GCE than UA could possibly be due to the more preferable formation of short-range hydrogen bonding by utilizing its two –OH and one –NH2 group.10
O, –COOH and –OH functional groups on the PTPCNs. The high-temperature carbonization at 850 °C, however, considerably reduced the oxygenated groups by means of releasing H2O, CO and CO2, but some of the groups could still be saved at this temperature level.36 These functional groups were mostly hydrophilic in nature and thus provided a suitable surface for interacting with analytes.37 The comparatively higher sensitivity of DA towards the PTPCNs/GCE than UA could possibly be due to the more preferable formation of short-range hydrogen bonding by utilizing its two –OH and one –NH2 group.10
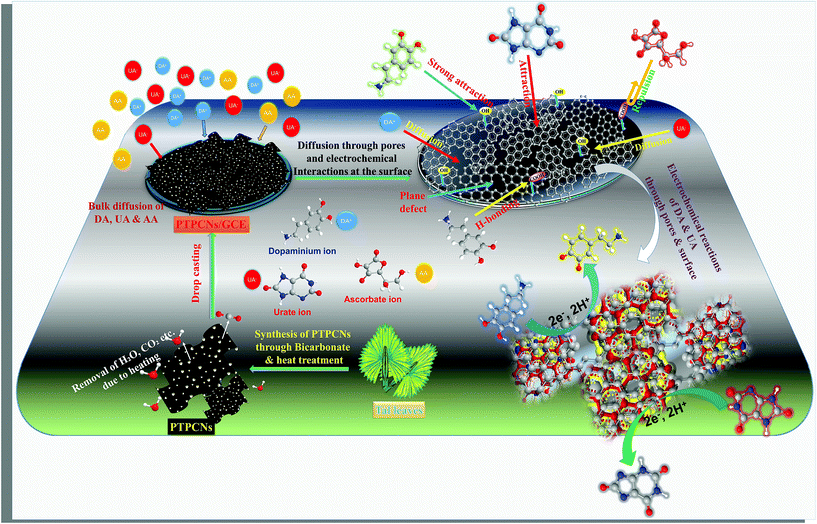
The pH variation study of both DA and UA from pH 5–9 further validated the existence of negative functionalities on the PTPCNs. At pH 7, UA and AA preferentially bear negative charge and are converted to urate and ascorbate ions, while DA in a medium of pH 7 mostly exists in cationic form.10 Hence, the surface reactivity of DA was greater due to the existence of attractive forces between the negative functionalities of porous carbon and positively charged DA. Meanwhile, the repulsive force that acted for both urate and ascorbate ions at the PTPCNs/GCE were not similar. Charge density on ascorbate ions is relatively higher than on urate ions. Hence, enhanced repulsive interactions at the surface reduced the diffusion and then oxidation of AA drastically at the proposed sensor. This might have been the reason why the PTPCNs/GCE showed only a very poor response towards AA even at high concentrations, as was observed during the interference studies. We show the possible interactions between the PTPCNs and analytes through graphical representation in Scheme 3.
3.7. Quantitative measurements of DA and UA
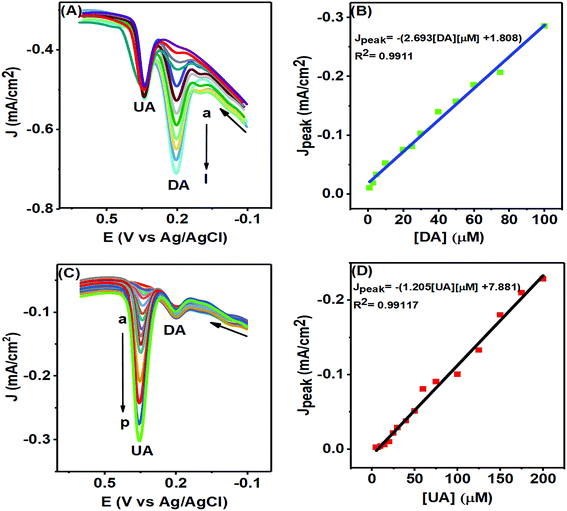
The PTPCNs/GCE sensor could selectively sense any particular analyte of either DA or UA of varying concentrations in the presence of a fixed concentration of another analyte, as studied in Fig. 11, by means of DPV analysis. In Fig. 11(A), the DPV responses of DA of various concentrations are shown with fixed UA and AA of 100 μM and 500 μM within the potential window of −0.2–0.7 V. Here, the current response of DA increased as expected in each DPV with the rising concentration of DA at about 0.20 V within the concentration range 1–100 μM, while a fixed current response for the electro-oxidation of UA was obtained at a potential of 0.35 V in each case. The calibration plot (Fig. 11(B)) developed based on the DPV peak current responses for the oxidation of DA confirmed its linearity up to the concentration range stated. This plot provided an LOD (limit of detection) for DA of about 0.078 μM (S/N = 3).40 The regression equation for the peak current was obtained to be Jpeak = −1.80852 × 10⁻⁵ − 2.693 [DA] μM, providing a slope of 2.693 μA μM−1 cm−2 and the regression coefficient was 0.9911.In Fig. 11(C), the DPV responses of various UA solutions are shown in the presence of fixed DA of concentration 10 μM in the same PBS solution. The current responses for the oxidation of UA increased proportionally with increasing concentration at the same potential of 0.35 V with a fixed DA response obtained at about 0.20 V in each DPV. The LOD for UA obtained from the calibration plot (Fig. 11(D)) was 0.17 μM (S/N = 3) and the linear range was 5–200 μM.40 The calibration plot provided information on the linear regression function for the UA peak response of Jpeak = −7.881 × 10⁻⁶ − 1.2057 [UA] μM with a regression coefficient of 0.99117 and slope of 1.2057 μA μM−1 cm−2. In both figures, the peak separation (150 mV) was large enough to distinguish individual peaks for the simultaneous oxidation of DA and UA at the PTPCNs/GCE. For comparison, the performances of the proposed sensor and other reported sensors are tabulated in Table 1.
| Modified electrode | DA | UA | Ref. | ||
|---|---|---|---|---|---|
| Linear range (μM) | Detection limits (μM) | Linear range (μM) | Detection limits (μM) | ||
| a rGO, Reduced graphene oxide; SPGNE, screen-printed graphene electrode; ERGO, electrochemically reduced graphene oxide; Ch, choline; PTH, poly(thionine); Gr, graphene; PLL, polymerized L-lysine; AuNPs, gold nanoparticles; β-CD, β-cyclodextrin. | |||||
| rGO-SP-FTO | 0.5–50 | 0.07 | 5–300 | 0.39 | 10 |
| SPGNE | 0.5–2000 | 0.12 | 0.8–2500 | 0.2 | 11 |
| AuNPs-β-CD-Gra/GCE | 0.5–150 | 0.15 | 0.5–60 | 0.21 | 12 |
| ERGO/GCE | 0.5–60 | 0.5 | 0.5–60 | 0.5 | 34 |
| PTH/GCE | 5–30 | 0.7 | 5–30 | 1.3 | 35 |
| Fe3O4–SnO2-Gr/CPE | 0.02–2.8 | 0.007 | 0.015–2.40 | 0.005 | 41 |
| ERGO/PLL/GCE | 2–60 | 0.10 | 20–200 | 0.15 | 42 |
| Pd/rGO/GCE | 0.45–421 | 0.18 | 6–469.5 | 1.6 | 43 |
| Graphene ink/glass | 3–140 | 1.44 | 0.5–150 | 029 | 44 |
| PTPCNs/GCE | 1–100 | 0.078 | 5–200 | 0.17 | This work |
3.8. Reproducibility and stability
We tested the PTPCNs/GCE electrode to determine its stability and reproducibility. The electrode preparation reproducibility was tested using four different GCEs. From a mixture of 10 μM DA and 50 μM UA, the different electrodes showed an almost similar electrochemical response. The relative standard deviation (RSD) of the four electrodes was only 2.46% and 3.01% for oxidations of UA and DA. respectively. The experimental reproducibility was determined through 40 successive CVs in a 0.1 M PBS solution containing 200 μM UA and 50 μM DA. The electrode showed relatively good reproducibility with RSD values as low as 3.27% and 3.41% for UA and DA, respectively, indicating good experimental reproducibility and surface fouling resistance to oxidation products.The storage stability was also determined through CV technique. For this, the modified electrode was stored in a refrigerator and after every 3 days, CVs of the mixture solution was taken. The electrode gave almost similar oxidation current response for about 24 days for both analytes. Thus, the PTPCNs/GCE showed both good reproducibility and stability.
3.9. Real sample analysis
The applicability of the PTPCNs/GCE towards detecting UA and DA in real life was tested using urine sample and dopamine hydrochloride injection (DHI). We diluted the urine sample 100 times and then spiked it with 20 μM, 30 μM and 50 μM UA. On the other hand, the DA real sample analysis was carried out using 5 μM, 10 μM and 20 μM solutions that were prepared from DHI. The DPV technique was used for real sample analysis and then calibration plots were used for determining the DA and UA recovery from the real sample. The RSD values and the maximum deviation in recovery values were only 3%. The experimental results are shown in Table 2. These findings showed that the PTPCNs/GCE could be an excellent choice for UA and DA detection in real samples.| Sample no. | DA added (μM) | DA found (μM) | R.S.D. (%) | Recovery (%) |
|---|---|---|---|---|
| 1 | 5 | 4.92 | 1.14 | 98.4 |
| 2 | 10 | 10.35 | 2.43 | 103.5 |
| 3 | 20 | 19.88 | 0.74 | 99.4 |
| Sample no. | UA added (μM) | UA found (μM) | R.S.D. (%) | Recovery (%) |
|---|---|---|---|---|
| 1 | 20 | 20.13 | 0.46 | 100.65 |
| 2 | 30 | 30.52 | 1.22 | 101.73 |
| 3 | 50 | 49.84 | 0.23 | 99.68 |
4. Conclusions
While in most cases, biomass-derived porous carbon materials are used in constructing supercapacitors or batteries, we successfully utilized PTPCNs/GCE in the simultaneous electrochemical detection of UA and DA with appreciable sensitivity. The PTPCNs material exhibited exceptional electrocatalytic properties due to its unique properties as was indicated by various surface, structural and chemical composition studies. The PTPCNs/GCE performed remarkably by selectively excluding AA from a mixture of AA, UA and DA. We postulated a possible interaction mechanism based on the various factors that might have been responsible for the observed experimental results during the electroanalytical experiments. This hypothesis was made based on our experimental findings, reported theoretical concepts and basic chemical reasoning. The PTPCNs/GCE showed its reproducibility in different electrodes while keeping other parameters unchanged and showed distinguished experimental stability along with storage stability. The PTPCNs/GCE also showed prominence in real sample analysis. Aside from being used as an excellent sensing material, the PTPCNs can also be promising in being used as a supercapacitor or even battery material. We will further investigate the applicability of the PTPCNs material in our future work.Conflicts of interest
There are no conflicts to declare.Acknowledgements
This work was partially supported by the Ministry of Science and Technology of Bangladesh and Center of Research Excellence in Nanotechnology, King Fahd University of Petroleum and Minerals, Saudi Arabia.References
- J. W. Dalley and J. P. Roiser, Neuroscience, 2012, 215, 42–58 CrossRef CAS PubMed.
- M. D'Amelio, S. Puglisi-Allegra and N. Mercuri, Pharmacol. Res., 2018, 130, 414–419 CrossRef PubMed.
- M. J. Frank and R. C. O'Reilly, Behav. Neurosci., 2006, 120, 497–517 CAS.
- K. C. Berridge and M. L. Kringelbach, Neuron, 2015, 86, 646–664 CrossRef CAS PubMed.
- I. Huertas, S. Jesús, J. A. Lojo, F. J. García-Gómez, M. T. Cáceres-Redondo, J. M. Oropesa-Ruiz, F. Carrillo, L. Vargas-Gonzalez, J. F. M. Rodríguez, P. Gómez-Garre, D. García-Solís and P. Mir, PLoS One, 2017, 12, 1–9 Search PubMed.
- U. A. A. Sharaf El Din, M. M. Salem and D. O. Abdulazim, J. Adv. Res., 2017, 8, 537–548 CrossRef CAS PubMed.
- W. H. Church and V. L. Ward, Brain Res. Bull., 1994, 33, 419–425 CrossRef CAS PubMed.
- A. J. S. Ahammad, M. M. Hasan, T. Islam, M. O. Al-Shehri, A. N. Anju, M. K. Alam, J. P. Kim, M. A. A. Qasem and M. A. Aziz, New J. Chem., 2018, 42, 4543–4552 RSC.
- R. F. Anderson and T. A. Harris, Free Radical Res., 2003, 37, 1131–1136 CrossRef CAS PubMed.
- A. J. S. Ahammad, T. Islam, M. Hasan, M. N. I. Mozumder, R. Karim, N. Odhikari, P. R. Pal, S. Sarker and D. M. Kim, J. Electrochem. Soc., 2018, 165, 174–183 CrossRef.
- J. Ping, J. Wu, Y. Wang and Y. Ying, Biosens. Bioelectron., 2012, 34, 70–76 CrossRef CAS PubMed.
- X. Tian, C. Cheng, H. Yuan, J. Du, D. Xiao, S. Xie and M. M. F. Choi, Talanta, 2012, 93, 79–85 CrossRef CAS PubMed.
- A. J. S. Ahammad, T. Akter, A. Al Mamun, T. Islam, M. M. Hasan, M. A. Mamun, S. Faraezi, F. Z. Monira and J. K. Saha, J. Electrochem. Soc., 2018, 165, B390–B397 CrossRef CAS.
- C. M. Parlett, K. Wilson and A. F. Lee, Chem. Soc. Rev., 2013, 42, 3876–3893 RSC.
- J. Tang, T. Wang, R. R. Salunkhe, S. M. Alshehri, V. Malgras and Y. Yamauchi, Chem.–Eur. J., 2015, 21, 17293–17298 CrossRef CAS PubMed.
- G. Ruan, Z. Sun, Z. Peng and J. M. Tour, ACS Nano, 2011, 5, 7601–7607 CrossRef CAS PubMed.
- M. Sivachidambaram, J. J. Vijaya, L. J. Kennedy, R. Jothiramalingam, H. A. Al-Lohedan, M. A. Munusamy, E. Elanthamilan and J. P. Merlin, New J. Chem., 2017, 41, 3939–3949 RSC.
- T. A. Davis and D. V Johnson, Econ. Bot., 1987, 41, 247–266 CrossRef.
- S. Dutta, A. Bhaumik and K. C. W. Wu, Energy Environ. Sci., 2014, 7, 3574–3592 RSC.
- R. J. White, V. Budarin, R. Luque, J. H. Clark and D. J. MacQuarrie, Chem. Soc. Rev., 2009, 38, 3401–3418 RSC.
- J. Wang and S. Kaskel, J. Mater. Chem., 2012, 22, 23710–23725 RSC.
- Y. Xiao, H. Chen, M. Zheng, H. Dong, B. Lei and Y. Liu, Mater. Lett., 2014, 116, 185–187 CrossRef CAS.
- J. M. Rosas, R. Ruiz-Rosas, J. Rodríguez-Mirasol and T. Cordero, Carbon, 2012, 50, 1523–1537 CrossRef CAS.
- A. Mondal, K. Kretschmer, Y. Zhao, H. Liu, B. Sun, G. Wang and C. W. Wang, Chem.–Eur. J., 2016, 23, 3683–3690 CrossRef PubMed.
- D. Feng, Y. Lv, Z. Wu, Y. Dou, L. Han, Z. Sun, Y. Xia, G. Zheng and D. Zhao, J. Am. Chem. Soc., 2011, 133, 15148–15156 CrossRef CAS PubMed.
- X. Y. Liu, M. Huang, H. L. Ma, Z. Q. Zhang, J. M. Gao, Y. L. Zhu, X. J. Han and X. Y. Guo, Molecules, 2010, 15, 7188–7196 CrossRef CAS PubMed.
- M. N. Ghazzal, R. Wojcieszak, G. Raj and E. M. Gaigneaux, Beilstein J. Nanotechnol., 2014, 5, 68–76 CrossRef PubMed.
- C. Peng, J. Lang, S. Xu and X. Wang, RSC Adv., 2014, 4, 54662–54667 RSC.
- J. Lee, S. Yoon, T. Hyeon, M. Oh, K. Bum, S. M. Oh and K. B. Kim, Chem. Commun., 1999, 2177–2178 RSC.
- A. G. Pandolfo and A. F. Hollenkamp, J. Power Sources, 2006, 157, 11–27 CrossRef CAS.
- M. Genovese, J. Jiang, K. Lian and N. Holm, J. Mater. Chem. A, 2015, 3, 2903–2913 RSC.
- N. Karikalan, M. Velmurugan, S.-M. Chen, C. Karuppiah, K. M. Al-Anazi, M. A. Ali and B.-S. Lou, RSC Adv., 2016, 6, 71507–71516 RSC.
- G. Fabregat, J. Casanovas, E. Redondo, E. Armelin and C. Alemán, Phys. Chem. Chem. Phys., 2014, 16, 7850–7861 RSC.
- L. Yang, D. Liu, J. Huang and T. You, Sens. Actuators, B, 2014, 193, 166–172 CrossRef CAS.
- A. J. S. Ahammad, X. Li, M. Rahman, K. Noh and J. Lee, Int. J. Electrochem. Sci., 2013, 8, 7806–7815 CAS.
- C. Wang, Q. Lai, K. Feng, P. Xu, X. Li and H. Zhang, Nano Energy, 2018, 44, 240–247 CrossRef CAS.
- C. Matei Ghimbeu, J. Górka, V. Simone, L. Simonin, S. Martinet and C. Vix-Guterl, Nano Energy, 2018, 44, 240–247 CrossRef.
- S. Y. Lu, M. Jin, Y. Zhang, Y. B. Niu, J. C. Gao and C. M. Li, Adv. Energy Mater., 2018, 8, 1–9 CrossRef CAS.
- A. B. Deshmukh, A. C. Nalawade, I. Karbhal, M. S. Qureshi and M. V. Shelke, Carbon, 2018, 128, 287–295 CrossRef CAS.
- D. A. Armbruster and T. Pry, Clin. Biochem. Rev., 2008, 29, S49–S52 Search PubMed.
- H. Bagheri, N. Pajooheshpour, B. Jamali, S. Amidi, A. Hajian and H. Khoshsafar, Microchem. J., 2017, 131, 120–129 CrossRef CAS.
- D. Zhang, L. Li, W. Ma, X. Chen and Y. Zhang, Mater. Sci. Eng., C, 2017, 70, 241–249 CrossRef CAS PubMed.
- J. Wang, B. Yang, J. Zhong, B. Yan, K. Zhang, C. Zhai, Y. Shiraishi, Y. Du and P. Yang, J. Colloid Interface Sci., 2017, 497, 172–180 CrossRef CAS PubMed.
- L. Fu, A. Wang, G. Lai, W. Su, F. Malherbe, J. Yu, C. Te Lin and A. Yu, Talanta, 2018, 180, 248–253 CrossRef CAS PubMed.
Footnote |
| † These authors contributed equally to this work. |
| This journal is © The Royal Society of Chemistry 2019 |


