Graphene oxide–polybenzimidazolium nanocomposite anion exchange membranes for electrodialysis†
Levente
Cseri
 ab,
Joseph
Baugh
 a,
Adetunji
Alabi
 c,
Ahmed
AlHajaj
 c,
Linda
Zou
 c,
Robert A. W.
Dryfe
 d,
Peter M.
Budd
 *bd and
Gyorgy
Szekely
 *ab
*ab
aSchool of Chemical Engineering and Analytical Science, University of Manchester, The Mill, Sackville Street, Manchester, M1 3BB, UK. E-mail: gyorgy.szekely@manchester.ac.uk; Tel: +44 (0)161 306 4366
bGraphene Engineering and Innovation Centre, University of Manchester, Masdar Building, Sackville Street, Manchester, M1 7JR, UK
cMasdar Institute, Khalifa University of Science and Technology, Abu Dhabi, 54224, United Arab Emirates
dSchool of Chemistry, University of Manchester, Oxford Road, Manchester, M13 9PL, UK. E-mail: peter.budd@manchester.ac.uk; Tel: +44 (0)161 275 4711
First published on 8th November 2018
Abstract
Mechanically robust and highly permselective anion exchange membranes (AEMs) were prepared based on a graphene oxide (GO) and polybenzimidazolium nanocomposite. GO was modified via diazonium chemistry for better dispersibility and used to fabricate unsupported, nanocomposite, dense, flat sheet AEMs with different GO loadings. A fabrication route using post-casting methylation was developed to avoid GO aggregation induced by the anion exchange polymer. The even GO distribution in the membranes was mapped by energy dispersive spectroscopy (EDS) and wavelength dispersive spectroscopy (WDS). Tensile testing and nanoindentation showed that the AEMs had great mechanical strength indicated by their high ultimate tensile strength and hardness. Furthermore, the AEMs exhibited high ion exchange capacity (1.7–2.1 mmol g−1), good to exceptional permselectivity (up to 0.99) and relatively low area resistance (down to 2.9 Ω cm2). A trade-off between good selectivity and low resistance was investigated for membranes with low GO loadings (0.25–2.5%). The GO nanocomposite AEMs demonstrated excellent potential for electrodialysis.
Introduction
With the world's water supplies facing new threats, overcoming water scarcity is a grand challenge of the 21st century. There is growing interest in desalination of seawater and brackish water, but further development is required to make these processes more affordable. Research on electromembrane processes such as electrodialysis,1 electrodeionization2 and membrane capacitive deionisation3 is rapidly increasing. Among these processes, electrodialysis has been the most prominent in brackish water desalination,4 with further applications in nutrient recovery,5 salt concentration,6 biochemical separations7 and the food industry.8Electromembrane processes involve the separation of components based on ionic charge. The separation is realised by the use of ion exchange membranes (IEMs) and therefore the performance of the IEMs plays a huge role in the overall efficiency of the process.9 IEMs are typically composed of hydrocarbon or fluorocarbon polymeric substrates, immobilized ionic groups and mobile counter-ions. Depending on the charge of the counter-ions, cation exchange membranes (CEMs) and anion exchange membranes (AEMs) are distinguished.10,11 Although a wide range of IEMs have been commercialised, AEMs have struggled to develop at the same rate as CEMs, due to insufficient chemical stability, selectivity and dimensional stability.12
One approach to tackle these problems is the development of new polymers with novel cationic head groups.13 This approach usually includes several synthetic steps and often involves expensive chemicals, which undermines the scale-up of the membrane fabrication.12 The incorporation of nanomaterial fillers provides an alternative way to improve the membrane properties. Graphene-based nanomaterials have been identified as highly promising candidates for nanocomposite IEMs.14 In the last decade, graphene oxide (GO) has become the centre of attention as a filler material for membranes in the fields of reverse osmosis,15 nanofiltration,16 pervaporation,17 membrane distillation18 and gas separation,19 due to its selective barrier properties, and excellent chemical, mechanical and thermal stability, combined with a high surface area. GO, a 2D nanomaterial derived from graphite, is comprised of carbon sheets decorated with oxygen-containing functionalities on the surface (hydroxyl and epoxide groups) and on the edges (hydroxyl, carbonyl and carboxyl groups). Its ready dispersibility and reactivity in both organic and aqueous media make GO a versatile starting material with scalable production.20
GO-based mixed matrix membranes (MMMs) with anion exchange properties are scarce in the literature. Most studies reported that the mechanical stability of GO containing membranes was enhanced compared to their GO-free counterparts, but other properties and membrane performance was largely dependent on the fabrication method. GO, modified with anion exchange groups such as quaternary ammonium,21 guanidinium22 or imidazolium23 groups, has been incorporated in inert polymeric matrices to produce AEMs with high mechanical strength and low swelling ratio and water uptake. However, in these cases the ion exchange capacity (IEC) of the membranes remained low unless a high amount (up to 30%) of modified GO was used, which hinders the viability and scalability of membrane production. Considerably lower GO amounts were needed when anion exchange polymers were used since the IEC does not depend on the filler loading in these cases.24–26 Moreover, high IEC coupled with good dimensional stability was achieved this way.25 However, the preparation of these membranes usually involved multiple steps and dangerous chemicals such as chloromethyl methyl ether.26 The low permselectivity also remained an issue.24
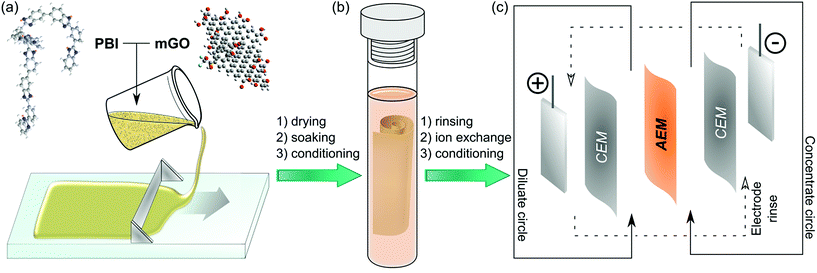
Herein, we report a facile fabrication method (Fig. 1) and the characterisation of nanocomposite AEMs based on modified GO and quaternised polybenzimidazole (PBI). PBI was selected due to its outstanding thermal and mechanical stability and good film forming properties.27 PBI can readily undergo alkylation on its nitrogen atoms to enable its application for AEMs.28 Polybenzimidazolium AEMs reported in the literature exhibited excellent IEC and conductivity.29,30 These membranes have mostly been considered for anion exchange fuel cells, but their applicability in that field is limited due to stability problems of the hydroxide form.31,32 The halide forms on the other hand exhibited good stability, which may be even further enhanced by GO filler. Therefore, the GO–polybenzimidazolium nanocomposite AEMs prepared in this work were expected to have improved mechanical and electrochemical properties. The GO–polymer interactions, the effects of filler loading (0.25–2.5%), the GO distribution and the membrane morphology were systematically studied to reveal structure–property relationships. Furthermore, a Robeson-type plot for AEMs is proposed to compare commercial and published AEMs.
Experimental
Materials
GO aqueous dispersion (4 g L−1) was purchased from Graphenea and sonicated for 30 min prior to use. 4-(Trifluoromethylthio)aniline (TFMA; 98%) was purchased from Fluorochem. Diethyl ether (>97.5%, BHT as stabiliser), sodium nitrite (NaNO2; ACS reagent, >97%), methyl iodide (MeI; >99%), dimethyl sulfoxide-d6 (DMSO-d6; 99.9%) and N,N-diisopropylethylamine (DIPEA; >98%) were purchased from Sigma Aldrich. Hydrochloric acid (HCl; 36 wt%) was purchased from Alfa Aesar and diluted with deionised water to the concentration required. Methanol (>99.5%), dimethyl sulfoxide (DMSO; 99.9%) and acetonitrile (>99.5%), all analytical grade, and silver nitrate (AgNO3; 99.7%) were purchased from Fisher Scientific. Ethanol (99.9%) was purchased from VWR. N,N-Dimethylacetamide (DMAc, 99.5%) and potassium nitrate (KNO3; 99+%) was purchased from Acros. Poly[2,2′-(m-phenylene)-5,5′-bisbenzimidazole] (PBI) S26 solution (26 wt% in DMAc) was purchased from PBI Performance Products (Charlotte, NC, USA). Type I deionised (DI) water was used throughout all experiments, unless stated otherwise.Refer to the ESI† for the GO modification via diazonium chemistry and epoxide ring opening, as well as the synthesis of poly[2,2′-(m-phenylene)-5,5′-bis(N,N′-dimethylbenzimidazolium)] (PDMBI) iodide.
Membrane fabrication
Table 1 summarises the materials used to prepare casting solutions for different membranes. mGO-1 was homogeneously suspended in DMAc by sonication for 30 min. Independently, a 26% solution of the polymer (PBI or PDMBI) in DMAc was stirred with an overhead stirrer at 40 rpm for 10 min. The GO suspension was added and the stirring continued at 60 rpm for 2 hours, followed by incubation in an incubator shaker at 300 rpm and 30 °C for 1 hour. The dope solution (20 wt% polymer content) was cast on a glass plate (20 cm × 20 cm) with thickness of 250 μm at room temperature using an Elcometer 4340 Automatic Film Applicator. The solvent was evaporated over 24 hours in a levelled oven at 60 °C. The glass plate was then immersed in 5 L type II DI water causing the membrane to peel off the glass surface. The membranes were stored in acetonitrile.![[thin space (1/6-em)]](https://www.rsc.org/images/entities/char_2009.gif) :
:![[thin space (1/6-em)]](https://www.rsc.org/images/entities/char_2009.gif) mDMAc ratio was fixed at 1
mDMAc ratio was fixed at 1![[thin space (1/6-em)]](https://www.rsc.org/images/entities/char_2009.gif) :
:![[thin space (1/6-em)]](https://www.rsc.org/images/entities/char_2009.gif) 4 in all cases
4 in all cases
| m GO/mpolymer (%) | Polymer | Post-casting methylation | |
|---|---|---|---|
| M1-1 | 1.00 | PDMBI iodide | No |
| M2-1 | 1.00 | PBI | Yes |
| M2-0 | 0.00 | PBI | Yes |
| M2-0.25 | 0.25 | PBI | Yes |
| M2-2.5 | 2.50 | PBI | Yes |
Post-casting methylation of membranes
Membranes of the M2 series were methylated after membrane formation to impart with anion exchange characteristics. The membrane pieces (25 cm2) were rinsed with acetonitrile then placed in an Ar filled pressure tube. Acetonitrile (40 mL) and DIPEA (1.4 mL, 8.0 mmol) were added and Ar was bubbled through the solution for 5 min. MeI (2.0 mL, 32.1 mmol) was added in one portion and the pressure tube was sealed. The reaction was carried out at 60 °C for 24 hours with continuous stirring. After the reaction, the membrane pieces were rinsed with acetonitrile and stored in it until further measurements.Spectroscopic analysis
Fourier-transform infrared (FTIR) spectra were recorded from dry samples using a Thermo Fisher Nicolet iS5 iD5 ATR-FTIR spectrometer. A resolution of 1 cm−1 was used in conjunction with 16 scans to study each sample. Nuclear magnetic resonance (NMR) spectra were recorded on a 400 MHz Bruker Avance III spectrometer in DMSO-d6.Imaging techniques
Scanning electron microscopy (SEM) (FEI Quanta 200 ESEM) was used to examine the surface and cross-sectional morphology of the membranes. All samples were sputter coated with a platinum layer of 10 nm to improve conductivity and image resolution. The membrane thickness was determined from SEM images based on 9 different measurements from different parts of each membrane using ImageJ software. Atomic force microscopy (AFM) was employed to analyse the topology of each membrane surface using a Bruker Multimode 8 Atomic Force Microscope. NanoScope Analysis 1.8 software was used for the evaluation of the AFM images. The average arithmetic roughness, Ra, for each individual sample was then calculated based on at least three images and the results are provided with their associated standard deviation. Energy dispersive X-ray spectroscopy (EDS) and wavelength dispersive X-ray spectroscopy (WDS) was carried out using a JEOL JXA-8530F Electron Microprobe (EPMA). Samples were coated with a 7.5 nm thick layer of carbon prior to the analysis. Maps were recorded using 63 nA beam current and 9 kV acceleration voltage from 51.2 × 51.2 μm2 areas with 300 ms px−1 collection time and 0.1 μm px−1 resolution. The S Kα signal was measured simultaneously at each point using both a JEOL 10 mm2 EDS and by WDS using a PETL diffraction crystal coupled with a sealed Xe detector. Images were processed using ImageJ software.Stability tests
Nanoindentation testing was undertaken using an MTS Nanoindenter XP with a Berkovich tip. Each membrane film was glued to an aluminium substrate and an allowable drift of 0.15 nm s−1 was set. An indent depth limit of 1 μm was selected in order to eliminate the possibility of the substrate beneath the sample impacting the results. Prior to testing the samples, a control piece of quartz was indented 5 times. A series of 25 indentations were made into each membrane sample across a clear square area in the centre of each membrane piece. Each indent was spaced 25 μm apart. Continuous stiffness measurements were taken, where the indenter tip is driven by a sinusoidal wave, as this technique utilises reduced penetration depths, ideal for thin films.33Tensile strength was tested using an Instron 1122 Universal Testing Machine with a 500 N load cell. Rectangular specimens with dimensions of 20 mm × 10 mm were tested at 2 mm min−1 speed with 10 mm specimen gauge length. The tests were performed in triplicates at 23 °C and 50% relative humidity.
Membrane hydrophilicity
Water contact angle was measured in air using a Krüss Drop Shape Analyser (DSA 100). The droplets were formed on the surface using type II DI water, with an approximate volume of 1 μL in each case at 21 ± 1 °C. The reported angles for each membrane are an average of three separate droplets.Water uptake and linear swelling ratio was measured for the chloride form of the membranes. Each membrane sample was immersed in DI water at room temperature for 24 hours, ensuring complete swelling had occurred. The wet weight and length of samples were recorded. The samples were dried in a vacuum desiccator for 24 hours and measured again. The water uptake, WU, and swelling ratio, SR, of each membrane were then calculated using eqn (1) and (2), respectively:
| WU = (mw − md)md−1 × 100% | (1) |
| SR = (lw − ld)ld−1 × 100% | (2) |
Water permeation of the membranes was measured from coupons with diameter of 3 cm in a dead-end cell. The feed side was filled up with DI water and the cell was pressurised to 40 bar with nitrogen gas. 1–2 mL of permeate was collected over 60–90 min to determine water permeation resistance (WPR). WPR was calculated using eqn (3):
| WPR = ptV−1A | (3) |
Ion exchange capacity (IEC)
IEC of the membranes (chloride form) was measured in triplicate by Mohr's method.34 The membrane samples (30–40 mg) were soaked in 1 M KNO3 solution (40 mL) for 24 hours, enabling the chloride ions to exchange into the solution. The membranes were rinsed with a small amount DI water, removed from the flask and three drops of 0.25 M K2CrO4 indicator was added to the analyte solution. Finally, it was titrated against 0.01 M AgNO3 solution and the IEC was determined by eqn (4):| IEC = cAg+Vsolmd−1 | (4) |
Permselectivity measurement
Permselectivity values were obtained from chronopotentiometry measurements. The chloride form of a membrane sample was conditioned in 0.1 M NaCl solution for 24 hours prior to the experiment. The membrane was fixed in a plastic sandwich with a circular exposed area of around 0.28 cm2. Fig. 2 shows the system setup used for the chronopotentiometric measurements. Platinum mesh electrodes were used as working and counter electrodes, while silver/silver chloride electrodes were used as reference and sensing electrodes. Both compartments were filled up with 0.1 M NaCl (50 mL) and they were stirred throughout the experiment.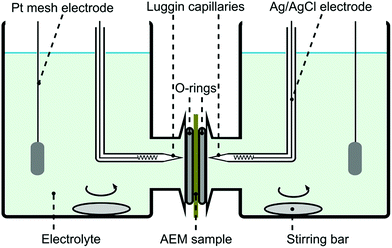 | ||
| Fig. 2 Four probe electrochemical system setup used for chronopotentiometry and electrochemical impedance spectroscopy. | ||
Chronopotentiometric curves were obtained using PGSTAT302N, a potentiostat/galvanostat (Metronohm Autolab, the Netherlands; Running Software: Nova1.11) in galvanostatic mode at 10 mA current. Transition time was obtained as the inflection point of the chronopotentiometry curve. Permselectivity values were obtained according to the modified Sand equation (eqn (5)):35
 | (5) |
![[thin space (1/6-em)]](https://www.rsc.org/images/entities/char_2009.gif) 485 A s mol−1), D is the diffusion coefficient (1.48 × 10⁻⁵ cm−2 s−1) and ti is the transport number (0.604) of the chloride ion in 0.1 NaCl, C is the concentration of the chloride ions (0.1 M in this case), I is the applied current (10 mA in this case), A is the exposed membrane area, and τ is the transition time.35 The final values were obtained as an average of three different membrane pieces.
485 A s mol−1), D is the diffusion coefficient (1.48 × 10⁻⁵ cm−2 s−1) and ti is the transport number (0.604) of the chloride ion in 0.1 NaCl, C is the concentration of the chloride ions (0.1 M in this case), I is the applied current (10 mA in this case), A is the exposed membrane area, and τ is the transition time.35 The final values were obtained as an average of three different membrane pieces.
Area resistance measurements
Membrane area resistance was measured by electrochemical impedance spectroscopy (EIS) using the cell shown in Fig. 2. The chloride form of a membrane sample was conditioned in 1 M NaCl solution for 24 hours prior to the experiment. EIS experiments were conducted with the PGSTAT302N, a potentiostat/galvanostat with FRA32M frequency response analyzer (Metronohm Autolab, the Netherlands; Running Software: Nova1.11) similarly to methods described in the literature.36,37 Both compartments were filled up with 1 M NaCl solution (50 mL) and no stirring was applied. A four-point system was applied to measure the impedance of the membranes, similar to the chronopotentiometry measurements. All the impedance measurements were performed with an AC signal of 0.1 mA amplitude in the frequency range of 1 mHz to 1 kHz. The resistance of the membrane immersed in solution (Rm+sol) was obtained as the impedance of the system where the imaginary part is close to 0 Ω. These resistance values were corrected by the resistance of the empty cell (Rsol) then multiplied by the membrane area (A) to obtain area resistance (RA) of different membranes as per eqn (6). The measurements were duplicated with different membrane pieces.| RA = (Rm+sol − Rsol)A | (6) |
The batch electrodialysis experiments were performed on a microBED complete electrodialysis system supplied by PCCell GmbH (Heusweiler, Germany). Refer to the ESI† for the detailed experimental description.
Results and discussion
GO modification
GO sheets were modified with 4-(trifluoromethylthio)phenyl groups to achieve better dispersibility in organic solvents. The sulfur labelling also enabled mapping the GO sheets inside the membranes. The modification was performed with TFMA using two different reaction mechanisms as shown in Scheme 1. TFMA is in situ converted into a diazonium compound which can react with the basal plane of the GO sheets resulting in mGO-1. Meanwhile TFMA reacts directly as a nucleophilic with the epoxide groups of GO to provide mGO-2.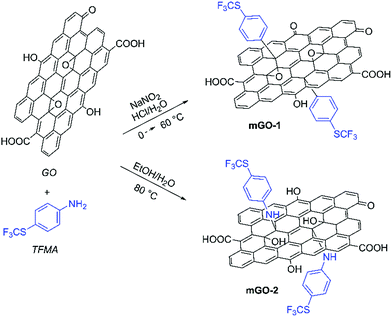 | ||
| Scheme 1 Modification of GO with TFMA via diazonium chemistry and epoxide ring opening reaction leading to mGO-1 and mGO-2. Refer to the ESI† for the detailed experimental protocols. | ||
FTIR analysis showed signs of successful modification in both samples mGO-1 and mGO-2 (Fig. 3). The new peaks around 1110 and 825 cm−1 in the spectra of mGO-1 and mGO-2 correspond to the C–F stretching vibrations and out-of-plane C–H bending modes, respectively, originating from TFMA. No other significant new peaks could be identified in the IR spectra.
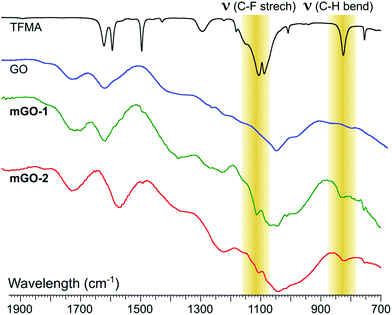 | ||
| Fig. 3 Comparison between the fingerprint regions in IR spectra of TFMA, unmodified GO, mGO-1 and mGO-2. The highlighted peaks confirm the successful modification of GO in both cases. | ||
Alongside FTIR, Raman spectroscopy was also used to characterise modified GO (Fig. S2†). In all GO samples, the characteristic peaks corresponding to the D band (∼1300 cm−1) and the G band (∼1600 cm−1) regions can be observed with little variation between samples. The sulphur content of the reactant (TFMA) also enabled the use of elemental analysis to get more information about the modification. The sulphur content of GO, m-GO1 and m-GO2 were found to be 0.87%, 2.23% and 1.31%, respectively. This indicates a higher modification in the case of m-GO1. The nitrogen content of mGO-1 and mGO-2 were 0.29% and 0.42%, respectively, which is in agreement with the expected reaction mechanisms.
Membrane fabrication
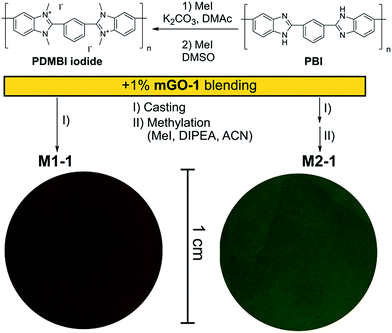
A homogeneous suspension of mGO-1 in DMAc was mixed with the DMAc solution of PDMBI iodide followed by film casting and drying. Visual inspection of the resulting M1-1 showed large (∼0.5 mm) aggregates of GO, while the translucent brown colour of the membrane resembled GO free polymer film (Fig. 4). Filler aggregation is usually disadvantageous for the membrane performance.38 The performance decline is caused by the poor interfacial adhesion between the aggregates and the membrane material, and the undesired variation of local properties along the membrane. In the case of M1-1 the aggregation was speculated to be caused by the instability of mGO-1 dispersion in the presence of PDMBI iodide. The mGO-1 sheets are decorated with carboxylic acid groups on the edges which provide them a slight negative surface charge. The positively charged PDMBI polymer chains are electrostatically attracted by the sheets, which results in the association of the sheets and the chains. Different parts of the long polymer chains can be associated with different sheets, forming bridges between them. This phenomenon could be responsible for the flocculation of mGO-1 from the casting solution.To avoid the flocculation of GO from the casting solution, membrane preparation was attempted from the uncharged PBI polymer (M2 series). In this case the mGO-1 suspension was successfully blended with the polymer solution without any aggregation. The formed membranes were grey in colour with decreasing transparency with increasing mGO-1 loading. Owing to the incompatibility of mGO-1 and PDMBI iodide in the casting solution, the M1 series was abandoned and only the membranes of the M2 series were further characterised.
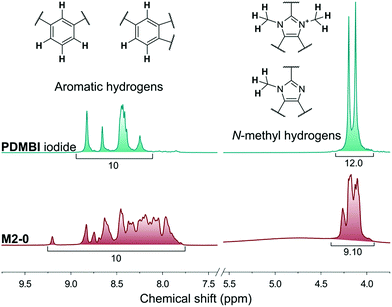
The membranes of the M2 series were post methylated with methyl iodide to provide them with anion exchange characteristics. The methylation was performed in acetonitrile, a polar-aprotic solvent which favours nucleophilic substitution but does not dissolve the membrane material (PBI). The methylation degree was studied by NMR in the case of M2-0 (Fig. 5). In contrast with the preparation of PDMBI iodide, the dimethylation degree of benzimidazole units was below 100%. The decreased methylation can be attributed to the heterogeneous reaction conditions. Dimethylation degree of 50–60% can be estimated from the relative integrals of methyl and aromatic protons. The other members of the series containing mGO-1 were insoluble in any common NMR solvent due to their increased stability. The increased solvent resistance of GO–PBI nanocomposite membranes has been recently reported in the literature.16
To obtain more information about the extent of post-casting methylation, the membranes were subjected to elemental analysis (Table 2). The iodine content of the membranes can be directly correlated with the IEC of the membranes. The iodine content of all membranes was found to be relatively high, between 31–35%, corresponding to theoretical IECs in the range of 2.45–2.72 mmol g−1. In line with expectations, M2-0 and M2-2.5 exhibited the highest and lowest values, respectively, as the carboxylate groups of mGO-1 can act as counter-ions resulting in lower iodide ion content.
| Elemental composition (%) | Theoretical IEC (mmol g−1) | ||||
|---|---|---|---|---|---|
| C | N | H | I | ||
| M2-0 | 44.56 | 3.93 | 9.86 | 34.52 | 2.72 |
| M2-0.25 | 47.50 | 3.61 | 10.31 | 32.26 | 2.54 |
| M2-1 | 46.67 | 3.24 | 10.25 | 32.99 | 2.60 |
| M2-2.5 | 47.67 | 3.74 | 10.29 | 31.14 | 2.45 |
The intense fluorescence of the polymer material prevented the Raman spectroscopic analysis of the nanocomposite membranes. XRD patterns of the M2 membranes are displayed in Fig. S1 in the ESI.† The distinct peak of pristine mGO-1 at around 11.2° is absent from the membrane diffraction patterns, which points to full exfoliation of the sheets within these membranes.39 The zeta potentials of the M2 membranes were measured at pH values from 4–11 to further characterise the prepared membranes (Fig. S5†). The results show positive surface charge for all membranes in the 4–9 pH range as a result of the quaternisation. However, M2-1 and M2-2.5 showed slightly negative surface charge at high pH of 7–9 which may be attributed to the presence of carboxylic groups on the membrane surface originating from mGO-1.
Membrane morphology
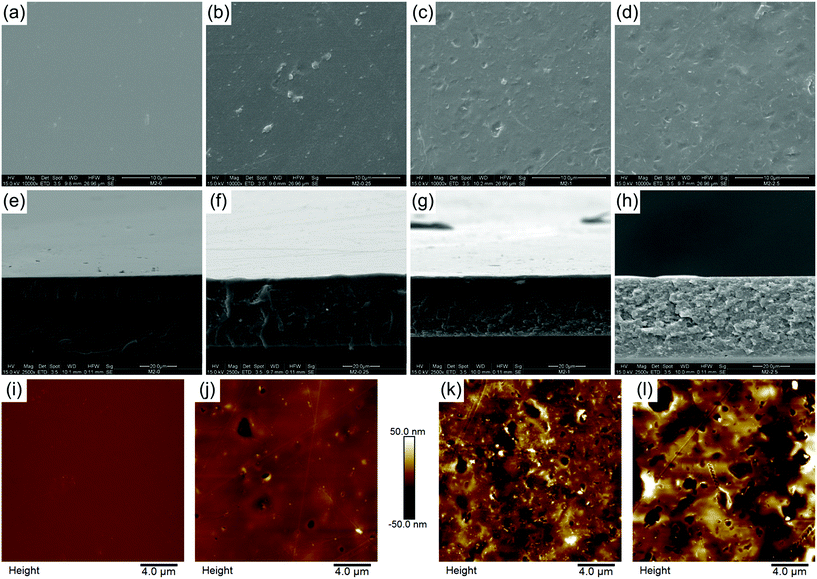
The effect of mGO-1 filler on membrane morphology was studied by SEM. Top surface SEM images show a gradual change in the morphology of the membranes as the loading of mGO-1 is increased (Fig. 6a–d). The surface of M2-0 is flat and uniform, whereas an increasing amount of mGO-1 produces pits and ridges on the surface. These features may be attributed to the different wettability of mGO-1 and PBI, which results in different solvent evaporation rates throughout the membrane surface during the film drying. The even distribution of these surface features point to a homogeneous distribution of GO. The good compatibility of mGO-1 particles and PBI results in good polymer coverage of the mGO-1 sheets, therefore the nanoparticles are indistinguishable on the surface.40 Well wrapped GO particles are usually an indication of greater interfacial bonding.None of the membranes were observed to have a porous structure in cross-sectional SEM images as a result of the dry phase inversion (Fig. 6e–h). All membranes were dense; however the introduction of mGO-1 altered the cross-section morphology. The cross-sectional surface becomes more flaky and grainy with the increasing amount of filler. The dry thickness of the membranes ranges from 33 to 44 μm (Table 3), which is less than the commercial Fumasep® (47–53 μm; FumaTech GmbH) or Neosepta® (110–220 μm; ASTOM) AEMs. This is attractive from an economic point of view because less material is needed to produce the same membrane area.
| Thickness (μm) | R a (nm) | Water contact angle (°) | WU (%) | SR (%) | |
|---|---|---|---|---|---|
| M2-0 | 40.6 ± 0.6 | 0.48 ± 0.14 | 57.8 ± 2.5 | 9.36 ± 1.44 | 4.35 ± 0.70 |
| M2-0.25 | 37.0 ± 1.2 | 3.25 ± 0.53 | 58.3 ± 0.6 | 10.49 ± 1.69 | 4.81 ± 0.35 |
| M2-1 | 32.9 ± 0.4 | 12.88 ± 1.59 | 59.7 ± 1.1 | 9.60 ± 1.62 | 5.95 ± 0.59 |
| M2-2.5 | 43.9 ± 1.4 | 19.24 ± 1. 53 | 61.1 ± 0.5 | 9.09 ± 1.50 | 4.72 ± 0.61 |
The AFM results also showed an increased number of surface features with increasing mGO-1 loading, in agreement with the SEM observations (Fig. 6i–l). The arithmetical average roughness (Ra) rose significantly and monotonously with the filler content (Table 3).
The sulphur content of mGO-1 provided the opportunity to obtain sulphur maps of the nanocomposite membranes. Since the polymer does not contain any sulphur, its distribution can be directly correlated to the dispersion of mGO-1 in the membrane. EDS and WDS maps were recorded to study the small scale distribution of mGO-1 (Fig. 7). According to our expectation, the sulphur level in M2-0.25 is low. The maps do not show any significant hot spots with high sulphur level. M2-1, on the other hand, exhibits a few hot spots in the sulphur maps. The dimensions of these spots are smaller than 2 μm, which is in the range of the lateral size of the commercial GO sheets. Therefore, it can be concluded that even if there are aggregates, they consist of only a few layers of mGO-1 sheets. M2-2.5 exhibits higher sulphur levels in line with expectations. The maps contain some spots with lower and higher sulphur intensity, but no large (≥10 μm) aggregates with elevated sulphur levels can be observed. The EDS and WDS maps support the relatively even filler distribution and good filler-polymer compatibility.
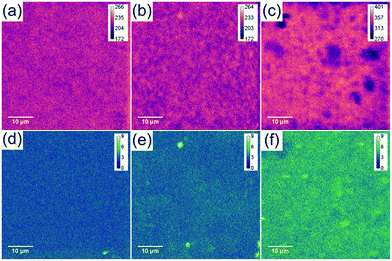 | ||
| Fig. 7 Sulphur EDS (a–c) and WDS (d–f) maps of M2-0.25 (a and d), M2-1 (b and e) and M2-2.5 (c and f) showing a different distribution profiles with increasing mGO-1 loading. | ||
Stability and wettability
Thermogravimetric analysis (TGA) revealed that all membranes have good stability and similar thermogravimetric curves regardless of filler content (Fig. S4†). After an initial loss of adsorbed water, the membranes are stable up to 200–250 °C. Even at 400 °C, the membranes retain 86–89% of their original weight. At higher temperatures, the samples decompose rapidly resulting in residual weights of 23–47% at 750 °C. M2-0 retains a higher proportion of its original weight than membranes with higher mGO-1 loading. In line with previous observations,41 this suggests that GO catalyses the polymer decomposition at high temperatures.The membranes underwent nanoindentation and tensile testing to assess their mechanical properties (Fig. 8). M2-0 exhibited high Young's modulus around 1.1 GPa and 4.0 GPa in tensile testing and nanoindentation, respectively. The Young's modulus of M2-0.25 was even slightly higher in both tests, but the difference is within the range of the error of the experiments. Higher mGO-1 loadings resulted in a small decline in mechanical properties, which can be attributed to the increasing filler-polymer interfacial area. Both the ultimate tensile strength and the strain at maximum stress decreased with increasing mGO-1 loading, which indicates less elastic membranes but higher dimensional stability. The indentation hardness of the membranes appears to be independent of mGO-1 content, with values around 0.26 GPa.
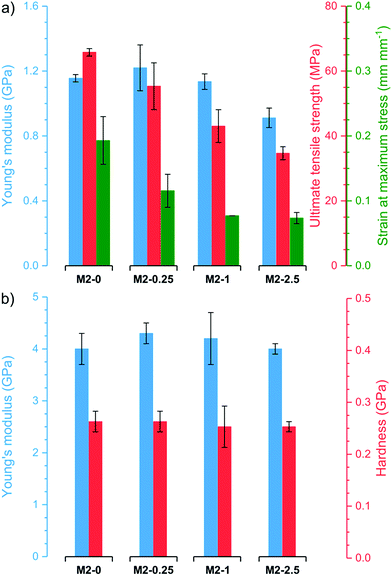 | ||
| Fig. 8 Mechanical properties of the M2 membranes obtained by (a) tensile testing and (b) nanoindentation. | ||
The wettability parameters such as water contact angle, water uptake and swelling ratio (Table 3) provide important information about the stability and fouling of the membrane in an aqueous environment. It has been reported that membrane fouling increases with water contact angle.42 All membranes of M2 series exhibited a low contact angle around 60° which implies hydrophilic properties. A slight increase can be observed with the addition of GO filler, in agreement with the literature.22 Hydration of the membranes is usually beneficial for the ionic conductivity. However, excessive swelling of the membrane would compromise its mechanical and electrochemical properties.21 The WU and SR values were around 10% and 5%, respectively, with little variation between membranes with different loadings. The hydrophilicity of the membranes, suggested by the water contact angle together with their limited WU and SR, implies good fouling resistance and hydration properties, which make them good candidates for electrodialysis.
Electrochemical performance
The electrochemical performance of the membranes is of particular interest as it significantly affects the process efficiency. IEC, permselectivity and through-plane area resistance of the membranes were determined (Fig. 9). The IEC of the membranes M2-0, M2-0.25 and M2-2.5 were around 2 mmol g−1. These values are relatively high compared to commercial AEMs, which usually have IEC in the range of 1.0–1.7 mmol g−1.12 It is noteworthy that M2-1 had substantially lower IEC than the other three, with a value around 1.7 mmol g−1. The obtained IEC values for the membranes are lower than the theoretical IEC values from elemental analysis. This can be attributed to anions which are trapped in the membrane matrix and do not take part in ion exchange.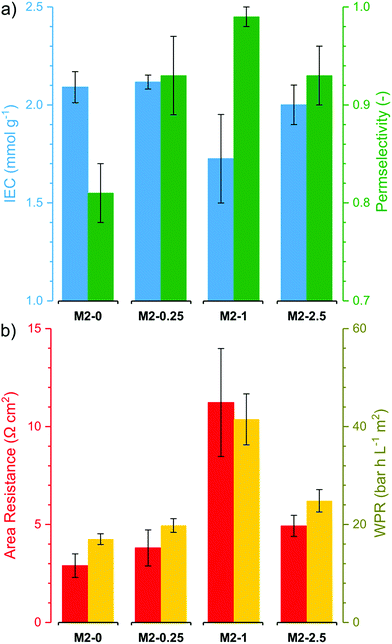 | ||
| Fig. 9 (a) Electrochemical properties (ion exchange capacity and perm selectivity) and (b) resistive properties (Area Resistance and Water Permeation Resistance) of the M2 membranes. | ||
The counter-ion selectivity of a membrane can be quantitatively expressed in terms of permselectivity, which takes values between 0 and 1. A membrane with a permselectivity of 0 shows no ion selectivity compared to the solution phase, while an ideal IEM has a permselectivity of 1, meaning that the co-ion flux through the membrane is 0. The permselectivity of M2-0 was low (0.81) but a considerable increase was observed with as low as 0.25% mGO-1 loading (M2-0.25). An unprecedentedly high value of 0.99 was obtained with M2-1. A further rise to 2.5% loading resulted in a slight permselectivity decline to 0.93. The area resistance of the M2 series also increased with the mGO-1 loading, peaking at 1%. However, the area resistance of M2-2.5 was substantially lower than M2-1. The results of the electrochemical tests show that the presence of a small amount of mGO-1 filler (M2-0.25) has a positive effect on the permselectivity but also slightly increases the area resistance compared to M2-0. The mGO-1 sheets present obstacles to ionic flux, which results in higher area resistance, but also block non-selective pathways, thus improving permselectivity. This effect is most pronounced in the case of M2-1, which shows the highest area resistance coupled with a permselectivity close to the ideal. Even higher mGO-1 loadings (M2-2.5) can result in interfacial channels between filler and polymer that lead across the whole membrane. These interfaces open up non-specific ion permeation routes which result in lower area resistance but also decreased permselectivity. The proposed mechanism for the observed effect of filler loading on ion transport is illustrated in Fig. 10. This effect was further studied with water permeation tests (Fig. 9b). As with the ionic flux, the mGO-1 sheets are also expected to pose an obstacle to the water flux through the membrane. In line with these expectations, a similar trend to the area resistance can be observed for the water permeation resistance (WPR), peaking at 1% loading. Water flux from osmotic and electro-osmotic effects during electrodialysis compromises the process efficiency.43 Therefore, a high WPR is of interest in IEM development.
The membranes were tested in the electrodialysis of 0.1 M NaCl solution (5.84 ppt; brackish water) to investigate their performance in application conditions (Fig. 11). In the early stage of the electrodialysis the salt concentration linearly decreased in the diluate compartment for each membrane. As the salt concentration and therefore the conductivity of the diluate decreased the concentration curves started to flatten. At the end of the electrodialysis the normalised NaCl concentrations were between 0.21 and 0.07. The highest remaining salt concentration was measured in the case of M2-0, which can be attributed to its low permselectivity. In contrast, M2-1, which had the highest permselectivity, showed the best performance in the electrodialysis, with the lowest dilute salt concentration and virtually complete current efficiency. The high area resistance of the M2-1 membrane did not compromise the power consumption because the overall resistance of the electrodialysis stack was almost completely determined by the resistance of the solutions.
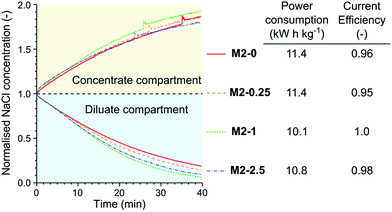 | ||
| Fig. 11 The concentration curves, power consumption of NaCl removal and current efficiency in the electrodialysis of 0.1 M NaCl solution with different M2 membranes. | ||
To place the performance of these membranes in a larger perspective, their electrochemical properties were compared to commercial and recently published AEMs. A plot, similar to the Robeson plot used for gas separation membranes,44 is shown in Fig. 12. The place of every membrane is determined by its permselectivity and area resistance, since they are the most important and most commonly reported descriptors of AEM performance in the field of electromembrane processes. Nevertheless, the reciprocal of area resistance, which is a permeability-like parameter, is plotted on the horizontal axis. This arrangement allows the plot to have certain analogies with the Robeson plot, namely that the upper bound has negative slope and that the direction of development points in the positive direction on both axes.
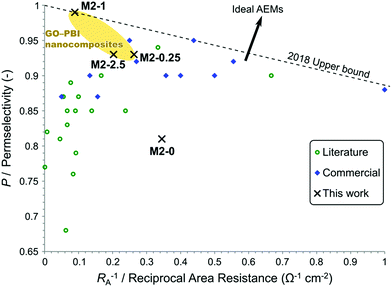 | ||
| Fig. 12 Trade-off between a high permselectivity and low area resistance illustrated in a plot showing commercial and published AEMs for electromembrane processes. Refer to the ESI† for the detailed data and references. | ||
Commercial AEMs for electrodialysis typically have good permselectivity in the range of 0.9–0.95 and relatively low area resistance around 5–2 Ω cm2. Except for a few examples, the AEMs reported in the literature in the past few years in the field of electrodialysis have failed to match or overcome the commercial membranes in these performance parameters. At low area resistance (RA−1 > 0.25 Ω−1 cm−2) a trade-off can be observed between high permselectivity and low area resistance. Geise et al.45 reported a similar trade-off, which was rationalised by the water volume fraction in their work. Interestingly, membranes with higher area resistance (RA−1 < 0.25 Ω−1 cm−2) only exhibit medium or low permselectivity. This observation can be explained by the low ion exchange capacity of these membranes. These high area resistance membranes usually contain fewer and smaller ionic regions, which are mainly responsible for the conductivity but also for the selectivity through Donnan exclusion. The membranes of the M2 series show a steep trade-off between permselectivity and reciprocal area resistance. Compared to other membranes, M2-0 had a good area resistance but poor permselectivity. M2-0.25 and M2-2.5 performed similarly or better to other commercial and experimental AEMs regarding permselectivity. On the other hand, their area resistances were somewhat higher than commercial AEMs. M2-1 can be found in a previously uninhabited region of this plot. It had an exceptionally high permselectivity at the expense of an area resistance which is higher than the majority of the commercial membranes. This unique behaviour of M2-1 and the steep trade-off in the M2 series, which cannot be observed for the whole of the AEM field, can be attributed to filler effects. The uniformly high IEC of M2 membranes show that the higher area resistance originates from the barrier properties of mGO-1 rather than from the absence of ionic regions. The barrier properties of the filler therefore do not compromise the Donnan exclusion, on the contrary even higher permselectivity can be achieved.
The plot can be used to establish an empirical upper bound as a reference for future developments. The vertical axis intercept of this line should be at 1 as the permselectivity cannot be higher. The slope of this upper bound is defined so that two AEMs, M2-1 and a commercial Fumasep® membrane are on the line and no commercial AEM or AEM reported in the literature for electromembrane processes falls above this upper bound. The upper bound can be described by eqn (7).
| P = 1 − 0.1145 Ω cm2 × RA−1 | (7) |
Conclusions
Mechanically robust and highly permselective GO–polybenzimidazolium nanocomposite AEMs were developed for electromembrane processes. GO was modified with 4-(trifluoromethylthio)phenyl groups via diazonium chemistry to provide labelling for later mapping techniques and to enhance dispersibility in organic solvents. The uncharged PBI polymer showed good compatibility with the GO filler and it was transformed to an AEM by a post-casting modification method. A series of nanocomposite AEMs with low GO loadings in the range of 0.25–2.5% were prepared and characterised in terms of morphology, stability and electrochemical properties. SEM, AFM, XRD and EPMA analysis confirmed that the filler was well distributed inside the polymeric matrix. The AEMs had high Young's moduli confirmed by tensile testing (up to 1.2 GPa) and nanoindentation (up to 4.3 GPa), high IEC (1.7–2.1 mmol g−1) and low area resistance (down to 2.9 Ω cm2).It was shown that a small amount of GO filler is beneficial for key properties such as mechanical strength and permselectivity. As little as 1% GO incorporation into the membrane resulted in unprecedented permselectivity of 0.99. However, filler overloading can result in less durable membranes with high area resistance. In brackish water electrodialysis, the best salt removal, lowest power consumption and best current efficiency were achieved with the membrane having 1% GO loading (M2-1). The membranes from this work were compared to commercial and recently published AEMs in a permselectivity – reciprocal area resistance plot. An empirical upper bound is proposed as a reference for future developments. The results of this work show that fine-tuning of membrane properties can be achieved with low GO filler content. The development of high performance nanocomposite ion exchange membranes will lead to more efficient electromembrane processes in various fields including desalination and water treatment.
Conflicts of interest
There are no conflicts to declare.Acknowledgements
The authors would like to express their gratitude to Dr Patrick Altmaier (PCCell GmbH, Germany) for the electrodialysis measurements, to Ms Hai Anh Le Phuong (School of Materials, The University of Manchester) for AFM measurements, to Mr Pawin Iamprasertkun and Mr Wisit Hirunpinyopas for their help with electrochemical measurements, and to Dr Jonathan Fellowes (School of Earth & Environmental Sciences, The University of Manchester) for the EPMA measurements. The authors acknowledge the support from Masdar Institute–Khalifa University of Science and Technology and The University of Manchester through the seed fund of the Graphene Engineering and Innovation Center (SMG2016-000001).References
- T. Xu and C. Huang, AIChE J., 2008, 54, 3147 CrossRef CAS.
- O. Arar, U. Yuksel, N. Kabay and M. Yuksel, Desalination, 2014, 342, 16 CrossRef CAS.
- F. A. AlMarzooqi, A. A. Al Ghaferi, I. Saadat and N. Hilal, Desalination, 2014, 342, 3 CrossRef CAS.
- M. Sadrzadeh and T. Mohammadi, Desalination, 2008, 221, 440 CrossRef CAS.
- A. J. Ward, K. Arola, E. T. Brewster, C. M. Mehta and D. J. Batstone, Water Res., 2018, 135, 57 CrossRef CAS PubMed.
- M. Turek, Desalination, 2003, 153, 377 CrossRef CAS.
- T. V. Eliseeva, V. A. Shaposhnik, E. V. Krisilova and A. E. Bukhovets, Desalination, 2009, 241, 86 CrossRef CAS.
- J. Hestekin, T. Ho and T. Potts in Membrane Technology, ed. K. Peinemann, S. Pereira Nunes and L. Giorno, Wiley-VCH, Germany, 2010, vol. 3, ch. 4 Search PubMed.
- M. A. Hickner, Mater. Today, 2010, 13, 34 CrossRef CAS.
- T. Xu, J. Membr. Sci., 2005, 263, 1 CrossRef CAS.
- R. K. Nagarale, G. S. Gohil and V. K. Shahi, Adv. Colloid Interface Sci., 2006, 119, 97 CrossRef CAS PubMed.
- J. Ran, L. Wu, Y. He, Z. Yang, Y. Wang, C. Jiang, L. Ge, E. Bakangura and T. Xu, J. Membr. Sci., 2017, 522, 267 CrossRef CAS.
- K. F. L. Hagesteijn, S. Jiang and B. P. Ladewig, J. Mater. Sci., 2018, 53, 11131 CrossRef CAS.
- A. Alabi, A. AlHajaj, L. Cseri, G. Szekely, P. Budd and L. Zou, npj Clean Water, 2018, 1, 10 CrossRef.
- H. M. Hegab and L. Zou, J. Membr. Sci., 2015, 484, 95 CrossRef CAS.
- F. Fei, L. Cseri, G. Szekely and C. F. Blanford, ACS Appl. Mater. Interfaces, 2018, 10, 16140 CrossRef CAS PubMed.
- K. Huang, G. Liu, Y. Lou, Z. Dong, J. Shen and W. Jin, Angew. Chem., Int. Ed., 2014, 53, 6929 CrossRef CAS PubMed.
- S. Leaper, A. Abdel-Karim, B. Faki, J. M. Luque-Alled, M. Alberto, A. Vijayaraghavan, S. M. Holmes, G. Szekely, M. I. Badawy, N. Shokri and P. Gorgojo, J. Membr. Sci., 2018, 552, 309 CrossRef.
- H. W. Kim, H. W. Yoon, S.-M. Yoon, B. M. Yoo, B. K. Ahn, Y. H. Cho, H. J. Shin, H. Yang, U. Paik, S. Kwon, J.-Y. Choi and H. B. Park, Science, 2013, 342, 91 CrossRef CAS PubMed.
- S. E. Lowe and Y. L. Zhong, in Graphene Oxide, ed. A. M. Dimiev and S. Eigler, John Wiley and Sons, US, 2016, ch. 13 Search PubMed.
- S. Zhang, X. Zhu, C. Jin and Z. Zhang, Solid State Ionics, 2018, 320, 360 CrossRef CAS.
- J. Liu, J. Dai, K. Zhang, L. Ma, N. A. Qaisrani, F. Zhang and G. He, Ionics, 2017, 23, 3085 CrossRef.
- C. Wang, B. Lin, G. Qiao, L. Wang, L. Zhu, F. Chu, T. Feng, N. Yuan and J. Ding, Mater. Lett., 2016, 173, 219 CrossRef CAS.
- P. P. Sharma, S. Gahlot, B. M. Bhil, H. Gupta and V. Kulshresth, RSC Adv., 2015, 5, 38712 RSC.
- V. Yadav, P. P. Sharma and V. Kulshrestha, Int. J. Hydrogen Energy, 2017, 42, 26511 CrossRef CAS.
- B. Hu, L. Miao, Y. Zhao and C. Lu, J. Membr. Sci., 2017, 530, 84 CrossRef CAS.
- T.-S. Chung, J. Macromol. Sci., Polym. Rev., 1997, 37, 277 Search PubMed.
- H.-J. Lee, J. Choi, J. Y. Han, H.-J. Kim, Y.-E. Sung, H. Kim, D. Henkensmeier, E. A. Cho, J. H. Jang and S. J. Yoo, Polym. Bull., 2013, 70, 2619 CrossRef CAS.
- D. Henkensmeier, H.-J. Kim, H.-J. Lee, D. H. Lee, I.-H. Oh, S.-A. Hong, S.-W. Nam and T.-H. Lim, Macromol. Mater. Eng., 2011, 296, 899 CrossRef CAS.
- T. Weissbach, A. G. Wright, T. J. Peckham, A. S. Alavijeh, V. Pan, E. Kjeang and S. Holdcroft, Chem. Mater., 2016, 28, 8060 CrossRef CAS.
- O. D. Thomas, K. J. W. Y. Soo, T. J. Peckham, M. P. Kulkarni and S. Holdcroft, J. Am. Chem. Soc., 2012, 134, 10753 CrossRef CAS PubMed.
- D. Henkensmeier, H.-R. Cho, H.-J. Kim, C. N. Kirchner, J. Leppin, A. Dyck, J. H. Jang, E. A. Cho, S.-W. Nam and T.-H. Lim, Polym. Degrad. Stab., 2012, 97, 264 CrossRef CAS.
- X. Li and B. Bhushan, Mater. Charact., 2002, 48, 11 CrossRef CAS.
- K. H. Lee, D. H. Cho, Y. M. Kim, S. J. Moon, J. G. Seong, D. W. Shin, J.-Y. Sohn, J. F. Kim and Y. M. Lee, Energy Environ. Sci., 2017, 10, 275 RSC.
- N. Pismenskaia, P. Sistat, P. Huguet, V. Nikonenko and G. Pourcelly, J. Membr. Sci., 2004, 228, 65 CrossRef CAS.
- J.-S. Park, J.-H. Choi, J.-J. Woo and S.-H. Moon, J. Colloid Interface Sci., 2006, 300, 655 CrossRef CAS PubMed.
- S. Abdu, M.-C. Marti-Calatayud, J. E. Wong, M. Garcia-Gabaldon and M. Wessling, ACS Appl. Mater. Interfaces, 2014, 6, 1843 CrossRef CAS PubMed.
- A. Ammar, A. M. Al-Enizi, M. A. AlMaadeed and A. Karim, Arabian J. Chem., 2016, 9, 274 CrossRef CAS.
- L. Badrinezhad, S. Ghasemi, Y. Azizian-Kalandaragh and A. Nematollahzadeh, Polym. Bull., 2017, 75, 469 CrossRef.
- J. Ma, Y. Li, X. Yin, Y. Xu, J. Yue, J. Bao and T. Zhou, RSC Adv., 2016, 6, 49448 RSC.
- D. R. Dreyer, H. P. Jia and C. W. Bielawski, Angew. Chem., Int. Ed., 2010, 49, 6813 CAS.
- J. Chen, L. Shen, M. Zhang, H. Hong, Y. He, B.-Q. Liao and H. Lin, Bioresour. Technol., 2016, 201, 245 CrossRef CAS PubMed.
- T. Rottiers, K. Ghyselbrecht, B. Meesschaert, B. Van der Bruggen and L. Pinoy, Chem. Eng. Sci., 2014, 113, 95 CrossRef CAS.
- L. M. Robeson, J. Membr. Sci., 2008, 320, 390 CrossRef CAS.
- G. M. Geise, M. A. Hickner and B. E. Logan, ACS Appl. Mater. Interfaces, 2013, 5, 10294 CrossRef CAS PubMed.
Footnote |
| † Electronic supplementary information (ESI) available. See DOI: 10.1039/c8ta09160a |
| This journal is © The Royal Society of Chemistry 2018 |

